The Hidden Cost of Financial Reform and Regulations on Banks and Their Clients The UNC Treasury...
70
The Hidden Cost of Financial Reform and Regulations on Banks and Their Clients The UNC Treasury Management Series October 1, 2012 Jeff Avers Group Vice President Treasury & Payment Solutions Liquidity Strategy & Consulting
-
Upload
sydney-scott -
Category
Documents
-
view
215 -
download
1
Transcript of The Hidden Cost of Financial Reform and Regulations on Banks and Their Clients The UNC Treasury...

The Hidden Cost of Financial Reform and Regulations on Banks and Their Clients
The UNC Treasury Management Series
October 1, 2012
Jeff Avers
Group Vice President
Treasury & Payment Solutions
Liquidity Strategy & Consulting

2
Financial Regulation and Your Business
Regulatory and Economic Environment
Corporate Governance
Working Capital Management
International
The Perfect Storm
Impact of Regulations
Reference Materials
Closing Remarks

3
Three Key Points for Today’s Financial Reform Discussion:
Financial Reform is complicated, widespread and painful
It will have a financial impact on both banks and their clients
It will have (and already has had) an impact on corporate and institutional liquidity management and payment practices

4
Regulatory Environment

5
Regulatory Environment
6
New regulatory entities created by Dodd-Frank
1. Consumer Financial Protection Bureau
2. Financial Stability Oversight Council
3. Office of Financial Research
4. Federal Insurance Office
5. Investor Advisory Committee
6. Office of Housing Counseling
7. Office of Minority and Women Inclusion
8. Office of Investor Advocate
9. Office of Credit Ratings
10.Office of Municipal Securities
11. Office of Whistleblower Protection
Entities eliminated by Dodd-Frank
1. Office of Thrift Supervision
Regulatory Environment

7
Regulatory Environment

8
Regulatory Environment
9
Regulatory Impact – A Sampling
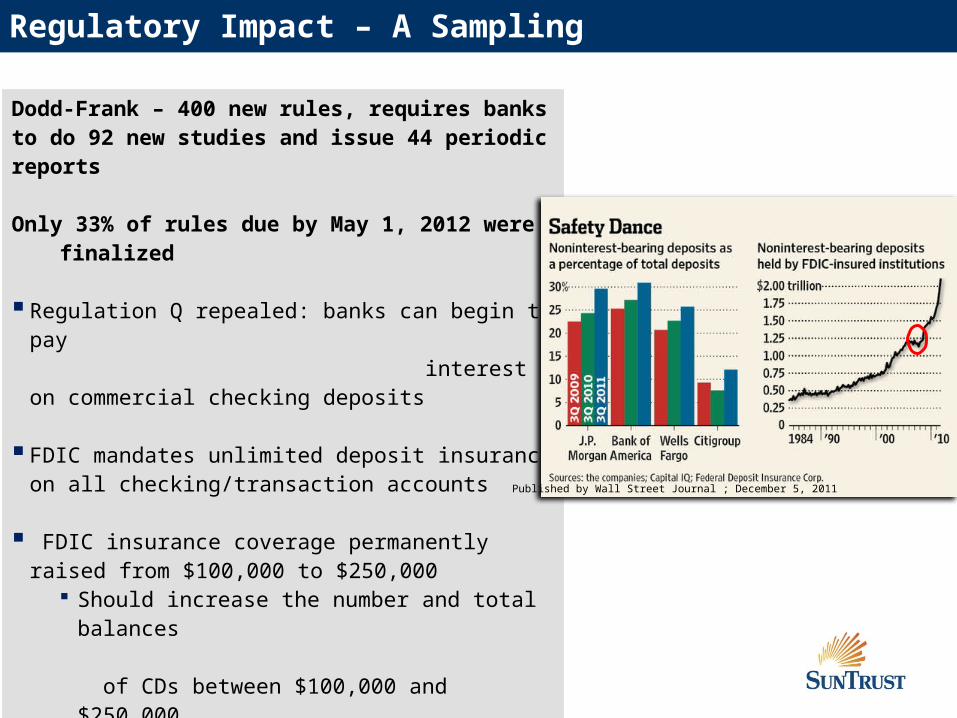
Dodd-Frank – 400 new rules, requires banks to do 92 new studies and issue 44 periodic reports
Only 33% of rules due by May 1, 2012 were finalized
Regulation Q repealed: banks can begin to pay interest on commercial checking deposits
FDIC mandates unlimited deposit insurance on all checking/transaction accounts
FDIC insurance coverage permanently raised from
$100,000 to $250,000 Should increase the number and total balances
of CDs between $100,000 and $250,000
FDIC deposit assessment changed from being based on quarterly ledger deposits to being based on consolidated assets minus average tangible equity
Published by Wall Street Journal ; December 5, 2011
10
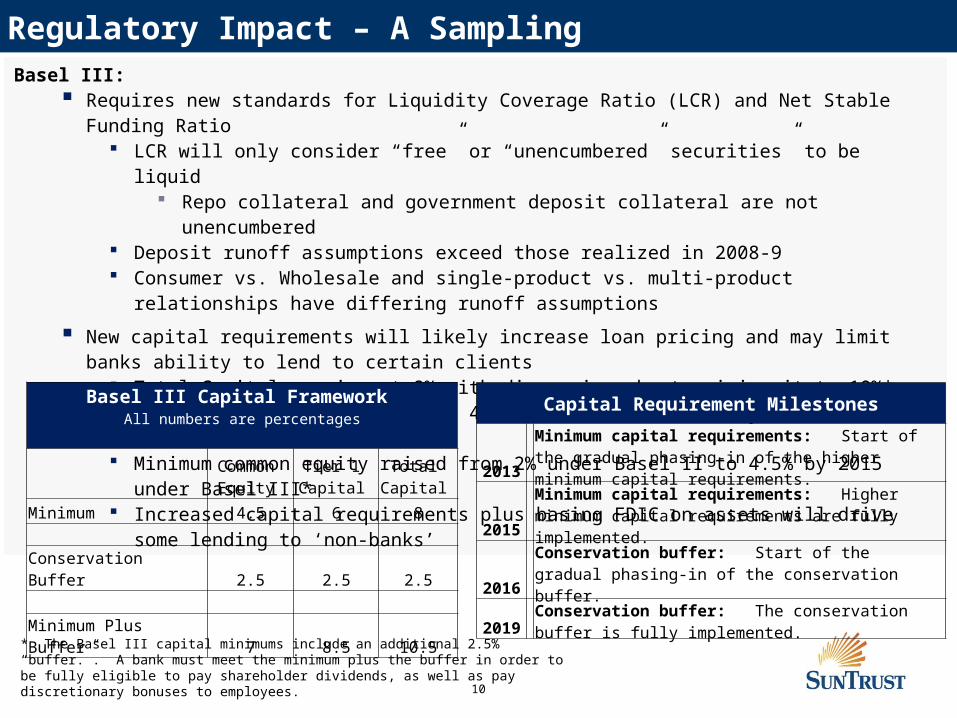
Regulatory Impact – A SamplingBasel III:
Requires new standards for Liquidity Coverage Ratio (LCR) and Net Stable Funding Ratio LCR will only consider “free” or “unencumbered” securities” to be liquid
Repo collateral and government deposit collateral are not unencumbered Deposit runoff assumptions exceed those realized in 2008-9 Consumer vs. Wholesale and single-product vs. multi-product relationships have differing runoff
assumptions
New capital requirements will likely increase loan pricing and may limit banks ability to lend to certain clients
Total Capital remains at 8% with discussion about raising it to 10%* Tier 1 Capital is raised from 4% under Basel II to 6% by 2015 under Basel III* Minimum common equity raised from 2% under Basel II to 4.5% by 2015 under Basel III* Increased capital requirements plus basing FDIC on assets will drive some lending to ‘non-
banks’
Basel III Capital Framework All numbers are percentages
Common
Equity Tier 1
Capital Total
Capital
Minimum 4.5 6 8
Conservation Buffer 2.5 2.5 2.5
Minimum Plus Buffer 7 8.5 10.5
* The Basel III capital minimums include an additional 2.5% “buffer.”. A bank must meet the minimum plus the buffer in order to be fully eligible to pay shareholder dividends, as well as pay discretionary bonuses to employees.
Capital Requirement Milestones
2013 Minimum capital requirements: Start of the gradual phasing-in of the higher minimum capital requirements.
2015 Minimum capital requirements: Higher minimum capital requirements are fully implemented.
2016 Conservation buffer: Start of the gradual phasing-in of the conservation buffer.
2019 Conservation buffer: The conservation buffer is fully implemented.

11
Impact of Money Fund Reform
Regulatory Changes Impact
2010 Changes
Maximum allowable weighted average maturity (WAM) was shortened from 90 days to 60 days
The overall credit quality of portfolios was improved, and A twofold liquidity requirement was added… with 30% of
assets maturing within a week and 10% required to mature overnight
Lessened investor risk, while also lowering the relative yield on a permanent basis
SEC Currently Proposed Changes
Maintain a capital buffer in order to serve as the first point of loss absorption to the extent required
Convert from $1.00 NAV to a Variable NAV, and Restrict redemptions so that up to 10% of a redemption is
held back for up to 30-days
SEC Recent Compromise Proposal
Rather than implement all proposed changes, each 2a-7 money fund must either:
Convert from $1.00 NAV to variable NAV, or Maintain $1.00 NAV and implement the capital buffer and
restrictions on redemptions described above
Likely Net Overall Effect Lessens investor risk Lowers the relative yield Reduces investor appetite leading to:
Decreased MMF investment assets Increased bank deposits Funding concerns for FI and Corporate issuers
SEC Money Market Fund Rule 2a-7 was changed in 2010 to reduce shareholder/investor investment risk

12
Financial Impact – A Sampling
Higher interest expense on deposits Reduced Revenue Streams Volcker Rule Potential divestitures
Reduced Fee Income NSF/Overdrafts (Regulation E) Debit Interchange (Durbin
Amendment)
Revamped marketing collateral
Increased Fees Uncollateralized daylight overdrafts FDIC
Client communication costs
Development costs for new products Employee training
Reduced value of deposits (“FTP”) Increased cost of compliance & oversight Human, Systems, tracking and reporting
Increased emphasis on eliminating marginally profitable and unprofitable relationships
Increased Bank Expenses Increased Customer Expenses
Discontinuation of “Free Checking”

13 13
Market Rates for Cash Investment Instruments
Alternative Cash Investment Options
• Rates obtained from (1) WSJ Money Rates, (2) Crane Data (money funds) and (3) State-specific LGIPs
SunTrust Sweep Yields
As of August 31, 2012
Master Note 35/20 bps
Repo 3 bps
Eurodollar 10 bps
Federated Prime Fund 4 bps
Federated Treasury
Fund
1 bps
Overall market rates have been cyclical over the last 2 years
Most money market instruments are currently in the top half of their 52 week High-Low range
While overnight rates are similar to those in the summer of 2010, with the exception of Libor, 30-day and 90-day rates bare more similarity to the summer of 2011
The “Greek situation” has caused a flight to safety, suppressing the yield on US Treasuries
Money Market Mutual Fund yields continue to be anemic
Short-term Investment Instrument Rate as of 7/19/2010*
Rate as of 7/13/2011*
Rates as of 9/14/2012*
52-Week*
Overnight Instruments Low High
Fed Funds 20 bps 6 bps 19 bps 6 bps 19 bps
Repo 25 bps 2 bps 33 bps 3 bps 33 bps
SunTrust ECR (Analyzed Business Checking) Ask Your SunTrust Treasury Management Representative
SunTrust ECR/Rate Paid (Analyzed Interest Checking) Ask Your SunTrust Treasury Management Representative
30-Day Instruments 9/14/2012* Low High
Treasuries 15 bps 2 bps 9 bps 0 bps 11 bps
Commercial Paper 29 bps 12 bps 7 bps 3 bps 13 bps
Eurodollars 25 bps 12 bps 12 bps 12 bps 23 bps
Libor 33.8 bps 18.7 bps 22 bps 20.5 bps 29.6 bps
SunTrust Money Market Account Rate Ask Your SunTrust Treasury Management Representative
90-Day Instruments 7/19/2010 7/13/2011 9/14/2012* Low High
Treasuries 15 bps 3 bps 10 bps 0.5 bps 11.5 bps
Commercial Paper 42 bps 15 bps 16 bps 12 bps 20 bps
Libor 51.25 bps 24.9 bps 38.5 bps 26.8 bps 58.25 bp
Eurodollars 45 bps 15 bps 20 bps 20 bps 28 bps
AAA-Rated Taxable Money Funds: 7-day Yield as of 6/30/2010 6/30/2011 8/31/2012 Low High
Crane Treasury Institutional MF Index 1 bps 1 bps 1 bps 1 bps 1 bps
Crane AAA Prime Institutional MF Index 12 bps 4 bps 8 bps 7 bps 10 bps
Local Government Investment Pools: Monthly Yield as of:
July 2010 June 2011 Aug 2012 Low High
Georgia Fund 1 LGIP (Monthly yield) 21 bps 13 bps 15 bps 9 bps 15 bps
Florida Prime LGIP (Monthly yield) 39 bps 23 bps 30 bps 21 bps 33 bps
14
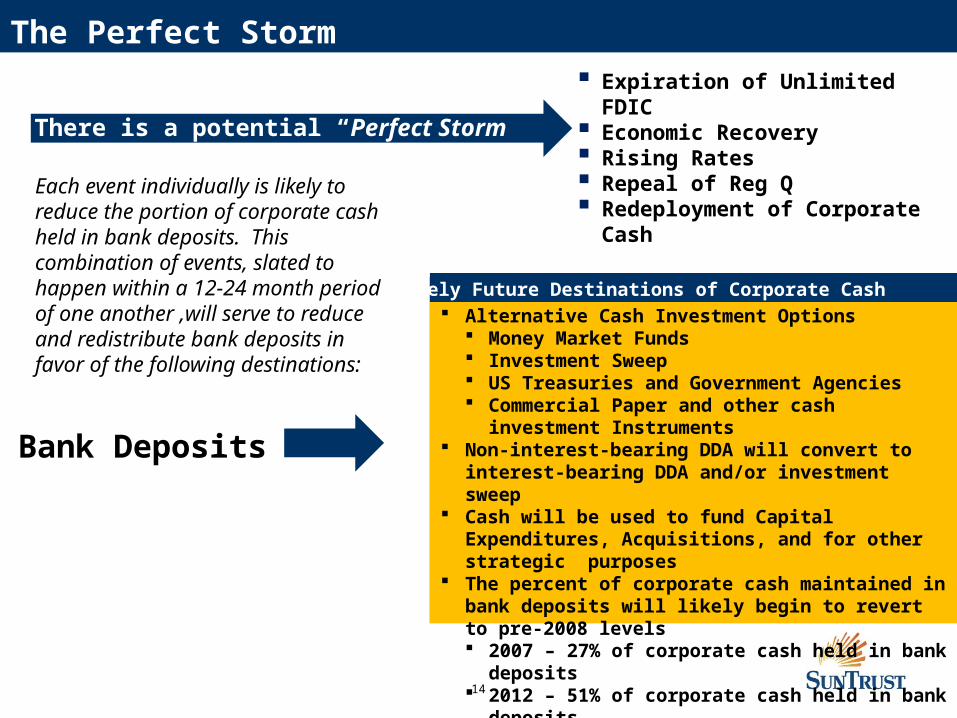
The Perfect Storm Expiration of Unlimited FDIC Economic Recovery Rising Rates Repeal of Reg Q Redeployment of Corporate Cash
There is a potential “Perfect Storm” brewing
Each event individually is likely to reduce the portion of corporate cash held in bank deposits. This combination of events, slated to happen within a 12-24 month period of one another ,will serve to reduce and redistribute bank deposits in favor of the following destinations:
Bank Deposits
Alternative Cash Investment Options Money Market Funds Investment Sweep US Treasuries and Government Agencies Commercial Paper and other cash investment
Instruments Non-interest-bearing DDA will convert to interest-
bearing DDA and/or investment sweep Cash will be used to fund Capital Expenditures,
Acquisitions, and for other strategic purposes The percent of corporate cash maintained in bank
deposits will likely begin to revert to pre-2008 levels 2007 – 27% of corporate cash held in bank deposits 2012 – 51% of corporate cash held in bank deposits
Likely Future Destinations of Corporate Cash Likely Future Destinations of Corporate Cash

15
Unlimited FDIC and the DDA Bubble
Destination* AllRev
< $1B
Rev >
$1B
Net Borrower
Net Investor
No Significant Change to DDA
59% 61% 58% 64% 53%
Prime MMF 17 11 24 20 16
Treasury MMF 16 14 19 16 17
Treasury/Agencies 14 21 10 9 23
Repo 6 9 4 7 5
Other 8 5 10 4 11
* Source: 2012 AFP Liquidity Survey
Possible Destinations of Non-Interest-Bearing DDA at End of 2012:

16
New Regulations Could Drive $1.5T onto Bank Balance Sheets
When interest rates rise, we could see an additional $1.5 trillion flow back onto bank balance sheets . In other post and non-Reg Q countries, companies hold as much as 50 - 70% of total liquidity in bank
deposits In addition to Reg Q repeal, two current regulations could potentially drive even more liquidity back into
the banking system - changes to 2a-7 regulations and collateral requirements for derivatives trading
In U.S., 25% of Corporate Liquidity = $1.3T
0%
10%
20%
30%
40%
50%
60%
70%
80%
U.S. France UK
Reg Q Post Reg Q No Reg Q
Percentage of Total Corporate Liquidity Held in Bank Deposits*
* Bank Deposits Defined as:DDA/Current Accounts, Offshore Deposits, Time Deposits/CDs, Savings/MMDAs and Sweep Accounts
This is a positive outcome for U.S. banks only if loan demand catches up to deposit growth
Impact of Reg Q Repeal
A Likely Unintended Consequence of Reg Q Repeal
For the typical treasury management bank, 60-70% of the revenue and 80-90% of profit comes from the spread on non-interest-bearing deposits
The Banking Industry will likely need to revise the pricing structure of the Treasury Management business in order to reflect the impact on revenue and profitability of the Repeal of Reg Q and the associated reduction or elimination of non-interest-bearing deposits
•Source: 2010 Treasury Strategies’ proprietary research; Commercial Deposit/Sweep Study & Global Corporate Liquidity Research
¹ Repealed in 2011, Regulation Q was a 1930s Depression Era regulation that disallowed banks from paying interest on commercial checking accounts
¹

17
The Economic Recovery May be Funded by Cash
Percent of Companies Self-Funding their 2010 and 2011 Capital Expenditures and Planning to Self-Fund in 2012
Redeploying Cash vs. Borrowing to Fund Capital Expenditures
Given the build-up of cash over the last 3-4 years, companies have been self-funding a major portion of their capital expenditures… and are likely to do so going forward
Banks usually benefit from an economic recovery through the expansion of their lending and/or underwriting activity… which may be slow in coming this time
Source: Greenwich Market Pulse, January 2012

18
Deposit Investment Allocations May Return to Pre-2008 Levels
18
Cash investors have been increasing their allocation to bank deposits over the last six years, while simultaneously decreasing their allocation to money market mutual funds
With more certainty around the future of money market funds, when rates begin to rise cash investors are likely to reallocate their portfolios to be weighted no more than 25-30% in bank deposits, which is consistent with pre-2009 levels
1
Source: 2012 AFP Liquidity Survey

19
Post Reg Q Repeal, the Primary Purpose of Sweep Has Changed
Primary Purpose of SweepOld Paradigm Post-Reg Q
Obtain yield on idle cash balances Diversify away from bank risk Obtain yield in excess of interest-bearing DDA
Predominant Sweep Vehicles
Money Funds Eurodollar Deposits Repo Bank Parent Commercial Paper
Repo (eliminate credit risk) Money Funds (diversify away from bank risk) Bank Parent CP (yield enhancement) Alternative ‘off balance sheet’ products
The Future of Sweep
Source: Treasury Strategies’ proprietary research; Commercial Deposit/Sweep Study & Global Corporate Liquidity Research
$-
$100
$200
$300
$400
$500
$600
$700
$800
2002 2003 2004 2005 2006 2007 2008 2009 2010 2011 2012 YTD
Total U.S. Sweep Balances ($B)
20
Corporate Governance
2011 SEC Enforcement Activity
735 total enforcement actions
89 actions for financial fraud and issuer disclosure violations
57 actions filed for insider trading
Compare to total of 9 cases for 2010, and 3 cases for 2009

21
Working Capital Management: Payments
ACH Same-day Settlement
Mobile Payments
ISO 20022 – Wire Remittance
ACH Secure Vault/Credit Push
Post-Durbin/Dodd-Frank
Durbin Amendment
PPACA
Credit Card Act of 1990

22
Working Capital Management: Liquidity
FDIC Coverage and Expense
Repeal of Reg Q
Sweep Investment Disclosures
Money Fund Reform
Change in Allocation of Corporate Cash Investments
Counterparty Risk
Banks and Broker-Dealers
Corporate/Non-FI
The TED Spread
Liquidity: The Lifeblood of Business

23
Working Capital Management: Liquidity
December 1998 – December 2009
The Ted SpreadCalculated as the difference between three-month LIBOR and the three-month T-bill interest rate, the TED spread is an indicator of perceived credit risk in the general economy -- and in particular, the credit risk within the banking sector.
When the TED spread increases, lenders believe the risk of default on interbank loans (counterparty risk) is increasing
When the risk of bank defaults is considered to be decreasing, the TED spread decreases
The long term average of the TED has been 30 basis points with a maximum of 50 bps. During 2007 the TED Spread ballooned to 150-200 bps, in reaction to the subprime mortgage crisis On September 17, 2008, the TED spread exceeded 300 bps, breaking the previous record set after the
Black Monday crash of 1987 In the midst of the fall 2008 credit and liquidity crisis, On October 10, 2008, the TED spread reached
another all-time high of 457 basis points on October 10, 2008 The Ted Spread returned to normal levels in 2010 and has remained there since
September 2008 – June 2011
TED-Spread

24
International
Europe
BASEL III
Stability of European Union
SEPA - 2014
European Payments Council
SWIFT

25
Impact of Basel III
International

26
Eurozone
SWOT Analysis: SEPA
Strengths for Payers Weaknesses (Challenges) for Existing Providers
Opportunities for Global FIs Threats to Existing Providers
Economic, Payments & Liquidity Environment
0.710.715
0.720.725
0.730.735
0.740.745
0.750.755
0.76
07-N
ov-1
1
09-N
ov-1
1
11-N
ov-1
1
13-N
ov-1
1
15-N
ov-1
1
17-N
ov-1
1
19-N
ov-1
1
21-N
ov-1
1
23-N
ov-1
1
25-N
ov-1
1
27-N
ov-1
1
29-N
ov-1
1
01-D
ec-1
1
03-D
ec-1
1
05-D
ec-1
1
USD-EURO Exchange RateOverview of SEPA
The main objectives are:Standardization and straight-through processing of euro paymentsEliminate the distinction between domestic and cross-border international
payments within the SEPA Eurozone… creates a payment environment similar in concept to the domestic US
Improve efficiencies and provide cost reduction to payers Estimated to save payers €29 to €40 billion in transaction and
settlement costs, all of which is to the detriment of bank revenues Improved surveillance and transparency of payment flows at the expense
of money laundering and organized crime
SEPA has the potential to recast the payments competitive landscape in Europe
Lower cost of transacting business Operational efficiencies achieved Potential to consolidate payments/receipts with fewer
providers
Represents a significant hit to revenue Requires new investment in infrastructure Changes the economics of the payments business
Likely to alter the landscape of the payments business Volume and revenue is likely to shift away from small providers
in favor of large regional and global providers Will cause some providers to exit the payments business, and
others to limit their involvement as a full service provider Opens the door for non-European global banks to become
major players in the Eurozone payments business
Unique opportunity to gain market share in a major global region
Potential to become a primary provider for in-country MNCs Ability to leverage existing technology & innovation reputation Turmoil in Europe provides the opportunity to leverage
balance sheet strength as a key selling point concerning counter-party risk and future investment in technology

27
“These new regulations will fundamentally change the way we get around them.”
Closing Remarks

28
Summary of Today’s Discussions
Financial reform is complicated, widespread and painful
It will have a financial impact on both banks and their clients
Financial reform will have (and already has had) an impact on corporate and institutional liquidity management and payment practices
Closing Remarks

29
ResourcesPublications / epages
AFP Status Update of Current Issues (301.907.2862)
AFP Pulse & Membership (301.907.2862)
AFP’s Homepage: //www.AFPonline.org
Treasury Strategies (www.Treasurystrategies.com)
Federal Reserve Homepage: //www.federalreserve.gov
FDIC Homepage: //www.fdic.gov
NACHA: //www.nacha.org
American Banker (800.221.1809)
SWIFT: //www.swift.com
ISO: //
Wikipedia.com
Investopedia.comw

The Hidden Cost of Bank Regulations on Your Business
The UNC Treasury Management Series October 1, 2012
2:15-3:30 p.m.
Nick Alex
Senior Vice President, Director of Product Management
Treasury & Payment Solutions
SunTrust
The Hidden Cost of Bank Regulations on Your Business reviews the new world of rules and regulations that define how treasury managers must carry out their duties. This session covers a wide range of legal and regulatory issues, including corporate governance, IRS guidelines for business tax payments, HIPAA and SEC interventions. It concludes with an intermediate term outlook for what else may be coming.

31

32

33

34
Regulatory Environment

35
Only 110 of the 398 rule-making requirements mandated by Dodd-Frank have been finalized; 144 have not yet been proposed
Deadlines have been missed for 148
Regulatory Environment

36

37

38
NOTE: SOME RULEMAKINGS ARE ISSUED JOINTLY AND ARE COUNTED UNDER BOTH CATEGORIES

40
41
Regulatory EnvironmentCurrent Economic Context Uncertain regulatory environment
U.S. presidential election Dodd-Frank regulatory reform
Volker Rule
European economic stability
Sovereign debt
Austerity measures
Other recent legislative changes
Consumer Financial Protection Bureau (CFPB)
PPACA

42

43
Regulatory Environment
Current Economic Context Uncertain regulatory environment
Dodd-Frank Regulatory Reform Volker Rule Consumer Financial Protection Bureau
Other recent legislative changes
Durbin Rule PPACA Credit CARD Act of 2009 American Reinvestment and
Recovery Act of 2009

44
Regulatory EnvironmentCurrent Economic Context Uncertain regulatory environment
Dodd-Frank Regulatory Reform Volker Rule Consumer Financial Protection Bureau
Other recent legislative changes
Durbin Rule PPACA Credit CARD Act of 2009 American Reinvestment and
Recovery Act of 2009

45
Regulatory EnvironmentCurrent Economic Context Uncertain regulatory environment
Dodd-Frank Regulatory Reform Volker Rule effective July 21, 2012 Consumer Financial Protection Bureau
Other recent legislative changes
Durbin Rule PPACA Credit CARD Act of 2009 American Reinvestment and
Recovery Act of 2009

46
Dodd-Frank in Detail Reg Q was repealed, allowing banks to pay interest on Checking
Accounts (effective July 21, 2011)
$250k FDIC insured cap now permanent (up from $100k)
Regulatory Environment
Unlimited Insurance mandated on non-interest bearing checking accounts, set to expire December 31, 2012
The TED Spread, representing the rates banks charge each other to borrow money, appears to be settling into a pre-crisis pattern

47
2007 2008 2009 2010 2011 2012 JUL1000
1200
1400
1600
1800
2000
2200
2400
M1 Money Supply
Bil
lio
ns
of
Do
llar
sRegulatory Environment
Current Economic Context
The M1 Money Supply Line has shown a sharp increase since the credit crisis in 2008

48

49
Impact of Regulations
Dodd-FrankDurbin Amendment
FDIC Coverage
Revenue
Cost

50

51
Corporate Governance
2011 SEC Enforcement Activity
735 total enforcement actions
89 actions for financial fraud and issuer disclosure violations
57 actions filed for insider trading
Compare to total of 9 cases for 2010, and 3 cases for 2009

52

53
Privacy
Overlapping regulations including GLB, FCRA, FACTA, Bank Secrecy, USA PATRIOT Act, HIPAA, etc.
Overlapping regulators including the Federal Reserve, FDIC, OCC, SEC, FCC, various state agencies, etc.
800 breaches reported in 2011 (compared to 622 for all of 2010)
Remediation and recovery costs of over $200 per compromised record

54

55
PrivacyPCI-DSS and PA-DSS Compliance Worldwide security standards created and managed by the
Payment Card Industry Security Standards Council (PCI SSC)
Version 2.0
HIPAA and HITECH
Changes to HIPAA under the new healthcare reform law
HITECH provisions of ARRA

56

57

58
InternationalEurope
BASEL III
Stability of European Union
SEPA - 2014
European Payments Council
SWIFT

59

60

61

62

63
Impact of Basel III

64

65
InternationalCompetition and Cooperation
International Monetary Policy Coordination
Ongoing central bank support Legislative activity Liquidity support
International coordination to manage national funds rates
G20 Summits

66
“These new regulations will fundamentally change the way we get around them.”

67
Working Capital Management
Payments
ACH Same-day Settlement
Mobile Payments
ISO 20022 – Wire Remittance
ACH Secure Vault/Credit Push
Post-Durbin/Dodd-Frank
Durbin Amendment
PPACA
Credit Card Act of 1990

68
Working Capital Management
Liquidity
FDIC Coverage and Expense
Repeal of Reg Q
Sweep Investment Disclosures
Money Fund Reform
Change in Allocation of Corporate Cash Investments

69


71
Resources
Publications / Homepages
AFP Status Update of Current Issues (301.907.2862)
AFP Pulse & Membership (301.907.2862)
AFP’s Homepage: //www.AFPonline.org
Federal Reserve Homepage: //www.federalreserve.gov
FDIC Homepage: //www.fdic.gov
NACHA: //www.nacha.org
American Banker (800.221.1809)
SWIFT: //www.swift.com
ISO: //www.iso.or