The Health of People with Intellectual...
39
International Journal of Family Medicine The Health of People with Intellectual Disability Guest Editors: Nicholas Lennox, Henny Lantman, Robert Davis, Seeta Durvasula, Jacqueline Small, and Margaret Kyrkou
Transcript of The Health of People with Intellectual...

International Journal of Family Medicine
The Health of People with Intellectual DisabilityGuest Editors: Nicholas Lennox, Henny Lantman, Robert Davis, Seeta Durvasula, Jacqueline Small, and Margaret Kyrkou

The Health of People withIntellectual Disability
International Journal of Family Medicine
The Health of People withIntellectual Disability
Guest Editors: Nicholas Lennox, Henny Lantman,Robert Davis, Seeta Durvasula, Jacqueline Small,and Margaret Kyrkou

Copyright © 2011 Hindawi Publishing Corporation. All rights reserved.
This is a special issue published in “International Journal of Family Medicine.” All articles are open access articles distributed under theCreative Commons Attribution License, which permits unrestricted use, distribution, and reproduction in any medium, provided theoriginal work is properly cited.

Editorial Board
Justin Beilby, AustraliaCarolyn Chew-Graham, UKJ. De Maeseneer, BelgiumSusan Dovey, New ZealandAneez Esmail, UKRoar Johnsen, NorwayS. K.-Kiukaanniemi, FinlandM Kljakovic, AustraliaRoss Lawrenson, New Zealand
Siaw-Teng Liaw, AustraliaChristos D. Lionis, GreeceDaniel R. Longo, USAManfred Maier, AustriaGeoffrey Mitchell, AustraliaJ. W. M. Muris, The NetherlandsD. E. Pathman, USARobert J. Petrella, CanadaShobha S. Rao, USA
Hagen Sandholzer, GermanyP. Shvartzman, IsraelJens Sondergaard, DenmarkJ. P. Sturmberg, AustraliaP. Van Royen, BelgiumMichael A. Weingarten, IsraelSamuel Y. S. Wong, Hong KongHakan Yaman, Turkey

Contents
The Health of People with Intellectual Disability, Nicholas Lennox, Henny Lantman, Robert Davis,Seeta Durvasula, Jacqueline Small, and Margaret KyrkouVolume 2011, Article ID 134571, 2 pages
Health and Functional Status of Adults with Intellectual Disability Referred to the Specialist Health CareSetting: A Five-Year Experience, L. Lee, J. Rianto, V. Raykar, H. Creasey, L. Waite, A. Berry, J. Xu,B. Chenoweth, S. Kavanagh, and V. NaganathanVolume 2011, Article ID 312492, 9 pages
The Prevalence of Depression among Family Caregivers of Children with Intellectual Disability ina Rural Setting in Kenya, Margaret Njeri Mbugua, Mary W. Kuria, and David M. NdeteiVolume 2011, Article ID 534513, 5 pages
Prevalence of Depression and Dementia among Adults with Developmental Disabilities in Manitoba,Canada, Shahin Shooshtari, Patricia Joan Martens, Charles A. Burchill, Natalia Dik, and Saba NaghipurVolume 2011, Article ID 319574, 9 pages
Parental Concerns about the Health of Adolescents with Intellectual Disability: A Brief Report,Madonna Tucker, Miriam Taylor Gomez, Therese Rey-Conde, and Nicholas LennoxVolume 2011, Article ID 164080, 2 pages
Parental Perceptions of a Manchester Service for Autistic Spectrum Disorders, Mischa Mockett,Jamila Khan, and Louise TheodosiouVolume 2011, Article ID 601979, 6 pages
Hindawi Publishing CorporationInternational Journal of Family MedicineVolume 2011, Article ID 134571, 2 pagesdoi:10.1155/2011/134571
Editorial
The Health of People with Intellectual Disability
Nicholas Lennox,1 Henny Lantman,2 Robert Davis,3 Seeta Durvasula,4
Jacqueline Small,5 and Margaret Kyrkou6
1 Queensland Centre for Intellectual and Developmental Disability, School of Medicine, The University of Queensland, Brisbane,QLD 4072, Australia
2 Department of Primary and Community Care Centre for Family Medicine, Geriatric Care and Public Health,Radboud University Nijmegen Medical Centre, 6525 GA Nijmegen, The Netherlands
3 Centre for Developmental Disability Health, School of Primary Health Care, Victoria, Notting Hill, VIC 3168, Australia4 Centre for Disability Studies, Northern Clinical School, Sydney Medical School, The University of Sydney, Camperdown,NSW 2050, Australia
5 Sydney Children’s Hospital Network (Westmead), The University of Sydney, Westmead, NSW 2145, Australia6 Department for Communities and Social Inclusion, Centre for Disability Health, Disability Services, Modbury, SA 5092, Australia
Correspondence should be addressed to Nicholas Lennox, [email protected]
Received 30 November 2011; Accepted 30 November 2011
Copyright © 2011 Nicholas Lennox et al. This is an open access article distributed under the Creative Commons AttributionLicense, which permits unrestricted use, distribution, and reproduction in any medium, provided the original work is properlycited.
This special issue for the International Journal of FamilyMedicine is a first and warmly welcomed by those of us whowork and research in the area.
In “Prevalence of depression and dementia among adultswith intellectual disabilities in Manitoba, Canada,” Dr. S.Shooshtari and her coauthors have offered us a clear pictureof both depression and dementia across the ages. Throughdata linkage across one Canadian province, Manitoba, theresearchers examined specific data over five years about6048 persons with developmental disability and then madecomparisons with those of matched non-developmentaldisability. Younger adults with developmental disability werefound to have a four-times higher risk of dementia than thosewithout disability, and, in the older age group, the risk rises tomore than five times. The pattern was similar for depression.Whilst the researchers acknowledge differences in diagnosticcodes, they have provided us with a population-level pictureof mental health conditions for people with developmentaldisability and a guide for future policy.
In “Health and functional status of adults with intellectualdisability referred to the specialist health care setting: a five-year experience,” Dr. L. Lee and her coauthors examined theprofile of 162 adults with intellectual disability who useda specialist outpatient clinic (Concord Hospital, Sydney)
over five years. This extensive study found a great rangeof complexity of health needs, such as high prevalence ofneurological dysfunction including epilepsy matched by lowlevels of physical activity, challenging behavior, and use ofpsychotropic medications. Older people with intellectualdisability had higher rates of hospital stays with mentalhealth issues and epilepsy management being the mostcommon cause of hospitalizations. This paper provides thereader with a longitudinal examination of the complexityof health needs and healthcare servicing for people withintellectual disability.
In “The prevalence of depression among family caregivers ofchildren with intellectual disability in a rural setting in Kenya,”Dr. M. Njeri Mbugua and her coauthors report on theirstudy of caregivers of children with intellectual disabilityand they found that nearly 80% of caregivers are at risk ofclinical depression. Using the Beck Inventory and indicatorsof socioeconomic status, the researchers, supported by theCatholic Church, collected data from 114 caregivers in oneparish in Kiambu (Kenya). Unemployment, low income, andfamily breakdown were indicators for higher risk, as weresocial isolation and stigma.
In “Parental perceptions of a Manchester Service for autisticspectrum disorders,” Dr. M. Mockett and her coauthors
2 International Journal of Family Medicine
present their findings from a survey of parents of children onthe autism spectrum about their impressions of the multi-agency Social Communication Assessment and InterventionTeams. Whilst most parents were happy with this assessmentservice, they placed emphasis on trust in their relationshipswith their children’s health professionals. Communicationbetween the teams, the parents and family, and the healthprofessional was seen to be crucial.
In “Parental concerns about the health of adolescentswith intellectual disability: a brief report,” Dr. M. Tuckerand her coauthors have offered a brief insight into thehealth concerns that parents have for their adolescent child’sfuture. The emerging themes from the qualitative arm ofa cross-sectional descriptive study included concerns overdependency, general health, challenging behaviours, andincreasing support needs.
This first special issue on the health of people withintellectual disability reflects the breadth of research in thearea and points policymakers to pitfalls in health servicedelivery.
Nicholas LennoxHenny Lantman
Robert DavisSeeta DurvasulaJacqueline Small
Margaret Kyrkou

Hindawi Publishing CorporationInternational Journal of Family MedicineVolume 2011, Article ID 312492, 9 pagesdoi:10.1155/2011/312492
Research Article
Health and Functional Status of Adults with IntellectualDisability Referred to the Specialist Health Care Setting:A Five-Year Experience
L. Lee,1, 2 J. Rianto,1, 2 V. Raykar,1 H. Creasey,1 L. Waite,1 A. Berry,1, 2 J. Xu,1 B. Chenoweth,1, 2
S. Kavanagh,1, 2 and V. Naganathan1
1 Centre for Education and Research on Ageing, Concord Hospital and Sydney University, Concord, NSW 2139, Australia2 Developmental Assessment Service, St. George Hospital, Kogarah, NSW 2217, Australia
Correspondence should be addressed to L. Lee, [email protected]
Received 30 November 2010; Revised 16 June 2011; Accepted 9 August 2011
Academic Editor: Henny Lantman
Copyright © 2011 L. Lee et al. This is an open access article distributed under the Creative Commons Attribution License, whichpermits unrestricted use, distribution, and reproduction in any medium, provided the original work is properly cited.
Aims and Method. The Developmental Disability Database in the Department of Rehabilitation Medicine at a metropolitan hospitalwas audited for observations on adults with Intellectual Disability living in the local region (total population 180,000) who wereseen in an identified multidisciplinary specialist clinic, during 2006–2010. Results. There were 162 people (representing half theknown number of adults with Intellectual Disability living in the region): 77 females, 85 males, age range 16–86 years. Themost common complex disabilities referred to the specialists in this clinic were epilepsy (52%), challenging or changing behavior(42%) and movement disorders (34%). Early onset dementia was a feature of the group (7%). The prevalence of prescription ofmedications for gastro-oesophageal reflux was high (36%) and similar to the numbers of people taking psychotropic medications.The rates of chronic cardiovascular disease (2%), chronic respiratory disease (10%) and generalised arthritis (11%) were lowoverall, but did rise with increasing age. Conclusions. Complex neurological disabilities are common, and chronic medical illnessesare uncommon in adults with Intellectual Disability referred to specialist clinicians in this region. A combined, coordinated,multidisciplinary clinic model addresses some of the barriers experienced by adults with Intellectual Disability in the secondaryhealth system.
1. Background
Consistent with estimates throughout developed countries,the Australian Survey of Disability, Ageing and Carersestimates that ∼3% of the population has an intellectualdisability, and for one third of that group that disabilityarose in childhood. Of this group who identify in the surveyas having intellectual disability (or mental retardation) asa main disabling condition, ∼50% are over the age of 15years (i.e., 0.4% of the Australian population), and this ratiois increasing [1–3]. As a result of the increased longevityof people with persisting neurological disabilities [4], moreinterest is being taken in the health care needs of adultswith Intellectual Disability. Specifically, the health policies ofgovernment agencies now encourage annual comprehensivehealth checks by general practitioners [5] and referral of
adults with complex, or multiple, impairments associatedwith their Intellectual Disability, to specialist medical officersfor consultations.
In 2006, with the express purpose of reducing some ofthe known barriers to good specialist health care, a spe-cific outpatient clinic for adults with Intellectual Disabilitywas established within the Department of RehabilitationMedicine at Concord Hospital in Sydney, Australia. Thispaper reflects on the outcomes from this clinic firstly becauseof its novel status amongst adult rehabilitation medicineprograms and secondly for the value of its data in planningfor service development for this special population.
The consultant in rehabilitation medicine in Australia is aspecialist physician with training in the assessment and man-agement of the medical and functional status of people withdisabilities [6]. The assessment includes history taking and

2 International Journal of Family Medicine
physical examination with respect to cognition, neuromotoractivity, bladder function, bowel function, musculoskeletalfunction, organ illnesses, and behavior. The model of amultidisciplinary clinic with case conferencing is commonin the rehabilitation medicine setting, for low incidencecomplex conditions. It provides the convenience for patientsand carers to have access to a number of disciplines at onevisit in comparison with attendance at multiple specialistappointments without coordination. It also allows for theconvenience of discussion of benefits and disadvantagesof management strategies within a multidisciplinary teamat one time, in order to reach consensus on treatmentrecommendations.
In this Developmental Disability Clinic model, thepatients are referred by their primary care General Prac-titioners to specialist rehabilitation physicians and psy-chiatrists who conduct their own initial assessments, andthen present the cases to a multidisciplinary conferenceteam expanded to include a neurologist, geriatrician, anddesignated allied health professionals. These weekly caseconferences are considered the keystone of the program,offering the regular opportunity for discussion and referralfor further management. These case conferences may alsobe attended by the relevant carers and family members,and referring General Practitioners are invited to participateby teleconference. Allied health professionals (psychologists,speech pathologists, occupational therapists, physiothera-pists, dietitians, social workers, and registered nurses) fromthe Concord Hospital Rehabilitation Services (or the localDisability services for out-of-area patients) attend the caseconferences and provide episodic clinical care when required.
2. Aim
The aim of this observational study was to report onthe demographic characteristics, functional disabilities, andcomplexity of illnesses of adults with Intellectual Disabilitywho were referred by primary care clinicians in an identifiedregion, to medical specialists in the outpatient hospitalsetting in Australia.
3. Methodology
The research is a descriptive study based on an auditof information from a database setup in early 2006 withthe approval of the Concord Hospital/Sydney UniversityResearch Ethics Committee. This Developmental DisabilityDatabase accommodates de-identified information on allattendees of the Developmental Disability RehabilitationClinics at Concord Hospital, and on other adult in- andout-patients with Intellectual Disability seen individually bythe consultants who participate in this Clinic, at other sitesthroughout Sydney (rehabilitation physicians, psychiatrists,neurologists, geriatricians, and some paediatricians).
The data have been entered from the medical infor-mation recorded at the time of initial history taking andassessment. Outcomes of investigations and treatments areentered as they are retrieved during the episode of care. The
database currently contains information on over 1400 adultswith Intellectual Disability seen between 2006 and 2011.
3.1. Subjects. Subjects were included in this study if theyhad a diagnosis of Intellectual Disability and were aged 16+years. So that the study subjects were representative of peoplewho might be referred to this kind of clinic, subjects wereonly included if they lived within the four Local GovernmentAreas (LGAs) regarded as those served by Concord Hospital(total population 180,000 in 2008).
The suburbs that make up these 4 LGAs are the catch-ment for the Aged Care Assessment Team that operates fromthe Department of Geriatric Medicine of the hospital. TheseLocal Government Areas also constitute an administrativesubset of the Central Sydney Division of General Practice anda subset of the government Disability Services.
3.2. Data. Data from the electronic database were extractedas spreadsheet files that could be analysed directly fordescriptive statistics or exported into SPSS Version 18 formore detailed analysis. Data concerning hospitalisations andfollow-up clinician assessments were obtained from both thedatabase records and hospital medical records systems.
3.3. Measures. Data were collected on age at initial assess-ment, known clinician determined cause for intellectualdisability, living environment, functional dependence, levelof intellectual disability, medications, epilepsy characteris-tics, neurological disabilities, other organ disorders, lifestylebehaviours, and mental status. Subjects had their weightand height measured to determine body mass index. Notewas made of challenging behaviours such as impulsiveor compulsive behaviours if these activities were leadingto self-injury or otherwise causing stress to carers. Carerobservation on general behaviour over the previous yearwas recorded as “unchanged”, “fluctuating”, “deteriorating”or “much worse”. Completion of the Adaptive Behaviour inDementia Questionnaire (ABDQ) by attending carers wasalso utilised occasionally by assessing clinicians to establishprogress of deterioration [7].
Information was collected on reasons for hospital admis-sions, details of medical interventions (such as botulinumtoxin injections), and the involvement of clinicians in thetwelve months prior to initial assessment.
Data were also sought from the Disability Pensiondatabase [8] and the NSW Disability Services database [9]for pension and service recipient numbers of people livingin the study region who identified as having IntellectualDisability. These data were used to estimate the proportion ofpeople with Intellectual Disability living within the definedgeographical area who were seen in the clinics. Measures usedare detailed below.
3.3.1. Functional Independence Measure. All subjects seen inthe clinic have their functional status determined using theFunctional Independence Measure (FIM) instrument [10].The FIM is used widely in Rehabilitation Medicine settings inAustralia. It is a standardised instrument whose development
International Journal of Family Medicine 3
was initiated by a national taskforce in the USA in 1983[11, 12]. The FIM has 18 domains of care and a seven-levelscale of support ranging from “7”, independent, needing noassistance, through to “1”, completely dependent, possiblyneeding two helpers.
The 13 motor domains incorporate personal care, conti-nence, transfers, and mobility, and there are 5 domains inthe cognition group (comprehension, expression, problemsolving, social interaction, and memory). A profile of scoresacross the domains is established for use in goal setting andreview of progress. The FIM total score (FIMTOT) has beendemonstrated to correlate well with hours of care need in thecommunity [13].
For this study, a person with
FIMTOT 100–126 was recorded as needing “inter-mittent” support (mostly supervisory),
FIMTOT 60–99 as needing “intensive” support(supervision and assistance), and
FIMTOT <60 as needing “pervasive” support (con-tinuous assistance).
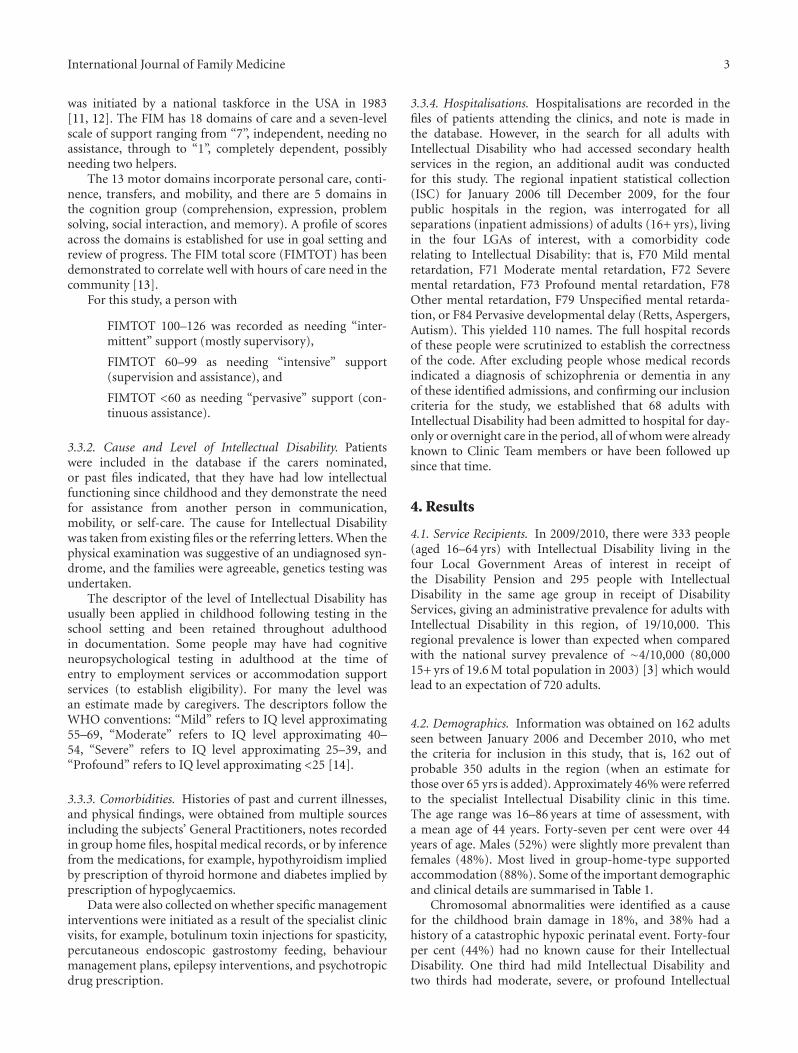
3.3.2. Cause and Level of Intellectual Disability. Patientswere included in the database if the carers nominated,or past files indicated, that they have had low intellectualfunctioning since childhood and they demonstrate the needfor assistance from another person in communication,mobility, or self-care. The cause for Intellectual Disabilitywas taken from existing files or the referring letters. When thephysical examination was suggestive of an undiagnosed syn-drome, and the families were agreeable, genetics testing wasundertaken.
The descriptor of the level of Intellectual Disability hasusually been applied in childhood following testing in theschool setting and been retained throughout adulthoodin documentation. Some people may have had cognitiveneuropsychological testing in adulthood at the time ofentry to employment services or accommodation supportservices (to establish eligibility). For many the level wasan estimate made by caregivers. The descriptors follow theWHO conventions: “Mild” refers to IQ level approximating55–69, “Moderate” refers to IQ level approximating 40–54, “Severe” refers to IQ level approximating 25–39, and“Profound” refers to IQ level approximating <25 [14].
3.3.3. Comorbidities. Histories of past and current illnesses,and physical findings, were obtained from multiple sourcesincluding the subjects’ General Practitioners, notes recordedin group home files, hospital medical records, or by inferencefrom the medications, for example, hypothyroidism impliedby prescription of thyroid hormone and diabetes implied byprescription of hypoglycaemics.
Data were also collected on whether specific managementinterventions were initiated as a result of the specialist clinicvisits, for example, botulinum toxin injections for spasticity,percutaneous endoscopic gastrostomy feeding, behaviourmanagement plans, epilepsy interventions, and psychotropicdrug prescription.
3.3.4. Hospitalisations. Hospitalisations are recorded in thefiles of patients attending the clinics, and note is made inthe database. However, in the search for all adults withIntellectual Disability who had accessed secondary healthservices in the region, an additional audit was conductedfor this study. The regional inpatient statistical collection(ISC) for January 2006 till December 2009, for the fourpublic hospitals in the region, was interrogated for allseparations (inpatient admissions) of adults (16+ yrs), livingin the four LGAs of interest, with a comorbidity coderelating to Intellectual Disability: that is, F70 Mild mentalretardation, F71 Moderate mental retardation, F72 Severemental retardation, F73 Profound mental retardation, F78Other mental retardation, F79 Unspecified mental retarda-tion, or F84 Pervasive developmental delay (Retts, Aspergers,Autism). This yielded 110 names. The full hospital recordsof these people were scrutinized to establish the correctnessof the code. After excluding people whose medical recordsindicated a diagnosis of schizophrenia or dementia in anyof these identified admissions, and confirming our inclusioncriteria for the study, we established that 68 adults withIntellectual Disability had been admitted to hospital for day-only or overnight care in the period, all of whom were alreadyknown to Clinic Team members or have been followed upsince that time.
4. Results
4.1. Service Recipients. In 2009/2010, there were 333 people(aged 16–64 yrs) with Intellectual Disability living in thefour Local Government Areas of interest in receipt ofthe Disability Pension and 295 people with IntellectualDisability in the same age group in receipt of DisabilityServices, giving an administrative prevalence for adults withIntellectual Disability in this region, of 19/10,000. Thisregional prevalence is lower than expected when comparedwith the national survey prevalence of ∼4/10,000 (80,00015+ yrs of 19.6 M total population in 2003) [3] which wouldlead to an expectation of 720 adults.
4.2. Demographics. Information was obtained on 162 adultsseen between January 2006 and December 2010, who metthe criteria for inclusion in this study, that is, 162 out ofprobable 350 adults in the region (when an estimate forthose over 65 yrs is added). Approximately 46% were referredto the specialist Intellectual Disability clinic in this time.The age range was 16–86 years at time of assessment, witha mean age of 44 years. Forty-seven per cent were over 44years of age. Males (52%) were slightly more prevalent thanfemales (48%). Most lived in group-home-type supportedaccommodation (88%). Some of the important demographicand clinical details are summarised in Table 1.
Chromosomal abnormalities were identified as a causefor the childhood brain damage in 18%, and 38% had ahistory of a catastrophic hypoxic perinatal event. Forty-fourper cent (44%) had no known cause for their IntellectualDisability. One third had mild Intellectual Disability andtwo thirds had moderate, severe, or profound Intellectual

4 International Journal of Family Medicine
Table 1: Study group characteristics.
Characteristic (Total = 162)Frequency (% of
total)
Gender
female 77 (48%)
male 85 (52%)
Age groups (range 16–86 yrs)
15–24 yrs 21 (13%)
25–34 yrs 33 (20%)
35–44 yrs 32 (20%)
45–54 yrs 28 (17%)
55–64 yrs 22 (13%)
65+ 26 (16%)
Level of intellectual disability
Mild (IQ 55–69) 53 (33%)
Moderate (IQ 40–54) 36 (22%)
Severe (IQ 25–39) 38 (23%)
Profound (IQ <25) 35 (21%)
Cause of intellectual disability
Chromosomal abnormalities (7 DownSyndrome, 3 Fragile X)
30 (18%)
Cerebral palsy from perinatal trauma orinfection
61 (38%)
Other 71 (44%)
Living arrangements
At home, with no paid carers 18 (12%)
Supported accommodation (group homes,apartments, boarding houses, hostels,nursing homes)
144 (88%)
Dependency
Intermittent support needed (FIM∗ Total100+)
51 (31%)
Intensive support needed (FIM Total 60–99) 37 (23%)
Pervasive support needed (FIM Total <60) 74 (46%)∗
FIMTOT highest score 126.
Disability. Figure 1 demonstrates the variation across the agegroups.
Almost 90% of the patients in the study group were inreceipt of some form of formal support. Intermittent support(drop-in or case management) was provided for 31% wholived alone or with unpaid carers who provided advice andassistance with complex executive functions such as financialplanning. Twenty-three per cent (23%) needed the supportof another person throughout the day for some activities ofdaily living. The other 46% of the group consisted of peoplewho were extremely dependent, with FIMTOTs less than60, i.e., they were receiving nursing-home-type assistance 24hours per day. The largest group were those people under theage of 45 years needing intensive-pervasive support. Figure 2demonstrates a pattern across the age groups for dependency,which is similar to that for level of Intellectual Disability,depicted in Figure 1.
15–2
4yr
s
25–3
4yr
s
35–4
4yr
s
45–5
4yr
s
55–6
4yr
s
65+
yrs
Mild
Moderate-profound
0
10
20
30
40
50
60
70
80
90
100
Figure 1: Levels of Intellectual Disability by age groups.
15–2
4yr
s
25–3
4yr
s
35–4
4yr
s
45–5
4yr
s
55–6
4yr
s
65+
yrs
IntermittentIntensive-pervasive
0
10
20
30
40
50
60
70
80
90
100
Figure 2: Levels of care need by age groups.
4.3. Health Status and Function—Assessment and Manage-ment. Table 2 shows the lifestyle risk factors, neurologicaldisabilities, and medical comorbidities identified at initialassessments or diagnosed by the clinicians. There was a highprevalence of neurological dysfunction (epilepsy, spasticity,and behavioural disturbance) but low prevalence of chronicdisease or illness.
Table 3 summarises the types of interventions thatoccurred as a result of the subjects being seen in theclinic. For twenty people (12%), the initial assessment andprovision of advice to GPs was the only involvement ofthe Clinic practitioners. For the rest, there was a period ofepisodic management and followup by the relevant medicalspecialists, consultant nurses, or allied health professionals.
4.3.1. Lifestyle Factors. In terms of lifestyle behaviours thegroup had very low levels of smoking, and no cases of illicit

International Journal of Family Medicine 5
Table 2: Health risks and disabilities.
Characteristic (Total = 162)Frequency (% of
total)
Lifestyle risks
Sedentary 125 (77%)
Underweight (Body Mass Index <18) 22 (13%)
Overweight (Body Mass Index 26–30) 32 (20%)
Obesity (Body Mass Index 31+) 17 (10%)
Smoking 10 (6%)
Associated central nervous system disabilities
Active epilepsy (taking anti-convulsant drugsfor epilepsy)
85 (52%)
Urinary incontinence (6 using catheters) 95 (58%)
Vision impairment (16 blind from birth,5 cataracts)
53 (33%)
Hearing impairment (2 profoundly deaf) 20 (12%)
Dysphagia (21 on PEG feeding) 45 (28%)
Movement disorders (diplegia, quadriplegia,hemi and tri-plegia)
55 (34%)
Dementia (probable 7, possible 4) 11 (7%)
Diagnosed medical conditions
Gastro-oesophageal reflux 59 (36%)
Chronic respiratory disease 17 (10%)
Hypertension 18 (11%)
Diabetes Mellitus 17 (10%)
Cardiac illness (coronary heart disease,congestive cardiac failure)
4 (2%)
Hypothyroidism 9 (5%)
Osteoarthritis 15 (9%)
Challenging behaviour (impulsive orcompulsive self-injurious behaviours)
56 (35%)
Changing behaviour (fluctuating ordeteriorating behaviour)
22 (13%)
drug use or unsafe sex practices. Thirty per cent of thegroup were overweight or obese, and 77% were categorizedas “inactive” after questions were asked about their levels ofdaily activity. This level of inactivity dropped to 60% whenthose with movement disorders were excluded.
4.3.2. Challenging Behaviour. Eighty people had challengingbehaviour, specifically for which they had been referredto the Clinic. Fifty-six people (35%) were described ashaving some form of impulsive aggressive behaviour orcompulsive self-injurious behavior. Twenty-two (13%) haddemonstrated fluctuating or deteriorating behaviours in theprevious 12 months. Fifteen per cent of the study groupwere referred, following case conference, for continuingreview by the Clinic psychiatrists and/or the local BehaviourIntervention Team psychologists for special plans to assistcare workers.
4.3.3. Dementia. The were 22 people described as having“changing” behaviour (i.e., fluctuating or declining over the
previous 12 months). Current criteria for the descriptor of“dementia” do not easily incorporate people with IntellectualDisability, and so decisions about dementia were based onthe history of cognitive changes with behavioural manifesta-tions. The Adaptive Behaviour in Dementia Questionnaire[6] was used in interviewing carers about the changesin identified behaviours over the previous 12 months.“Possible” dementia was diagnosed by the Case ConferenceTeam in 4 people and “probable” dementia in 7. Of those 11,two people had Down Syndrome and one had Fragile X; allhad onset of their dementia before the age of 60 years.
Carers of people with changing behaviour were offeredassistance and advice in dealing with behavioural changes,and documentation was provided for five people whoneeded justification for more care hours in their existingaccommodation environment or a shift to one in which morecare could be provided.
4.3.4. Spasticity. There were high rates of spasticity in theyounger group. Approximately 10% of the group withsignificant spasticity were seen beyond their initial clinicassessments, by the Clinic rehabilitation physicians formedication management of their dystonia. Five people hadbotulinum toxin injections for focal spasticity in upperand/or lower limbs.
4.3.5. Dysphagia. Forty-five people had dysphagia (difficultyswallowing). The Clinic physicians initiated investigations,referred to speech pathologists, and discussed with gas-troenterologists when needed. Advice was offered to carerson the day to day practices which should be initiated inpeople with swallowing difficulty. Twenty-one people (21)had been in receipt of percutaneous endoscopic gastrostomy(PEG) feeding prior to initial assessment by this clinic.About half of this group had had the PEGs inserted aschildren. They continued with monitoring by their existingspecialist gastroenterologists or were linked with new localpractitioners. For a small number, the outcome of the clinicassessment, in relation to dysphagia, was referral to the localPalliative Care teams for ongoing management advice andconjoint care.
4.3.6. Sensory Disabilities. Vision disorders (33%) and hear-ing impairments (12%) were also common neurologicaldisabilities. Where relevant, nursing and allied health profes-sionals in the clinic teams or local disability teams providedassessment and immediate management, and referrals weremade to other linked specialist clinicians such as ophthalmol-ogists when necessary.
4.3.7. Epilepsy. Of the 162 people in the study, 89 hada history of epilepsy and 85 were taking anticonvulsantmedications: all but 8 had childhood onset epilepsy. Of the85 people taking anti-convulsants for epilepsy, 32 had hadno seizures since childhood or were well controlled on oneor two medications. Fifty three (32% of the study group)continued to experience monthly, weekly, or daily seizures.

6 International Journal of Family Medicine
Table 3: Specialist clinic outcomes.
OutcomesNumber of patients
(% of 162)
Rehabilitation Medicine Assessment and advice only 20 (12%)
Episodic continuing specialist care: 142 (88%)
Spasticity management (rehab phys, neurologists, physiotherapists, occupational therapists, nurses) 16 (10%)
Botulinum toxin injections 5
Dysphagia management (gastroenterologists, rehab phys, speech path, dietitians, occup therapists) 45 (27%)
Behaviour management (psychiatrists, rehab physicians, psychologists, nurses, social workers) 25 (15%)
Dementia diagnosis and advice (geriatricians, rehab physicians, occupational therapists, nurses) 11 (7%)
Continence management (rehab physicians, nurses, occupational therapists) 25 (15%)
Epilepsy management (neurologists, geriatricians, occupational therapists, nurses) 80 (50%)
Psychotropic medication management (psychiatrists, physicians) 77 (48%)
15–2
4yr
s
25–3
4yr
s
35–4
4yr
s
45–5
4yr
s
55–6
4yr
s
65+
yrs
HypertensionDiabetes mellitusArthritis
0
10
20
30
40
50
60
70
80
90
100
Age
grou
pw
ith
diso
rder
(%)
Figure 3: Prevalence of hypertension, diabetes, and osteoarthritisrises with age.
In accordance with the health policy operational for allresidents of supported accommodation, all people takingmore than one anticonvulsant were seen at least annuallyby a specialist neurologist and all had Emergency EpilepsyManagement Plans. The study group was seen by one offour neurologists in two practice sites in the region. In twocases in the past two years prolonged admission to ConcordHospital with conjoint care by neurologist and rehabilitationphysician was required.
Adult onset epilepsy was a new finding in 8 people of the11 in whom dementia was eventually diagnosed.
4.3.8. Chronic Illnesses. Prevalence of hypertension, coronaryvessel illness, diabetes, chronic respiratory disorders, andosteoarthritis were low, although as is depicted in Figure 3,the prevalence of diabetes, hypertension, and osteoarthritisdid rise with age.
Table 4: Medication usage.
MedicationsFrequency (% of total
group)
Psychotropics
Anticonvulsants 81 (50%)
Antidepressants, anxiolytics 32 (20%)
Antipsychotics 42 (26%)
Movement disordermedications
8 (5%)
Multiple psychotropics (morethan one form)
77 (47%)
Anticonvulsants for epilepsy
One 26 (16%)
Two 22 (13%)
Three or more 33 (20%)
Antihypertensives 27 (17%)
Oral hypoglycaemics 12 (7%)
Antireflux drugs 55 (34%)
Analgesics,anti-inflammatories
43 (26%)
4.3.9. Polypharmacy. Consultant physicians reviewed thephysical health, investigated where appropriate and sug-gested changes to a medication regimen when necessary.In general, few changes were suggested to existing medi-cations for medical illnesses, and there were few in whichnew diagnoses were made. Fifty per cent of the groupwere taking anticonvulsants, 20% antidepressants, and 26%antipsychotics as shown in Table 4. A large proportion ofthe study group (47%) were taking more than one class ofpsychotropic medication.
4.4. Hospitalisations. In the four-year period, from January2006 to December 2009, 68 of the people in the study werenoted to have been hospitalised (22 of 86 aged 15–44 yrs, 20of 50 aged 45–64 yrs, and 26 of 26 aged 65+ yrs).
There were 77 Day-only admissions and 100 overnightstays, to any of the four hospitals in the region under study

International Journal of Family Medicine 7
Table 5: Separations from local hospitals 2006–2009.
Age groups EpisodesDay only
daysOvernightepisodes
Overnightbed days
Average length ofstay for overnight
stays
Overnight beddays/year
16–44 yrs (n = 86) 70 35 35 284 8 71
45–64 yrs (n = 50) 73 32 41 241 6 60
65+ yrs (n = 26) 34 10 24 221 9 55
Total 177 77 100 746 7 186
Table 6: Casemix inpatients from local hospitals 2006–2009.
Overnight beddays/year
Rehabilitation Seizure/Neuro Medical misc Mental health
16–44 yrs (n = 86) 26 13 26 7
45–64 yrs (n = 50) 11 10 28 12
65+ yrs (n = 26) 21 6 28 0
Total 58 29 82 19
(one of which was a Centre for Mental Health). Table 5summarises the separations (admissions and discharges) byage groups and demonstrates an average occupancy of 60overnight bed days per year for the whole group in anyhospital in the region. When accounting for the numbersin each age group, the incidence of overnight hospitalisationwas highest in the older age group.
There were four main reasons for admission to hospitalfor overnight care, described in Table 6: mental health,epilepsy, rehabilitation, and miscellaneous medical disorders.In the calendar year 2009, there were 6 transfers to theRehabilitation Ward: for recuperation following medicalevents (2), back pain (2), fractured neck of femur (1) andspasticity management (1).
5. Discussion
This study extends our current knowledge of the health careneeds of adults with Intellectual Disability by reviewing thehealth status of people referred by primary care practitionersto specialists in the hospital-based health system. The mainfindings of the study are that in this group the prevalenceof significant dependency is high, the prevalence of neuro-logical disability is high, the prevalence of chronic disease islow, although it does rise with age, and multiple specialistmedical officers and other clinicians can be organized toprovide coordinated care.
Although the study group is small, it does represent about50% of the known adults living with Intellectual Disabilityin a region which has a well-organized and resourced healthsupport system. In terms of the disability support system,this region did not have a large institution in devolution inits midst, and so it is not surprising that the prevalence ofadults (0.18%) may be lower than the national average of0.4% [3].
5.1. Clinic Model. It is well established that people withIntellectual Disability may be disadvantaged in promoting
their own health because they are unable to take thisresponsibility themselves, and they are unable to conveytheir symptoms adequately to their carers. The individualdifficulties are compounded by lack of time committed byhealth professionals to whom they are taken, the lack ofresponsiveness in the secondary health system that theymay experience, and the inability of carers to adequatelycoordinate the multiplicity of specialists to whom they mayneed referral [15].
By creating an outpatient clinic service that involvesmultiple interested specialist clinicians, encouraging bothformal and informal carer attendance, and establishingprotocols with colleagues in the investigation sectors ofthe hospital, a multidisciplinary-clinic-with-regular-case-conferencing model can overcome some of these knownbarriers to provision of high-quality care. Guidelines forhospital-based specialty clinics for people with IntellectualDisability have been suggested [16], and the ConcordHospital clinic in the Department of Rehabilitation Medicinemeets all of these criteria for best practice.
In the Australian setting, the prescription of somepsychotropic drugs by General Practitioners is not subsidisedby the government, and their prescription is restrictedeven amongst specialists to psychiatrists, neurologists, andrehabilitation physicians. A large proportion of the studygroup (47%) were taking more than one class of psychotropicmedication—a reflection of their complexity and need forspecialist consultation. The Clinic setting offers the oppor-tunity for efficient prescription and consensus discussionof the advantages and disadvantages for the patients whomay benefit from this group of medications among thisgroup of specialists. This “peer review” time is consideredan important monitor of the quality of care provided by theclinic.
5.2. Health Status. The findings of high levels of spasticity,epilepsy, and behavioural disturbance in this group areconsistent with other national and international literature

8 International Journal of Family Medicine
on clinic cohorts and accommodation support cohorts ofadults with Intellectual Disability [17–20]. The findings ofage-related rises in prevalence of hypertension, arthritis, anddiabetes mellitus in adults with Intellectual Disability, arealso beginning to be highlighted in literature from developedcountries [21–24].
A level of inactivity of 60% in those who could be active(purposefully walking for 30 mins per day) is slightly higherthan the figure for the general Australian population [25]. Inour study, these people form the group who are overweightor obese and are being prescribed psychotropic medications.Clinic staff have been active in the development of specialhealth promotional material for clients and carers, and in theorganization of “healthy eating” and “being a healthy person”education programs.
Although the numbers are small, our identification ofearly onset dementia in this group is consistent with recentstudies on ageing in people with Intellectual Disabilitywherein it has been documented that people with Down Syn-drome manifest their Alzheimer’s Disease at much youngerages than the general population. Non-Down’s patients maydevelop dementia at the same rate as the general population,or perhaps slightly earlier [26, 27]. Care and advice for thecarers of this group are similar to that for people withoutIntellectual Disability [28].
5.3. Hospitalisations. About 50% of the study group hadpresented to an Emergency Department or been admittedto a hospital for overnight care in the past four years andtheir reasons for admission were numerous. Their averagelength of stay for overnight care was similar to that of thegeneral population for these aggregated groupings of rehabil-itation, mental health, seizure/neurology, and miscellaneousmedical. While it could be postulated that people withIntellectual Disability might need a longer stay in hospitalfor each admission because of diagnostic overshadowing orpoor communication, it appears that this is not occurring inthe few hospitalizations that have been documented in ourregion. It could be surmised that the existence of the specialclinic and its in-built followup and liaison mechanisms maybe assisting in maintaining their lengths of stay at the generalpopulation averages.
The low bed day utilization figures per year are significantin that an identified ward for people with IntellectualDisability in a regional hospital would be impractical. Itis therefore even more important that organised liaisonis provided to ensure that communication at all levels isfacilitated and high-quality care provided.
5.4. Health Care Policy. Almost all of the group in thestudy were residents of supported accommodation, providedeither by government or nongovernment organisations. Theintense accountability scrutiny under which the staff areput to implement health promoting policies ensures that ingeneral:
(i) the residents are living in a healthy environment,
(ii) they have protocols in place for the early identifica-tion of risk,
(iii) their access to interested health practitioners isfacilitated.
Although all the referrals to the clinic came fromgeneral practitioners (government convention), they wereoften initiated by care workers in supported accommodationorganisations, and many were mandated by the nationalprescribing rules and state Health Policy. There were lownumbers of people with Mild Intellectual Disability in thestudy group. This is the group considered traditionally to beat greater risk of health care inequalities. It is possible thatin our region they continue to be a group with significantproblems that are not being addressed. It is possible also thatthey were being seen regularly by their General Practitionerswho did not feel their needs were of a level requiringspecialist care, and so they would not be visible in ourspecialist clinic dataset. Those who were not referred tospecialist services appeared to be the younger group, andtherefore possibly likely to be less complex.
6. Conclusions
We believe that our Clinic may be addressing a previouslyunmet need in our region. This study concludes that
(i) the known prevalence of adults with IntellectualDisability in the community is quite low (∼4 in 1,000in Australia and 19 in 10,000 in our region);
(ii) approximately 50% of adults with Intellectual Dis-ability in our community also have associated ill-nesses and multiple disabilities requiring specialistmedical referral;
(iii) almost all of that group are very dependent, andliving in formal care;
(iv) those who need specialist attention need multiplespecialists’ attention;
(v) chronic physical illness is more prevalent in the oldersubgroup of people referred to secondary services.
As expected, the most common reasons for referralto specialist health services for advice and treatment arerelated to the neurological damage or delay experiencedin childhood, that is, challenging behaviour, spasticity,dysphagia and epilepsy.
System wide planning for increasing access of adultswith Intellectual Disability to interested specialist cliniciansshould focus on continuing education and skill developmentin consultant physicians, nurses, and allied health profes-sionals who have identified expertise in the managementof epilepsy, movement disorders, neurological disability,challenging behavior, and ageing. This training and skilldevelopment may be facilitated in the setting of a multidisci-plinary outpatient clinic at a regional level.
Disclosure
This paper has not been published except in conferenceabstract form nor submitted for publication elsewhere.

International Journal of Family Medicine 9
Acknowledgments
Refinement and maintenance of the Developmental Dis-ability Database were funded by grants from the NSWDepartment of Ageing Disability and Home Care and theAgeing and Alzheimer’s Fund of the Centre for Educationand Research on Ageing, Concord Hospital.
References
[1] M. Wullink, H. M. J. Van Schrojenstein Lantman-de Valk, G.J. Dinant, and J. F. M. Metsemakers, “Prevalence of peoplewith intellectual disability in the Netherlands,” Journal ofIntellectual Disability Research, vol. 51, no. 7, pp. 511–519,2007.
[2] F. Mulvany and S. Barron, Annual Report of the NationalIntellectual Disability Database Committee, Health ResearchBoard, Dublin, Ireland, 2002.
[3] AIHW, “Disability in Australia: intellectual disability,” Bulletin67 Australian Institute of Health and Welfare Canberra, 2008.
[4] A. H. Bittles, B. A. Petterson, S. G. Sullivan, R. Hussain, E. J.Glasson, and P. D. Montgomery, “The influence of intellectualdisability on life expectancy,” Journals of Gerontology, vol. 57,no. 7, pp. M470–M472, 2002.
[5] N. Lennox, C. Bain, T. Rey-Conde, D. Purdie, R. Bush, andN. Pandeya, “Effects of a comprehensive health assessmentprogramme for Australian adults with intellectual disability:A cluster randomized trial,” International Journal of Epidemi-ology, vol. 36, no. 1, pp. 139–146, 2007.
[6] http://www.racp.edu.au/page/racp-faculties/australasian-faculty/-of-rehabilitation-medicine/.
[7] V. Prasher, “The adaptive behaviour dementia questionnaire(ABDQ): screening questionnaire for dementia in Alzheimer’sdisease in adults with Down syndrome,” Research in Develop-mental Disabilities, vol. 25, no. 4, pp. 385–397, 2004.
[8] Centrelink Information and Performance Division—data pro-vided, August 2010.
[9] Australian Institute of Health and Welfare, Common-wealth States and Territories Disability Agreement—websitedata cubes, http://www.aihw.gov.au/disability/datacubes/in-dex.cfm.
[10] UDSMR, Guide for the Uniform Data Set for MedicalRehabilitation (including the FIM TM instrument) V 5.1Buffalo New York 14214-3007: State University of New Yorkat Buffalo, 1997.
[11] J. Linacre, A. Heinemann, B. Wright, C. Granger, and B.Hamilton, “The structure and stability of the functionalindependence measure,” Archives of Physical Medicine andRehabilitation, vol. 75, no. 2, pp. 127–132, 1994.
[12] C. Granger, B. Hamilton, J. Linacre, A. Heinemann, and B.Wright, “Performance profiles of the functional independencemeasure,” American Journal of Physical Medicine and Rehabili-tation, vol. 72, no. 2, pp. 84–89, 1993.
[13] P. B. Disler, C. W. Roy, and B. P. Smith, “Predicting hours ofcare needed,” Archives of Physical Medicine and Rehabilitation,vol. 74, no. 2, pp. 139–143, 1993.
[14] WHO, ICD-10 Guide Mental Retardation World HealthOrganisation Geneva, 1996.
[15] M. Scheepers, M. Kerr, D. O’Hara et al., “Reducing healthdisparity in people with intellectual disabilities: a report fromthe Health issues Special Interest Group of the InternationalAssociation for the Scientific Study of Intellectual Disabilities,”
Journal of Policy and Practice in Intellectual Disabilities, vol. 2,pp. 249–255, 2005.
[16] R. Wallace and H. Beange, “On the need for a specialist servicewithin the generic hospital setting for the adult patient withintellectual disability and physical health problems,” Journalof Intellectual and Developmental Disability, vol. 33, no. 4, pp.354–361, 2008.
[17] M. Haveman, T. Heller, L. Lee, M. Maaskant, S. Shooshtari,and A. Strydom, “Major health risks in aging persons withintellectual disabilities: an overview of recent studies,” Journalof Policy and Practice in Intellectual Disabilities, vol. 7, no. 1,pp. 59–69, 2010.
[18] D. Jansen, B. Krol, J. Groothoff, and D. Post, “People withintellectual disability and their health problems: a review ofcomparative studies,” Journal of Intellectual Disability Research,vol. 48, no. 2, pp. 93–102, 2004.
[19] H. Evenhuis, C. Henderson, H. Beange, N. Lennox, B.Chicoine, and S. Saxena, “Healthy ageing—adults with intel-lectual disabilities: physical health issues,” Journal of AppliedResearch in Intellectual Disabilities, vol. 14, no. 3, pp. 175–194,2001.
[20] M. P. Janicki, P. W. Davidson, C. M. Henderson et al., “Healthcharacteristics and health services utilization in older adultswith intellectual disability living in community residences,”Journal of Intellectual Disability Research, vol. 46, no. 4, pp.287–298, 2002.
[21] H. Evenhuis, “Medical aspects of ageing in a population withintellectual disability: III. Mobility, internal conditions andcancer,” Journal of Intellectual Disability Research, vol. 41, no.1, pp. 8–18, 1997.
[22] K. Fisher and P. Kettl, “Aging with mental retardation:increasing population of older adults with MR require healthinterventions and prevention strategies,” Geriatrics, vol. 60,no. 4, pp. 26–29, 2005.
[23] C. Henderson, L. Robinson, P. Davidson, M. Haveman, M.Janicki, and G. Albertini, “Overweight status, obesity and riskfactors for coronary heart disease in adults with IntellectualDisability,” Journal of Policy and Practice in Intellectual Disabil-ities, vol. 5, no. 3, pp. 174–177, 2008.
[24] R. Wallace and P. Schluter, “Audit of cardiovascular diseaserisk factors among supported adults with intellectual disabilityattending an ageing clinic,” Journal of Intellectual and Develop-mental Disability, vol. 33, no. 1, pp. 48–58, 2008.
[25] G. Egger, R. Donovan, B. Swinburn, B. Giles-Corti, and F.Bull, Physical Activity Guidelines for Australians, Universityof Western Australia and Centre for Health Promotion andResearch, Sydney, Australia, 1999.
[26] A. Strydom, S. Shooshtari, L. Lee et al., “Dementia inolder adults with intellectual disabilities—epidemiology, pre-sentation, and diagnosis,” Journal of Policy and Practice inIntellectual Disabilities, vol. 7, no. 2, pp. 96–110, 2010.
[27] S. Cooper, “High prevalence of dementia among people withlearning disabilities not attributable to Down’s syndrome,”Psychological Medicine, vol. 27, no. 3, pp. 609–616, 1997.
[28] H. Wilkinson, D. Kerr, and C. Cunningham, “Equipping staffto support people with an intellectual disability and dementiain care home settings,” Dementia, vol. 4, no. 3, pp. 387–400,2005.

Hindawi Publishing CorporationInternational Journal of Family MedicineVolume 2011, Article ID 534513, 5 pagesdoi:10.1155/2011/534513
Research Article
The Prevalence of Depression among Family Caregivers ofChildren with Intellectual Disability in a Rural Setting in Kenya
Margaret Njeri Mbugua,1 Mary W. Kuria,2 and David M. Ndetei2
1 Department of Psychiatry, University of Nairobi, P.O. BOX 365-00621, Village Market, Nairobi, Kenya2 Department of Psychiatry, University of Nairobi and Africa Mental Health Foundation, P.O. BOX 48423-00100, Nairobi, Kenya
Correspondence should be addressed to Margaret Njeri Mbugua, [email protected]
Received 1 December 2010; Revised 16 May 2011; Accepted 9 August 2011
Academic Editor: Jacqueline Small
Copyright © 2011 Margaret Njeri Mbugua et al. This is an open access article distributed under the Creative CommonsAttribution License, which permits unrestricted use, distribution, and reproduction in any medium, provided the original work isproperly cited.
Caregivers of children with intellectual disability have a great responsibility that may be stressful. The psychological well-being ofthe care giver may affect the quality of care given to children with intellectual disability. Objective. The objective of the study wasto determine the risk of depression in caregivers of children with intellectual disability. Setting. The study was conducted at GachieCatholic Parish, Archdiocese of Nairobi (Kenya). Design. Cross sectional, descriptive study. Method. The study was conductedamong 114 caregivers registered at the Gachie Parish program (in Kenya) for the intellectual disabled children. A researcher-de-signed social demographic questionnaire and the Beck depression inventory were administered to those that met the inclusioncriteria. Results. Seventy-nine percent (79%) of the caregivers were at risk of clinical depression. Conclusion. Majority of the care-givers of children with intellectual disability were at risk of developing clinical depression.
1. Introduction
There is an increased demand on the care givers of childrenwith developmental disability [1] especially when it is intel-lectual in nature. Intellectual disability is associated withpoor communication, academic and social skills that makethe child more dependent on the caregiver than the normalchild.
In the past (in Kenya), the extended family would beavailable to provide care to an intellectually disabled childeasing the burden of care expected from the nuclear family.However, in recent times, there is a shift from extendedfamily to nuclear family. In addition, over the past 2 decades,family units have become smaller [2] and the rate of marriagebreak down has increased [3]. Though the magnitude of theresponsibility depends on the level of intellectual disability, itis greater for those in small nuclear families.
It is also important to note that the economic situationin Kenya dictates that people work long hours with little payespecially if they are in nonskilled employment. This coupledwith the fact that there are few institutions or organizationsthat school or take care of the intellectually disabled makesthe role of caregivers enormous. The caregivers are usually
the mother of the child, elderly family members, or the un-employed members of the family. Such people do not nor-mally plan to be caregivers [4] but find the need unavoidable.In addition, the caregivers do not receive preparation for thisrole, and, in the process of engaging in the same, they later onfind it very demanding [4]. Unlike other carers, the caregivermay be deprived of privileges, rights, and respect that go withother careers [3]. Further, there is lack of career progression,and the individual may continue to work involuntarily [3].In the majority of cases in Kenya, the caregiver receives nofinancial assistance due to the poor socioeconomic statusof the people. The caregiver may experience lack of controlof what happens in their lives. A sense of mastery is as-sociated with good physical and psychological health of anindividual [5–7]. This may be absent in some of the care-givers. The relationship between caregiving and health isdescribed generally in terms of stress. Stressors in the contextof caregiving are the difficult circumstances and problems.Such demands and obstacles exceed or push to the limit thecaregivers’ capacity to adapt [2].
5 factors that have been shown to contribute to poorhealth outcomes of the caregivers include child’s behavior

2 International Journal of Family Medicine
[8], child’s temperament [9], severity of the disability [10–14], low self-esteem [15, 16], and poor social support [8, 10,17, 18]. Literature indicates that the level of communicationability, specific cognitive or sensory impairments, sex, andage of the patient may be relevant to the mental health of thecaregiver [11, 19–22].
Factors that lead to low psychological distress in mothersof intellectual disabled persons include, a positive belief sys-tem and “noncritical family network” [11]. Other coping fac-tors include stress management, family functioning [23–26],and support from the spouse [27–29]. Caregivers health canbe improved by specific stress management strategies [11,30].
2. Materials and Method
The cross-sectional descriptive study was conducted inGachie Parish in Kiambu (Kenya) between September andNovember 2007. Gachie Parish is located 15 Km north ofNairobi and consists of eight churches with a population of10,000 followers. The location has both local residents whodo peasant farming as well as tenants who work in Nairobicity. It is a cosmopolitan location with people of both lowand high socioeconomic status. Parish has a database of allthe children in Parish who have intellectual disabilities. Thisdata was collected in early 2007 by the Parish leaders inan attempt to offer assistance to the needy cases. All thecaregivers of 150 registered intellectually disabled personswere requested to participate in the study. One hundredand fourteen fulfilled the inclusion criteria which includedcaregiver age between 18 and 70 years, informed consent, anddiagnosis of intellectual disability having been done beforethe child attained the age of 18 years. Thirty-six persons inthe database did not participate in the study because they didnot fulfill the inclusion criteria.
The participants were assured of confidentially. Par-ticipation was voluntary, and other ethical considerationswere fulfilled. Ethical approval was obtained from Keny-atta National Hospital, University of Nairobi Ethical andResearch committee, and permission to perform the studywas obtained from the Department of Psychiatry, Universityof Nairobi.
The enrolled participants were subjected to a sociodemo-graphic questionnaire to collect data on the age, sex, maritalstatus, religion, education status, and occupation. The BeckDepression inventory was administered to collect data on therisk of depression. The Kiswahili version (provided by the3rd author) of the Beck Inventory was administered by the1st author who was trained by the second author. Kiswahiliis the national language in Kenya and is well understood bythe majority of Kenyans. This is an inventory with twenty-one multiple-choice self-report inventory questionnaire andis one of the most widely used instruments for measuringrisk of depression. The questionnaire is designed for adultsaged 17–80 years.
The Father in charge received an advanced written expla-nation highlighting what the study was all about. He there-after made an announcement in the church, and the care-givers gathered at the parish hall at the given date. After
Table 1: Social demographic characteristics of caregivers.
Number Percentage
Age group
21–30 34 23.1%
31–45 40 31.5%
41–65 30 26.3%
65–70 12 10.5%
Total 114 100%
GenderMale 12 10.5%
Female 102 89.5%
Total 114 100%
ReligionCatholic 61 53.5%
Protestant 53 46.5%
Total 114 100%
EducationInformal 18 15.8%
Primary 66 57.9%
Secondary 30 26.3%
Total 114 100%
Marital status
Single 31 27.2%
Married 63 55.3%
Divorced 7 6.1%
Separated 13 11.4%
Total 114 100%
OccupationNot employed 84 73.7%
Business 18 15.8%
Student 12 10.5%
Total 114 100%
Table 2: Risks of depression levels in the caregivers.
N114 Frequency Percentage
Minimum depression 24 21.1
Mild depression 30 26
Moderate depression 24 21
Severe depression 36 31.6
Total 114 100
introduction, the principal investigator explained the detailsabout the study, the benefits and the risks, and the fact thatit was a voluntary exercise. Those that consented after theexplanation signed a consent form, while those unwilling toparticipate were allowed to leave. The consenting partic-ipants completed sociodemographic questionnaires and aKiswahili version of the Beck Inventory. Those that neededassistant to complete the questionnaires were helped by theprincipal investigator and research assistants. No data relatedto the severity of the intellectual disability of the persons whowere under the care of the caregiver was collected since thiswas not within the scope of the current study.
3. Data Analysis
The data collected was entered in an Excel spreadsheet,cleaned, and analyzed using the statistics package for socialsciences (SPSS) version 12.

International Journal of Family Medicine 3
Table 3: Social demographic correlates of depression.
Age of caregiver and depression
25–30 24.5 28 0.001
31–45 26.3 30 “
46–65 23.7 27 “
>66 4.4 5 “
Religion and depressionProtestants 46.6 53 0.003
Catholics 32.4 37 “
Gender and depressionMale 10.6 12 0.02
Female 68.5 78
Marital status and depression
Single 21.9 25 “
Married 44.7 51 “
Divorced 6.2 7 “
Separated 6.2 7 “
Level of education and depressionInformal 10.6 12 0.000
Primary 52.6 60 “
Secondary 15.8 18 “
Employment status and depressionUnemployed 63.1 72 0.000
Business 5.3 6 “
Student 10.5 12 “
Other sibling in the family and depression 78.9 90 0.001
“ means the significant is the same as the first one in each particular column.
Multivariate regression analysis was done, and the resultswere presented in tables.
4. Results
All the caregivers were Kenyans of African origin, and thechildren under their care were aged between one and eigh-teen years of age.
Majority of caregivers were aged between 21 years and 45years of age. All the caregivers were Christians with 89.5%being female.
Majority of caregivers were married, unemployed, andhad primary school education (this is the first eight yearsof school while secondary education is the 9th–12th year ofeducation). Results are shown in Table 1.
The majority of caregivers (79%) were at risk of havingclinical depression as per result table showing percentagesof likely severe, moderate, and mild depression. Results areshown in Table 2.
Sociodemographic factors that were associated with therisk of depression included gender, unemployment, primaryeducation, married status, and the age of caregiver. Theresults are shown in Table 3.
5. Discussion
In the current study, 79% of the caregivers were at risk of clin-ical depression as derived from Beck Inventory score. Thisfinding is consistent with that of Turner and Sanders [31].All the caregivers had not previously been diagnosed by aclinician for depression. Those found with the risk of clinicaldepression were referred to Kenyatta National Hospital forfurther clinical evaluation and treatment. Various factors
may contribute to vulnerability of the caregiver to depres-sion, and of importance is financial lack as the caregiver isunable to engage in income generating activity. In addition,social isolation, loss of previously close friendships, andstigma associated with taking care of intellectually disabledperson may further predispose the caregiver to the risk ofdepression.
The sociodemographic characteristic of the caregivershows that there was a statistically significant associationbetween unemployment and risk of depression. Unemployedcaregivers have little or no income. Further, the burdenrelated to financial costs is aggravated by insufficient publicresources in place at the community level, such as lack ofschools for the intellectually disabled and proper health facil-ities to meet their health needs. In Kenya, special schools orclasses and special teachers for the intellectually disabledpersons are few and apart with some regions having none.
The married caregivers had statistically significant higherlevels of risk of depression than the singles, divorced, or sep-arated because in the African culture, intellectual disabilityis associated with stigma and, hence, the risk of higher levelsof depression among the married. Nearly half (44.7%) of thedepressed caregivers were married. This may be due to lack ofemotional support from the spouse. The divorced/separatedand single may on the other hand have adapted copingstrategies to deal with the situation. Frey et al. [32] hadsimilar findings in their study.
The finding that gender was significantly associated withrisk of depression is in keeping with findings of other studies[33]. The women are responsible for the emotional care ofthe children. In the African context, it is more acceptablefor the woman to take up the role of the caregiver. Thismay result in low self-esteem and loss of self that may be
4 International Journal of Family Medicine
associated with maternal depression due to subjective care-giving burden among them [33].
All the participants were Christians which reflects reli-gious background of the study area.
6. Limitations of the Study
(1) Preexisting depression was not assessed and may havehad an influence on the findings.
(2) This study was researched in a single locality and,hence, it would be difficult to ascertain if the risk ofdepression of the caregivers would be the same ordifferent from other localities vis-a-vis urban andrural settings.
7. Conclusion
Beck Inventory scores indicated that majority of caregivers ofchildren with intellectual disability had scores indicating riskof mild, moderate, and severe depression. The current studyshows that caregivers of persons with intellectual disabilityare likely to be at risk of depression. There is therefore needto avail a support system to prevent or reduce the risk ofdepression in the caregivers of intellectually disabled chil-dren.
References
[1] B. McKinney and R. A. Peterson, “Predictors of stress in par-ents of developmentally disabled children,” Journal of PediatricPsychology, vol. 12, no. 1, pp. 133–150, 1987.
[2] R. C. Dzienkowski, K. K. Smith, K. A. Dillow, and C. B.Yucha, “Cerebral palsy: a comprehensive review,” The Nursepractitioner, vol. 21, no. 2, pp. 45–61, 1996.
[3] P. Raina, M. O’Donnell, H. Schwellnus et al., “Caregivingprocess and caregiver burden: conceptual models to guideresearch and practice,” BMC Pediatrics, vol. 4, pp. 1–2431,2004.
[4] P. S. Eicher and M. L. Batshaw, “Cerebral palsy,” PediatricClinics of North America, vol. 40, no. 3, pp. 537–551, 1993.
[5] N. Krause, “Stressors in salient social roles and well-being inlater life,” Journals of Gerontology, vol. 49, no. 3, pp. P137–P148, 1994.
[6] L. I. Pearlin, M. A. Lieberman, E. G. Menaghan, and J. T. Mul-lan, “The stress process,” Journal of Health and Social Behavior,vol. 22, no. 4, pp. 337–356, 1981.
[7] C. E. Ross and J. Mirowsky, “Explaining the social patternsof depression: control and problem solving - or support andtalking,” Journal of Health and Social Behavior, vol. 30, no. 2,pp. 206–219, 1989.
[8] G. King, S. King, P. Rosenbaum, and R. Goffin, “Family-centered caregiving and well-being of parents of children withdisabilities: linking process with outcome,” Journal of PediatricPsychology, vol. 24, no. 1, pp. 41–53, 1999.
[9] P. J. Beckman, “Influence of selected child characteristics onstress in families of handicapped infants,” American Journal ofMental Deficiency, vol. 88, no. 2, pp. 150–156, 1983.
[10] W. N. Friedrich, L. T. Wilturner, and D. S. Cohen, “Copingresources and parenting mentally retarded children,” AmericanJournal of Mental Deficiency, vol. 90, no. 2, pp. 130–139, 1985.
[11] K. S. Frey, M. T. Greenberg, and R. R. Fewell, “Stress and cop-ing among parents of handicapped children: a multidimen-sional approach,” American Journal on Mental Retardation, vol.94, no. 3, pp. 240–249, 1989.
[12] L. Sjøbu, “Parents of children with cerebral palsy in Nordland(county in the north of Norway); factors connected to theirquality of life and coping of the circumstances around thehandicapped child,” Arctic medical research, vol. 53, pp. 30–31,1994.
[13] A. L. Saddler, S. B. Hillman, and D. Benjamins, “The influenceof disabling condition visibility on family functioning,” Jour-nal of Pediatric Psychology, vol. 18, no. 4, pp. 425–439, 1993.
[14] B. J. Leonard, A. L. Johnson, and J. D. Brust, “Caregivers ofchildren with disabilities: a comparison of those managing“OK” and those needing more help,” Children’s Health Care,vol. 22, no. 2, pp. 93–105, 1993.
[15] L. I. Pearlin, M. A. Lieberman, E. G. Menaghan, and J. T. Mul-lan, “The stress process,” Journal of Health and Social Behavior,vol. 22, no. 4, pp. 337–356, 1981.
[16] M. M. Skaff and L. I. Pearlin, “Caregiving: role engulfment andthe loss of self,” Gerontologist, vol. 32, no. 5, pp. 656–664, 1992.
[17] C. J. Dunst and C. M. Trivette, “Mediating influences of socialsupport: personal, family, and child outcomes,” American Jour-nal of Mental Deficiency, vol. 90, no. 4, pp. 403–417, 1986.
[18] L. Fisher and D. C. Ransom, “An empirically derived typologyof families: I. Relationships with adult health,” Family Process,vol. 34, no. 2, pp. 161–182, 1995.
[19] D. Cadman, P. Rosenbaum, M. Boyle, and D. R. Offord, “Chil-dren with chronic illness: family and parent demographiccharacteristics and psychosocial adjustment,” Pediatrics, vol.87, no. 6, pp. 884–889, 1991.
[20] L. L. Dyson, “Response to the presence of a child with disabil-ities: parental stress and family functioning over time,” Ameri-can Journal on Mental Retardation, vol. 98, no. 2, pp. 207–218,1993.
[21] K. Lambrenos, A. M. Weindling, R. Calam, and A. D. Cox,“The effect of a child’s disability on mother’s mental health,”Archives of Disease in Childhood, vol. 74, no. 2, pp. 115–120,1996.
[22] B. Trute and D. Hiebert-Murphy, “Family adjustment to child-hood developmental disability: a measure of parent appraisalof family impacts,” Journal of Pediatric Psychology, vol. 27, no.3, pp. 271–280, 2002.
[23] P. Sloper and S. Turner, “Risk and resistance factors in theadaptation of parents of children with severe physical disabil-ity,” Journal of Child Psychology and Psychiatry and Allied Dis-ciplines, vol. 34, no. 2, pp. 167–188, 1993.
[24] L. Fisher and D. C. Ransom, “An empirically derived typologyof families: I. Relationships with adult health,” Family Process,vol. 34, no. 2, pp. 161–182, 1995.
[25] R. L. Evans, D. S. Bishop, and R. T. Ousley, “Providing care topersons with physical disability. Effect on family caregivers,”American Journal of Physical Medicine and Rehabilitation, vol.71, no. 3, pp. 140–144, 1992.
[26] D. C. Ransom, L. Fisher, and H. E. Terry, “The CaliforniaFamily Health Project: II. Family world view and adult health,”Family Process, vol. 31, no. 3, pp. 251–267, 1992.
[27] W. N. Friedrich, “Predictors of the coping behavior of mothersof handicapped children,” Journal of Consulting and ClinicalPsychology, vol. 47, no. 6, pp. 1140–1141, 1979.
[28] K. Lambrenos, A. M. Weindling, R. Calam, and A. D. Cox,“The effect of a child’s disability on mother’s mental health,”Archives of Disease in Childhood, vol. 74, no. 2, pp. 115–120,1996.

International Journal of Family Medicine 5
[29] M. Erickson and C. C. Upshur, “Caretaking burden and socialsupport: comparison of mothers of infants with and withoutdisabilities,” American Journal on Mental Retardation, vol. 94,no. 3, pp. 250–258, 1989.
[30] L. P. Barakat and J. A. Linney, “Children with physical hand-icaps and their mothers: the interrelation of social support,maternal adjustment, and child adjustment,” Journal of Pedi-atric Psychology, vol. 17, no. 6, pp. 725–739, 1992.
[31] K. M. T. Turner and K. M. Sanders, “University of Queen landAustralia,” Journal of Intellectual Disability Research, vol. 51, p.109, 2007.
[32] Frey et al., “Father and Mother Contributions to family func-tioning,” 1989.
[33] S. M. Magana, S. J. Schwartz, M. P. Rubert, and J. Szapocznik,“Hispanic caregivers of adults with mental retardation: impor-tance of family functioning,” American Journal on Mental Re-tardation, vol. 111, no. 4, pp. 250–262, 2006.

Hindawi Publishing CorporationInternational Journal of Family MedicineVolume 2011, Article ID 319574, 9 pagesdoi:10.1155/2011/319574
Research Article
Prevalence of Depression and Dementia among Adults withDevelopmental Disabilities in Manitoba, Canada
Shahin Shooshtari,1 Patricia Joan Martens,2 Charles A. Burchill,2 Natalia Dik,2
and Saba Naghipur3
1 Departments of Family Social Sciences and Community Health Sciences, University of Manitoba and St. Amant Research Centre,Manitoba, Canada R3T 2N2
2 Manitoba Centre for Health Policy, Department of Community Health Sciences, Faculty of Medicine, University of Manitoba,Winnipeg,Manitoba, Canada R3E 3P5
3 Faculty of Science, University of Manitoba, Manitoba, Canada R3T 2N2
Correspondence should be addressed to Shahin Shooshtari, [email protected]
Received 1 December 2010; Accepted 19 May 2011
Academic Editor: Robert Davis
Copyright © 2011 Shahin Shooshtari et al. This is an open access article distributed under the Creative Commons AttributionLicense, which permits unrestricted use, distribution, and reproduction in any medium, provided the original work is properlycited.
Study Objective. To estimate and compare the prevalence of dementia and depression among adults with and withoutdevelopmental disabilities (DDs). Methods. We linked data from several provincial administrative databases to identify personswith DDs. We matched cases with DD with persons without DD as to sex, age, and place of residence. We estimated the prevalenceof dementia and depression and compared the two groups using the Generalized Estimating Equations (GEEs) technique. Results.The estimated prevalence of depression and dementia among younger adults (20–54) and older adults (50+) with DD wassignificantly higher than the estimated rates for the matched non-DD group (Depression: younger adults: RR = 2.96 (95% CI 2.59–3.39); older adults: RR = 2.65 (95% CI 1.84–3.81)), (Dementia: younger adults: RR = 4.01 (95% CI 2.72–5.92); older adults: RR =4.80 (95% CI 2.48–9.31)). Conclusion. Significant disparities exist in mental health between persons with and without DDs.
1. Introduction
Persons with developmental disabilities (DDs) are those who“have significantly greater difficulty than most people withintellectual and adaptive functioning and have had suchdifficulties from a very early age. Adaptive functioning meanscarrying out everyday activities such as communicating andinteracting with others, managing money, doing householdactivities and attending to personal care” [1]. DD is oftenused by researchers as a broad term to include a range ofneurological diagnoses. In this paper, we report the estimatedprevalence of dementia and depression for adults with DDs,intellectual disability (ID), and autism spectrum disorders(ASDs).
Although prior research shows that life expectancy forpersons with DDs, and in particular for those with Down
syndrome, has increased significantly over the last fewdecades [2], significant health disparities remain betweenpersons with and without DDs (e.g., [3, 4]). Of great concernare disparities in mental health; a large proportion ofpersons with moderate to severe DDs (upwards of 30–60%)reportedly have mental disorders [5]. Extensive informationexists on the mental health needs and the prevalence ofspecific mental illnesses among persons with DD fromthe United States and several European countries (e.g.,[6–15]). However, the literature on the mental health needsof persons with DD in Canada remains very limited [16–25].Most Canadian research has focused on hospitalizations formental health or psychiatric disorders [16, 17, 19–21, 23–25]and has centered on the Canadian province of Ontario[19–21, 23–25]. Some of these studies focused on a smallnumber of persons from a selected unit or hospital [22].
2 International Journal of Family Medicine
The most recent Canadian study [16], also based on hos-pitalization records, but nationally, used data administeredby the Canadian Institute of Health Information (CIHI).This study concluded that, overall, 41.5% of all Canadianhospitalizations among persons with DD occurred forpsychiatric reasons. Although Canada has an estimated120,000+ individuals aged 15 or older living with DDs [26],no population-level information exists on the prevalenceand epidemiology of mental illnesses among this populationliving in the community or on their mental health needs.
People living with a dual diagnosis of DD and mentalillness have complex health and social needs, thereforerequiring ongoing support for health, housing, education,and employment. Late diagnosis and inadequate supportcould result in significant economic cost and further com-plications both for these individuals and for their familiesand caregivers [27]. We need accurate estimations of theprevalence of mental illnesses in this population, alongwith other demographics and health-related information,to better identify their medical and social support serviceneeds. To address this lack, we conducted the present studyusing linked data from several provincial administrativedatabases in Manitoba to (1) estimate the prevalence oftwo types of mental illnesses, dementia and depression,among younger (20–54) and older (55+) adults with DD;(2) compare the age-specific prevalence estimates betweenpersons with DD and a matched comparison group withoutDD. We focused on dementia and depression because priorresearch yielded high, but inconsistent, prevalence estimates.Moreover, research indicates that these two illnesses are agrowing source of functional decline, morbidity, and poorquality of life (e.g., [2, 27]).
Dementia is a mental disorder characterized by a lossof intellectual abilities of sufficient severity to interferewith social or occupational performance [28]. Althoughsome studies have examined the risk of dementia amongpeople with DD, only a few were population-based studies.Most of these studies—conducted in the USA, UK, Ireland,and Australia—focused on the prevalence of dementia onlyamong subjects with ID. These studies produced inconsistentresults. For example, a state-wide survey in New York Statefound an overall prevalence of 3.1% among individuals withID aged 40 and older. The prevalence among persons withID aged 60 and over was estimated at 6.1% [29]. In Ireland[30], Tyrrell and colleagues (2001), using DSM-IV criteriafor dementia, estimated age-specific prevalence at 1.4% forthose aged 40 and under, 5.7% for those aged 40 to 49,and 30.4% for those aged 50 to 59. A recently publishedreport on dementia in older adults with ID [31] highlightsthe considerable variation found amongst studies in terms ofdementia prevalence.
Depression, another mental health disorder shown toaffect persons with DD at a higher rate than the general pop-ulation, is a common disorder that presents with depressedmood, loss of interest or pleasure, feelings of guilt or lowself-worth, disturbed sleep or appetite, low energy, andpoor concentration [32]. National data from the CanadianCommunity Health Survey: Mental Health and Well-Being(CCHS 1.2) estimates the lifetime prevalence of major
depressive episodes among Canadians aged 15+ at 12.2%[95% CI, 11.7–12.7%] [33]. Using health administrativedata, one report estimated the five-year treatment prevalenceof depression for the population of Manitoba, Canada, at18.2% (18.09–18.29). It reported that the highest prevalenceof depression among residents of Manitoba over a five-yeartime period occurred in adults aged 35 to 54 [34].
Although reports of depression prevalence exist forpersons with DD, they provide fairly inconsistent results.Moreover, most prior studies focus on the risk of depressionamong persons with ID only. For example, a study byDeb and colleagues in South Wales, UK (2001) screened agroup of 90 randomly selected adults with ID aged 16 to64 for various psychiatric illnesses, using the Mini Psychi-atric Assessment Schedule for Adults with DevelopmentalDisability (Mini PAS-ADD) and using criteria from theInternational Classification of Diseases-10th revision (ICD-10). Using both criteria, the study estimated the prevalenceof depressive disorder at 2.2% [9]. More recently, Bhaumikand colleagues investigated the psychiatric diagnoses of2711 adults with ID aged 19 and older in Leicestershireand Rutland, UK [14]. All diagnoses were recorded basedon clinical assessments using ICD-10 criteria. The studyestimated the overall prevalence of depressive syndrome at4.3%. In contrast to these results, Marston et al. (1997)used a standard checklist comprising 30 symptoms fromICD-10 diagnostic criteria and the Disability AssessmentSchedule [8]. The checklist was completed with the clientsand caregivers for 82 persons with ID aged 15 to 58 in theWest Midlands, England. Marston estimated the prevalenceof depressive syndrome at 43.9%. As the reviewed literaturemakes evident, the majority of prior studies focused on therisk of depression only among persons with ID and reportedvariable estimates. The substantial variations in reportedrates could be due to several factors, including the specifictype of ID studied, study population characteristics (e.g., ageand sex), depression criteria, and methods of measurement.
Given the existing inconsistencies in the reported esti-mates and the lack of population-based information on theprevalence of depression and dementia among persons withDD in Manitoba, we conducted the present study usingpopulation-based linked administrative data from severalsources to (1) estimate the prevalence of depression anddementia among younger (20 to 54) and older (55+) adultswith DD living in Manitoba and (2) compare their estimatedrates to those of a matched comparison group without DD.
2. Methods
2.1. Region and Population. Manitoba has a population of1.17 million, making it the 5th largest of Canada’s provincesand territories. Children under the age of 15 make up 19.6%of Manitoba’s population, whereas seniors aged 65 andover represent 14.1% [35]. Manitoba has a relatively largeaboriginal population (12.7%), which has a much higherreported rate of disability (e.g., [36]). The target populationof our study comprised Manitoba residents of all ages. Weused the December 31, 2000, population count from theManitoba population Registry for prevalence estimation.

International Journal of Family Medicine 3
2.2. Data Sources. This study analyzed five fiscal years ofdata (from April 1, 2000, to March 31, 2005) from multipleadministrative databases contained in the Manitoba Popula-tion Health Research Data Repository (hereafter, the Repos-itory). The Manitoba Centre for Health Policy (MCHP)of the University of Manitoba maintains the Repository,which contains a comprehensive collection of anonymizedbut linkable health and nonhealth administrative databasescovering all Manitoba residents. Researchers have used theRepository extensively for population-based research and thequality of the Repository’s data has been evaluated as highbased on the completeness of the data sets and the accuracyof the information recorded [37–41]. The following sectionbriefly describes the administrative data sets used in thepresent study.
2.2.1. Population-Based Registry. The registry containsdemographic information, such as age, sex, and location ofresidence, for all Manitoba residents (including those livingin First Nations communities) registered with the provincialdepartment of health, Manitoba Health (MH), to receivepublicly funded universal health care. Thus, it provides anaccurate number of the population of Manitoba to serve asthe denominator for the calculation of age-specific rates.We used information on age, sex, and place of residence formatching purposes.
2.2.2. Administrative Health Databases. The provincial gov-ernment originally developed the administrative healthdatabases in 1970 to administer the universal medical insur-ance plan. The Repository at MCHP contains anonymizedrecords of these databases for virtually all contacts with theprovincial health care system, including physicians, hospitals,personal care (nursing) homes, and home care, as well aspharmaceutical prescriptions. All individuals registered inthe provincial health care program are assigned a nine-digit Personal Health Identification Number (PHIN). MCHPuses an encrypted, scrambled version of the PHIN as theconsistent nonidentifying research number, which permitsresearchers to link data across data files and track individualsover time while ensuring confidentiality. This study used datafrom three health administrative databases. First, we usedthe Hospital Abstracts database, which contains informationtaken from medical charts created when patients are dis-charged from hospital. It includes demographic as well asclinical information relating to inpatient and outpatient ser-vices received [42]. The clinical information in the database,which uses the ICD-9-CM (the International Classificationof Diseases— 9th Revision—Clinical Modification), codesup to 16 diagnoses and 12 surgical procedures [43]. As ofApril 1, 2004, the ICD–10-CA and CCI, the 10th revisionof the ICD coding system, codes up to 25 diagnoses and 20procedures. This study searched all hospital discharge codeswhen looking for a diagnosis.
Second, we used the Physician Claims database, whichcontains information from records of patient contacts withphysicians. This database has the primary purpose of finan-cially reimbursing health care providers for services pro-vided. The clinical information on physician claims includes
only one diagnosis coded using ICD-9-CM [43]. Third,we used the drug database, which contains prescriptiondrug claims from the Drug Programs Information Network(DPIN), an online point-of-sale prescription drug databasefor all community-based pharmaceuticals dispensed to Man-itoba residents since 1994.
2.3. Developmental Disability Case Definition. Using datafrom the Repository, we identified all persons living with aDD (i.e., cases) in Manitoba during the five-year study periodfrom April 1, 2000, to March 31, 2005. These cases includedthose meeting at least one of the following three criteria: (1)received income assistance for reasons of ID, from ManitobaDepartment of Family Services and Consumer Affairs; (2)received special education funding from Manitoba Depart-ment of Education for reasons of multiple handicaps, usuallydefined as ID plus one or more physical disabilities; (3)had at least one ICD diagnostic code for ID and/or ASDsin either the physician claims or the hospital abstractsdatabase. The ICD diagnostic codes used in this study toidentify cases with ID included 317 (mild mental retardation(MR)), 318 (moderate, severe, and profound MR), 319(unspecified MR), 760 (fetal alcohol spectrum disorders(FASDs)), and 758 and 759 (chromosomal and congenitalanomalies associated with MR, including Down’s syndrome,Patau’s and Edward syndromes, Fragile X syndrome, andPrader Willi syndrome). The ICD–10–CD that we usedincluded F700–F701; F708–F711; F718–F721; F728–F731;F738–F739; F780–F781; F788–F791; F798–F799; F840–F841;F843–F845; F848–F849; P043; Q860–Q862; Q868; Q870–Q873; Q875; Q878; Q898; Q900–Q902; Q909–Q917; Q930–Q939; Q992.
2.4. Study Period. We based all analyses presented in thispaper on five fiscal years of data: from April 1, 2000, to March31, 2005.
2.5. Study Population. The total number of individuals ofall ages who met at least one of our DD criteria was7,362. Of these, 7,135 persons had at least 365 days ofcoverage. Of these, we excluded those residing in personalcare homes (PCHs), that is, a nursing home, or havinga Public Trustee postal code. We made this decision forseveral reasons. First, we suspected that cases with DDs inPCHs and those listed with a Public Trustee postal codewould have higher rates of comorbidities, including mentalillnesses, making their health profiles quite different fromthose living independently in their communities. Second,compared to the general population, those in PCHs or inother residential facilities have a different level of access tohealth and social services; therefore, including them mightintroduce some bias to our results. Third, we excluded suchcases because, in some cases, it was difficult to match themaccording to their place of residence. We also excluded tenpeople from the study group because they had no assignedIncome Quintiles (IQ) (An income quintile divides thepopulation into five income groups (from lowest to highestincome) with (approximately) 20% of the population in eachgroup. We derived the income quintiles with data from the

4 International Journal of Family Medicine
public-use census file 2001 developed by Statistics Canada.We linked the census file to the Manitoba population fromthe Manitoba Population Registry via the correspondingpostal code conversion files) information attached to themin the database. This left us with a total of 6,054 individualswho lived for at least one full year between 2000 and 2005in the community and who met our DD criteria. Of these6,054, we matched a total of 6,027 by sex, age (year ofbirth), and three-digit postal code, using a ratio of 1 : 2. Wematched for age, since persons with DDs are found to bea much younger population than the non-DD population.In addition, research has shown that the prevalence ofsome mental illness conditions—for example, dementia—increases with age [2]. We matched for sex, as research showsthat a higher proportion of persons with DD are malesthan females [44]. In addition, the conditions of interest,depression and dementia, are more commonly found amongfemales [34, 45]. We also matched the two study groups basedon place of residence, since research shows that this affectsindividuals’ access to health services (e.g., [46, 47]).
We matched a total of 27 people on the basis of the samecharacteristics, but using a ratio of 1 : 1. We could not matchthe remaining six individuals, so we excluded them fromthe analysis. Thus, our DD population comprised a total of6,048 persons with DD living in the community. We basedthe analyses presented in this paper on data for those aged20+ with DD (n = 1, 619) and their matched comparisongroup (n = 3, 231).
2.6. Study Measures
2.6.1. Prevalence of Dementia. We determined a historyof dementia using the ICD diagnostic codes from themedical records, including both the Physician Claims andHospital Abstracts databases, using five years of data—2000/2001 to 2004/2005. We considered the presence ofany of the ICD-9-CM codes of 290–292 (organic psychoticconditions), 294 (other organic psychotic conditions), 331(cerebral degenerations), or 797 (senility) in either databasean indication of dementia. ICD–10–CA codes included F00,F01, F02, F03, F04, F05.1, F06.5, F06.6, F06.8, F06.9, F09,F10–F19, G30, G31.0, G31.1, G31.9, G32.8, G91, G93.7, G94,and R54.
2.6.2. Prevalence of Depression. We determined a history ofdepression via the ICD diagnostic codes from the medicalrecords, as well as the prescribed medication database, usingthe following criteria:
(I) at least one hospitalization with a diagnosis of depres-sive disorder, affective psychosis, neurotic depression,or adjustment reaction [ICD–9–CM codes 296.2–296.8, 300.4, 309, 311; ICD–10–CA codes F31, F32,F33, F341, F38.0, F38.1, F41.2, F43.1, F43.2, F43.8,F53.0, F93.0];
(II) at least one physician visit with a diagnosis fordepressive disorder, affective psychosis, or adjust-ment reaction [ICD–9–CM codes 296, 309, or 311];
(III) at least one hospitalization with a diagnosis for anx-iety disorders [ICD–9–CM code 300; ICD–10–CAcodes F32.0, F34.1, F40, F41, F42, F44, F45.0, F451,F452, F48, F68.0, F99] and one or more prescriptionsfor an antidepressant or mood stabilizer;
(IV) at least one physician visit with a diagnosis foranxiety disorders [ICD–9–CM code 300] and one ormore prescriptions for an antidepressant or moodstabilizer.
This operational definition of depression has been validatedand follows prior health research using MCHP healthadministrative data sets [47, 48].
We calculated prevalence estimates in two different ways:(1) as the number of people with the chronic condition ofinterest per 100 population and (2) as the number of peoplewith the chronic condition of interest per 1,000 person-years(PYs), to take into consideration years of coverage over thefive years of the study period. Note that administrative datado not directly identify people who had a particular diseaseof interest; rather, they indicate who used health services forthat particular disease or illness.
2.7. Data Analyses. As mentioned earlier, we calculated theprevalence of dementia and depression in two differentways. For descriptive analyses, we reported prevalence as theproportion of the population (%) with dementia and depres-sion. We used Generalized Estimating Equations (GEE; SASPROC GENMOD, with repeated subject) to test if the ratesof dementia and depression (calculated as the number ofpeople with the conditions of interest, that is, depression anddementia, per 1,000 PYs) were statistically higher or lowerthan the estimated rates for the matched comparison group.The GEE is a method of analyzing correlated data, where theexponent of the estimate indicates the risk ratio (RR) [49].We used the RR and 95% confidence intervals to determinethe statistical significance of the observed differences inprevalence estimates. We performed programming and dataanalyses using SAS software, version 9.1.
2.8. Ethics. The University of Manitoba Health ResearchEthics Board, the Health Information Privacy Committee(HIPC) of Manitoba Health, Department of Family Servicesand Consumer Affairs and the Manitoba Department ofEducation approved this research.
3. Results
Between April 2000 and March 2005, a total of 6,048 personsof all ages lived with DD in Manitoba—64.15% males and35.85% females. As shown in Table 1, slightly higher than73% of the population with DD were children under the ageof 20; 1,619 were adults aged 20+. Of these, 1,401 (or 86.5%)were between the ages of 20 and 54, and 218 (or 13.5%) were55 years of age or older (Table 1). Of the 218 individuals withDD aged 55+, 101 were males and 117 were females.
As shown in Table 2, among persons with DD agedbetween 20 and 54 (N = 1, 401), a total of 73 had adiagnosis of dementia during the five-year study period. This
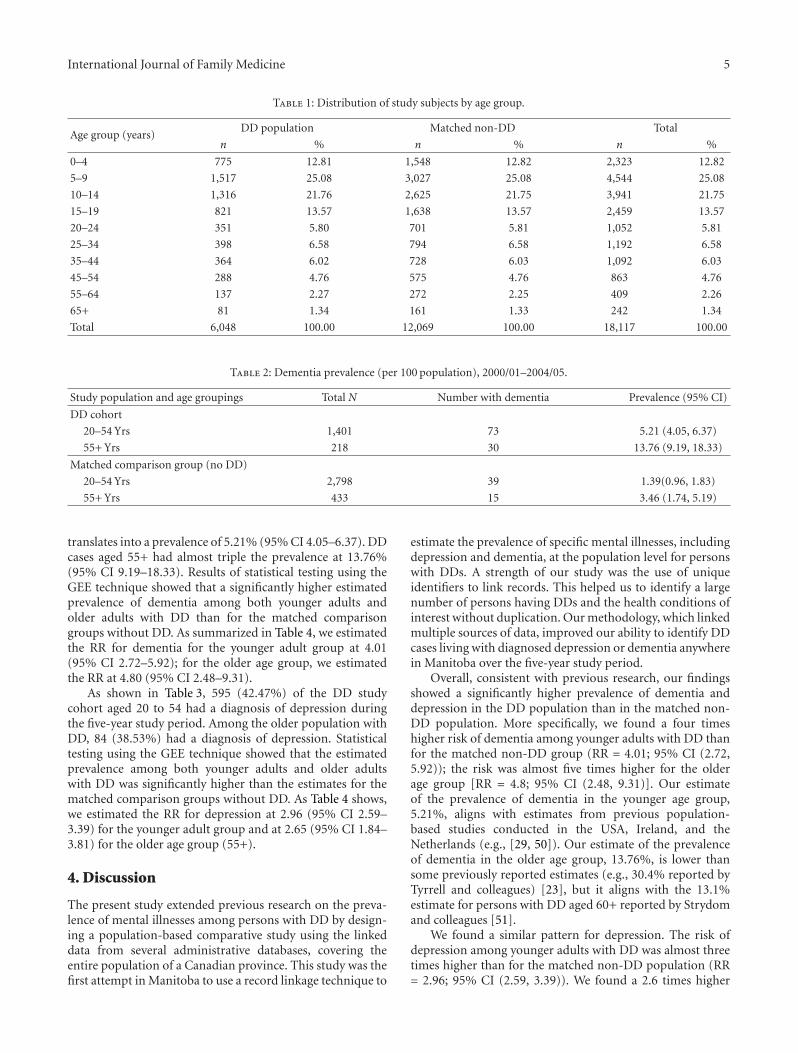
International Journal of Family Medicine 5
Table 1: Distribution of study subjects by age group.
Age group (years)DD population Matched non-DD Total
n % n % n %
0–4 775 12.81 1,548 12.82 2,323 12.82
5–9 1,517 25.08 3,027 25.08 4,544 25.08
10–14 1,316 21.76 2,625 21.75 3,941 21.75
15–19 821 13.57 1,638 13.57 2,459 13.57
20–24 351 5.80 701 5.81 1,052 5.81
25–34 398 6.58 794 6.58 1,192 6.58
35–44 364 6.02 728 6.03 1,092 6.03
45–54 288 4.76 575 4.76 863 4.76
55–64 137 2.27 272 2.25 409 2.26
65+ 81 1.34 161 1.33 242 1.34
Total 6,048 100.00 12,069 100.00 18,117 100.00
Table 2: Dementia prevalence (per 100 population), 2000/01–2004/05.
Study population and age groupings Total N Number with dementia Prevalence (95% CI)
DD cohort
20–54 Yrs 1,401 73 5.21 (4.05, 6.37)
55+ Yrs 218 30 13.76 (9.19, 18.33)
Matched comparison group (no DD)
20–54 Yrs 2,798 39 1.39(0.96, 1.83)
55+ Yrs 433 15 3.46 (1.74, 5.19)
translates into a prevalence of 5.21% (95% CI 4.05–6.37). DDcases aged 55+ had almost triple the prevalence at 13.76%(95% CI 9.19–18.33). Results of statistical testing using theGEE technique showed that a significantly higher estimatedprevalence of dementia among both younger adults andolder adults with DD than for the matched comparisongroups without DD. As summarized in Table 4, we estimatedthe RR for dementia for the younger adult group at 4.01(95% CI 2.72–5.92); for the older age group, we estimatedthe RR at 4.80 (95% CI 2.48–9.31).
As shown in Table 3, 595 (42.47%) of the DD studycohort aged 20 to 54 had a diagnosis of depression duringthe five-year study period. Among the older population withDD, 84 (38.53%) had a diagnosis of depression. Statisticaltesting using the GEE technique showed that the estimatedprevalence among both younger adults and older adultswith DD was significantly higher than the estimates for thematched comparison groups without DD. As Table 4 shows,we estimated the RR for depression at 2.96 (95% CI 2.59–3.39) for the younger adult group and at 2.65 (95% CI 1.84–3.81) for the older age group (55+).
4. Discussion
The present study extended previous research on the preva-lence of mental illnesses among persons with DD by design-ing a population-based comparative study using the linkeddata from several administrative databases, covering theentire population of a Canadian province. This study was thefirst attempt in Manitoba to use a record linkage technique to
estimate the prevalence of specific mental illnesses, includingdepression and dementia, at the population level for personswith DDs. A strength of our study was the use of uniqueidentifiers to link records. This helped us to identify a largenumber of persons having DDs and the health conditions ofinterest without duplication. Our methodology, which linkedmultiple sources of data, improved our ability to identify DDcases living with diagnosed depression or dementia anywherein Manitoba over the five-year study period.
Overall, consistent with previous research, our findingsshowed a significantly higher prevalence of dementia anddepression in the DD population than in the matched non-DD population. More specifically, we found a four timeshigher risk of dementia among younger adults with DD thanfor the matched non-DD group (RR = 4.01; 95% CI (2.72,5.92)); the risk was almost five times higher for the olderage group [RR = 4.8; 95% CI (2.48, 9.31)]. Our estimateof the prevalence of dementia in the younger age group,5.21%, aligns with estimates from previous population-based studies conducted in the USA, Ireland, and theNetherlands (e.g., [29, 50]). Our estimate of the prevalenceof dementia in the older age group, 13.76%, is lower thansome previously reported estimates (e.g., 30.4% reported byTyrrell and colleagues) [23], but it aligns with the 13.1%estimate for persons with DD aged 60+ reported by Strydomand colleagues [51].
We found a similar pattern for depression. The risk ofdepression among younger adults with DD was almost threetimes higher than for the matched non-DD population (RR= 2.96; 95% CI (2.59, 3.39)). We found a 2.6 times higher

6 International Journal of Family Medicine
Table 3: Depression prevalence per 100 population, 2000/01–2004/05.
Study population and age group Total N Number with depression Prevalence (95% CI)
DD cohort
20–54 Yrs 1,401 595 42.47 (39.88, 45.06)
55+ Yrs 218 84 38.53 (32.07, 44.99)
Matched comparison group
20–54 Yrs 2,798 559 19.98 (18.50, 21.46)
55+ Yrs 433 83 19.17 (15.46, 22.88)
Table 4: Age-specific depression and dementia RRs comparingthose with a DD diagnosis to the matched cohort without a DDdiagnosis.
Risk Ratio 95% Confidence limits
Lower Higher
Dementia
20–54 Yrs 4.01∗ 2.72 5.92
55+ Yrs 4.80∗ 2.48 9.31
Depression
20–54 Yrs 2.96∗ 2.59 3.39
55+ Yrs 2.65∗ 1.84 3.81∗P < 0.0001
risk of depression among older adults with DD than forthe matched non-DD population (RR = 2.65; 95% CI (1.84,3.81)). Our estimate of the risk of depression among thenon-DD population, in both the younger (19.97%) and olderage groups (19.18%) in our study, was very similar to thereported five-year estimate of depression among the generalpopulation of Manitoba aged 10+ (18.2%) [34].
We estimated the prevalence of depression for theyounger DD population at 42.5%, which agrees with thereported estimate of 43.9% in a study conducted in the WestMidlands in England [8]. It is, however, much higher thanthe reported estimates of 2.2% [9], 4.3% [14], 8% [11], or11.1% [7] previously reported. The huge variations foundin the prevalence estimates might arise from a number offactors, including variations in the studied populations. Ourstudy used administrative data to identify DD cases andincluded those with IDs and/or ASDs. Some previous studiesfocused on the risk of depression among persons with IDonly [7–9], autism only [10], or a specific type of ID only(e.g., Down syndrome) [12]. Other possible contributingfactors include the data source and the type of informationgathered to identify cases with depression. This study usedpopulation-based administrative data to identify cases withdepression. More specifically, we used clinical diagnoses orinformation about prescribed medications to identify thosewith indications of depression. This method of identifyingcases differs from the methods used in prior studies.Some studies used standardized checklists—for example,the Psychopathology in Autism Checklist [15]—or involvedinterviews with clients and their care providers (e.g., [8]).In addition, some studies only considered cases with severe
depression (e.g., [14]). Our study did not distinguish amongdifferent types of depression and included all diagnosedcases.
Note that, overall, our reported rates of depression anddementia seem high; this could be due to our reliance ondiagnostic codes rather than the definitive diagnoses madeby trained specialists for depression or dementia amongthis particular population. Thus, we may well have includedmany mild forms of depression not normally included insevere and major depression criteria, as well as cases ofmisdiagnosed dementia. Over the last few decades, manyscholars and researchers have noted and discussed thecomplexity of diagnosis and taxonomy of psychopathologicalconditions in persons with DDs. For example, Verhoevenand Tuinier (1997) emphasized the atypical presentationof psychopathological conditions in persons with mentalretardation (MR). They described atypical psychopatho-logical presentations, for instance—such as self-injuriousbehaviour and other challenging behaviours—as symptomsof depressive disorder [52]. In addition to atypical presenta-tions of psychopathological conditions by persons with MR,evidence from factor analytic studies indicates that specificpsychopathological conditions or symptoms, not classifiedelsewhere, exist among persons with MR [53, 54]. Therefore,others have questioned the utility of routine diagnosticcriteria for major psychiatric diagnosis among persons withDD, and in particular for those with MR. In this study,we used administrative data sources and mainly clinicaldiagnoses to estimate prevalence of depression and dementia.Thus, it is important to note that our prevalence estimatesare reflective of “administrative prevalence” rather than thetrue prevalence of conditions at the population level. Thetrue prevalence of the conditions of interest can only beobtained by screening population using standard diagnosticcriteria and clinical assessments or by means of well-designedepidemiological surveys.
Our study has several other limitations relevant to anyinterpretation of the results. First, we used administrativedata to identify DD cases. Although we used several admin-istrative databases, we very likely failed to identify all DDcases living in Manitoba, since some people with DD maynever have used the existing health services or social supportsystems or may not have been diagnosed as having a DD. Sec-ond, we used only five years of administrative data to identifyboth DD cases and the mental health conditions of interest. Aperson with dementia or depression might not have had thatparticular diagnosis noted in their medical records within
International Journal of Family Medicine 7
the five years of the study. As a result, this study wouldnot have classified such a person as having dementia ordepression. Having said that, it is important to note thatMCHP researchers validated the dementia and depressionoperational case definitions based on the health administra-tive databases against other data sources (e.g., the CanadianCommunity Health Surveys) and found that they providereliable prevalence estimates at the population level [55].
Third, although we matched the DD cases with non-DD controls based on age, sex, and place of residence for amore accurate and fair comparison, we selected our controlgroup from the general population. This method of selectingthe control group may have introduced some bias, leadingto the higher risk ratios obtained in our study. We knowthat those accessing the health care system (using physiciansor hospitals) may have higher rates of comorbidity; theymay also receive more comprehensive medical examinations,which could increase their rates of diagnosed conditions—which, in fact, may have affected the rates estimated in thisstudy.
We want to acknowledge several other limitations of thisstudy. We based our prevalence estimates on several healthadministrative databases, including data from physicianclaims. In remote areas of northern Manitoba, nurses (ratherthan physicians) deliver a high proportion of primary care;since administrative databases do not capture those services,even for mental health issues, this would skew our estimatedrates.
Also, as mentioned earlier in the Methods section, weexcluded persons from the data sets who had DD and residedin a PCH or were listed with a Public Trustee postal code.Although we explained this decision, we acknowledge that itmay have affected our results by excluding a disproportionatenumber of persons with DD in our original sample who haddementia.
Despite these several acknowledged limitations, thepresent study stands as the first attempt to use provincialadministrative databases to examine mental health issuesfor persons with DD at the population level. Accuratepopulation-level information on the mental health statusand conditions of persons with DD is needed for planningand providing services to meet the specific needs of thisvulnerable population. The significant disparities this studyfound in rates of depression and dementia between personswith and without DD should alert health officials andauthorities to the level of mental health needs of personswith DD. The existing policies regarding “community living”and “aging in place” encourage persons with disabilities andthose with DD to access the mainstream health services, evenfor mental health problems. Studies which focused on accessto specialized health services, including access to psychiatricservices by persons with DD, remain rare, but these studiesdescribe finding a number of barriers [24, 56]. To reducedisparities in mental health, those involved in planningand providing services to this population should focuson the barriers to accessing mental health services. Also,we must train health care professionals, including familyphysicians, to screen and assess mental health conditions andproblems common among persons with DDs. Furthermore,
we need more specialized training for medical staff, includingphysicians, to assist them with early detection and theprovision of quality care to this population.
Researchers recommend prevention as a strategy forreducing disparities in health, including mental health,between persons with and without DD (e.g., [57]). Pre-ventive strategies should focus on modifiable risk factors,including promotion of physical activity, mental leisureactivities, and social inclusion and participation—as wellas providing meaningful job opportunities and adequatenutrition. Studies also highly recommend early diagnosis anddetection of mental illnesses and management of symptomsand behaviours to minimize further complications [58]. Ourresearch findings advocate for an increase in population-based epidemiological research studies targeting the preva-lence of mental illnesses and disorders among individualswith DD. We need such research to better understand theextent and scope of mental illnesses in this populationand how they vary by age, geography, sex, and diagnosticcategories (e.g., mental retardation, ASDs, FASDs). We alsosuggest that future research consider access to health care,and in particular access to specialized care, as well ascontinuity of care.
Disclosure
The results and conclusions are those of the authors, andno official endorsement by the Manitoba Centre for HealthPolicy, Manitoba Health, or other data providers is intendedor should be inferred.
Acknowledgments
The authors thank Manitoba Health and the ManitobaCentre for Health Policy, as well as the Department ofEducation and the Department of Family Services andConsumer Affairs, for data access and sharing. This researchwas supported by a research grant from the University ofManitoba to Dr. S. Shooshtari (UM Project no. 30969, 2006-2007). Dr. P. J. Martens would also like to acknowledgeher CIHR/PHAC Applied Public Health Chair award (2008–2013). The authors acknowledge the Manitoba Centre forHealth Policy for allowing the use of data contained in thePopulation Health Research Data Repository under Project(HIPC no. 2006/2007–29).
References
[1] National Coalition on Dual Diagnosis. Dual Diagnosis Glos-sary, 2008, http://care-id.com/images/File/glossary.doc.
[2] A. Strydom, S. Shooshtari, L. Lee et al., “Dementia inolder adults with intellectual disabilities—epidemiology, pre-sentation, and diagnosis,” Journal of Policy and Practice inIntellectual Disabilities, vol. 7, no. 2, pp. 96–110, 2010.
[3] M. Haveman, T. Heller, L. Lee, M. Maaskant, S. Shooshtari,and A. Strydom, “Major health risks in aging persons withintellectual disabilities: an overview of recent studies,” Journalof Policy and Practice in Intellectual Disabilities, vol. 7, no. 1,pp. 59–69, 2010.
8 International Journal of Family Medicine
[4] H. Ouellette-Kuntz, N. Garcin, M. E. S. Lewis, P. Minnes, C.Martin, and J. J. A. Holden, “Addressing health disparitiesthrough promoting equity for individuals with intellectualdisability,” Canadian Journal of Public Health, vol. 96, supple-ment 2, pp. S8–S22, 2005.
[5] National Coalition on Dual Diagnosis. Dual Diagnosis Posi-tion, 2010, http://www.camh.net/Public policy/Public policypapers/Positionstatement.pdf.
[6] H. Oddbjorn and O. E. Havik, “Mental disorders and problembehaviour in a community sample of adults with intellectualdisability: three-month prevalence and co-morbidity,” Journalof Mental Health Research in Intellectual Disabilities, vol. 1, no.4, pp. 223–237, 2008.
[7] S. A. Cooper and R. A. Collacott, “Clinical features anddiagnostic criteria of depression in Down’s syndrome,” TheBritish Journal of Psychiatry, vol. 165, pp. 399–403, 1994.
[8] G. M. Marston, D. W. Perry, and A. Roy, “Manifestations ofdepression in people with intellectual disability,” Journal ofIntellectual Disability Research, vol. 41, no. 6, pp. 476–480,1997.
[9] S. Deb, M. Thomas, and C. Bright, “Mental disorder inadults with intellectual disability. I: prevalence of functionalpsychiatric illness among a community-based population agedbetween 16 and 64 years,” Journal of Intellectual DisabilityResearch, vol. 45, no. 6, pp. 495–505, 2001.
[10] M. Ghaziuddin, N. Ghaziuddin, and J. Greden, “Depressionin persons with autism: implications for research and clinicalcare,” Journal of Autism and Developmental Disorders, vol. 32,no. 4, pp. 299–306, 2002.
[11] P. White, D. Chant, N. Edwards, C. Townsend, and G.Waghorn, “Prevalence of intellectual disability and comorbidmental illness in an Australian community sample,” Australianand New Zealand Journal of Psychiatry, vol. 39, no. 5, pp. 395–400, 2005.
[12] M. McCarron, M. Gill, P. McCallion, and C. Begley, “Healthco-morbidities in ageing persons with Down syndromeand Alzheimer’s dementia,” Journal of Intellectual DisabilityResearch, vol. 49, no. 7, pp. 560–566, 2005.
[13] S. A. Cooper, E. Smiley, J. Morrison, A. Williamson, and L.Allan, “Mental ill-health in adults with intellectual disabilities:prevalence and associated factors,” The British Journal ofPsychiatry, vol. 190, pp. 27–35, 2007.
[14] S. Bhaumik, F. C. Tyrer, C. Mcgrother, and S. K. Ganghadaran,“Psychiatric service use and psychiatric disorders in adultswith intellectual disability,” Journal of Intellectual DisabilityResearch, vol. 52, no. 11, pp. 986–995, 2008.
[15] T. L. Bakken, S. B. Helverschou, D. E. Eilertsen, T. Heggelund,E. Myrbakk, and H. Martinsen, “Psychiatric disorders inadolescents and adults with autism and intellectual disability:a representative study in one county in Norway,” Research inDevelopmental Disabilities, vol. 31, no. 6, pp. 1669–1677, 2010.
[16] Y. Lunsky and R. Balogh, “Dual diagnosis: a national studyof psychiatric hospitalization patterns of people with develop-mental disability,” The Canadian Journal of Psychiatry, vol. 55,no. 11, pp. 721–728, 2010.
[17] L. Martin, J. P. Hirdes, and B. E. Fries, “Examining thecharacteristics of persons with intellectual disability receivinghospital services: part I- psychiatric hospital/units,” Journal ofDevelopmental Disabilities, vol. 13, pp. 90–103, 2007.
[18] Y. Lunsky, N. Garcin, D. Morin, V. Cobigo, and E. Bradley,“Mental health services for individuals with intellectual dis-abilities in Canada: findings from a national survey,” Journal
of Applied Research in Intellectual Disabilities, vol. 20, no. 5,pp. 439–447, 2007.
[19] R. S. Balogh, D. Hunter, and H. Ouellette-Kuntz, “Hospitalutilization among persons with an intellectual disability,Ontario, Canada, 1995–2001,” Journal of Applied Research inIntellectual Disabilities, vol. 18, no. 2, pp. 181–190, 2005.
[20] P. Burge, H. Ouellette-Kuntz, H. Saeed, B. McCreary, D.Paquette, and F. Sim, “Acute psychiatric inpatient care forpeople with a dual diagnosis: patient profiles and lengths ofstay,” The Canadian Journal of Psychiatry, vol. 47, no. 3, pp.243–249, 2002.
[21] D. Addington, J. M. Addington, and I. Ens, “Mentally retardedpatients on general hospital psychiatric units,” The CanadianJournal of Psychiatry, vol. 38, no. 2, pp. 134–136, 1993.
[22] Y. Lunsky, “Depressive symptoms in intellectual disability:does gender play a role?” Journal of Intellectual DisabilityResearch, vol. 47, no. 6, pp. 417–427, 2003.
[23] H. Saeed, H. Ouellette-Kuntz, H. Stuart, and P. Burge,“Length of stay for psychiatric inpatient services: a comparisonof admissions of people with and without developmentaldisabilities,” Journal of Behavioral Health Services and Research,vol. 30, no. 4, pp. 406–417, 2003.
[24] Y. Lunsky, E. A. Bradley, C. D. Gracey, J. Durbin, and C. Koegl,“Gender differences in psychiatric diagnoses among inpatientswith and without intellectual disabilities,” American Journal onIntellectual and Developmental Disabilities, vol. 114, no. 1, pp.52–60, 2009.
[25] Y. Lunsky, C. Gracey, and E. Bradley, “Adults with autismspectrum disorders using psychiatric hospitals in Ontario:clinical profile and service needs,” Research in Autism SpectrumDisorders, vol. 3, no. 4, pp. 1006–1013, 2009.
[26] Statistics Canada. A profile of disability in Canada, 2001.Ottawa, Canada, Minister of Industry, Catalogue No. 89-579-XIE, 2002.
[27] L. A. Schraffenberger, “New ICD-9-CM diagnosis codesfor FY 2010,” Journal of the American Health InformationManagement Association, vol. 80, no. 9, pp. 66–69, 2009.
[28] American Psychiatric Association, Diagnostic and StatisticalManual of Mental Disorders, American Psychiatric Associa-tion, Washington, DC, USA, 4th edition, 2000.
[29] M. P. Janicki and A. J. Dalton, “Prevalence of dementia andimpact on intellectual disability services,” Mental Retardation,vol. 38, no. 3, pp. 276–288, 2000.
[30] J. Tyrrell, M. Cosgrave, M. McCarron et al., “Dementiain people with Down’s syndrome,” International Journal ofGeriatric Psychiatry, vol. 16, no. 12, pp. 1168–1174, 2001.
[31] A. Strydom, L. A. Lee, N. Jokinen et al., Report on theState of Science on Dementia in People with Intellectual Dis-abilities. IASSID Special Interest Research Group on Ageingand Intellectual Disabilities, 2009, http://www.iassid.org/pdf/dementia iassid report fin%5B1%5D.pdf.
[32] World Health Organization, International Classification ofFunctioning Disability and Health, World Health Organization,Geneva, Switzerland, 2001.
[33] S. B. Patten, L. W. Jian, J. V. A. Williams et al., “Descriptiveepidemiology of major depression in Canada,” The CanadianJournal of Psychiatry, vol. 51, no. 2, pp. 84–90, 2006.
[34] P. J. Martens, R. Fransoo, The Need To Know Team et al.,Patterns of Regional Mental Illness Disorder Diagnoses andService Use in Manitoba: A Population-Based Study, ManitobaCentre for Health Policy, Winnipeg, Canada, 2004.
[35] Statistics Canada. Census: Portrait of the Canadian popula-tion, by age and sex, Catalogue No. 97-551-XWE, 2006.

International Journal of Family Medicine 9
[36] E. Ng, “Disability among Canada’s aboriginal peoples in 1991,”Health Reports, vol. 8, no. 1, pp. 25–32, 1996.
[37] M. Brownell, T. Mayer, P. J. Martens et al., “Using a popu-lation-based health information system to study child health,”Canadian Journal of Public Health, vol. 93, supplement 2, pp.S9–S14, 2002.
[38] L. L. Roos and P. P. Nicol, “A research registry: uses,development, and accuracy,” Journal of Clinical Epidemiology,vol. 52, no. 1, pp. 39–47, 1999.
[39] N. P. Roos and E. Shapiro, “Revisiting the Manitoba Centre forHealth Policy and Evaluation and its population-based healthinformation system,” Medical Care, vol. 37, no. 6, Supplement,pp. JS10–JS14, 1999.
[40] L. L. Roos, J. P. Nicol, and S. M. Cageorge, “Using administra-tive data for longitudinal research: comparisons with primarydata collection,” Journal of Chronic Diseases, vol. 40, no. 1, pp.41–49, 1987.
[41] J. R. Robinson and D. J. Tataryn, “Reliability of the ManitobaMental Health Management Information System for research,”The Canadian Journal of Psychiatry, vol. 42, no. 7, pp. 744–749,1997.
[42] Manitoba Centre for Health Policy. Population Health Re-search Data Repository, 2009, http://umanitoba.ca/faculties/medicine/units/mchp/resources/repository/index.html.
[43] World Health Organization. International Classification ofDiseases. Manual of the International Statistical Classificationof disease, injuries, and causes of death. 9th revision. Geneva,Switzerland, World Health Organization, 1977.
[44] H. Ouellette-Kuntz, S. Shooshtari, B. Temple et al., “Esti-mating administrative prevalence of intellectual disabilities inManitoba,” Journal on Developmental Disabilities, vol. 15, no.3, pp. 69–80, 2009.
[45] Manitoba Health, A Strategy for Alzheimer Disease and RelatedDementias in Manitoba, Manitoba Health, Winnipeg, Canada,2002.
[46] P. J. Martens, R. Fransoo, The Need To Know Team etal., The Manitoba RHA Indicators Atlas: Population-BasedComparisons of Health and Health Care Use, Manitoba Centrefor Health Policy, Winnipeg, Canada, 2003.
[47] R. Fransoo, P. Martens, E. Burland, and The Need to KnowTeam, Manitoba RHA Indicators Atlas 2009, Manitoba Centrefor Health Policy, Winnipeg, Canada, 2009.
[48] P. J. Martens, M. Brownell, W. Au et al., Health Inequities inManitoba: Is the Socioeconomic Gap Widening or NarrowingOver Time? Manitoba Centre for Health Policy, Winnipeg,Canada, 2010.
[49] D. Spiegelman and E. Hertzmark, “Easy SAS calculations forrisk or prevalence ratios and differences,” American Journal ofEpidemiology, vol. 162, no. 3, pp. 199–200, 2005.
[50] H. M. J. Van Schrojenstein Lantman-de Valk, M. Van denAkker, M. A. Maaskant et al., “Prevalence and incidence ofhealth problems in people with intellectual disability,” Journalof Intellectual Disability Research, vol. 41, no. 1, pp. 42–51,1997.
[51] A. Strydom, A. Hassiotis, M. King, and G. Livingston, “Therelationship of dementia prevalence in older adults withintellectual disability (ID) to age and severity of ID,” Psycho-logical Medicine, vol. 39, no. 1, pp. 13–21, 2009.
[52] W. M. A. Verhoeven and S. Tuinier, “Neuropsychiatric con-sultation in mentally retarded patients: a clinical report,”European Psychiatry, vol. 12, no. 5, pp. 242–248, 1997.
[53] A. G. Aman, Assessing Psychopathology and Behavior Problemsin Persons with Mental Retardation: A Review of AvailableInstruments, US Department of Health and Human Develop-ment, Rockville, Md, USA, 1991.
[54] S. L. Einfeld and M. Aman, “Issues in the taxonomy ofpsychopathology in mental retardation,” Journal of Autism andDevelopmental Disorders, vol. 25, no. 2, pp. 143–167, 1995.
[55] L. Lix, M. Yogendran, C. Burchill et al., Defining and ValidatingChronic Diseases: An Administrative Data Approach, ManitobaCentre for Health Policy, Winnipeg, Canada, 2006.
[56] R. Martın-Santos, F. Fonseca, A. Domingo-Salvany et al.,“Dual diagnosis in the psychiatric emergency room in Spain,”European Journal of Psychiatry, vol. 20, no. 3, pp. 147–156,2006.
[57] A. P. Morrissey, “Health disparities among individuals withdevelopmental disabilities: partnerships for change,” in AReport from an International Conference on Health Disparitiesamong Individuals with Developmental Disabilities: An Agendafor Change, Westchester Institute for Human Development,Valhalla, NY, USA, 2005.
[58] N. Lennox, H. Beange, T. Parmenter et al., “Health guidelinesfor adults with an intellectual disability,” Clinical Bulletin of theDevelopmental Disabilities Program, vol. 13, no. 3, 2002.
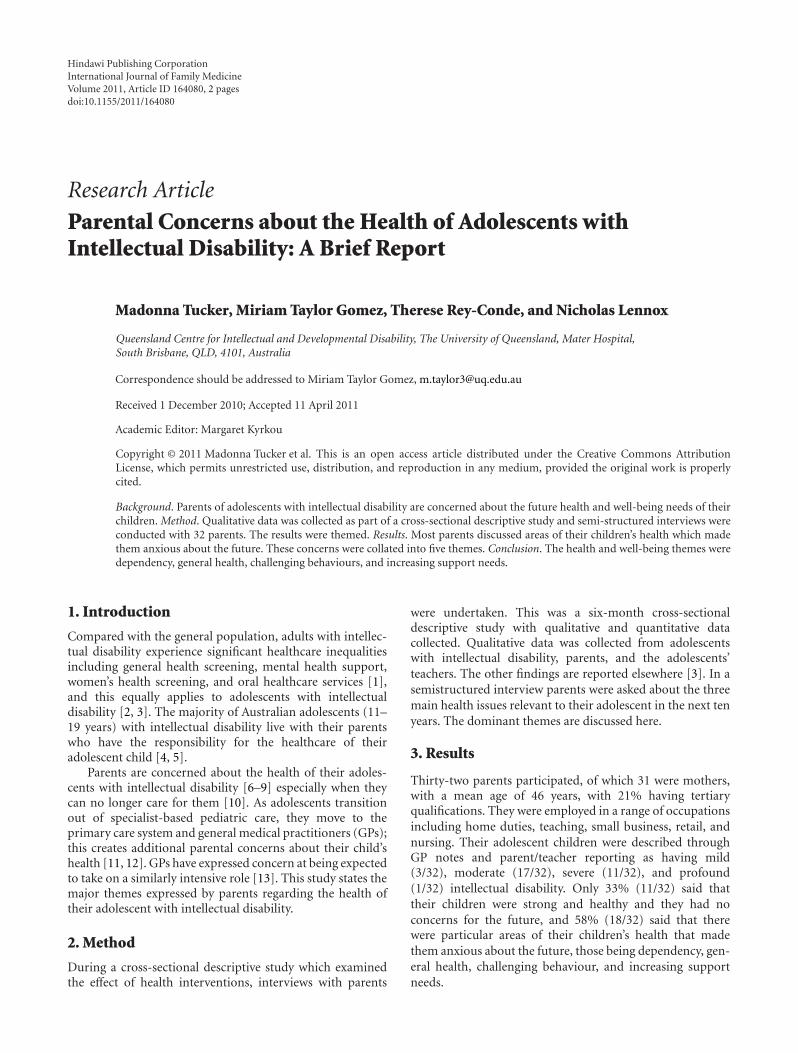
Hindawi Publishing CorporationInternational Journal of Family MedicineVolume 2011, Article ID 164080, 2 pagesdoi:10.1155/2011/164080
Research Article
Parental Concerns about the Health of Adolescents withIntellectual Disability: A Brief Report
Madonna Tucker, Miriam Taylor Gomez, Therese Rey-Conde, and Nicholas Lennox
Queensland Centre for Intellectual and Developmental Disability, The University of Queensland, Mater Hospital,South Brisbane, QLD, 4101, Australia
Correspondence should be addressed to Miriam Taylor Gomez, [email protected]
Received 1 December 2010; Accepted 11 April 2011
Academic Editor: Margaret Kyrkou
Copyright © 2011 Madonna Tucker et al. This is an open access article distributed under the Creative Commons AttributionLicense, which permits unrestricted use, distribution, and reproduction in any medium, provided the original work is properlycited.
Background. Parents of adolescents with intellectual disability are concerned about the future health and well-being needs of theirchildren. Method. Qualitative data was collected as part of a cross-sectional descriptive study and semi-structured interviews wereconducted with 32 parents. The results were themed. Results. Most parents discussed areas of their children’s health which madethem anxious about the future. These concerns were collated into five themes. Conclusion. The health and well-being themes weredependency, general health, challenging behaviours, and increasing support needs.
1. Introduction
Compared with the general population, adults with intellec-tual disability experience significant healthcare inequalitiesincluding general health screening, mental health support,women’s health screening, and oral healthcare services [1],and this equally applies to adolescents with intellectualdisability [2, 3]. The majority of Australian adolescents (11–19 years) with intellectual disability live with their parentswho have the responsibility for the healthcare of theiradolescent child [4, 5].
Parents are concerned about the health of their adoles-cents with intellectual disability [6–9] especially when theycan no longer care for them [10]. As adolescents transitionout of specialist-based pediatric care, they move to theprimary care system and general medical practitioners (GPs);this creates additional parental concerns about their child’shealth [11, 12]. GPs have expressed concern at being expectedto take on a similarly intensive role [13]. This study states themajor themes expressed by parents regarding the health oftheir adolescent with intellectual disability.
2. Method
During a cross-sectional descriptive study which examinedthe effect of health interventions, interviews with parents
were undertaken. This was a six-month cross-sectionaldescriptive study with qualitative and quantitative datacollected. Qualitative data was collected from adolescentswith intellectual disability, parents, and the adolescents’teachers. The other findings are reported elsewhere [3]. In asemistructured interview parents were asked about the threemain health issues relevant to their adolescent in the next tenyears. The dominant themes are discussed here.
3. Results
Thirty-two parents participated, of which 31 were mothers,with a mean age of 46 years, with 21% having tertiaryqualifications. They were employed in a range of occupationsincluding home duties, teaching, small business, retail, andnursing. Their adolescent children were described throughGP notes and parent/teacher reporting as having mild(3/32), moderate (17/32), severe (11/32), and profound(1/32) intellectual disability. Only 33% (11/32) said thattheir children were strong and healthy and they had noconcerns for the future, and 58% (18/32) said that therewere particular areas of their children’s health that madethem anxious about the future, those being dependency, gen-eral health, challenging behaviour, and increasing supportneeds.
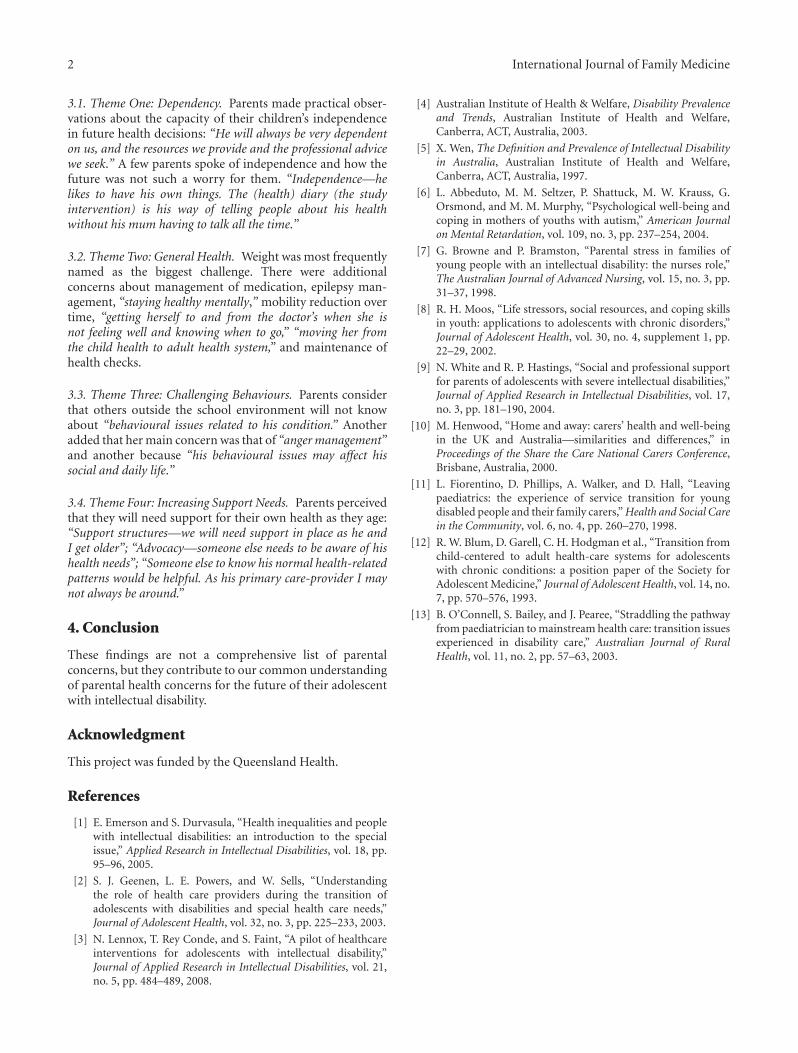
2 International Journal of Family Medicine
3.1. Theme One: Dependency. Parents made practical obser-vations about the capacity of their children’s independencein future health decisions: “He will always be very dependenton us, and the resources we provide and the professional advicewe seek.” A few parents spoke of independence and how thefuture was not such a worry for them. “Independence—helikes to have his own things. The (health) diary (the studyintervention) is his way of telling people about his healthwithout his mum having to talk all the time.”
3.2. Theme Two: General Health. Weight was most frequentlynamed as the biggest challenge. There were additionalconcerns about management of medication, epilepsy man-agement, “staying healthy mentally,” mobility reduction overtime, “getting herself to and from the doctor’s when she isnot feeling well and knowing when to go,” “moving her fromthe child health to adult health system,” and maintenance ofhealth checks.
3.3. Theme Three: Challenging Behaviours. Parents considerthat others outside the school environment will not knowabout “behavioural issues related to his condition.” Anotheradded that her main concern was that of “anger management”and another because “his behavioural issues may affect hissocial and daily life.”
3.4. Theme Four: Increasing Support Needs. Parents perceivedthat they will need support for their own health as they age:“Support structures—we will need support in place as he andI get older”; “Advocacy—someone else needs to be aware of hishealth needs”; “Someone else to know his normal health-relatedpatterns would be helpful. As his primary care-provider I maynot always be around.”
4. Conclusion
These findings are not a comprehensive list of parentalconcerns, but they contribute to our common understandingof parental health concerns for the future of their adolescentwith intellectual disability.
Acknowledgment
This project was funded by the Queensland Health.
References
[1] E. Emerson and S. Durvasula, “Health inequalities and peoplewith intellectual disabilities: an introduction to the specialissue,” Applied Research in Intellectual Disabilities, vol. 18, pp.95–96, 2005.
[2] S. J. Geenen, L. E. Powers, and W. Sells, “Understandingthe role of health care providers during the transition ofadolescents with disabilities and special health care needs,”Journal of Adolescent Health, vol. 32, no. 3, pp. 225–233, 2003.
[3] N. Lennox, T. Rey Conde, and S. Faint, “A pilot of healthcareinterventions for adolescents with intellectual disability,”Journal of Applied Research in Intellectual Disabilities, vol. 21,no. 5, pp. 484–489, 2008.
[4] Australian Institute of Health & Welfare, Disability Prevalenceand Trends, Australian Institute of Health and Welfare,Canberra, ACT, Australia, 2003.
[5] X. Wen, The Definition and Prevalence of Intellectual Disabilityin Australia, Australian Institute of Health and Welfare,Canberra, ACT, Australia, 1997.
[6] L. Abbeduto, M. M. Seltzer, P. Shattuck, M. W. Krauss, G.Orsmond, and M. M. Murphy, “Psychological well-being andcoping in mothers of youths with autism,” American Journalon Mental Retardation, vol. 109, no. 3, pp. 237–254, 2004.
[7] G. Browne and P. Bramston, “Parental stress in families ofyoung people with an intellectual disability: the nurses role,”The Australian Journal of Advanced Nursing, vol. 15, no. 3, pp.31–37, 1998.
[8] R. H. Moos, “Life stressors, social resources, and coping skillsin youth: applications to adolescents with chronic disorders,”Journal of Adolescent Health, vol. 30, no. 4, supplement 1, pp.22–29, 2002.
[9] N. White and R. P. Hastings, “Social and professional supportfor parents of adolescents with severe intellectual disabilities,”Journal of Applied Research in Intellectual Disabilities, vol. 17,no. 3, pp. 181–190, 2004.
[10] M. Henwood, “Home and away: carers’ health and well-beingin the UK and Australia—similarities and differences,” inProceedings of the Share the Care National Carers Conference,Brisbane, Australia, 2000.
[11] L. Fiorentino, D. Phillips, A. Walker, and D. Hall, “Leavingpaediatrics: the experience of service transition for youngdisabled people and their family carers,” Health and Social Carein the Community, vol. 6, no. 4, pp. 260–270, 1998.
[12] R. W. Blum, D. Garell, C. H. Hodgman et al., “Transition fromchild-centered to adult health-care systems for adolescentswith chronic conditions: a position paper of the Society forAdolescent Medicine,” Journal of Adolescent Health, vol. 14, no.7, pp. 570–576, 1993.
[13] B. O’Connell, S. Bailey, and J. Pearee, “Straddling the pathwayfrom paediatrician to mainstream health care: transition issuesexperienced in disability care,” Australian Journal of RuralHealth, vol. 11, no. 2, pp. 57–63, 2003.

Hindawi Publishing CorporationInternational Journal of Family MedicineVolume 2011, Article ID 601979, 6 pagesdoi:10.1155/2011/601979
Research Article
Parental Perceptions of a Manchester Service forAutistic Spectrum Disorders
Mischa Mockett,1 Jamila Khan,2 and Louise Theodosiou1
1 Child and Adolescent Psychiatry, The Winnicott Centre, Manchester M13 0JE, UK2 University of Manchester, Manchester M13 9PL, UK
Correspondence should be addressed to Mischa Mockett, [email protected]
Received 9 November 2010; Accepted 14 March 2011
Academic Editor: Jacqueline Small
Copyright © 2011 Mischa Mockett et al. This is an open access article distributed under the Creative Commons AttributionLicense, which permits unrestricted use, distribution, and reproduction in any medium, provided the original work is properlycited.
Background. User feedback is now an integral part of both clinical governance and service development, and it also provides akey route to engaging parents and children. Autistic spectrum disorders (ASDs) can impact on all members of a family, and closeworking between parents and professionals is essential. Aim. To explore parental satisfaction rates and identify areas in need ofimprovement. Method. A postal survey was completed by parents whose children had been diagnosed with an ASD in the past18 months in a Manchester Child and Adolescent Mental Health Service. The National Autism Plan for Children was used as agold standard. Results. Parents were particularly satisfied with the way team members dealt with them and their children duringappointments. However, the standard of written information provided about the condition, diagnosis, and support available couldbe improved. The findings show the benefits of receiving a diagnosis in the recommended timeframe. Discussion. We discuss waysof effectively using scarce resources.
1. Introduction
Autistic spectrum disorders (ASDs) are developmental dis-orders estimated to affect 1 in 150 children [1]. They arecharacterised by social communication impairments, limitedimagination, and repetitive behaviours. Learning difficultiesare overrepresented, but not always present. Increasing pro-fessional awareness has led to higher levels of diagnosis andsupport, possibly explaining the recorded rise in prevalenceover the last 30 years [2]. ASD is commoner in males (M : Fautism 4 : 1, aspergers 10 : 1). Genetic factors are complex,and no single gene mutation or chromosome abnormalityhas been linked [3], although the condition has the highestheritability of any psychiatric disorder (approximately 90%)[4]; the risk of having a second child with autism is increasedby 20–30.
The National Autism Plan for Children (NAPC) empha-sises the importance of early intervention and close collab-oration between parents and professionals and provides agold standard for services [3]. Benefits for parents includeincreased capacity to seek information from external sourcesand make use of available health services [3].
Diagnosis of children with ASDs requires multiagencyand multidisciplinary collaboration. In 1998, an assessmentteam was established in one sector of Manchester. This ser-vice involved sessions from child and adolescent psychiatrists(CAP), community paediatricians (CP), CAMHS practition-ers, specialist speech and language therapists (SALT), andeducational psychologists (EP). The successful format wasestablished city wide in 2000. The multiagency teams arecalled Social Communication Assessment and InterventionTeams (SCAITs) [5]. Service provision within CAMHS needsto make the best use of limited resources [5].
In addition to the core symptoms, there are other com-mon features [6], such as abnormalities in sleep and mood.For a diagnosis of ASDs to be made, there must be bothsymptomatology and an impact on functioning [3]. Ifthere are concerns during developmental screens, specificscreening for autism is strongly encouraged. Parental con-cerns provide vital information for early diagnosis [3].Specific diagnostic instruments are available and should beused alongside clinical judgement. Most commonly used isthe Autism Diagnostic Observation Schedule (ADOS) [3];

2 International Journal of Family Medicine
however not all characteristics may be demonstrated duringthe test. Observations should be conducted in different set-tings including clinics, homes, and schools.
ASD is a developmental disorder; symptoms can vary inseverity at different times. Difficulties can become more ap-parent when changes in routine occur, for example, startinga new school, and this is often when children are referred.The benefits of early identification of ASDs are recognised byparents and professionals alike [3]. The diagnosis of autism,however, is often not made until 2 to 3 years after symptomsare recognized [3]. Evidence suggests that early interventioncan lead to improved outcomes for most children [7]. Ear-lier diagnosis facilitates earlier educational, social, and medi-cal support. It is also important to reduce waiting times fromreferral to intervention. There are considerable demands onparents as they accept and adjust to their child’s communica-tion and social interaction impairments [3].
Many people seek information on their own, from otherparents, websites, books, and autism groups and newsletters[3]. Children and families want accessible mental health ser-vices which provide support when needed and involve themas users. They also want to know what services are availableto help them support their child [3].
The NAPC guidelines address identification, assessment,diagnosis, and access to early interventions for children withASDs. It recommends a three-stage assessment framework.Stage 1 is a general multidisciplinary developmental assess-ment for any child with possible developmental problems.Stage 2 is a multiagency assessment. The assessment shouldbe completed and fed back to the family within 17 weeks ofreferral. A written report should be produced and discussedwith the parents. Stage 3 addresses the need for tertiary re-ferral. The local team may need this for reasons such as spe-cific advice about treatments. The NAPC states that feedbackto parents should include information about services, forexample, The National Autistic Society (NAS).
In Manchester, all SCAIT professionals receive trainingin assessing ASDs. Monthly SCAIT meetings involve liaisonwork with community paediatricians and preschool specialneeds workers. Direct referrals are accepted from generalpractitioners and paediatricians. Referrals from educationalpsychologists, health visitors, and school nurses are acceptedif the general practitioner or a paediatrician is informed. Theteam generate a plan tailored to each individual regardingdiagnosis and care.
Parent intervention programmes can enhance interac-tion with children, promote development, and increase pa-rental satisfaction and mental health [3]. SCAIT offers five2-hour sessions: Understanding ASD, Understanding andmanaging behaviour, Understanding and working with theeducation system, Enabling your child’s communication andunderstanding, and Further resources for you and your child.
2. Aim
To assess parental satisfaction with SCAIT assessments andcompare the service with the NAPC Guidelines.
Table 1: Average satisfaction rates with the assessment process.
Satisfactionwith entireprocess
Satisfactionbefore theassessment
Satisfactionwithassessmentprocess
Satisfactionwithassessmentoutcome
Satisfactionwith postdi-agnosticworkshops
71% 63% 86% 62% 57%
0
1
2
3
1 2 3 4 5 6 7 8 9 10 11 12 13 14 15 16
Freq
uen
cyAge
At present
At diagnosis
Figure 1: Ages of children participating in audit.
3. Method
Parents and carers of the 35 children diagnosed with ASDsfrom December 2008 to May 2010 were invited to participate.Questionnaires and a covering letter were sent out with aself-addressed envelope. Participants were invited to have atelephone or face-to-face alternative to complete the ques-tionnaire. The work was undertaken as an audit, thus ethicalapproval was not needed.
A previous Manchester audit tool was enhanced toprovide further information about the postdiagnostic group(Appendix 1). Questionnaires were scored according to totalsatisfaction, and satisfaction in each of the 4 areas of theassessment process. Compliance with the NAPC Guidelineswas also recorded.
4. Results
Thirty-five questionnaires were posted, and 20 (57%) parentsparticipated, with 1 father responding. Of the 20 partic-ipants, 1 parent completed the interview via telephoneand the other 19 returned the questionnaire by post. Thechild’s age at diagnosis and the present time showed 2peaks (Figure 1), consistent with transition to primary andsecondary school.
Most parents (86%) were especially satisfied with the as-sessment process (Table 1), but less happy with the informa-tion received before and after the assessment.
Most parents felt they were well informed about theassessment before the appointment, with 65% receiving
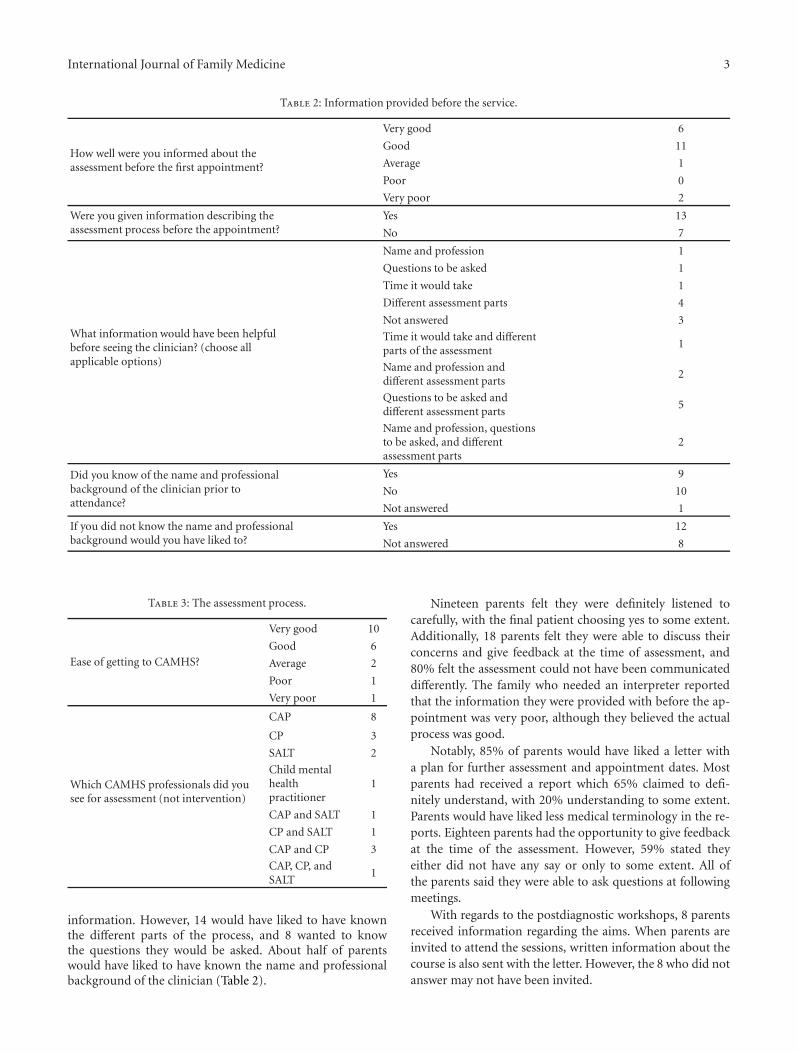
International Journal of Family Medicine 3
Table 2: Information provided before the service.
How well were you informed about theassessment before the first appointment?
Very good 6
Good 11
Average 1
Poor 0
Very poor 2
Were you given information describing theassessment process before the appointment?
Yes 13
No 7
What information would have been helpfulbefore seeing the clinician? (choose allapplicable options)
Name and profession 1
Questions to be asked 1
Time it would take 1
Different assessment parts 4
Not answered 3
Time it would take and differentparts of the assessment
1
Name and profession anddifferent assessment parts
2
Questions to be asked anddifferent assessment parts
5
Name and profession, questionsto be asked, and differentassessment parts
2
Did you know of the name and professionalbackground of the clinician prior toattendance?
Yes 9
No 10
Not answered 1
If you did not know the name and professionalbackground would you have liked to?
Yes 12
Not answered 8
Table 3: The assessment process.
Ease of getting to CAMHS?
Very good 10
Good 6
Average 2
Poor 1
Very poor 1
Which CAMHS professionals did yousee for assessment (not intervention)
CAP 8
CP 3
SALT 2
Child mentalhealthpractitioner
1
CAP and SALT 1
CP and SALT 1
CAP and CP 3
CAP, CP, andSALT
1
information. However, 14 would have liked to have knownthe different parts of the process, and 8 wanted to knowthe questions they would be asked. About half of parentswould have liked to have known the name and professionalbackground of the clinician (Table 2).
Nineteen parents felt they were definitely listened tocarefully, with the final patient choosing yes to some extent.Additionally, 18 parents felt they were able to discuss theirconcerns and give feedback at the time of assessment, and80% felt the assessment could not have been communicateddifferently. The family who needed an interpreter reportedthat the information they were provided with before the ap-pointment was very poor, although they believed the actualprocess was good.
Notably, 85% of parents would have liked a letter witha plan for further assessment and appointment dates. Mostparents had received a report which 65% claimed to defi-nitely understand, with 20% understanding to some extent.Parents would have liked less medical terminology in the re-ports. Eighteen parents had the opportunity to give feedbackat the time of the assessment. However, 59% stated theyeither did not have any say or only to some extent. All ofthe parents said they were able to ask questions at followingmeetings.
With regards to the postdiagnostic workshops, 8 parentsreceived information regarding the aims. When parents areinvited to attend the sessions, written information about thecourse is also sent with the letter. However, the 8 who did notanswer may not have been invited.

4 International Journal of Family Medicine
Table 4: Relationship with the professional performing the assess-ment.
Did the professional listen carefully to you?Yes definitely 19
Yes to someextent
1
No 0
Did you have trust and confidence in theprofessional you saw?
Yes definitely 15
Yes to someextent
5
No 0
Were you treated with trust and dignity?Yes definitely 20
Yes to someextent
0
No 0
Were you given enough time to discuss yourconcerns about your child?
Yes definitely 18
Yes to someextent
2
No 0
Could the communication have been donedifferently?
No 16
Yes to someextent
3
Yes definitely 1
Table 5: Outcome of the assessment.
After the first meeting would you have liked aletter with the plan for further assessment andappointment dates?
Yes 17
No 2
Not answered 1
Were you given the opportunity to providefeedback at the time of the assessment?
Yes 18
No 2
How satisfactory was the assessment process?
Very good 12
Good 8
Average 0
Poor 0
Very poor 0
Was there part of the assessment process youwould have liked to have been done differently?
Yes 2
No 18
Every respondent was happy with the assessment process,with 60% reporting it to be very good, 100% of parentssaid they were definitely treated with trust and dignity. Afterthe assessment, 100% of patients were happy with the levelof information they had regarding the process. Although18 parents received additional information in some form,6 felt they had not received enough information about thecondition and future interventions. With regards to the post-diagnostic workshops, only 15 parents said they were invitedto attend. The reasons for this were not explored, althoughone patient did report moving house. When asked whythey were unable to attend, Childcare was a key themeas was timing. Looking at the time interval from referralto diagnosis, great variance was apparent (Figure 2). Theaverage time was 46 weeks with only 6 diagnoses reportedin the recommended time frame of 17 weeks.
Table 6: Written information.
At the end of the assessment did you haveenough information regarding the process?
Very good 8
Good 19
Average 3
Poor 0
Very poor 0
How was the assessment outcomecommunicated?
Verbally only 3
Written only 1
Written andverbal
16
Could the assessment have beencommunicated differently?
No 15
Yes to someextent
3
Yes definitely 2
At the end of the assessment were yougiven/posted a report?
Yes 17
No 3
Did you understand the report?
Yes definitely 13
Yes to someextent
4
No 2
Not answered 1
Did the report contain an initial page with theoutcome of the assessment clearlydocumented?
Yes 16
No 2
Not answered 2
Were you able to discuss the report at the nextappointment?
Yes definitely 12
Yes to someextent
5
No 2
Not answered 1
Did you have a say in what the report shouldcontain?
Yes definitely 7
Yes to someextent
5
No 6
Not answered 2
Were you given a chance to ask questionseither in the feedback or following meeting?
Yes definitely 15
Yes to someextent
2
No 2
Of note, the child with the shortest timeframe from re-ferral to diagnosis was the least satisfied, while the longesttimeframe elicited the highest satisfaction score. The resultsshow 2 peaks, with satisfaction higher at the times of schooltransition (3–5 and 10–12 year olds).
5. Discussion
One weakness was size, although sampling the past 18months allowed the collection to be achieved within theallocated timescale. If the study was increased to the past3 years, the results may show a more significant trend,although parents might find the process harder to recall.

International Journal of Family Medicine 5
Table 7: Additional information.
Did you receive additional informationregarding your child’s condition at the end ofthe assessment?
Yes verbally 2
Yes the written report 1
Information from early support 1
NAS leaflets 1
Multiagency partnership (MAP)leaflets
0
Not answered 2
Verbally and written report 1
Verbally and NAS leaflets 2
NAS and MAP leaflets 4
Verbally, NAS and MAP leaflets 2
Verbally, information from earlysupport, and NAS and MAPleaflets
1
Verbally, the written report, andNAS and MAP leaflets
2
Verbally, the written report, earlysupport, and NAS and MAPleaflets
1
If MAP was recommended to you, were youhappy for your child to be referred?
Yes definitely 14
Yes to some extent 0
No 3
Not answered 3
Did you receive enough information about thecondition itself and future interventions?
Yes 14
No 6
Were you given the opportunity to watch avideo about the condition following diagnosis?
yes 4
No 15
Not answered 1
0123456789
Pati
ent
freq
uen
cy
0–17
wee
ks
18–3
4w
eeks
35–5
1w
eeks
52–6
8w
eeks
69–8
5w
eeks
86–1
00w
eeks
101–
150
wee
ks
151–
200
wee
ks
Number of weeks from referral to diagnosis
Figure 2: Time period between referral and diagnosis.
One solution might be administering the questionnaire as astandard part of clinical practice.
Parents wanted more information regarding diagnosisand management. A longer follow-up appointment afterdiagnostic feedback could allow needs to be individuallyassessed. During this appointment, professionals could dis-cuss the purpose of the postdiagnostic workshops. Theinformation provided during these workshops is obviously
most beneficial when attending the group sessions, as theyare interactive and parents have the opportunity to shareexperiences and strategies. However, if all parents receivedthe written information provided within these sessions, itwould be helpful to those who could not attend. As childcareand timing were the commonest reasons for nonattendance,this could be addressed by combining all 5 sessions into 2days within school hours.
Written communication could be enhanced by a stand-ardised response letter from the SCAIT team. This could in-clude the role of SCAIT, the purpose of the assessment, theappointment time, the assessment structure and timescale,the name and profession of all clinicians, and possible ques-tion areas. This should help ease parent’s anxiety and ensurethat scarce appointments achieve maximum benefit. Finally,the assessment report needs to be clear and concise. Theinitial page should contain a standardised format with theoutcome clearly stated, the individuals and professional rolesof those involved, and the date of the diagnosis.
Although, most parents were happy with the assessmentservice, satisfaction could be increased by providing moreinformation about the assessment as well as the condition.It is important to actively involve parents in the sessions,allowing them to build a trusting relationship with the healthprofessionals involved as children may need support from

6 International Journal of Family Medicine
Table 8: Postdiagnostic workshops.
After diagnosis were you invitedto attend the Autism Workshops?
Yes 15
No 3
Not answered 2
Were you able to attend the sessions?Yes 8
No 7
Not answered 5
If you were unable to attend, whichreason best applies to you?
Inconvenientlocation
3
Inconvenienttime
1
No transport 0
No childcare 3
Other 3
Inconvenientlocation, notransport orchildcare
1
Not answered 9
Were you given any informationregarding the aims of the course?
Yes 10
No 2
Not answered 8
Did the aims of the course appealto you?
Yes 9
No 2
Not answered 9
Was the course useful?Yes 8
No 2
Not answered 10
Did the course cover what you wantedto know?
Yes 9
No 0
Not answered 11
Would you recommend the course toother parents/carers?
Yes 9
No 0
Not answered 11
the team for many years. Giving each family the time to dis-cuss their concerns will also help tailor individual needs andfurther increase parental satisfaction. The fact that parentsare considerably more likely to have a second child with ASDsemphasises the importance of engaging families.
The study was fed back to SCAIT, and standardizedletters and workshop information sheets have already beenimplemented. Furthermore, the team will complete the auditloop by undertaking the audit again in 18 months time. Thisstudy has provided a key opportunity to offer a value-addedservice with service-user feedback.
References
[1] M. D. Inglese, “Caring for children with autism spectrumdisorder, part II: screening, diagnosis, and management,”Journal of Pediatric Nursing, vol. 24, no. 1, pp. 49–59, 2009.
[2] NICE Autism spectrum disorders in children and young peo-ple: final scope, 2010 http://www.nice.org.uk/nicemedia/live/11826/45433/45433.pdf.
[3] National Initiative for Autism: Screening and Assessment,National Autism Plan for Children (NAPC): Plan for the Identi-fication, Assessment, Diagnosis and Access to Early Interventionsfor Pre-School and Primary School Aged Children with AutismSpectrum Disorders (ASD), The National Autistic Society forNIASA, London, UK, 2003.
[4] A. Raznahan and P. Bolton, “Autism spectrum disorder inchildhood,” Medicine, vol. 36, no. 9, pp. 489–492, 2008.
[5] L. Hackett, S. Shaikh, and L. Theodosiou, “Parental perceptionsof the assessment of autistic spectrum disorders in a tier threeservice,” Child and Adolescent Mental Health, vol. 14, no. 3, pp.127–132, 2009.
[6] Diagnosis of autism spectrum disorders—a guide for healthprofessionals—NAS, 2010 http://www.autism.org.uk/working-with/health/screening-and-diagnosis/diagnosis-of-autism-spe-ctrum-disorders-a-guide-for-health-professionals.aspx.
[7] P. A. Filipek, P. J. Accardo, S. Ashwal et al., “Practice parameter:screening and diagnosis of autism. Report of the quality stan-dards subcommittee of the American Academy of Neurologyand the Child Neurology Society,” Neurology, vol. 55, no. 4, pp.468–479, 2000.