“The Good Old Days” Are Fading for Michigan’s Local Governments.
60
“The Good Old Days” Are Fading for Michigan’s Local Governments
-
Upload
adele-marshall -
Category
Documents
-
view
215 -
download
1
Transcript of “The Good Old Days” Are Fading for Michigan’s Local Governments.

“The Good Old Days”
Are Fading for Michigan’s Local Governments

The “New Normal”for Michigan’s Local
Governments

Michigan Local Government Fiscal Conditions 2014 and going forward
Presented by:Larry MerrillMichigan Townships Association Executive Director

The “Good Old Days”
Post-War Twentieth Century

Good Old Days Unparalleled Prosperity
Michigan’s Per Capita Income: Top 5
Detroit Fourth Largest City in United States
Manufacturing Jobs Galore Population Growth Robust Economy (for the most
part)▪ Sales and Income Tax Revenue▪ Housing Starts▪ Income Tax Revenues▪ New Revenue Sharing Program 1971▪ Recessions Infrequent, Short
Duration

For Local Government
1950-1999 Manufacturing Sector
Growth Property Tax Revenues State Shared Revenues Federal Revenue Sharing Expanding Role of Local
Government Federal Categorical
Grants Dot.Com Bubble
Capital Gains Growth
2000-and on Global Economy
Emerges Manufacturing Declines Population Declines State Revenues Plunge Mild Recession 2001-
2003 Severe Financial Sector
Recession 2008-2011

And Michigan’s Image Went from This…

To This…

There is no “Michigan” Economy
We are a state divided:
• Resources• Expectations• Traditions• Infrastructure
The governor’s Regional Prosperity Initiative

Diversity of Michigan’s Local Governments

the Good Old Days are Not Returning…Any Time Soon
THEN NOW

Why the economy is not self correcting:
• Still heavily reliant on declining industries and products
• Aging work force lacks skills for emerging jobs
• Entrepreneurial spirit is lagging• Lackluster immigration• Poor attraction, retention of
knowledge workers

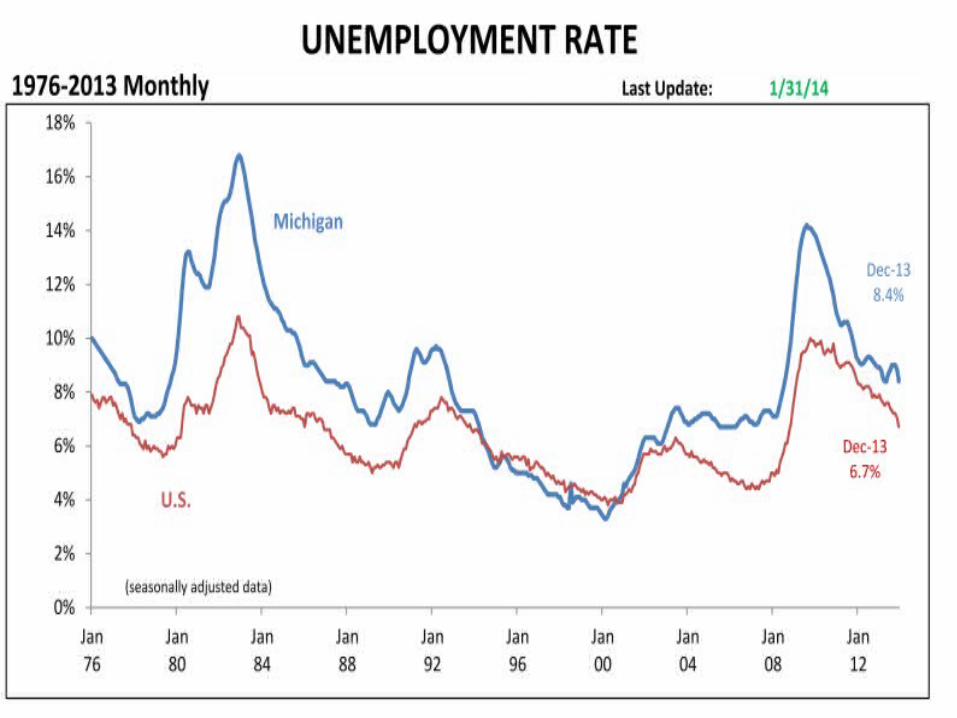
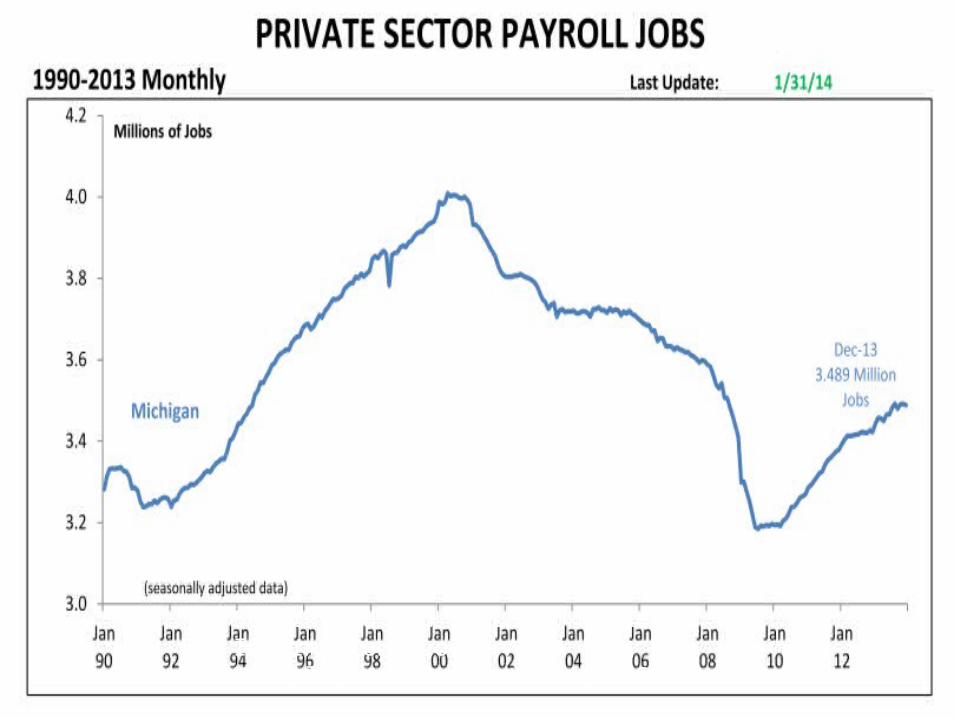
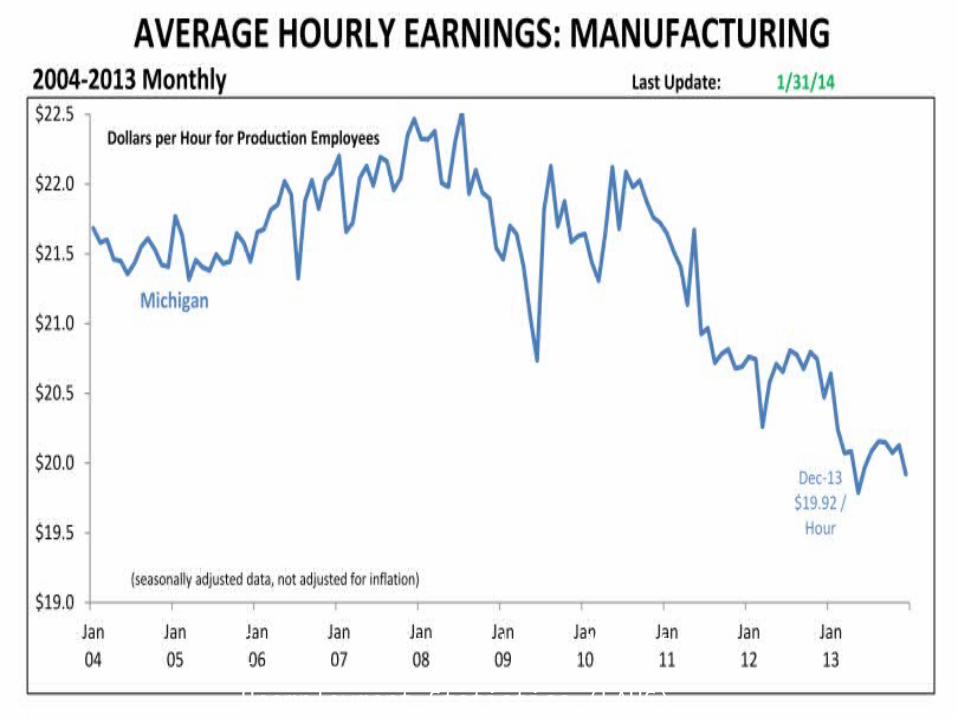
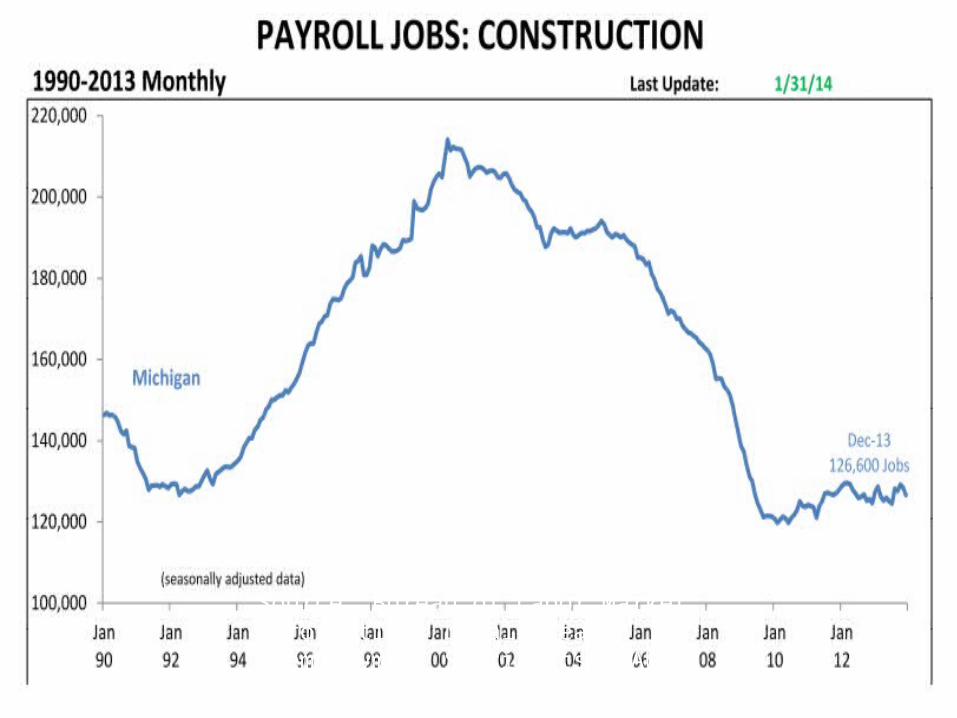
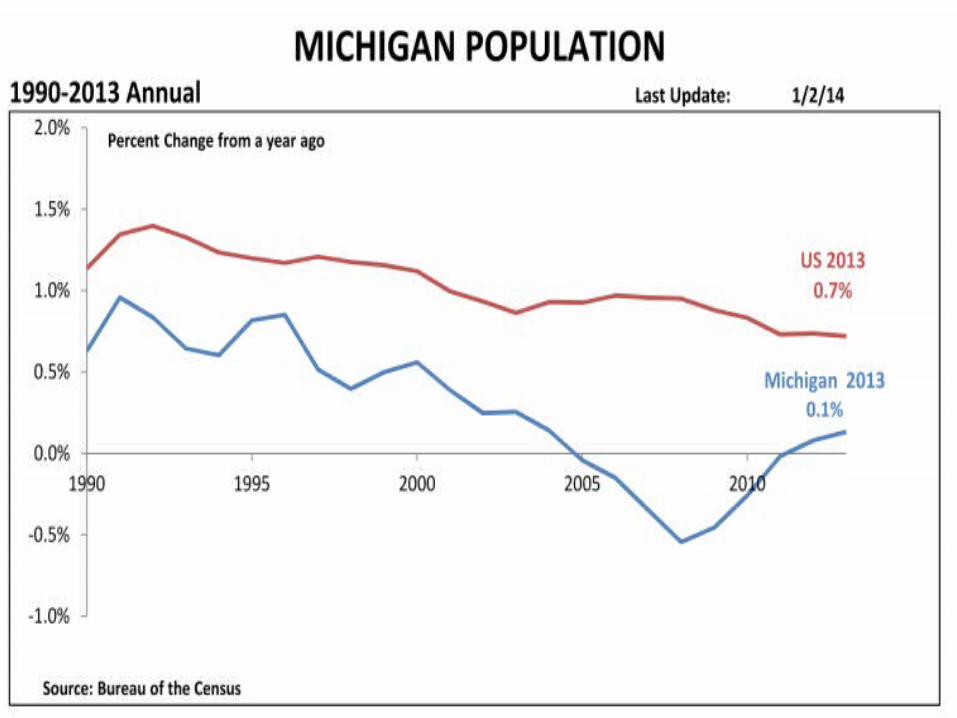
The Data Tells the Story..
The Data Tells The Story…

Source: Bureau of Labor Market Information, Local Area Unemployment Statistics (LAUS)
Source: Bureau of Labor Market Information, Local Area Unemployment Statistics (LAUS)

Source: Bureau of Labor Market Information, Local Area Unemployment Statistics (LAUS)

Source: Bureau of Labor Market Information, Local Area Unemployment Statistics (LAUS)
Source: Bureau of Labor Market Information, Local Area Unemployment Statistics (LAUS)

Source: Bureau of Labor Market Information, Local Area Unemployment Statistics (LAUS)
Source: Bureau of Labor Market Information, Local Area Unemployment Statistics (LAUS)

Source: Bureau of Labor Market Information, Local Area Unemployment Statistics (LAUS)
Source: Bureau of Labor Market Information, Local Area Unemployment Statistics (LAUS)

Source: Bureau of Labor Market Information, Local Area Unemployment Statistics (LAUS)


How the Economy Impacts Michigan Local Governments

Property Tax Collections

2000
2002
2004
2006
2008
2010
2012
$-
$50,000,000,000
$100,000,000,000
$150,000,000,000
$200,000,000,000
$250,000,000,000
$300,000,000,000
$350,000,000,000
$400,000,000,000
Statewide Total Real and Personal
Property Valuations
Taxable Value
Source: Michigan State Tax Commission

1997
1999
2001
2003
2005
2007
2009
2011
0.0
500.0
1,000.0
1,500.0
2,000.0
2,500.0
3,000.0
Property Tax Revenues By Type of Local Government
city
county
township
village
Year
Reven
ues
in M
illion
s $
Source: Citizens Research Council

2012 2011 2010 2009 2008 2007 2006 2005 2004 2003
0
100,000,000
200,000,000
300,000,000
400,000,000
500,000,000
600,000,000
City Income Tax Collections
Total Statewide DetroitLansing
Source: Citizens Research Council

State Shared Revenues

Source: Citizens Research Council
Source: Citizens Research Council

2001
2002
2003
2004
2005
2006
2007
2008
2009
2010
2011
2012
2013
2014
$-
$200,000,000
$400,000,000
$600,000,000
$800,000,000
$1,000,000,000
$1,200,000,000
$1,400,000,000
$1,600,000,000
$1,800,000,000
Total Revenue Sharing to Locals

Parks and
recreation
Housing
and comm dev
Solid waste
mgt
Interest
earnings
Other
general revenue
-
200,000
400,000
600,000
800,000
1,000,000
1,200,000
1,400,000
Michigan Local Government Miscellaneous Revenue Source
Changes
FY 2004-05FY 2010-11

Let’s look at some of the expenditure issues

-
500,000
1,000,000
1,500,000
2,000,000
2,500,000
Change in Michigan Local Gov-ernment Expenditures
2005-2011
FY 2004-05FY 2010-11

-200,000400,000600,000800,000
1,000,0001,200,000
Change in Michigan Local Gov-ernment Expenditures
2005-2011
FY 2004-05FY 2010-11

Shor
t-ter
m
Long
-term
P
ublic
deb
t for
priv
ate
purp
oses
Long
-term
deb
t iss
ued
Long
-term
deb
t ret
ired
-
10,000,000
20,000,000
30,000,000
40,000,000
Michigan Local Government Outstanding Debt
FY 2005-2010
FY 2004-05FY 2010-11


Unfunded Liabilities
311 Local Governments Have OPEB Liability Total Liability is $13.5 billion; Funded at 6% Net Unfunded Liability is $12.7 billion City of Detroit’s OPEB is $4.9 billion (2009) 39% of total
for all local governments 47% are starting to prefund Equates to 20% of all general fund revenues
Total Unfunded Pension Liabilities $3.1 billion (10% of general fund revenues)
Average Annual Benefit per Retiree $8,887 Governmental Activities Total Debt approx $5 billion

• Total General Purpose Local Governments
1,858*
33
• Total Local Governments, Including Special Purpose Districts
2,893*
28
• Local Elected Officials 19.4/10k
26
• Average # Elected Officials Per Local Government
6.6* 38
• General Revenue For State And Local Government Operations
$7,310
32
• Federal Funding For Local Government Services
$1,487
33•U.S. Bureau of the Census data, except where noted
Performance Measure Per State
Capita Ranking

• Number Of Local Government Employees
12.2/1K
43
• Funding From Local Governments’ Sources
$5,823
31
• Property Taxes $1,412
16
• Salaries and Wages, Local Government Employees (noneducational)
$617 37
Performance Measure Per State
Capita Ranking

• Law Enforcement Expenditures $242 28• Fire Protection Expenditures $95 37• Financial Administration (tax collections, assessing, accounting)
$94 44
• Other Government Operations (governing boards, planning and zoning
$68 43
• General Use Public Buildings Expenditures
$38 38
Performance Measure Per State
Capita Ranking

Appropriate Indices of Fiscal Problems
Levels versus changes Local government debt Cash solvency (current assets
divided by current liabilities) Debt service divided by total
revenue Inflation-adjusted taxable value
growth

Popular Indices of Fiscal Problems
Munetrix Score
Population GrowthGeneral Fund Expenditures as a Percent of Taxable ValueOperating DeficitSize of Fund BalanceLong-term Debt as a Percent of Taxable Value

Municipalities Subject to Emergency Financial Oversight
Allen Park, Emergency Manager Benton Harbor, Emergency Manager Detroit, Emergency Manager Ecorse, Receivership-Transition Advisory Board Flint, Emergency Manager Hamtramck, Emergency Manager Highland Park, Under Review Pontiac, Receivership-Transition Advisory
Board Inkster, Consent Agreement Royal Oak Township, Under Review

Prognostications
Current trends extended forward… Michigan will recover per capita ranking
to the low thirties from 41st
Unemployment remains slightly above national average
State budget modest growth, with some periodic minor recessions
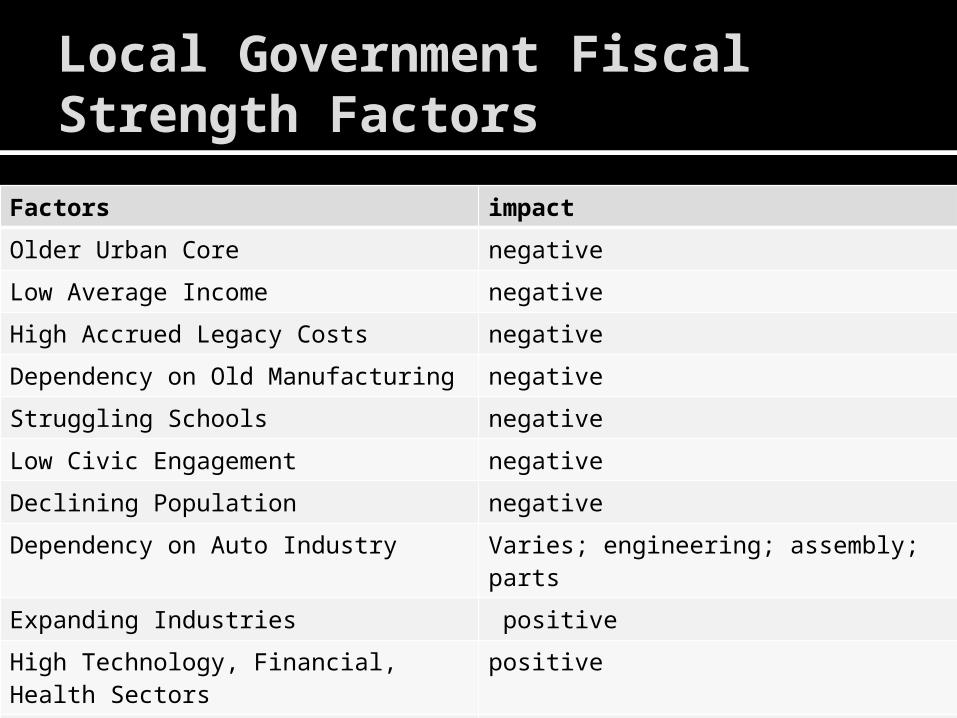
Local Government Fiscal Strength Factors
Factors impact
Older Urban Core negative
Low Average Income negative
High Accrued Legacy Costs negative
Dependency on Old Manufacturing negative
Struggling Schools negative
Low Civic Engagement negative
Declining Population negative
Dependency on Auto Industry Varies; engineering; assembly; parts
Expanding Industries positive
High Technology, Financial, Health Sectors
positive
Prime Farmland positive (potential bubble)
Alternative Energy (Wind Turbines) strong positive
High Educational Attainment strong positive

Local Government Finances not Broken, but
Few local governments have resources to satisfy most, let alone all service demands
No ready solution to accrued legacy costs Property tax caps slow revenue growth Growing reliance on sales tax, property tax
revenues State expects locals to solve their own
problems*
*state will provide advice, financial oversight in severe cases

Prognostications
Better times ahead, if… State economy diversifies, reduces
reliance on old style manufacturing Improve education attainment of
younger workers Greater presence of expanding,
knowledge-based industries Agriculture remains strong Attract educated, wealthier immigrants Improved entrepreneurship climate

Prognostications
Better times ahead, if… Natural resources increase in demand
Invest in infrastructure, education Place making strategies Regional cooperation for economic development

Prognostications
Detroit will drift in and out of financial distress, unless… The governance culture permanently
changes The neighborhoods are made whole The education system is made functional The state and federal government
partners on infrastructure, adult education, workforce development, economic development

Prognostications
Many older, poorer urban communities will either struggle or die… Pockets of poverty and property
abandonment Eventual rebuilding driven by
cheap land prices Consolidation with surrounding
communities

Prognostications
Growth primarily in metro areas Urban centers can thrive in New
Economy with place making strategies Suburbs will slow historical rate of
growth Rural communities will continue to
lose population Residential will coalesce around small
towns