The Global Automotive Outlook - cargroup.org · Data that drives tomorrow. February 2019 35% 17% 4%...
35
Data that drives tomorrow. February 2019 The Global Automotive Outlook Opportunity Identification in a Disruptive Market February 20, 2019 Joseph McCabe, President 855.734.4590 ext. 1001
Transcript of The Global Automotive Outlook - cargroup.org · Data that drives tomorrow. February 2019 35% 17% 4%...

Data that drives tomorrow.February 2019
The Global Automotive OutlookOpportunity Identification in a Disruptive Market
February 20, 2019
Joseph McCabe, President855.734.4590 ext. 1001

Data that drives tomorrow.February 2019

Data that drives tomorrow.February 2019
Competing in a Disruptive Global Market• Consumer preference vs. market direction
• Shareholder value
• Supply chain importance to the VM strategy
• Innovation in product and strategy
• Investment strategies
• Regulations, incentives, and standards
• Geo-political impact on globalization
• Future players
• Minimize risk and maximize opportunities
• Defend core operations and identify areas for growth
3
Market Direction & the need for Innovation
Economic Recovery
Financial Markets
Gov’t Investment
Auto Supply Chain
Technology Price Effects
Ownership & Operating
Cost
Market Drivers, Enablers & Constraints

Data that drives tomorrow.February 2019
4

Data that drives tomorrow.February 2019
NA Growth Outlook and OEM Group Contribution
5
D3
EU
AP
EV
-900,000
-800,000
-700,000
-600,000
-500,000
-400,000
-300,000
-200,000
-100,000
0
100,000
200,000
300,000
400,000
-900,000
-800,000
-700,000
-600,000
-500,000
-400,000
-300,000
-200,000
-100,000
0
100,000
200,000
300,000
400,000
2017 2018 2019 2020 2021 2022 2023 2024 2025 2026
Pro
du
ctio
n V
olu
me
Ch
ange
by
OEM
Gro
up
Calendar Year
North America Y-O-Y Production Volume Impact
D3 EU AP EV Total YOY Change
Source: AutoForecast Solutions – January 2019
17.79
17.1117.03
17.16
17.67
16
17
18
Mill
ion
s
Data that drives tomorrow.February 2019
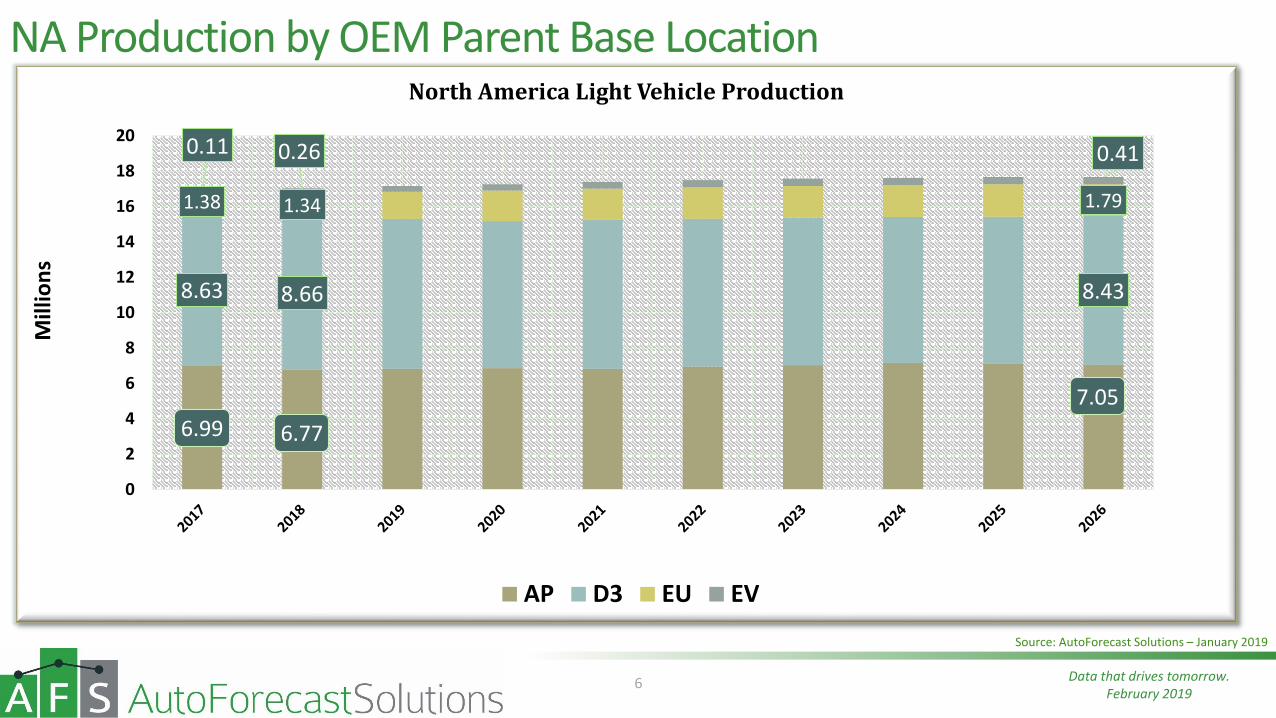
NA Production by OEM Parent Base Location
6
6.99 6.77
7.05
8.63 8.66 8.43
1.38 1.34 1.79
0.11 0.26 0.41
0
2
4
6
8
10
12
14
16
18
20
Mill
ion
s
North America Light Vehicle Production
AP D3 EU EV
Source: AutoForecast Solutions – January 2019

Data that drives tomorrow.February 2019
52%
8%
12%
25%
4%
Japan54%
EU10%
Korea14%
D316%
EV5%
Japan European Korea D3 EV
Annual Volume2018 = 5.3M2026 = 4.2M
• D3 reduce car footprint by 625K+
• Korean OEMs reduce 90K
• European OEMs gain 120K
• Japanese OEMs reduce by 490K+
• EV – primarily Tesla – reduce 8K
7
North America: Passenger Car Segment Contribution
2018
Source: AutoForecast Solutions – January 2019

Data that drives tomorrow.February 2019
35%
17%
4%
43% 1%
Japan36%
EU19%
Korea3%
D340%
EV2%
Japan EU Korea D3 EV China
Annual Volume2018 = 6.1M2026 = 7.4M
• European OEMs add 400K units
• Japanese OEMs add nearly 485K units
• Korean OEMs down 10K
• EV group – adding about 135K
• D3 add 310K (but loses market share?)• Consider these imported models…
• Jeep Renegade from Italy – 100K+• Buick Encore from Korea – 90K+• Ford EcoSport from India – 50K pace
8
North America: Crossover Vehicle Segment Contribution
2018
2026
Source: AutoForecast Solutions – January 2019

Data that drives tomorrow.February 2019
• U.S. Sales growth in 2018• Over 17 million for 4th straight year
• Growing mid-sized Pickups NOT cannibalizing full sized trucks (yet)• Ford Ranger, expanded Jeep lineup, Ram entries
• SUV resurgence• Ford Bronco and Jeep Wrangler 4-door
• Jeep Wagoneer / Grand Wagoneer to take on Escalade and Navigator• Strong move for FCA
• VW Atlas (both 2 and 3-row variants) • to offset slow selling Passat
• GM portfolio adjustment• Product mix and plant utilization
• Import Substitution• Subaru Impreza• Lexus ES and RX• BMW passenger cars in Mexico
• Global Export Hub• VW Atlas• Subaru Ascent• Audi Q5• BMW CUVs
• Mexico• Strong export hub• Multiple global free trade agreements• Established supply base• Strong government support
9
North America Production Highlights

Data that drives tomorrow.February 2019
10

Data that drives tomorrow.February 2019
• U.S. light vehicle sales peaked in 2016• 17.46 million
• 2018 marked the forth straight year over 17 million units
• Slowdown expected in 2019 and 2020• 17 million not expected to return until 2024• 2% decline in 2019
• Market being driven by light truck growth• squeezing car share to near 27% in 2019 • heading toward under 20% by 2023
• Import substitution offsetting future sales contributions
11
U.S. Light Vehicle Sales
Source: AutoForecast Solutions – January 2019
Data that drives tomorrow.February 2019
12
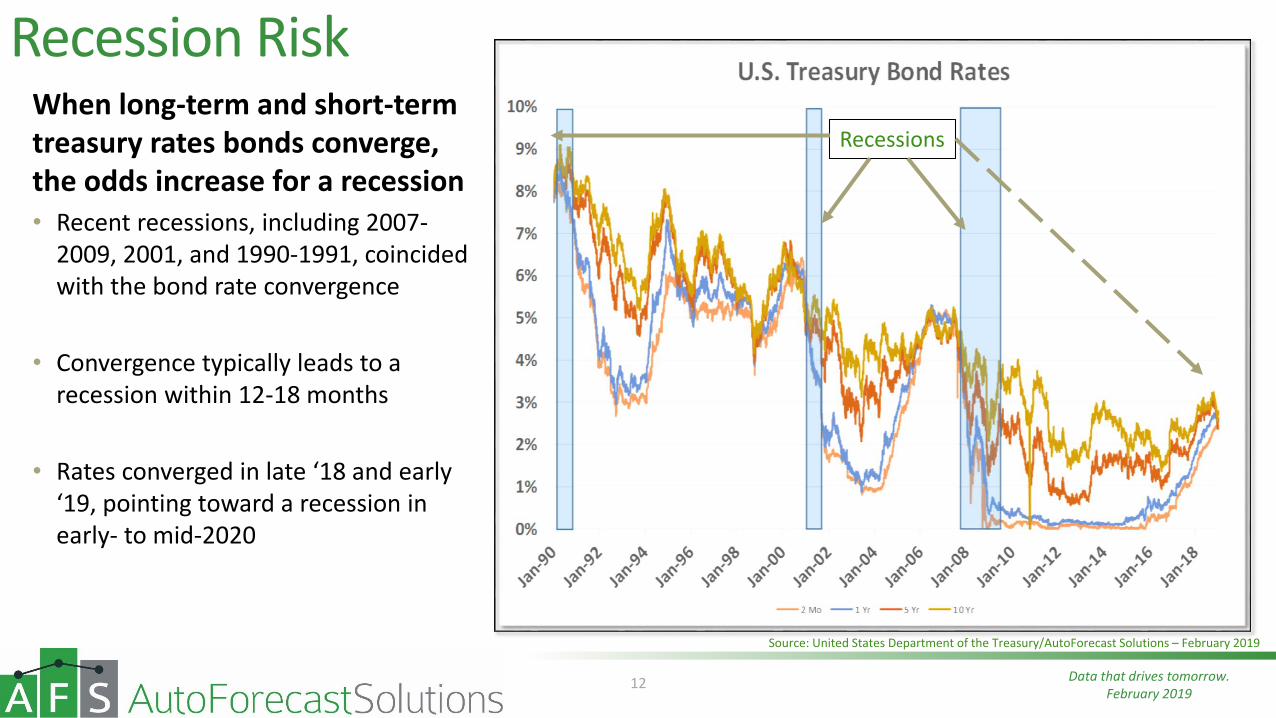
Recession RiskWhen long-term and short-term treasury rates bonds converge, the odds increase for a recession• Recent recessions, including 2007-
2009, 2001, and 1990-1991, coincided with the bond rate convergence
• Convergence typically leads to a recession within 12-18 months
• Rates converged in late ‘18 and early ‘19, pointing toward a recession in early- to mid-2020
Source: United States Department of the Treasury/AutoForecast Solutions – February 2019
Recessions

Data that drives tomorrow.February 2019
13

Data that drives tomorrow.February 2019
Domestic Investment Opportunity
14
14
• Mazda CX-5• Top selling Mazda product• Sourced from Japan
• Hyundai Tucson• Among the best selling Hyundai models• Sourced from South Korea
• Kia Soul• Sourced from South Korea• Low-cost hampers North American sourcing
• Honda Civic• Specialty models imported from U.K.• BREXIT - production justification still valid?
• Jeep Renegade• Globally sourced from Italian plant• Shares plant with related Fiat 500X
• Nissan Rogue• Sourced from Japan, South Korea, and the U.S.• Two-thirds of U.S. derived from imports
• Toyota RAV4• Nearly 250,000 expected from Japan this year
• Toyota 4Runner• Potential for North American sourcing• Not enough factory space for 150,000
• Subaru Forester• Only made in Japan• Subaru U.S. plant running at full speed• Strained production capacity in Japan
• Subaru Crosstrek• Related to the U.S. sourced Impreza• U.S. plant running at full-speed• Strained production capacity in Japan

Data that drives tomorrow.February 2019
15
Data that drives tomorrow.February 2019
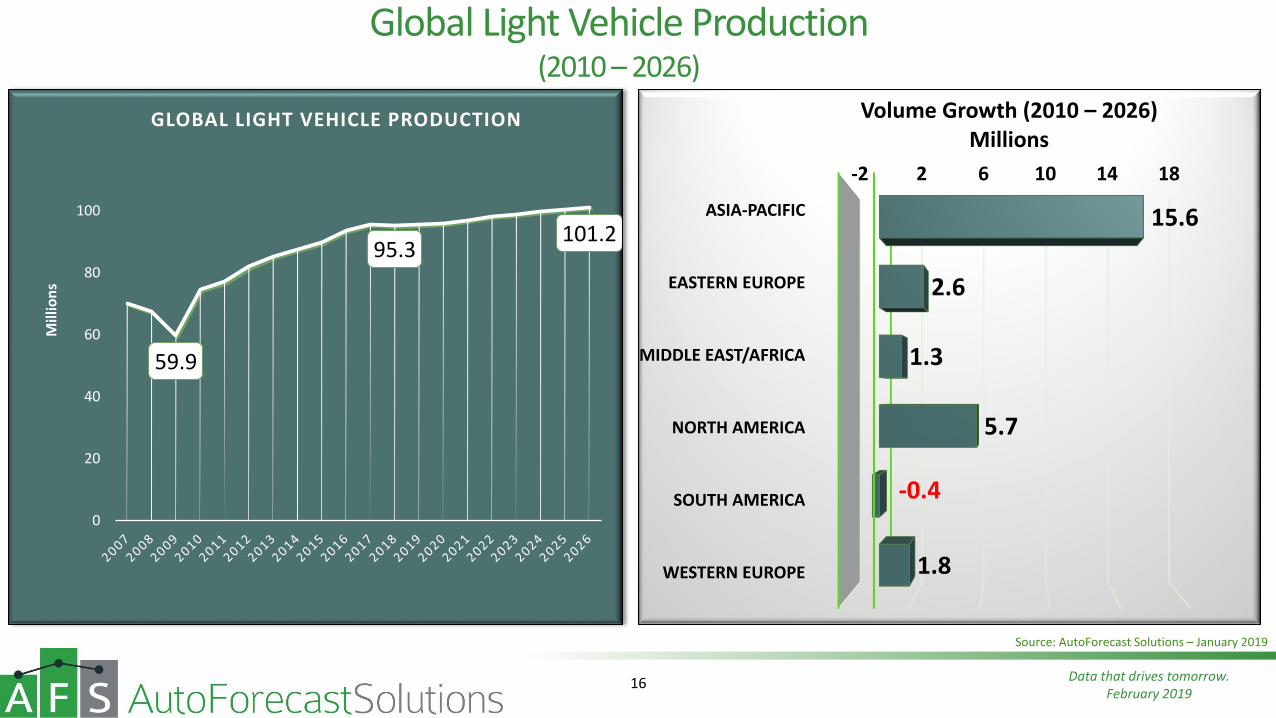
-2 2 6 10 14 18
ASIA-PACIFIC
EASTERN EUROPE
MIDDLE EAST/AFRICA
NORTH AMERICA
SOUTH AMERICA
WESTERN EUROPE
15.6
2.6
1.3
5.7
-0.4
1.8
Volume Growth (2010 – 2026)Millions
Global Light Vehicle Production(2010 – 2026)
59.9
95.3101.2
0
20
40
60
80
100
Mill
ion
s
GLOBAL LIGHT VEHICLE PRODUCTION
16
Source: AutoForecast Solutions – January 2019
Data that drives tomorrow.February 2019
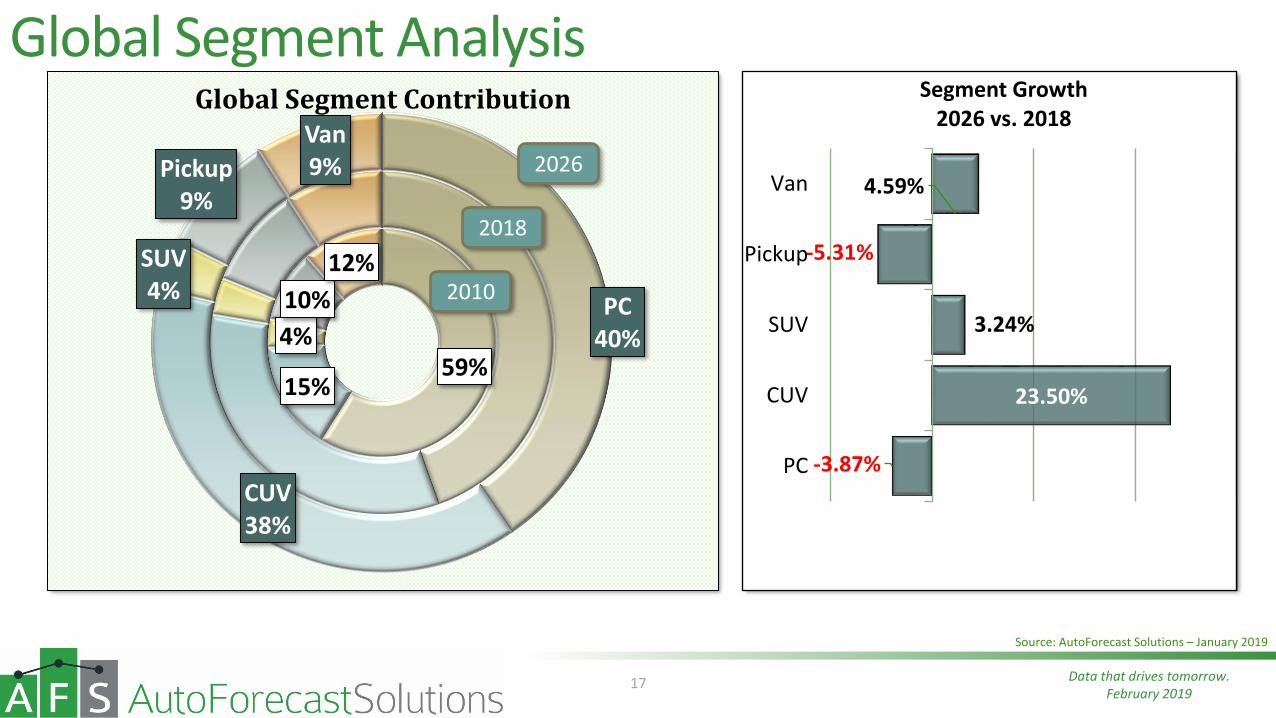
Global Segment Analysis
17
59%15%
4%
10%
12%
PC40%
CUV38%
SUV4%
Pickup9%
Van9%
Global Segment Contribution
-3.87%
23.50%
3.24%
-5.31%
4.59%
PC
CUV
SUV
Pickup
Van
Segment Growth2026 vs. 2018
2010
2018
2026
Source: AutoForecast Solutions – January 2019

Data that drives tomorrow.February 2019
0 2 4 6 8 10 12
Toyota MotorRenault-Nissan-Mitsubishi
VolkswagenHyundai Motor
Ford MotorGeneral Motors
FCAHonda Motor
Groupe PSADaimler
Geely GroupBMW
SAIC-GM-WulingMazda MotorMaruti Suzuki
TataSuzuki Motor
Changan AutoSubaru
Great Wall Automobile
MILLION UNITS OF GLOBAL PRODUCTIONRANKING BASED ON 2026 POSITION
2026 2018
18
“1 Million Unit Club” Brand Owner Analysis (2018 vs. 2026)
20 90%Brand Owners in 2026 producing OVER 1 Million
units/year
Per cent of Total Global Production
73% of total market
Top 10 Brand Owners
Inductees Since 2010
Beijing Automotive Group
Great Wall Automobile
Geely Group (with Volvo)
Tata
Subaru
Source: AutoForecast Solutions – January 2019

Data that drives tomorrow.February 2019
China –Vehicle Production Outlook
19
16.8
27.726.0
28.7
0
5
10
15
20
25
30
Mill
ion
s
China Vehicle Production
71% GROWTH
94
113
126
Vehicle Manufacturers in China by year
2018
2010
2026
75
91
105
Brand Owners in China by year
2018
2010
2026
Source: AutoForecast Solutions – January 2019
Data that drives tomorrow.February 2019
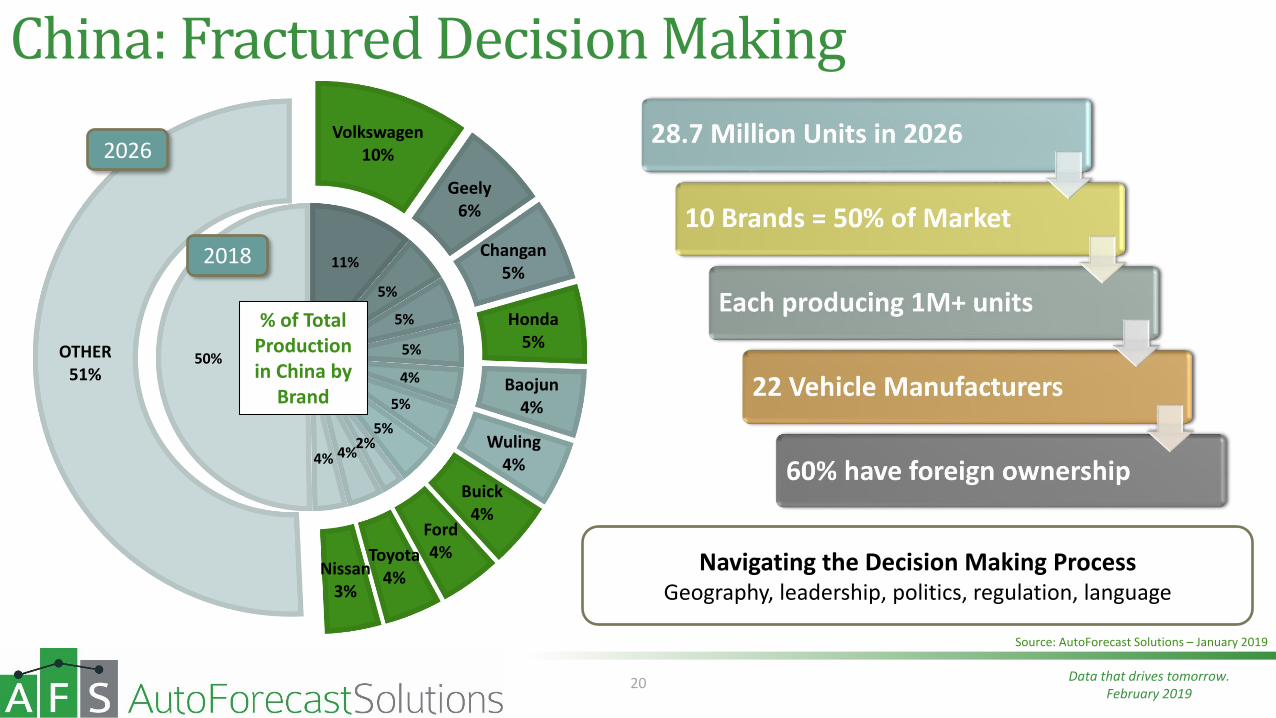
11%
5%
5%
5%
4%
5%
5%2%
4%4%
50%
Volkswagen10%
Geely6%
Changan5%
Honda5%
Baojun4%
Wuling4%
Buick4%
Ford4%Toyota
4%Nissan3%
OTHER51%
20
% of Total Production in China by
Brand
China: Fractured Decision Making
Navigating the Decision Making ProcessGeography, leadership, politics, regulation, language
2018
2026
Source: AutoForecast Solutions – January 2019

Data that drives tomorrow.February 2019
21

Data that drives tomorrow.February 2019
Global Light Vehicle Production by Fuel Type
Gas79.64%
Diesel18.92%
Hybrid - Gas0.94%
Hybrid - Diesel0.01%
BEV0.03%
EREV0.00%
Fuel Cell0.00%
Other Fuels0.45%
2010
22
Gas77.15%
Diesel18.53%
Hybrid - Gas2.69%
Hybrid - Diesel0.19%
BEV0.82%
EREV0.17%
Fuel Cell0.00% Other Fuels
0.45%2017
Gas74.53%
Diesel18.00%
Hybrid - Gas4.02%
Hybrid - Diesel0.31%
BEV2.50%
EREV0.19% Fuel Cell
0.01%
Other Fuels0.45%
2020
Gas72.19%
Diesel16.69%
Hybrid - Gas5.39%
Hybrid - Diesel0.32% BEV
4.54%
EREV0.24%
Fuel Cell0.01%
Other Fuels0.62%
2026
Source: AutoForecast Solutions – January 2019

Data that drives tomorrow.February 2019
EV Market Sizing
23
0
2
4
6
8
10
12
Mill
ion
s
BEV Market OutlookAFS Forecast vs. VM Announced Plans
Variance to Outlook
BEV Production
Outlook
2026 BEV MarketAFS = 4.6 Million
Announced Plans = 6.4 MillionOptimist View = 10.4 Million
Battery Price Parity
Variance to Optimist
Viewpoint
Legacy VM (AFS Forecast)281
Start-Up (AFS Forecast)
Legacy (Plan Variance)
Start-Up (Plan Variance)
Optimist Viewpoint
64
25%+
180%+
48%+
EVEN AN OPTIMISTIC VIEW REQUIRES NEARLY 90% OF VEHICLES TO HAVE AN ENGINE
Source: AutoForecast Solutions – January 2019

Data that drives tomorrow.February 2019
Electric Platform Production Volume
0.0
0.5
1.0
1.5
2.0
2.5
3.0
3.5
4.0
4.5
5.0
2017 2018 2019 2020 2021 2022 2023 2024 2025 2026
MIL
LIO
NS
24
DedicatedEV
Platforms
Shared Platforms
75%
52%
VW MEB Platform Daimler’s EVA Platform
Source: AutoForecast Solutions – January 2019
48%

Data that drives tomorrow.February 2019
Differing OEM ViewpointsElectrification Adopters• Renault/Nissan
• Nissan Leaf and NV200 EVs
• Renault Kangoo, Zoe and Twizy EVs
• Volkswagen• New direction to avoid past diesel issues
• Creating ID sub-brand to Volkswagen
• “Electrifying” Audi, Porsche, and Bentley
• Most Chinese Manufacturers• Adding EVs
• BAIC, BYD, Changan, Chery, Dongfeng, Geely, Jianghuai, Jiangling, SAIC, Zotye
• Adding PHEVs
• BYD, Chery, Dongfeng, FAW, GAC, Geely, SAIC
25
The Resistance• Mazda
• Reluctantly adding EVs and hybrids• Rather refine current technologies
• CIDI gasoline engines• Growing diesel volumes
• FCA• Losing money on each hybrid and EV
• Marchionne came out said not to buy Fiat 500 EVs
• Recently started adding EV and hybrid programs
• Toyota – Sort of• Fully embracing hybrids• Avoiding EVs as much as possible
• China forcing production

Data that drives tomorrow.February 2019
China BEV Market SizingManufacturers Adding BEVs
• BAIC Motor (10)• BAIC-Yinxiang (2)• Beijing Benz (4)• Beijing Hyundai (1)• Beiqi Foton (2)• Blue Sky NEV (5)• BMW Brilliance (5)• Brilliance Jinbei (1)• BYD (5)• BYD Daimler (1)• CH Auto (1)• Changan Auto (7)• Changan Ford (1)• Changan PSA (1)• Chehejia (1)• Chery (6)• Chery-JLR (1)• Chongqing Lifan (2)• Dongfeng Honda (2)• Dongfeng Limited (5)• Dongfeng Motors (3)• Dongfeng Nanchong (1)• Dongfeng PSA (7)• Dongfeng PV (1)• Dongfeng Yu’an (1)• Dongfeng Yueda Kia (1)• Dongfeng –Luxgen (1)
26
• FAW Car (2)
• FAW Haima (1)
• FAW Jiqing (1)
• FAW Toyota (5)
• FAW Volkswagen (11)
• FDG Electric Vehicles (1)
• Fujian New Longma (1)
• Future Mobility (3)
• GAC Changfeng (3)
• GAC Honda (2)
• GAC Motor (5)
• GAC Toyota (6)
• Geely Group (23)
• Great Wall Automobile (3)
• Greenwheel (2)
• Guojin Auto (3)
• Haima Zhengzhou (2)
• Hawtai (2)
• HK Motors (1)
• Honda China (2)
• Hozon Auto (3)
• Jianghuai (7)
• Jiangjuai-VW (1)
• Jiangling Holdings (6)• Kandi Electric Vehicles (1)• LeapMotors (1)• LeEco (1)• Link Your (1)• Nanjing Iveco (1)• NEVS (2)• NIO (2)• Qoros (2)• SAIC Commercial (3)• SAIC GM (2)• SAIC GM Dongyue (2)• SAIC Motor (2)• SAIC VW (10)• SAIC-GM-Wuling (2)• Shanghai Maple (3)• Sichuan Auto (3)• South-east Automobile (3)
• Tesla (2)• WM Motor (2)• Xiapeng (1)• Youngman Lotus (1)• Youxia (1)• Yudo Auto (2)• Zotye Auto (3)• Zotye-Ford (4)
Red Entries are OEMSonly producing EVs
Some nameplates built by
more than one OEM
219
2026 BEV Models

Data that drives tomorrow.February 2019

Data that drives tomorrow.February 2019
NAFTA+ (2026)
NAFTA+14%
Global
GLOBAL PLATFORMS
NAFTA+80%
NAFTA Only
NA VOLUME
28
Light Vehicle Platforms containing NAFTA production and at least one other country in ROW
423 16Platforms produced worldwide
NAFTA+ Platforms
14.4 MillionNAFTA+
North America Volume
Source: AutoForecast Solutions – January 2019

Data that drives tomorrow.February 2019
NAFTA+ Opportunity/Risk (2026)
NAFTA+43%
ROW
GLOBAL LESS NA PRODUCTION
NAFTA
ROW72%
GLOBAL NAFTA+ PRODUCTION
29
37.6 MillionNAFTA+ volume
Produced OUTSIDE North America
52.4 MillionNAFTA+
Global Volume
Source: AutoForecast Solutions – January 2019

Data that drives tomorrow.February 2019
30

Data that drives tomorrow.February 2019
Disruption: The Fine Line Between Risk and Opportunity
Balancing a fickle consumer with an impatient shareholder
All players are jockeying for position in a race with no clear finish line
The goal is to understand the opportunities, develop a value proposition to defend core operations,
and identify areas for growth.
31

Data that drives tomorrow.February 2019
32
AutoForecast Solutions (AFS) provides vehicle, powertrain, and drivetrain production forecasting and advisory services to the
global automotive industry.
AFS helps our customer…
Understand the opportunities Develop a value proposition to defend core
operations Identify areas for growth.
AFS Forecast AFS Portfolio
AFS Planning AFS Scenario
Global Automotive Business Intelligence Solutions & Advisory
Services

Data that drives tomorrow.February 2019
33
Data that drives tomorrow.February 2019
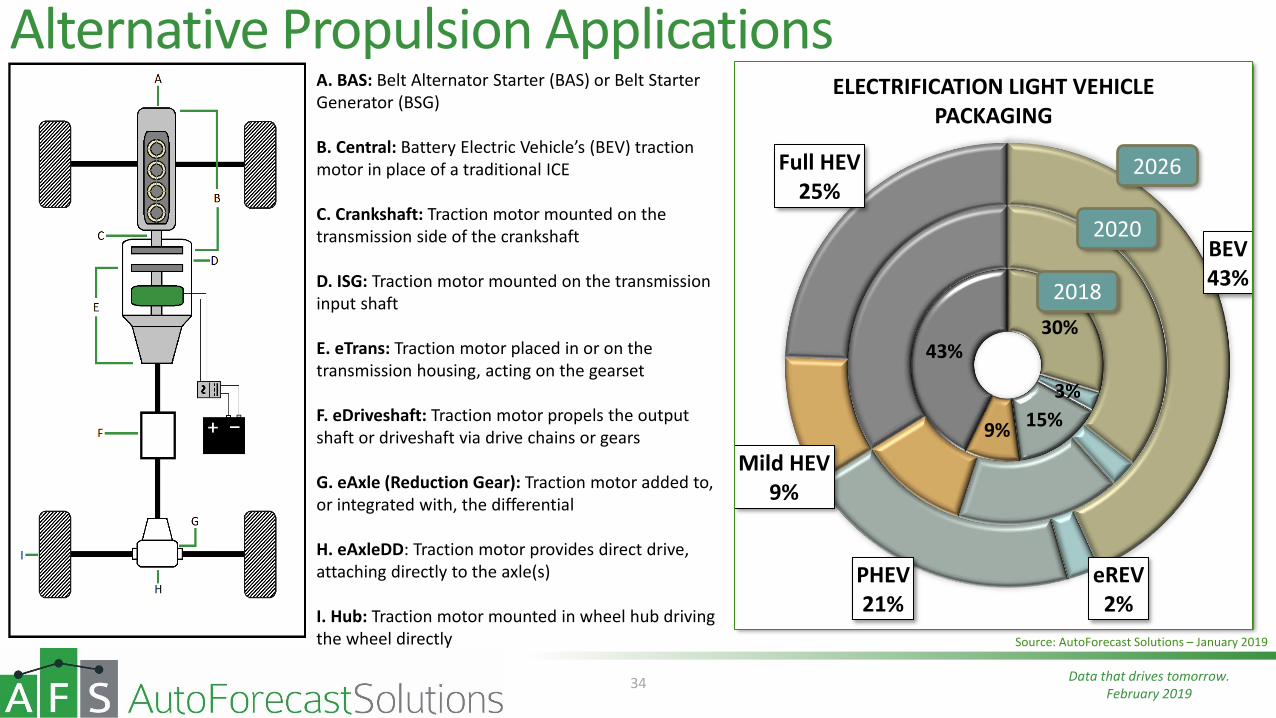
Alternative Propulsion Applications
34
30%
3%
15%9%
43%
BEV43%
eREV2%
PHEV21%
Mild HEV9%
Full HEV25%
ELECTRIFICATION LIGHT VEHICLE PACKAGING
Source: AutoForecast Solutions – January 2019
2018
2020
2026
A. BAS: Belt Alternator Starter (BAS) or Belt Starter Generator (BSG)
B. Central: Battery Electric Vehicle’s (BEV) traction motor in place of a traditional ICE
C. Crankshaft: Traction motor mounted on the transmission side of the crankshaft
D. ISG: Traction motor mounted on the transmission input shaft
E. eTrans: Traction motor placed in or on the transmission housing, acting on the gearset
F. eDriveshaft: Traction motor propels the output shaft or driveshaft via drive chains or gears
G. eAxle (Reduction Gear): Traction motor added to, or integrated with, the differential
H. eAxleDD: Traction motor provides direct drive, attaching directly to the axle(s)
I. Hub: Traction motor mounted in wheel hub driving the wheel directly

Data that drives tomorrow.February 2019
The Global Automotive OutlookOpportunity Identification in a Disruptive Market
February 20, 2019
Joseph McCabe, President855.734.4590 ext. 1001