The Financial and Information Value Chain: B2B e … Financial and Information Value Chain: ......
46
The Financial and Information Value Chain: B2B e-Payments and Purchasing Cards Two Reports by Celent Communications
-
Upload
vuongkhanh -
Category
Documents
-
view
215 -
download
2
Transcript of The Financial and Information Value Chain: B2B e … Financial and Information Value Chain: ......

The Financial and Information Value Chain: B2B e-Payments and Purchasing Cards
Two Reports by Celent Communications

MasterCard International provides e-B2B payment
solutions via member financial institutions that
enable organizations of all sizes to optimize the
financial and information supply chain. The
MasterCard advantage lies in our ability to
understand and respond to the unique needs of
businesses in implementing e-B2B payment
solutions. Now, more than ever, organizations are
concerned about corporate accountability,
regulatory compliance, and financial transparency.
The MasterCard e-B2B Choice™ strategy provides
companies with flexible platforms and a range of
vendors from which to choose. Our goal is
to enable organizations to benefit from the
efficiencies of a fully automated supply chain with
minimum implementation costs.
Reprinted with permission. MasterCard bears no responsibility for the content.
www.celent.com
The Financial and Information
Value Chain: B2B e-Payments
and Purchasing Cards

Integ
rating
e-Paymen
ts

OCTOBER 2003
By Alenka [email protected]
and Ariana-Michele [email protected]
Celent Communications183 State StreetFifth FloorBoston, MA 02109USA
Tel.: +1.617.573.9450Fax: +1.617.573.9455Email: [email protected]
www.celent.com
MasterCard Internationale-Commerce and e-B2B Center ofExcellence2000 Purchase StreetPurchase, NY 10577USA
Philip PhilliouVice President, e-Business and EmergingTechnologies (eB2B)Tel.: +1.914.249.6841Email: [email protected]
Shari KrikorianVice President, e-Business and EmergingTechnologies (eB2B)Tel.: +1.914.249.5871Email: [email protected]
www.mastercardbusiness.com/e-B2B
TABLE OF CONTENTS
Integrating e-Payments into the Financialand Information Supply Chain
THE MOMENTUM AND MOTIVATION . . . . . . . . . . . . . . . . . . . . . . . . . .2
OVERCOMING THE CRUXES . . . . . . . . . . . . . . . . . . . . . . .2
THE PURCHASING CARDS: A PRIME E-PAYMENT CANDIDATE . . . . . . . . . . . . . . . . . . . . . . . . . . .3
MASTERCARD: A CENTRIPETAL FORCE . . . . . . . . . . . . . . . . . . . . . .4
INTRODUCTION TO MASTERCARD e-P3 . . . . . . . . . . . . . .4
INITIAL IN-ROAD WITH XIGN PARTNERSHIP . . . . . . . . . . .6
BUILDING A FAST-TRACK WITH VELOSANT . . . . . . . . . . .6
CROSSING BORDERS WITH BURNS . . . . . . . . . . . . . . . . .7
OUTLOOK . . . . . . . . . . . . . . . . . . . . . . . . . . . . . . . . . . . . . . . . . . . . . . .9
Purchasing Cards in the US
EXECUTIVE SUMMARY . . . . . . . . . . . . . . . . . . . . . . . . . . . . . . . . . . .11
COMMERCIAL CARDS OVERVIEW . . . . . . . . . . . . . . . . . . . . . . . . . .12
COMMERCIAL CARDS . . . . . . . . . . . . . . . . . . . . . . . . . . . . . . . . . . . .12
THE MECHANICS OF COMMERCIAL CARDS . . . . . . . . . .15
PURCHASING CARDS (P-CARDS) IN THE US . . . . . . . . .16
MARKET POTENTIAL . . . . . . . . . . . . . . . . . . . . . . . . . . . . . . . . . . . . .19
B2B PAYMENTS . . . . . . . . . . . . . . . . . . . . . . . . . . . . . . . . .19
IMPEDIMENTS . . . . . . . . . . . . . . . . . . . . . . . . . . . . . . . . . .21
US PARTICIPANTS . . . . . . . . . . . . . . . . . . . . . . . . . . . . . . . . . . . . . . .23
CASE STUDY : GSA . . . . . . . . . . . . . . . . . . . . . . . . . . . . . . . . . . . . . .26
THE GSA . . . . . . . . . . . . . . . . . . . . . . . . . . . . . . . . . . . . . . .26
INTERESTING INITIATIVES . . . . . . . . . . . . . . . . . . . . . . . . . . . . . . . .30
CAPTURING & UTILIZING DATA . . . . . . . . . . . . . . . . . . . .30
ONE-CARD PROGRAMS . . . . . . . . . . . . . . . . . . . . . . . . . .31
FUTURE TRENDS . . . . . . . . . . . . . . . . . . . . . . . . . . . . . . . . . . . . . . . .32
GLOSSARY . . . . . . . . . . . . . . . . . . . . . . . . . . . . . . . . . . . . . . . . . . . . .34
ABOUT CELENT . . . . . . . . . . . . . . . . . . . . . . . . . . . . . . . . . . . . . . . . .36
ABOUT MASTERCARD . . . . . . . . . . . . . . . . . . . . . . . . . . . . . . . . . . . .37
© 2003, Celent Communications. Any reproduction of this report by any means is strictly prohibited.
Reprinted with permission. MasterCard bears no responsibility for the content.

www.celent.com
1
Integrating e-Payments into the Financial and Information Supply Chain
A N E X A M I N A T I O N O F M A S T E R C A R D e - P 3

Integrating e-Payments into the Financial and Information Supply Chain August 2003
© 2003, Celent Communications. Reproduction prohibited. www.celent.com
2
T H E M O M E N T U M A N D M O T I V A T I O N
The financial supply chain at most companies is a source of aggravation with the pain being shared by both buyers and sellers (Figure 1 ). While notable in-roads have been made to automate internal processes (e.g., through the implementation of ERP systems), building an electronic bridge between buyers and sellers has been fraught with challenges. Paper purchase orders and invoices continue to be the norm while the check continues to rule the payment realm.
O V E R C O M I N G T H E C R U X E S
Most companies agree that there must be a better way to run their financial supply chain. A better way has, however, proven elusive until recently. The promises of electronic invoice presentment and payment (EIPP) had been widely touted but hardly realized. First generation solutions ignored the buyer which proved fatal to their future. Second generation solutions are rectifying the shortcomings of their predecessors and are overcoming two cruxes:
Figure 1: The Painful Financial Supply Chain
Source: Celent Communications
Payment and remittance received
Seller
Buyer
Remittance attached to
payment
Payment authorized/
initiated
If sent to lockbox,remittance info
forwarded to seller
Seller’s bank
Seller
Invoice sent
Buyer
Invoice infoentered intoA/P system
SellerBuyer
Invoice infomatched with PO
Remittance infoentered into A/R
system
Seller
Remittance inforeconciled with
bank credits
Buyer Seller
Volley of messages: phone, fax, e-mail, etc.
Manualentry
Check cut and remittance
sent, occasionally a letter is typed
Manual entryVolley of messages
Risk of incomplete remittance info
Purchase order sent
Buyer

Integrating e-Payments into the Financial and Information Supply Chain August 2003
© 2003, Celent Communications. Reproduction prohibited. www.celent.com
3
• Displacing the paper while preserving the fundamental objectives of the process and minimizing implementation time
• Generating a win-win for both buyers and sellers (Figure 2 )
T H E P U R C H A S I N G C A R D : A P R I M E e - P A Y M E N T C A N D I D A T E
The purchasing card is a prime candidate for integration into the financial supply chain. It has all the prerequisites:
• Large installed base
7.9 million p-cards in 2003
• Open network, accessible to any size company
In contrast to the original electronic purchase order/invoicing vehicle, EDI, a p-card based EIPP model is relatively inexpensive and immensely easier to implement.
• Well-positioned to minimize disruption Most large and many midsize companies have a p-card process in place.
The traditional p-card, however, requires significant enhancement to succeed in the EIPP realm. The next section discusses MasterCard’s initiatives to significantly beef up the p-card’s functionality and integrate it into the financial supply chain.
Figure 2: Second Generation EIPP Solutions Equalize the Benefits
Source: Celent Communications
Buyer Seller/Supplier
• Capture discounts (if desired)–Traditional: “2/10 net 30”–Negotiate larger discounts
-- e.g., For earlier, date-certain payment
• Eliminate under certain schemes:–Credit check/Letter of Credit–Surety services/Insurance
• Realize efficiency gains–Reduce A/R DSO–Pay down debts faster
• Under certain schemes, gain surety and minimize collections and bad debt
• Achieve more accurate cash forecasting• Eliminate:
–Unearned discounts–Credit-related delays/costs
• Strengthen trading relationships• Optimize existing technology investments• Minimize human error• Realize efficiency gains
–Reduce staffing requirements–Streamline admin and workflow

Integrating e-Payments into the Financial and Information Supply Chain August 2003
© 2003, Celent Communications. Reproduction prohibited. www.celent.com
4
M A S T E R C A R D : A C E N T R I P E T A L F O R C E
MasterCard stands out for taking a leadership role in pulling together the pieces required to incorporate e-payments into the financial supply chain. Three years ago, it recognized that in order to position the p-card as the payment option of choice, it needed to partner with leading EIPP solution providers and build a global infrastructure. Today, MasterCard is well on its well to realizing its vision (Figure 3 ).
I N T R O D U C T I O N T O M A S T E R C A R D e - P 3
The culmination of MasterCard’s initiatives is MasterCard e-P3, a purchasing card-based EIPP system (Figure 4 ). MasterCard e-P3 was launched this spring and has already been implemented by several large buyers. The salient features of MasterCard e-P3 are:
• Buyer-centric model geared toward enhancing the buyer’s control over the process from vendor relationship management, terms negoti-ation, to payment timing and dispute management
• Level III data available by tapping MasterCard Global Data Reposi-tory and leveraging MasterCard SmartLink as well as MasterCard’s Smart Data Online
• Minimal implementation requirements by leveraging existing sys-tems and developing adapters that translate transaction data into appropriate formats
Figure 3: MasterCard’s P-Card Renaissance
Source: Interviews and Celent Communication
TraditionalTraditional RenaissanceRenaissance
Ticket Size
PurchasingCategory
Value-Added
US$200-600
Non-PO
Limited:• Control• Tracking• Data
US$200-10,000
Non-PO and PO
Expanded:• Enhanced control for buyers• Integration into an automated
financial value chain• Level III data• Simplified and relatively
inexpensive settlement process (Europe)

Integrating e-Payments into the Financial and Information Supply Chain August 2003
© 2003, Celent Communications. Reproduction prohibited. www.celent.com
5
• Integration into ERP and accounting systems (e.g., SAP, Oracle, PeopleSoft, Microsoft Great Plains, and GEAC), extending the use of p-cards to purchase order transactions and hence to larger ticket sizes
Figure 4: MasterCard e-P3
Source: MasterCard and Celent Communications*Non-card options include MasterCard Remote Payment and Presentment Service and ACH.**Quasi-escrow service whereby the buyer can put a hold on payment until a specified time or event.
Buyer SupplierOrder
Invoice
• Invoice capture- Web form- PO “flip”- e-file- Paper converted into electronic
• Real-time filter- Buyer-defined validation rules- Exception management
Electronic process enabled by MasterCard
e-P3 and partners
Legend:
• Includes purchase orders• Originates within ERP or another
system
• Payment initiation- P-card (or non-card options*)
• Remittance processing- Format mapping- E-mail, EDI, FTP
• Buyer controlled settlement- “Escrow” option**- Scheduled and deferred payments
Payment
ERP, Procurement,
Accounts payablesystems
ERP, Billing,Accounts receivable systems
• Approval routing- E-mail based- A/P controlled

Integrating e-Payments into the Financial and Information Supply Chain August 2003
© 2003, Celent Communications. Reproduction prohibited. www.celent.com
6
In order to provide these features, MasterCard has been establishing exclusive partnerships with leaders in the EIPP space, beginning with Xign and more recently with Velosant and Burns (a U.K.-based company).
I N I T I A L I N - R O A D W I T H X I G N P A R T N E R S H I P
The first version of MasterCard e-P3 utilizes the Xign Payment Services Network. In the short history of the electronic financial supply chain, Xign is a veteran. It has established three strongholds. First, it has built a buyer-centric model that is able to extract POs. Second, it has been a pioneer in developing a system to reliably extract invoice data from an ERP system (and other systems) and translates them into buyer-specified format. This forte was the reason MasterCard knocked on its door. Third, it has developed a means to attach rich remittance data to ACH payments. Xign, alone, has been experiencing steady transaction volume growth and hit the US$10 billion mark in 2002 and has amassed 6,500 suppliers.
B U I L D I N G A F A S T - T R A C K W I T H V E L O S A N T
MasterCard’s partnership with Velosant brings a promising EIPP solution provider (BillingZone acquired by eOne Global, Velosant’s parent company) and a payment processing behemoth, First Data Corporation (majority owner of eOne) to the table. The entry of FDC into the arena is heightening interest as well as action on the part of financial institutions.
Velosant brings several key elements to MasterCard e-P3. First and foremost, it has built an open system which lends itself to widespread adoption. Its network-based model is bank neutral. Secondly, its system can accommodate paper transactions. Given that paper will not

Integrating e-Payments into the Financial and Information Supply Chain August 2003
© 2003, Celent Communications. Reproduction prohibited. www.celent.com
7
disappear overnight, this functionality will prove useful in the medium-term. Third, it opens the door to leveraging First Data’s merchant and card processing infrastructure (Figure 5 ).
C R O S S I N G B O R D E R S W I T H B U R N S
MasterCard recognized that a focus on the U.S. market is myopic and that significant opportunities for MasterCard e-P3 exist in Europe and Asia-Pacific. Wisely it has chosen to team with a solution provider with European expertise, Burns e-Commerce Solutions in the U.K., rather than simply adopting its U.S. solution to the various exigencies of the individual countries. Similar to Xign, Burns is a relatively small, highly competent e-financial supply chain provider. Unlike Xign which was born from the Internet boom, Burns has roots as an EDI service provider. Burns has 30,000 suppliers connected to its platform and its annualized transaction volume hit US$5 billion (April 2003).
Burns brings two critical elements to MasterCard e-P3:
• A comprehensive electronic offering (Burns Business Exchange Ser-vice, or beX), which includes all documentation (both financial and supply chain related)
Figure 5: MasterCard e-P3 Powered by Velosant
Source: MasterCard and Celent Communications
Buyer Supplier
POP-card
Authorization/settlementTransaction #Level III data
Level III data
Issuer/Processor Supplier’s Bank
FundingAuth./settle.Transaction #
Statementw/ Level IIIPayment
PaymentDiscount rate
PO flip to invoice

Integrating e-Payments into the Financial and Information Supply Chain August 2003
© 2003, Celent Communications. Reproduction prohibited. www.celent.com
8
• A platform that meets the myriad of country-level requirements for transactions that utilize electronic rather than paper documents (in contrast to the U.S., this type of legislation is cumbersome in Europe) and meets country-specific value-added tax requirements
Currently, MasterCard and Burns are striving to launch MasterCard e-P3 Europe by the beginning of Q4 this year. Beyond 2003, they have their sights on expanding MasterCard e-P3 into Asia-Pacific markets, but plans have not yet been formalized.
Integrating e-Payments into the Financial and Information Supply Chain August 2003
© 2003, Celent Communications. Reproduction prohibited. www.celent.com
9
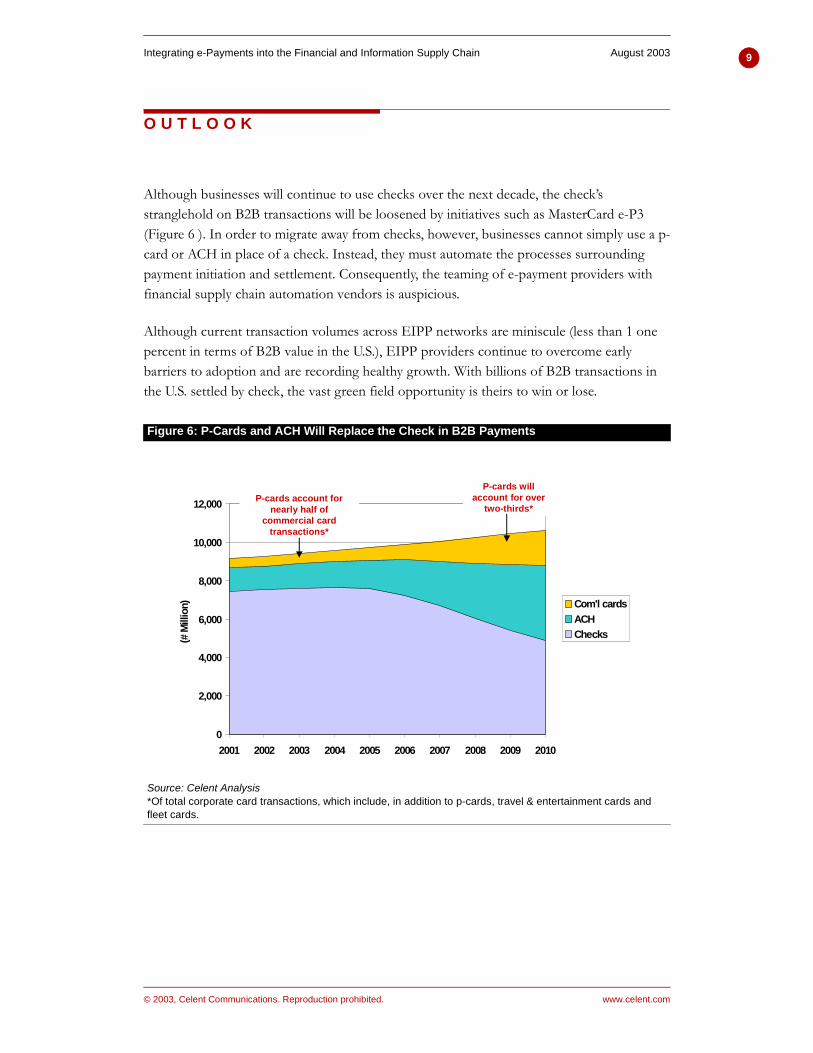
O U T L O O K
Although businesses will continue to use checks over the next decade, the check’s stranglehold on B2B transactions will be loosened by initiatives such as MasterCard e-P3 (Figure 6 ). In order to migrate away from checks, however, businesses cannot simply use a p-card or ACH in place of a check. Instead, they must automate the processes surrounding payment initiation and settlement. Consequently, the teaming of e-payment providers with financial supply chain automation vendors is auspicious.
Although current transaction volumes across EIPP networks are miniscule (less than 1 one percent in terms of B2B value in the U.S.), EIPP providers continue to overcome early barriers to adoption and are recording healthy growth. With billions of B2B transactions in the U.S. settled by check, the vast green field opportunity is theirs to win or lose.
Figure 6: P-Cards and ACH Will Replace the Check in B2B Payments
Source: Celent Analysis*Of total corporate card transactions, which include, in addition to p-cards, travel & entertainment cards and fleet cards.
0
2,000
4,000
6,000
8,000
10,000
12,000
2001 2002 2003 2004 2005 2006 2007 2008 2009 2010
(# M
illio
n) Com'l cardsACHChecks
P-cards account for nearly half of
commercial card transactions*
P-cards will account for over
two-thirds*

Purch
asing
Card
s
www.celent.com
1
Purchasing Cards in the US

Purchasing Cards in the US AUGUST 2003
© 2003, Celent Communications. Reproduction prohibited. www.celent.com
11
E X E C U T I V E S U M M A R Y
Commercial cards have long been used by businesses to make corporate purchases. Today, businesses can choose card programs based upon their expenditures and employee spending habits. Currently, businesses may choose between travel and entertainment (T&E), fleet and small business cards as well as purchasing cards (p-cards). Although all are popular in their own respect, p-card’s popularity has grown at a higher rate than their counterparts.
P-cards have appeared in the US to assist corporations in simplifying small, yet frequent purchases. P-cards have the basic capabilities of a credit card, allowing corporations to control and monitor employee spending. Corporations may also place additional restrictions on the card’s spending power by restricting the spend limit, merchant type and/or frequency of purchases. In addition, p-cards promise enhanced line-item detail, which can greatly assist accounting departments and managers in reconciling expenses.
The p-card market is indeed competitive. The two major card associations (MasterCard International and Visa) provide p-cards via their member banks, and American Express issues p-cards as well. For many, it is an intense battle for market share. To survive, competitors must constantly introduce new product features and functionalities.
Given the market’s healthy competition and promise, we expect to see strong growth in the p-card market. In 2001, approximately US$65.9 billion was spent using p-cards and we expect this trend to continue, with spending levels reaching US$164.7 billion by 2005.
Figure 1: Growth of Purchasing Cards by Transaction Volume
Source: Celent Communications
164.7
130.7103.7
82.3
47.0
65.9
0
40
80
120
160
200
2000 2001 2002 2003 2004 2005
(in U
S$ b
illio
ns)

Purchasing Cards in the US AUGUST 2003
© 2003, Celent Communications. Reproduction prohibited. www.celent.com
12
C O M M E R C I A L C A R D S O V E R V I E W
C O M M E R C I A L C A R D S
Commercial credit cards have long been used to facilitate employee spending on corporate purchases. Commercial credit cards are a convenient way to give spending power to employees who would otherwise be given low spending limits or who would be unable to obtain credit because of high credit risk. In addition, commercial cards have the benefit of consolidating all purchases on a single monthly statement, making it easier for employees to keep track of their purchases. They can also assist accounting employees with the cumbersome task of reconciling employee expense forms with a plethora of receipts and invoices.
Commercial cards are not without drawbacks, however. Companies using commercial cards have had trouble controlling employee spending and avoiding paying for unauthorized purchases. Over the years, card abuse has resulted in large write-offs and management headaches. Card providers have developed or enhanced available commercial card programs to alleviate the problem. These initiatives cater to company size, spending category or purpose.
Today, cards essentially fall into the following four product categories:
• Small Business Cards. Small businesses (defined as companies with fewer than 500 employees) have used credit cards as a way to establish credit lines and as an alternative to traditional bank loans. Personal credit cards have also been used to finance young companies. Approx-imately 45% of small businesses use personal credit cards for small business purchases, whereas only 33% use business credit cards. How-ever, studies have shown that companies with more than five employ-ees increasingly use corporate credit cards more frequently.
Credit cards for small businesses are similar to their consumer coun-terparts but offer small businesses higher credit limits, better interest rates, additional reporting capabilities and insurance coverage, as well as the ability to distribute multiple cards under the same account. The needs of small businesses are unique and are met by credit card solu-tions that differ from those offered to larger companies. For this rea-son, small business cards are often left out of the traditional, commercial-card product suite.
Purchasing Cards in the US AUGUST 2003
© 2003, Celent Communications. Reproduction prohibited. www.celent.com
13
• Travel and Entertainment Cards (T&E). These cards are given to employees for travel expenses such as plane tickets, car rentals, meals and entertainment. These cards can be issued in conjunction with travel organizations and with travel-related benefits. They may also be issued with constraints, such as price limits and venue restrictions, to ensure that purchases are made in accordance with corporate policy.
• Fleet Cards. Fleet cards are used to purchase fuel, maintenance and repair for corporate vehicles. Enhanced purchasing data is captured electronically at the pump, which gives fleet managers timely and detailed information. These cards also let a company control fuel-card use at the driver and vehicle level.
• Purchasing Cards (P-cards). Purchasing cards are multi-purpose cards meant to curb, control and manage employee spending. P-cards allow card administrators to establish spending restrictions so that an employee can only use the card at specific vendors for specific items, and only by keeping total purchases within a specified range. These cards are typically geared for purchases of less than US$5,000. In addi-tion, p-cards promise to offer better transaction data to assist manag-ers in understanding and allocating corporate expenses.
The latter three types of commercial cards can vary significantly with respect to average transaction size. This is no surprise given that a tank of gas costs less than a transcontinental flight, which in turn costs less than a computer. This is not to imply that the average transaction size will vary significantly, but rather to suggest that the span of goods and services purchased is great. Figure 2 below shows the average transaction value for each type of card.

Purchasing Cards in the US AUGUST 2003
© 2003, Celent Communications. Reproduction prohibited. www.celent.com
14
Commercial cards are distributed to a variety of employees depending on their role in the company. As a result, it is unlikely that any single employee will hold all three kinds of cards (see Figure 3 below).
T& E cards have historically dominated the commercial card industry with respect to number of cards issued and charge volume. Their dominance is largely the result of their longevity, their support by the travel industry, and their status as a focal point of card providers. However, p-cards have picked up significant momentum in the market and have recently captured the lead. The breakdown of commercial card charge volume with respect to card category is shown below in Figure 4 .
Figure 2: Average Transaction Size by US Commercial Card
* Note: Average is for private sector only.Source: Celent Communications
Figure 3: Percentage of Employees Who Hold Multiple Cards
Total Number of commercial credit cards: 35.1 millionSource: Celent Communications
$30
$240
$175
$- $50 $100 $150 $200 $250 $300
P-Card*
T&E
Fleet
Average Value of Transaction
P-Card
Fleet
T&E
30%35%
20%
5%

Purchasing Cards in the US AUGUST 2003
© 2003, Celent Communications. Reproduction prohibited. www.celent.com
15
T H E M E C H A N I C S O F C O M M E R C I A L C A R D S
The participants in the commercial card industry are virtually the same as those in the consumer credit card market and their roles are quite similar. However, the commercial card industry is more complex and participants’ roles are even more distinct. The breakdown of participants is shown below in Table 1 .
Figure 4: Distribution of US Commercial Cards by Charge Volume 2001
Total commercial card charge volume: US$165.4 billionSource: Celent Communications
Table 1: Intermediaries in the Commercial Card Process
Intermediary Role
Card issuer Sets up card program at buyer’s company, issues cards to company employees, and provides electronic invoices (e.g.,Citibank)
Processor Provides a variety of services, including authorization and data delivery(e.g., third-parties like First Data Corp and TSYS.)
Network Expedites the transfer of transaction data between parties (e.g., MasterCard)
Merchant acquirer
Enables suppliers to accept cards by providing necessary hardware and software to process transactions, and deposits payments into supplier’s bank account
Seller/Merchant Conveys transaction data (Level I, II, or III) to merchant acquirer
Source: Celent Communications
Small Biz24%
Fleet1%
P-Card38%
T&E37%

Purchasing Cards in the US AUGUST 2003
© 2003, Celent Communications. Reproduction prohibited. www.celent.com
16
Figure 5 below depicts the events that occur during a commercial card transaction. Again, this process resembles the consumer credit card market. Differentiating factors reside in the authorization and settlement processes.
P U R C H A S I N G C A R D S ( P - C A R D S ) I N T H E U S
This report will highlight an increasingly popular commercial card: the purchasing card (p-card). P-cards emerged in the US in the late 1980s as a product geared for governmental agencies. During the 1990s, p-cards were launched in the private sector. Today, p-cards are beginning to capture a good portion of the commercial purchasing market. Interest in p-cards is driven by their strong value proposition to companies. P-cards are intended for typical employee purchases and may be used as regular credit cards. Therefore, they offer the flexibility of making purchases online or at the point of sale. P-cards are meant not to replace T&E or fleet cards, but they are useful for purchases not already covered by either type of card, such as administrative goods or services. (See Table 2 on page 9 for examples of p-card purchases).
Figure 5: Commercial Credit Card Process
Source: Celent Communications
Merchant submitstransaction request
Authorization provided
Buyer uses card
0000 0000 0000 0000Sssss jjjjjj 000000 00
BANK
Card Network
Buyer’s credibilitychecked and approvedby Issuer
Credit inquiry transferredthrough issuing processor
Transfers transactionto correct card systemby acquiring processor
Authorizationrequested by Acquirer
Good(s) purchased
Merchant sendsrequest for payment
Transactionposted to account Network sends request
and consolidates all transactions on network for settlement
Settlement
Merchant submitstransaction request
Authorization provided
Buyer uses card
0000 0000 0000 0000Sssss jjjjjj 000000 00
BANK
0000 0000 0000 0000Sssss jjjjjj 000000 00
BANK
Card Network
Card Network
Buyer’s credibilitychecked and approvedby Issuer
Credit inquiry transferredthrough issuing processor
Transfers transactionto correct card systemby acquiring processor
Authorizationrequested by Acquirer
Good(s) purchased
Merchant sendsrequest for payment
Transactionposted to account Network sends request
and consolidates all transactions on network for settlement
Settlement

Purchasing Cards in the US AUGUST 2003
© 2003, Celent Communications. Reproduction prohibited. www.celent.com
17
P-cards offer managers the added benefit of curbing and monitoring employee spending. When a p-card is issued to an employee it may be issued with constraints upon the usual spending limit. P-cards can also be configured in such a way that an employee can only use a card for transactions of a certain amount, at a certain merchant or store, and for certain goods. For the time being, p-cards, by default, are issued with spending limits typically between US$2,500 and US$5,000. Some of the ways in which the p-card can be configured are shown below in Table 3 .
Not only do p-cards control employee spending, but they also offer the added benefit of expense tracking to accounting departments. Aside from the convenience of receiving one credit card statement, p-cards hold the potential to capture detailed information about each transaction, detail that extends well beyond what is delivered via a normal credit card transaction.
A credit card transaction is transmitted with one of three levels of data.
• Level I. Level I data is the minimal amount of data and includes basic information such as the transaction date, purchase amount and mer-chant. Any merchant that is able to accept credit cards is able to trans-mit Level I data.
• Level II. The next level, Level II, transmits tax information which is most often used by businesses.
• Level III. Considered the optimal level, Level III data is generated for purchasing cards and can contain up to 99 line-items of data including all Level I and Level II data. This capability is extremely promising to accounting departments which spend significant amounts of time rec-onciling invoices with purchase orders, interpreting credit card state-
Table 2: Common Categories for P-Card PurchasesOffice Supplies Books Subscriptions
Machine Parts Janitorial Supplies Stationery
Business Cards Printing and Copying Services Seminars
Catering Flowers Computer Software & Hardware
Promotional Items Equipment Transport Telephone Equipment
Pagers Meals Courier Services
Table 3: Possible Parameters for a P-Card ProgramStandard Industrial Classification (SIC) Codes Frequency of Purchases
Dollar Value of Transaction Total Spending for Month or Billing Cycle
Merchants Transaction Limits by Merchant Type

Purchasing Cards in the US AUGUST 2003
© 2003, Celent Communications. Reproduction prohibited. www.celent.com
18
ments, and mapping the expenses to their general ledgers. Table 4 on page 10 lists some examples of the line-item details that are included in each level of data.
Level III data also increases the manager’s ability to monitor employee spending with p-cards. The Internet has increased this benefit because managers can now access p-card statements online, not only to view historical charges, but also to view transactions for purchases made as recently as two days before.
Of course, as with credit card payments in general, using p-cards for common purchases like office supplies helps reduce the cost of paying for goods and services with a check. Traditionally, it costs a company approximately US$150 to process a purchase order and cut a check. Industry estimates suggest that p-cards can reduce this cost by as much as 55 percent. The typical cost of a p-card program is minimal compared to the reduction in labor cost associated with a streamlined accounting procedure. The cost typically associated with a p-card program is comprised of the traditional factors entailed in establishing a new corporate protocol. Employees need to be educated about the p-card program and made aware of the constraints and purpose of the program.
Table 4: Levels of Reporting Information
Data Level I Level II Level III
Supplier Name
Total Purchase Amount
Date
Merchant Category Code
Sales Tax Amount
Customer Code (i.e. accounting code)
Quantities
Product Codes
Product Descriptions
Ship-to Zip
Freight Amount
Duty Amount
Order or Ticket Number
Source: Celent Communications

Purchasing Cards in the US AUGUST 2003
© 2003, Celent Communications. Reproduction prohibited. www.celent.com
19
M A R K E T P O T E N T I A L
B 2 B P A Y M E N T S
Obviously, a commercial card’s success and growth depends heavily upon the economic health of the corporate industry. Over the past few years, momentum in the B2B payment world has declined slightly given the state of the economy. Yet, B2B payments are still expected to grow three percent annually over the next four years. (See Figure 6 below.) In 2001, B2B payments accounted for US$31.3 trillion and were comprised of approximately 9.1 billion payments.
Amazingly, despite the vast amount of IT spending and technological advances over the past several years to streamline payments, 81.6 percent of the 9.1 billion payments are made with checks. Figure 7 on page 12 shows the breakdown of the B2B payment world.
Figure 6: US B2B Payments
Source: Celent Communications
$32,114$31,300$33,141
$34,202$35,331
15,000
20,000
25,000
30,000
35,000
40,000
2001 2002 2003 2004 2005
(in U
S$ b
illio
ns)

Purchasing Cards in the US AUGUST 2003
© 2003, Celent Communications. Reproduction prohibited. www.celent.com
20
Figure 8 shows a related breakdown of the B2B payment world according to practicality and cost of payment method. For example, since Fedwires are costly to send they are best used for payments with high purchase value and low frequency.
Given that the average B2B payment is US$3,500, it is easy to see why p-cards, which may be used for purchases up to US$5,000, have significant potential.
Figure 7: Methods of Payment in the US B2B Market in 2001
Total: 9.1 billion transactions*ACH transactions exclude cash concentration transactions (used by corporations to consolidate accounts).Source: Celent Communications
Figure 8: Primary Choice of Payment Given Frequency and Purchase Price
Source: Celent Communications
Check81.6%
Com'l Cards5.2%
ACH*13.2%
HighFrequency
High PurchaseValue
Low PurchaseValue
LowFrequency
Checks,P-Cards
FedWire,CHIPS,
EDI
ACH,Checks
Checks

Purchasing Cards in the US AUGUST 2003
© 2003, Celent Communications. Reproduction prohibited. www.celent.com
21
I M P E D I M E N T S
Obviously, merchants play a key role in the p-card market. Unless merchants accept credit cards, credit cards themselves are of no use. While MasterCard and Visa are accepted by practically all merchants; the acceptance of American Express by merchants remains relatively low. Moreover, merchants are critical to capturing Level III data, which is potentially the most profitable piece of the puzzle. Unfortunately, they are not always willing to supply the data.
There are essentially two ways that Level III data can be transmitted with a card transaction. Either merchants can manually key all the product information into the card network, or they can download the information from their inventory management systems. The first option is clearly cumbersome and otherwise problematic. First, the merchant has to find the means to manually enter the data, usually via a separate PC software option. Then the merchant must be willing to take the additional time to key in the data. Moreover, once the method is established, the likelihood of human error is great. Therefore, even after resources are dedicated to convincing the merchant to key in the data, the data is not always reliable.
The second option, although costly, is often ideal, as it streamlines the process and significantly eliminates the probability of receiving bad data. Nonetheless, regardless of the option chosen by the merchant, merchants still pay a cost which drastically dampens a their enthusiasm for transmitting Level III data. Therefore, incentives need to be given to merchants to entice them into cooperating with the p-card industry.
Incentives are offered on a couple of different fronts. First, customers who have a significant influence over a merchant can simply dictate that the merchant become Level III-ready. Second, financial institutions are offering merchants lower discount rates for transmitting Level III data than would normally be charged for regular credit transactions. This is incredibly appealing to merchants, who may be charged over three percent. In addition, merchants can be made aware that if p-cards replaced checks, merchants could reduce the amount of paperwork required for processing and sending an invoice or processing checks. Today, it costs merchants approximately US$5.36 to send an invoice and process its payment.
Despite incentives, only approximately four percent of US merchants are equipped to transmit Level III data, and only 35 percent of all p-card transactions carry with them Level III detail. This is not terribly impressive and will significantly hinder the p-card market from reaching its fullest potential. Obviously, companies will not be enthusiastic about implementing a p-card program that promises Level III data when there are simply no merchants willing to supply it. This problem brings us the classic credit card conundrum of how to get merchants to sign on when there are no buyers and vice versa. To further complicate the problem, there is certainly no guarantee that the data file transmitted by the merchant will ultimately be accepted by the buyer’s enterprise resource planning (ERP) system.

Purchasing Cards in the US AUGUST 2003
© 2003, Celent Communications. Reproduction prohibited. www.celent.com
22
Table 5 below shows the necessary costs associated with accepting credit cards and becoming equipped to transmit Level III data. In addition, the table lists some examples of how the discount rates can be significantly reduced according to the level of data transmitted.
Table 5: Estimated Merchant Costs
Item Price (in US$)
Application fee $25 - $100 (regardless of data level)
1) Purchased terminal OR2) Leased terminal
1) $300 - $1,000 (Level I or II & one time) OR2) $20 - $80 (Level I or II & recurring)
1) PC software OR2) Internet/browser-based tool to connect inventory system to card system
1) $300 - $600 (Level III ONLY & one time) OR2) $150 - $300 (Level III ONLY & recurring)
Programming and implementation fees for inte-grated product
fees are negotiated
Merchant Discount fees1:1) Level I transaction data2) Level II transaction data3) Level III transaction data4) Face-to-face transactions5) Large ticket item rate (>US$6,300)
1) 2.50% - 3.50%2) 2.00% - 3.10%3) 1.75% - 2.87%4) 1.61% - 2.76% (+$0.10 per transaction)5) 1.10% - 2.10% (+$0.40 per transaction)
1) 1999/2000 industry ratesSource: www.ge.com/capital/cardservices/corpcard/suppliers3.htm and Celent Communications

Purchasing Cards in the US AUGUST 2003
© 2003, Celent Communications. Reproduction prohibited. www.celent.com
23
U S P A R T I C I P A N T S
American Express, MasterCard and Visa are the three major US purchasing card providers. Today, Visa holds the greatest share of the p-card market with respect to card sales. However, all three card providers are aggressively pursuing the market, so we can expect to see changes in the competitive landscape.
Figure 9: Distribution of P-Card Market Share with Respect to Charge Volume in 2001
Total charge volume: US$65.9 billionSource: Celent Communications
American Express
28%MasterCard
32%
Visa USA40%

Purchasing Cards in the US AUGUST 2003
© 2003, Celent Communications. Reproduction prohibited. www.celent.com
24
A sample of the US p-card issuer population and their corresponding card providers are given in Table 6 .
P-cards are widely used by government agencies, universities and other school systems, and in the private sector. Within the private sector, companies across a variety industries are rolling out p-card programs. Currently, while there is not a p-card adoption trend with respect to industry, there is a trend with respect to size. Larger companies in the US are greater users of p-cards than smaller firms. Only seven percent of mid-size companies utilize p-cards, whereas 72 percent of Fortune-100 companies have p-card programs. Figure 10 on page 17 shows the disparity between mid-size companies and the Fortune 100.
Table 6: Selected US Issuers of Purchasing Cards
Issuing Bank MC Visa Issuing Bank MC Visa
Allfirst Bank GE Capital Financial
American Express1 na na Harris Bank
AmSouth Bank JP Morgan Chase
Bank of America M&T Bank
Bank of Montreal MBNA
BankOne Mellon Bank
BCE Emergis2 National City Corporation
Branch Banking & Trust PNC Bank
Citibank Provident Bank
Columbus Bank & Trust Prudential Bank & Trust
Comerica SouthTrust Bank
Commerce Bank SunTrust
Compass Bank US Bank
Fifth Third Bank UMB Financial
First Hawaiian Bank Volvo Commercial Credit
First National Bank of Omaha Wells Fargo
First Tennessee Wright Express
MC: MasterCard International1) American Express is a closed-loop system and is, in essence, its own issuer2) Canadian bank - but is increasingly gaining share of the US market.Source: Celent Communications

Purchasing Cards in the US AUGUST 2003
© 2003, Celent Communications. Reproduction prohibited. www.celent.com
25
As Figure 10 indicates, the middle market is largely underserved by the p-card industry. This should be of no surprise given that the middle market is often overlooked by financial institutions who either re-purpose the tools they use for retail customers in order to serve small businesses, or cater to large and more profitable clients.
Figure 10: P-Card Use with Respect to Company Size
Note: Mid-size companies are defined as having an annual revenue greater than US$10 million and less than US$750 million. There are approximately 80,000 mid-size companies in the US.As of 12/31/01Source: Celent Communications
Mid-Size Companies
Other93%
P-Card Users
7%
Fortune 100 Companies
P-Card Users72%
Other28%

Purchasing Cards in the US AUGUST 2003
© 2003, Celent Communications. Reproduction prohibited. www.celent.com
26
C A S E S T U D Y : G S A
T H E G S A
The General Services Administration (GSA) was established in 1949 for the purpose of examining ways to improve the administrative services of the US federal government. In the last decade, the GSA created telecommuting centers, introduced all GSA employees to intranets and the Internet in 1996, and spurred the development of electronic commerce through their own established program.
One of the GSA’s goals was to create a migration path between paper-based and electronic systems in the mid-1990s. Hoping to simplify government purchases, the GSA issued a formal request for an integrated solution similar to a smart card. In November 1998, the GSA announced that it awarded contracts to Citibank, First National Bank of Chicago (now part of BankOne), Mellon Bank, NationsBank (now part of Bank of America) and US Bank. These five institutions would participate in the government’s SmartPay program. As part of this program, all five of these banks would supply the GSA with fleet, T&E, and p-cards and provide government agencies with the flexibility to choose any financial institution for their card programs.
Since the program’s inception, the GSA has made a real plan to offer government agencies flexible card programs, to maximize the benefits of a streamlined purchasing program, and to integrate the flexibility of each commercial card into one card (such one-card program are discussed below). In its fiscal year 2000, ending in September, SmartPay saved the government US$1.3 billion and is the largest program of its kind in the world today. The GSA is the largest holder of p-cards in the US.
Figure 11: The GSA is the Largest Holder of P-Cards in the US
Total number of US p-cards: 4 millionAs of 9/31/01Source: Celent Communications
Gov't10%
Private Sector90%

Purchasing Cards in the US AUGUST 2003
© 2003, Celent Communications. Reproduction prohibited. www.celent.com
27
Figure 12 below shows the p-card market share captured by each GSA contracted bank.
Figure 13 shows the success the government has had in encouraging government employees to use the program.
Figure 12: GSA Market Shares Held by the Five Card Issuers
As of December 2001; Total p-card holders: 385,413Source: Celent Communications and GSA
Figure 13: GSA Purchasing Card Spending Figures
Note: For fiscal years ending September 30Source: Celent Communications and GSA
Mellon Bank0.1%
Citibank25.3%
Bank of America18.3%
BankOne4.3%
US Bank51.9%
$140.7
$13,787.7
0
2,000
4,000
6,000
8,000
10,000
12,000
14,000
16,000
1991 1992 1993 1994 1995 1996 1997 1998 1999 2000 2001
(in U
S$ m
illio
ns) CAGR: 58%
Purchasing Cards in the US AUGUST 2003
© 2003, Celent Communications. Reproduction prohibited. www.celent.com
28
The top ten merchants visited by GSA p-card users in the organization’s fiscal year ending in 2000 are shown in Figure 14 below. The total sales accounted for by these top ten merchants represent only 34% percent of the total spent in fiscal year 2000. As Figure 16 shows, p-cards are used in a variety of locations and their purposes vary widely.
Interestingly, the average transaction amounts in the GSA program are more than double the average for the private sector as a whole. The average p-card transaction for GSA’s program is US$564, whereas the average p-card transaction for the private sector is approximately US$240.
Figure 14: Top Ten Merchant Categories
For fiscal year ending September, 2000Source: Celent Communications and GSA
Figure 15: Average Transaction Size for GSA Program
For fiscal year ending in September, 2001Source: Celent Communications and GSA
E:7%
F:6%
C 12%
J:5%
I:6%H:
6%G:6%
A:24%
B:21%D:
7%
A: Drugs, Drug Proprietaries, Druggist MiscB: Other Direct MarketersC: Government Services Not Elsewhere ClassifiedD: Catalog MerchantE: Direct MarkertingF: Computer, Computer Peripheral EquipmentG: Laboratory/Medical/Dental/Ophthalmic Hosp EqH: Financial Institution-Merchandise and ServiceI: Business Services - OtherJ: Industrial Supplies
$138
$564
$28
$- $100 $200 $300 $400 $500 $600
P-Card
T&E
Fleet
Average Value of Transaction

Purchasing Cards in the US AUGUST 2003
© 2003, Celent Communications. Reproduction prohibited. www.celent.com
29
Although the GSA uses two other commercial cards, Figure 16 below clearly indicates that the majority of its commercial card purchases are made with a p-card.
Figure 16: Distribution of GSA Cards by Sales
Total card volume: US$19.7 billion; For fiscal year 2001 ending SeptemberSource: Celent Communications and GSA
P-Card70%
T&E27%
Other3%

Purchasing Cards in the US AUGUST 2003
© 2003, Celent Communications. Reproduction prohibited. www.celent.com
30
I N T E R E S T I N G I N I T I A T I V E S
Interest in p-cards has picked up significantly in the past couple of years as technology has evolved to address the industry’s obstacles and their adoption by companies has grown. Several initiatives have been spurred by competition as card providers and issuers compete for market share.
C A P T U R I N G & U T I L I Z I N G D A T A
The greatest impediments to growth in the p-card industry are the difficulties associated with obtaining Level III data. Initiatives have emerged to address the issues and many have made progress. First, companies and financial institutions are attempting to alleviate the hardships suffered by merchants when supplying Level III data. Application service providers (ASPs) have emerged to provide a solution that requires no additional hardware or software. Some ASPs enable merchants to manually key in the data at the ASP’s Web site and the ASP then delivers the data to card reporting systems. Although the solution makes the purchase of additional software unnecessary, it does little to address the manual labor or human error involved. ASPs who are working to provide similar solutions include 3Delta Systems and Verisign.
In addition, many banks are acting as data cleansers for merchants who do not want to worry about the compatibility of their data files with their customers’ ERP systems, but just want to transmit the data. The banks are scrubbing the data for the p-card users and supplying them with the appropriate formats. Essentially, these banks realize the value of obtaining Level III data and will do whatever they can to offer it to their customers.
Over the past two years financial institutions have offered solutions that bridge the gap between the card networks and ERP systems and enhance the authorization process as well. In May 2001, MasterCard launched MasterCard Smart Link with SPS International. The software package integrates procurement information from MasterCard-issued p-cards with ERP systems. When a MasterCard p-card is used for online payment, the merchant first obtains authorization from the issuing bank before supplying the products. Upon authorization, the point-of-sale information is sent through the network to MasterCard who collects the data via MasterCard SmartLink. MasterCard SmartLink processes the information and reconciles the transaction information. American Express launched a similar initiative with Oracle earlier in 2001 that is intended to help p-card users streamline their electronic procurement process. In addition, American Express offers AccountingLink which integrates p-card and other purchasing information into a company’s ERP systems. Card providers are not the only ones showing initiative here. Financial institutions like GE Capital and Bank of Montreal are also stepping up to bat. In September 2001, GE Capital released a

Purchasing Cards in the US AUGUST 2003
© 2003, Celent Communications. Reproduction prohibited. www.celent.com
31
system called ePcard XML that bridges the gap between a customer’s e-procurement system and GE Capital’s card processor, Total Systems. The system also enhances the authorization and general ledger matching process. Recently, Bank of Montreal is offering the market a solution called BMO FlexPort that will accept any file transmitted by a supplier and convert it to the format specified by the buyer. The ability of these initiatives to facilitate data capture will undoubtedly drive p-card adoption rates.
In 2003, MasterCard made a significant leap in p-card utility with the launch of MasterCard e-P3, which couples the p-card infrastructure with existing purchasing order/invoicing systems and processes. Consequently, MasterCard e-P3 opens the door to the use of p-cards in purchase order transactions. A key functionality of MasterCard e-P3 is the ability to extract a purchase order from a buyer’s ERP system to transmit it to the seller (both buyer and seller must be enrolled). MasterCard initially teamed with Xign Payment Services Network to develop MasterCard e-P3. It is, however, seeking additional partners and recently announced a deal with Velosant, First Data Corporation’s EIPP (electronic invoice presentment and payment) business unit, and with Burns eCommerce, a UK-based EIPP business.
O N E - C A R D P R O G R A M S
Today’s corporations, and their employees, strive for simplicity. Over the past couple of years, credit card companies have begun to offer one-card programs to address this demand. These programs combine all three types of commercial cards (fleet, p-cards, and T&E) into one card. Issuers simply activate which type of purchasing is allowed with each.
Although the one-card option increases convenience for employees and reduces costs by eliminating the redundancy of software and systems to run card-based programs, the initiative lacks the support of users. Typically, corporate politics are behind this lack of enthusiasm. Departments are unwilling to accept the liability for additional expenditures and many worry that the benefits of a one-card program will muddy those offered by p-cards. In addition, as page 6 shows, there is rarely an overlap of card use. These issues and concerns are especially prevalent with larger corporations. Today, less than five percent of Fortune 500 companies use one-card programs. However, they are gaining popularity among smaller companies.

Purchasing Cards in the US AUGUST 2003
© 2003, Celent Communications. Reproduction prohibited. www.celent.com
32
F U T U R E T R E N D S
Given the initiatives mentioned above, we expect to see continued growth in the p-card industry. By 2005, we expect that the charge volume generated by p-cards will reach US$164.7 billion from US$65.9 billion in 2001, representing an annual growth rate of 26 percent.
In part, this increased volume is due to issuance of more p-cards and an increase in the average spend amount. We expect companies to offer more employees p-cards and to promote their use in order to take advantage of cost savings.
Figure 17: Growth of US Purchasing Cards with Respect to Transaction Volume
Source: Celent Communications
Figure 18: Growth in the Number of P-Cards Issued in the US
Source: Celent Communications
164.7
130.7103.7
82.3
47.0
65.9
0
40
80
120
160
200
2000 2001 2002 2003 2004 2005
(in U
S$ b
illio
ns)
4.0
11.5
5.0
8.26.3
0
3
6
9
12
15
2001 2002 2003 2004 2005
(in m
illion
s)

Purchasing Cards in the US AUGUST 2003
© 2003, Celent Communications. Reproduction prohibited. www.celent.com
33
In addition, we expect to see significant growth on account of merchant adoption. First, merchants will continue to be enticed by lower discount rates. Second, the partnership between MasterCard and Velosant will pull in merchants by leveraging First Data Merchant Services. Buyers will encourage them to become capable of capturing and transmitting Level-III data. We expect advances in data transmission to coincide with this trend. Merchants will be offered more convenient and efficient methods of coupling Level III (and Level II) data with transactions, and more banks and third-party providers will facilitate the integration of Level III data transmission with accounting programs.
Over the next few years, we will see an increase in electronic payments. Certainly p-cards will be one of the most convenient methods of payment for e-procurement given their wide acceptance and limited paperwork. Increased spending limits will make it possible to pay for more items, which will in turn make p-cards more convenient.

Glo
ssary

GLOSSARY
Business-to-Business Payment Systems: an Overview AUGUST 2003
© 2003, Celent Communications. Reproductions prohibited. www.celent.com
ACH - Automated clearing houseAn electronic payment system originally designed for recurring payments such as salary (akadirect deposit) and utility bills (aka direct debit).
CHIPS - The Clearing House Inter-Bank Payment SystemA bank-owned (the New York Clearing House), privately operated, real-time net paymentsystem for B2B transactions; an alternative to the FedWire (both are wire transfer systems).
EDI - Electronic data interchangeThe communication of trade-related information among business partners in a structured,standardized, machine-readable electronic form.
EPN - Electronic Payments NetworkThe largest private ACH operator (owned by the New York Clearing House).
ERP - Enterprise resource planningA system that integrates a company’s systems with the ultimate goal being to streamline the flow of information across the entire organization; by linking disparate systems and processes within a company, an ERP system improves the exchange of information betweendivisions and reduces cycle time.
FEDI - Financial electronic data interchangeA vehicle for settling invoices by initiating payments, processing remittance data, andautomating reconciliation, via the exchange of electronic messages.
FedwireA real-time gross payment system for large value B2B transactions run by the FederalReserve; an alternative to CHIPS.
InvoiceAn itemized list of goods shipped, including price and terms of sale, sent by the seller to thebuyer; a standard business document used to request payment.
Purchase orderAn itemized list of goods sent by the buyer to the seller; a standard business document that isused to initiate a purchase.
Purchasing cardA purchasing card is a reengineering tool designed to simplify the traditional purchase order
34

GLOSSARY
Business-to-Business Payment Systems: an Overview AUGUST 2003
© 2003, Celent Communications. Reproductions prohibited. www.celent.com
and payment process for low value transactions. A purchasing card program allows an organization to streamline purchasing, reduce or eliminate paperwork, and control spendingthrough the card program’s authorization process.
Remittance informationItemized, detailed information that accompanies a payment and explains what the payment isfor and what changes have been, if any, that cause the remittance to differ from the invoice.
Remote Payment and Presentment Services (RPPS)MasterCard RPPS delivers the industry’s most comprehensive collection of EBPP services,providing one-stop access to round-trip bill payment and presentment for approximately 95 percent of industry service providers. Supporting an open-standards environment, RPPS offers typically 24-hour electronic routing, posting, and settlement to effectively displace paper.
35

Celent Communications is a research and advisory firm dedicated to helping financialinstitutions formulate comprehensive business and technology strategies. Celent publishesreports identifying trends and best practices in financial services technology, and conductsconsulting engagements for financial institutions looking to use technology to enhanceexisting business processes or launch new business strategies. With a team of internationallyexperienced analysts, Celent is uniquely positioned to offer strategic advice and marketinsights on a global basis.
Celent’s research services cover the following eight sectors of financial services: RetailBanking, Wholesale Banking, Retail Securities and Investments, Institutional Securities andInvestments, Life/Health Insurance, Property & Casualty Insurance, Mobile FinancialServices, and European Financial Services. For inquiries, visit www.celent.com; [email protected]; or contact:
Headquarters:183 State Street, Fifth Floor 489 Fifth Avenue, 12th FloorBoston, MA 02109 New York, NY 10017USA USATel.: +1.617.573.9450 Tel.: +1.212.490.2220Fax: +1.617.573.9455 Fax: +1.212.490.2225
50 California Street, Suite 1500 16, Place VendômeSan Francisco, CA 94111 75001 ParisUSA FranceTel: +1.415.439.5291 Tel.: +33.1.53.45.28.58Fax: +1.415.439.5299 Fax: +33.1.53.45.28.29
2-2-1 Toranomon, 15th FloorMinato-ku, Tokyo 105-0001JapanTel.: +81.3.5114.8267Fax: +81.3.5114.8282
About Celent
Purchasing Cards in the US AUGUST 2003
© 2003, Celent Communications. Reproductions prohibited. www.celent.com
36

MasterCard International has a comprehensive portfolio of well-known, widely acceptedpayments brands including MasterCard, Cirrus and Maestro. More than 1.7 billionMasterCard, Cirrus and Maestro logos are present on credit, charge and debit cards in circulation today. An association comprised of more than 15,000 member financial institutions, MasterCard serves consumers and businesses, both large and small, in over 210 countries and territories. MasterCard is a leader in quality and innovation, offering a wide range of payment solutions in the virtual and traditional worlds. MasterCard’s award-winning Priceless advertising campaign is now seen in 81 countries and in 41 languages, giving the MasterCard brand a truly global reach and scope. With more than 24 million acceptance locations, no card is accepted in more places and by more merchantsthan the MasterCard Card. MasterCard can be reached through its World Wide Web site athttp://www.mastercard.com.
About MasterCard International
Purchasing Cards in the US AUGUST 2003
© 2003, Celent Communications. Reproductions prohibited. www.celent.com
37

MasterCard Internationale-Commerce and e-B2B Center of Excellence2000 Purchase StreetPurchase, NY 10577USA
Philip PhilliouVice President, e-Business and Emerging Technologies (eB2B)Tel.: +1.914.249.6841Email: [email protected]
Shari KrikorianVice President, e-Business andEmerging Technologies (eB2B)Tel.: +1.914.249.5871Email: [email protected]
www.mastercardbusiness.com
Celent Communications183 State StreetFifth FloorBoston, MA 02109USA
Tel.: +1.617.573.9450Fax: +1.617.573.9455Email: [email protected]
www.celent.com
Alenka [email protected]
Ariana-Michele [email protected]
Contact us:

3-10083 09/03