The Fertilizer Market at the Global Level - ifa.ie · The Fertilizer Market at the ... The prices...
23
The Fertilizer Market at the Global Level Maximo Torero [email protected] IFA International Fertilizer Conference 2015 Restoring Competition to the EU Fertilizer Market April 30 th , The Heritage, Killenard
-
Upload
duongnguyet -
Category
Documents
-
view
213 -
download
0
Transcript of The Fertilizer Market at the Global Level - ifa.ie · The Fertilizer Market at the ... The prices...
The Fertilizer Market at the Global LevelMaximo Torero
IFA International Fertilizer Conference 2015Restoring Competition to the EU Fertilizer Market
April 30th, The Heritage, Killenard
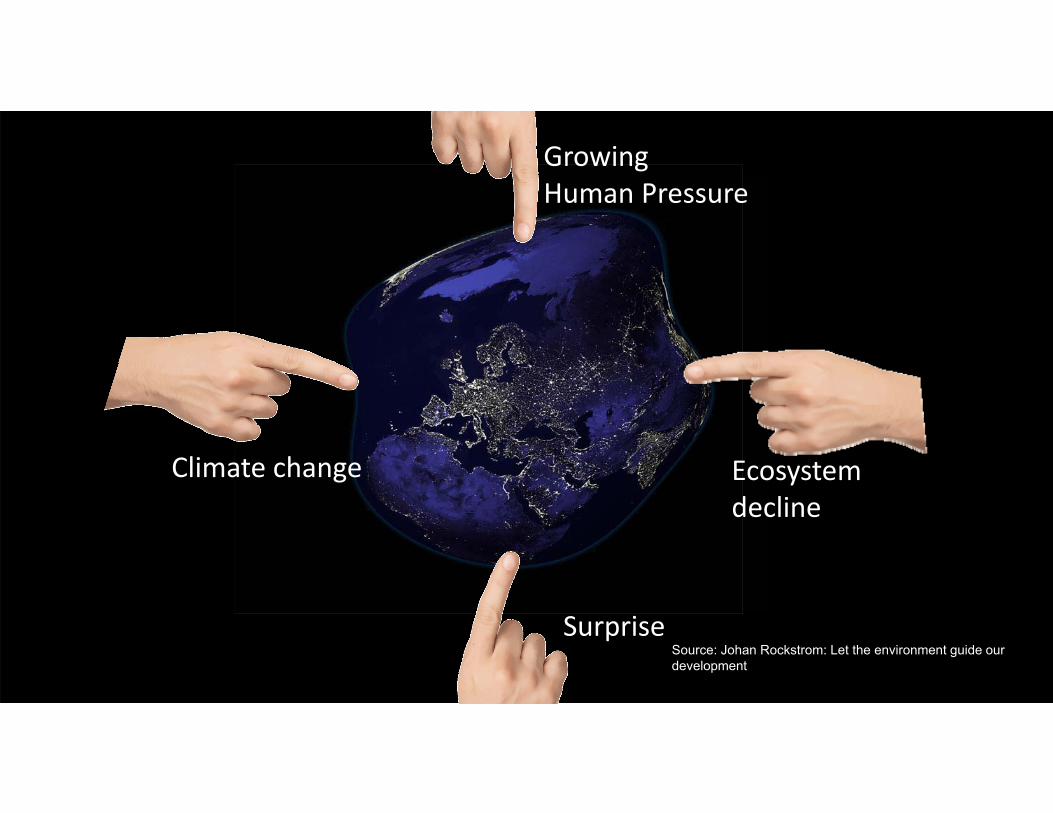
Growing Human Pressure
Climate change
Surprise
Ecosystem decline
Source: Johan Rockstrom: Let the environment guide our development
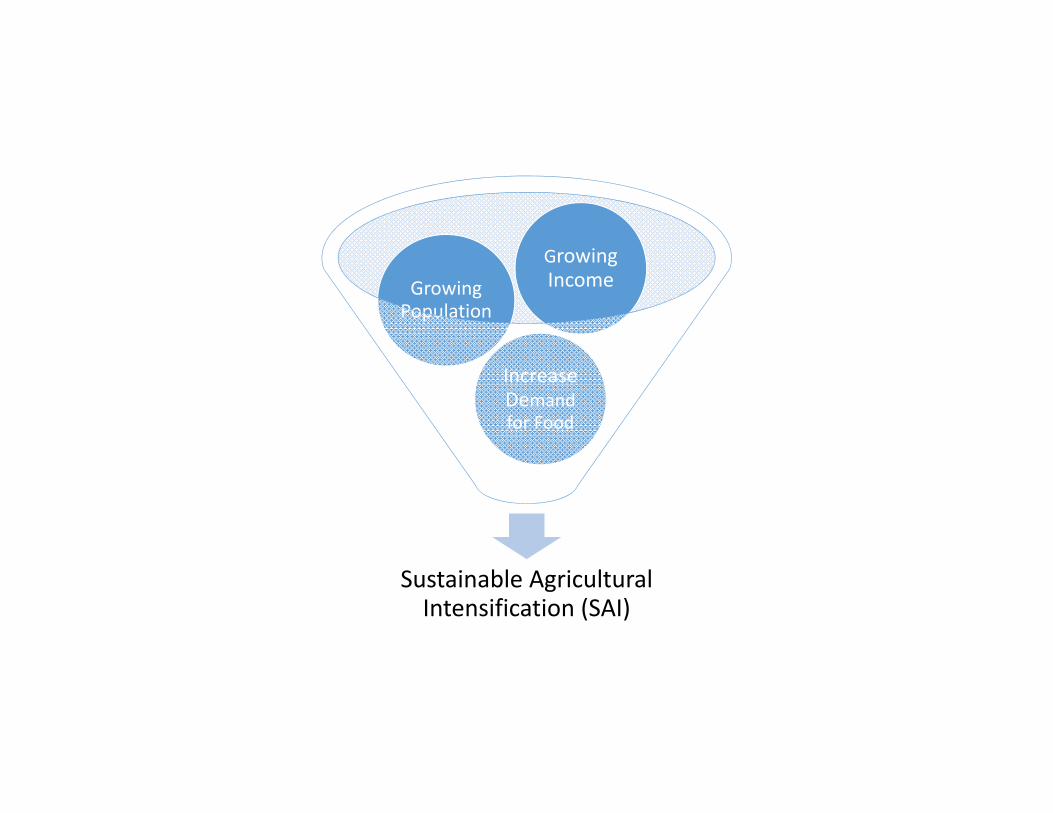
Sustainable Agricultural Intensification (SAI)
Increase Demand for Food
Growing Population
Growing Income
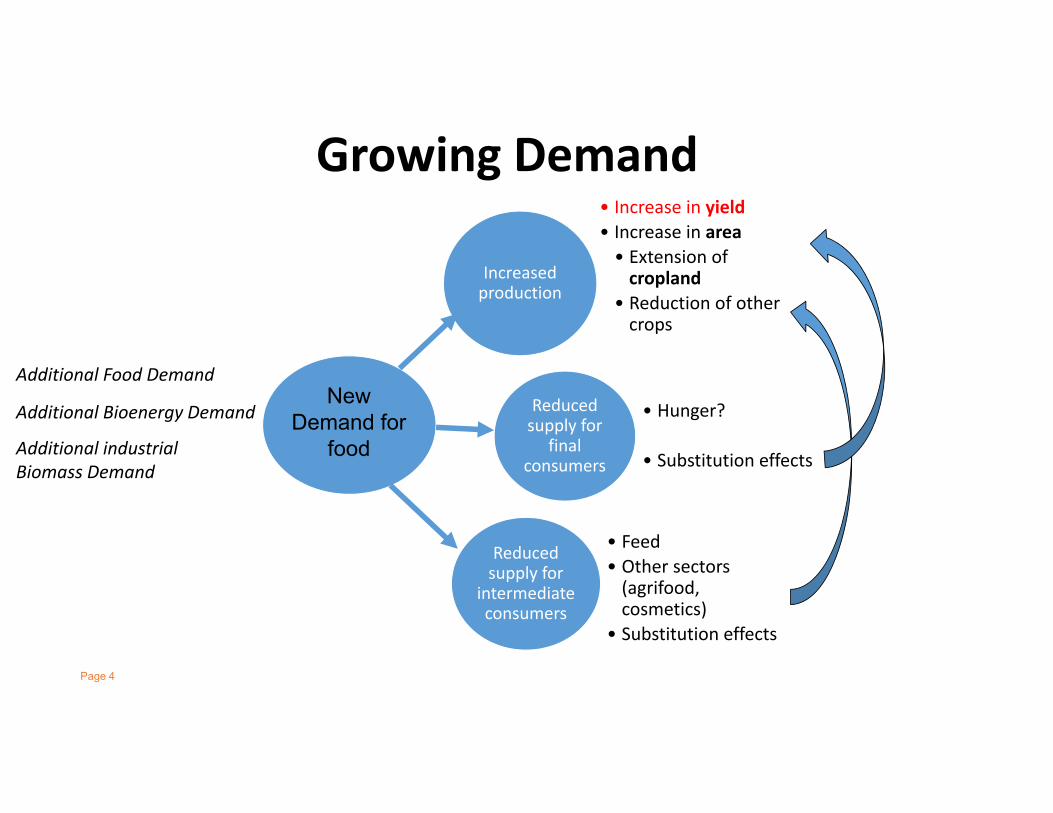
Growing Demand
Page 4
Increased production
• Increase in yield• Increase in area• Extension of cropland
• Reduction of other crops
Reduced supply for
final consumers
• Hunger?
• Substitution effects
Reduced supply for
intermediate consumers
• Feed• Other sectors (agrifood, cosmetics)
• Substitution effects
New Demand for
food
Additional Food Demand
Additional Bioenergy Demand
Additional industrial Biomass Demand
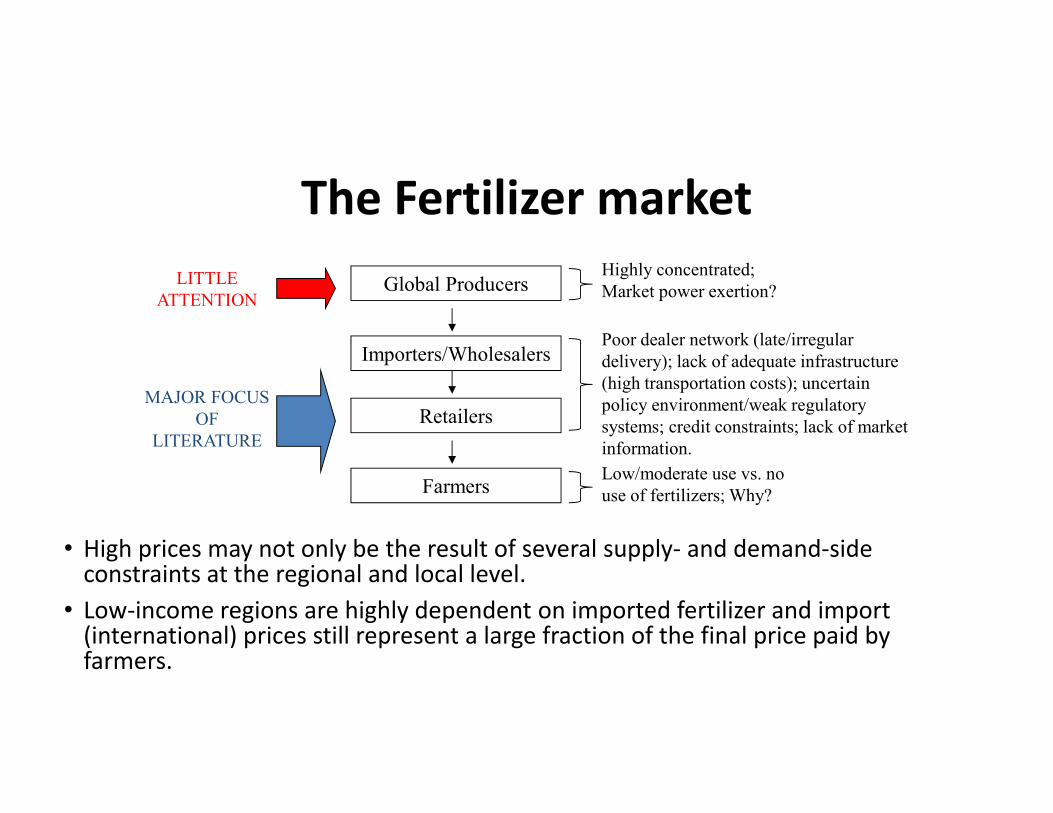
• High prices may not only be the result of several supply‐ and demand‐side constraints at the regional and local level.
• Low‐income regions are highly dependent on imported fertilizer and import (international) prices still represent a large fraction of the final price paid by farmers.
Global Producers
Importers/Wholesalers
Retailers
Farmers
Highly concentrated; Market power exertion?
Poor dealer network (late/irregular delivery); lack of adequate infrastructure (high transportation costs); uncertain policy environment/weak regulatory systems; credit constraints; lack of market information.Low/moderate use vs. no use of fertilizers; Why?
LITTLE ATTENTION
MAJOR FOCUS OF
LITERATURE
The Fertilizer market
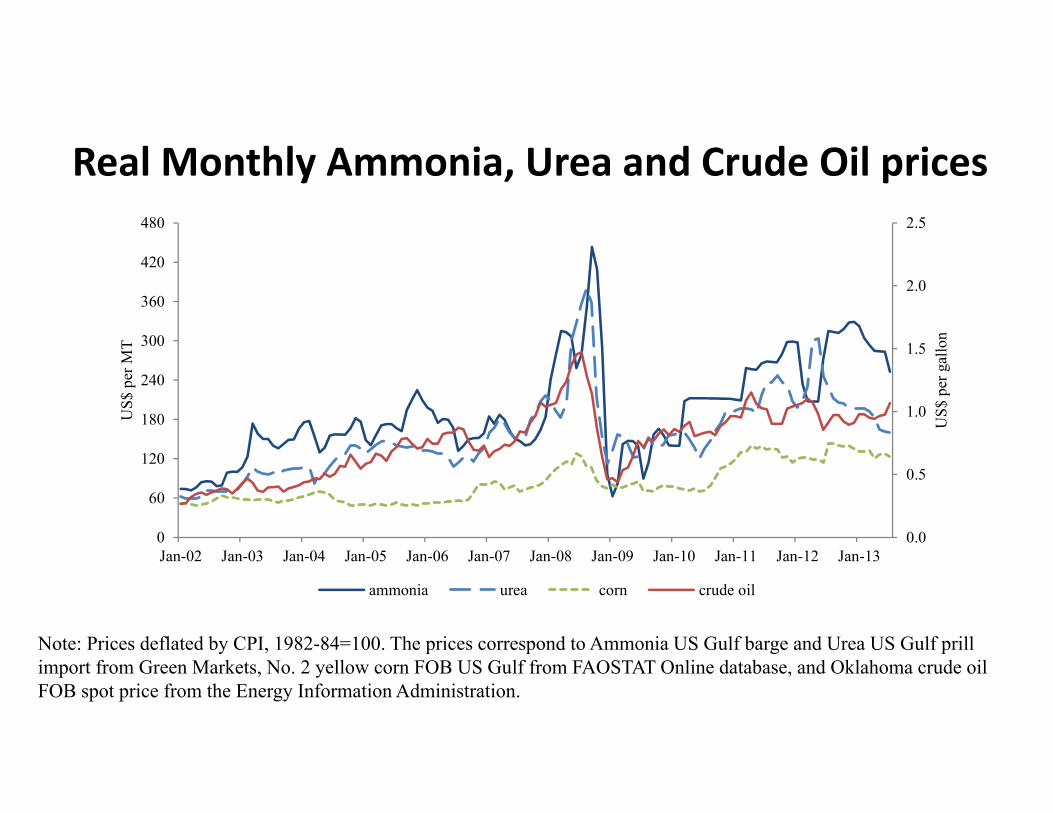
Real Monthly Ammonia, Urea and Crude Oil prices
Note: Prices deflated by CPI, 1982-84=100. The prices correspond to Ammonia US Gulf barge and Urea US Gulf prillimport from Green Markets, No. 2 yellow corn FOB US Gulf from FAOSTAT Online database, and Oklahoma crude oil FOB spot price from the Energy Information Administration.
0.0
0.5
1.0
1.5
2.0
2.5
0
60
120
180
240
300
360
420
480
Jan-02 Jan-03 Jan-04 Jan-05 Jan-06 Jan-07 Jan-08 Jan-09 Jan-10 Jan-11 Jan-12 Jan-13
US$
per
gal
lon
US$
per
MT
ammonia urea corn crude oil
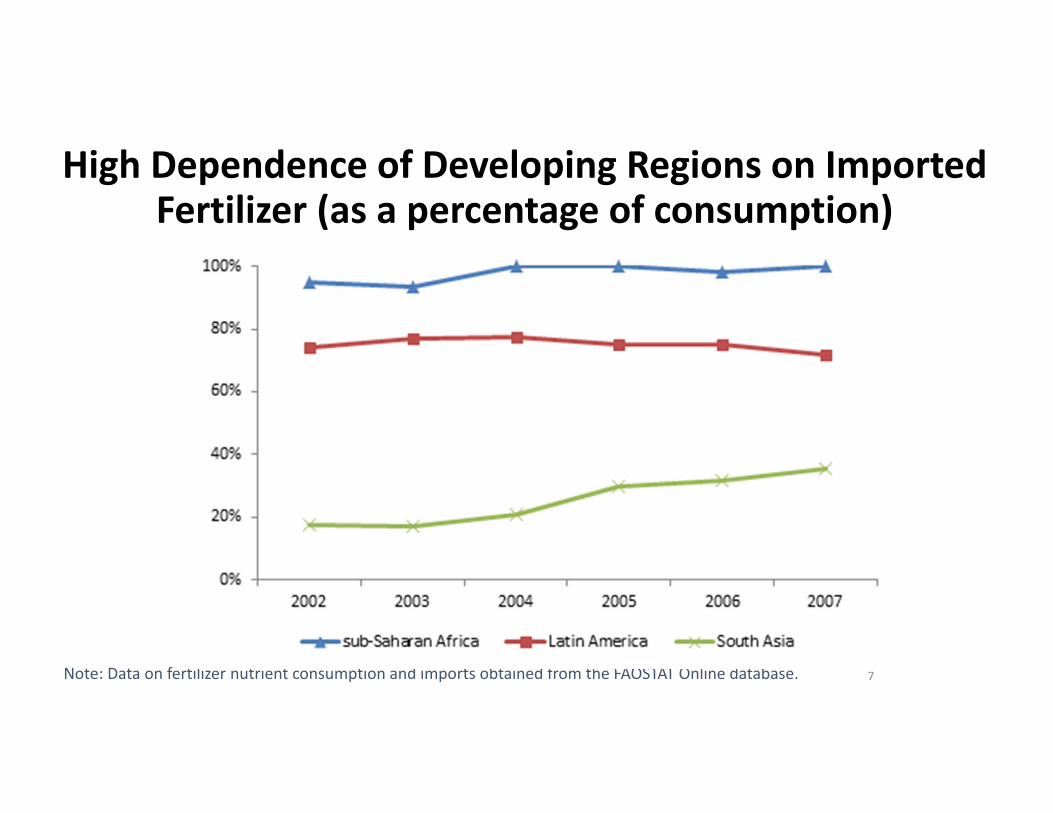
Note: Data on fertilizer nutrient consumption and imports obtained from the FAOSTAT Online database. 7
High Dependence of Developing Regions on Imported Fertilizer (as a percentage of consumption)
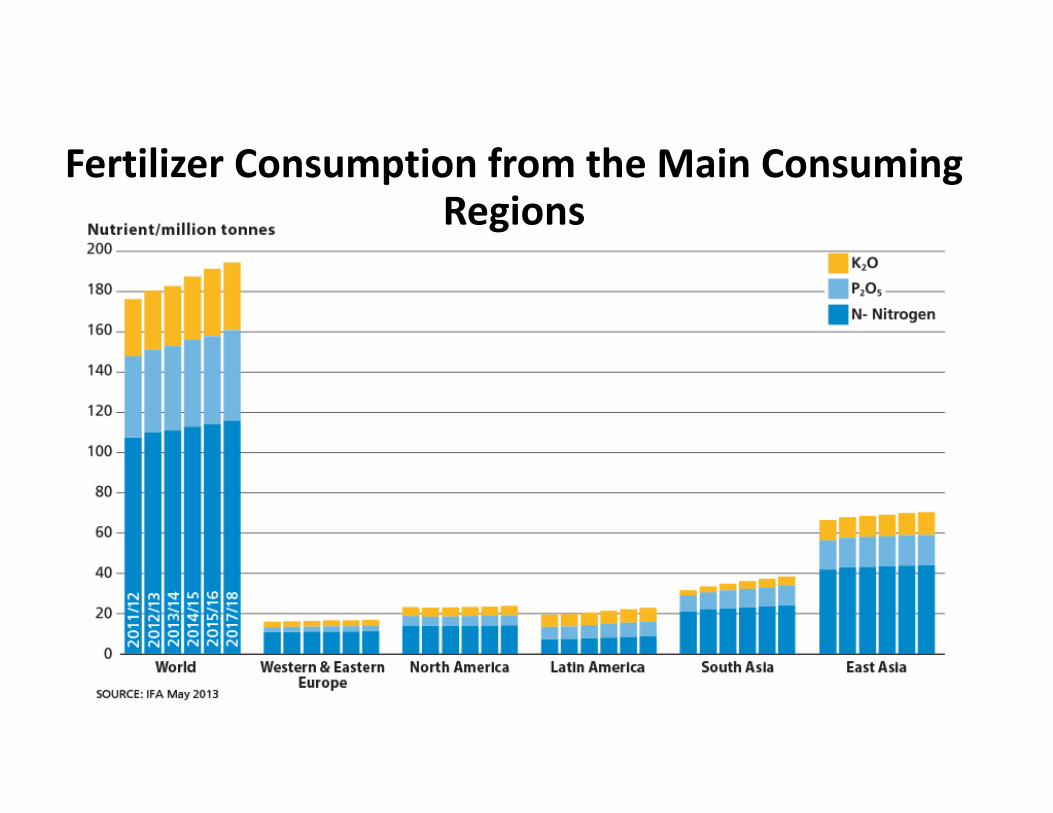
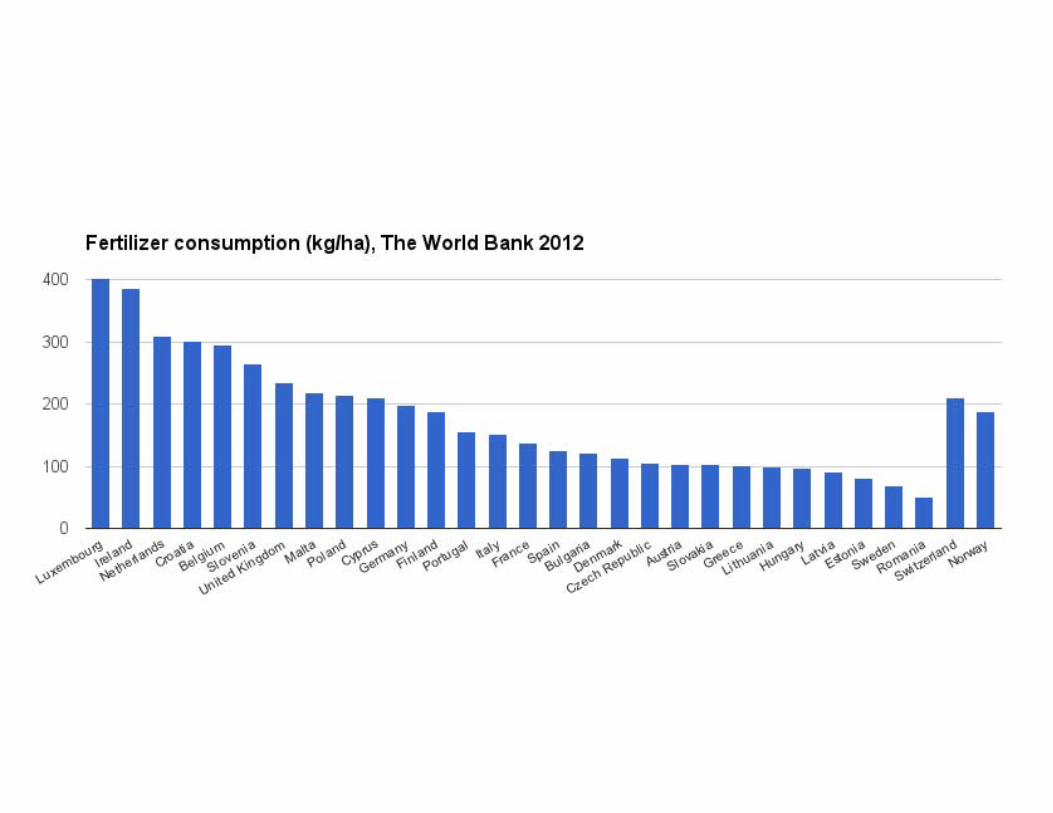
Fertilizer Consumption from the Main Consuming Regions
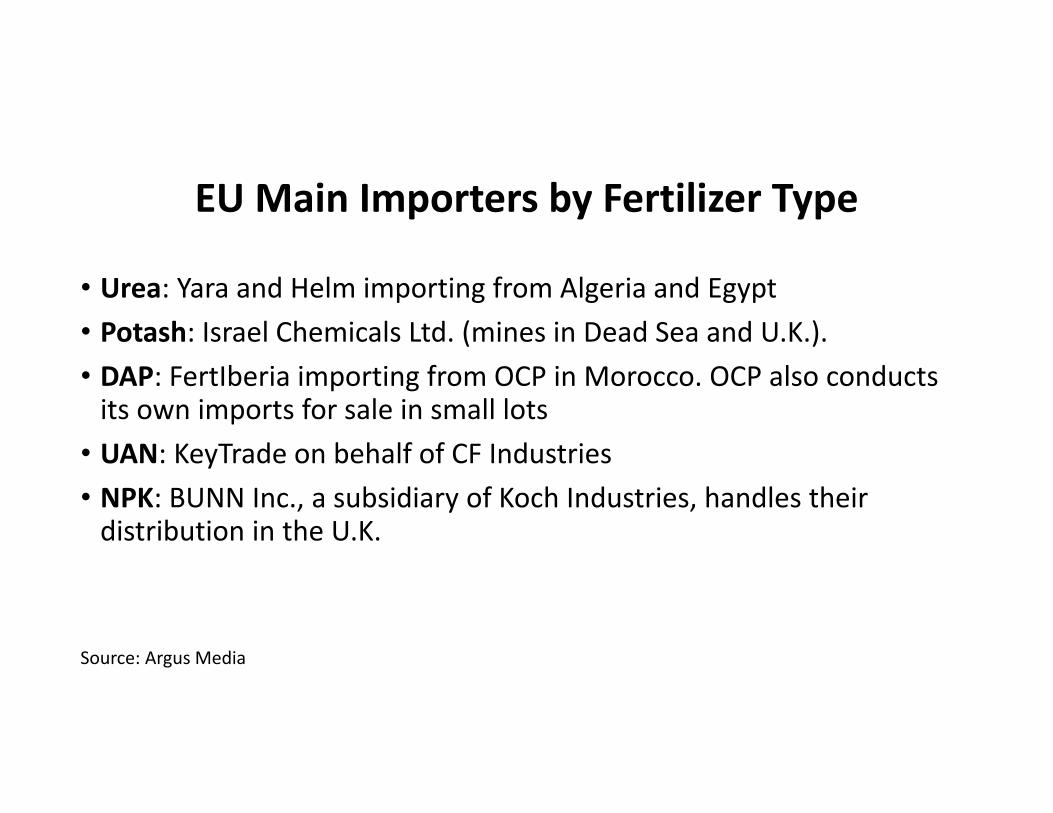
EU Main Importers by Fertilizer Type
• Urea: Yara and Helm importing from Algeria and Egypt• Potash: Israel Chemicals Ltd. (mines in Dead Sea and U.K.). • DAP: FertIberia importing from OCP in Morocco. OCP also conducts its own imports for sale in small lots
• UAN: KeyTrade on behalf of CF Industries• NPK: BUNN Inc., a subsidiary of Koch Industries, handles their distribution in the U.K.
Source: Argus Media
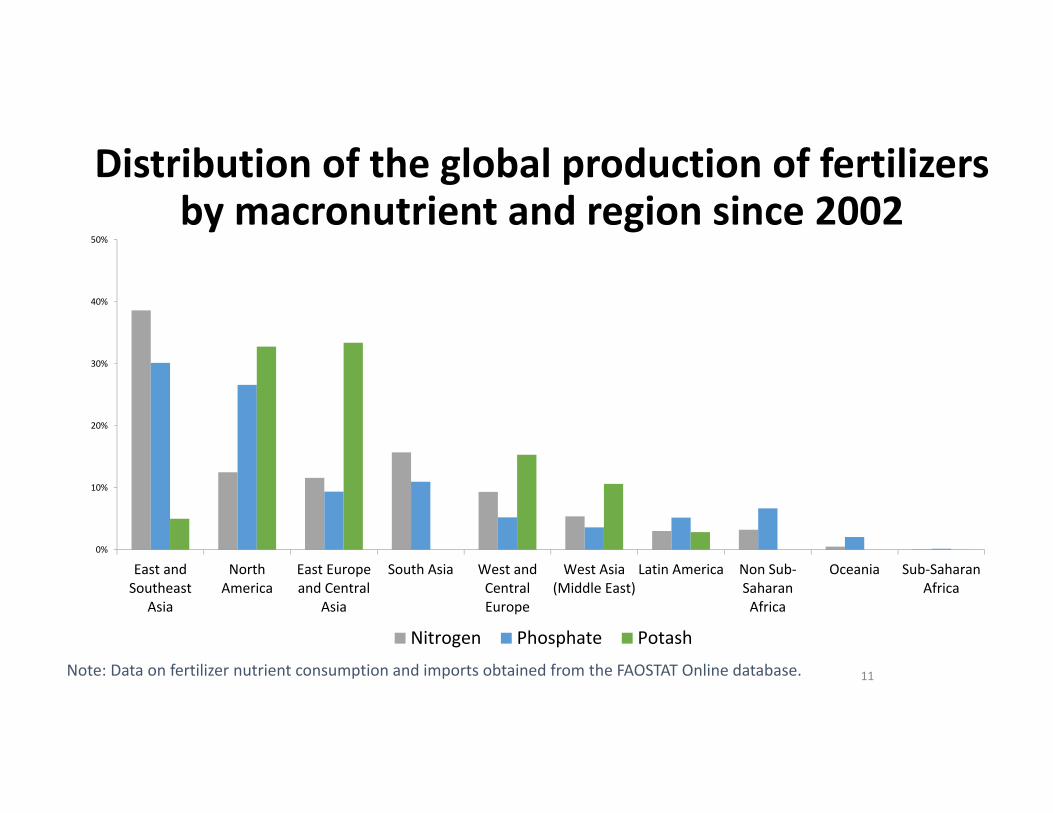
Note: Data on fertilizer nutrient consumption and imports obtained from the FAOSTAT Online database. 11
Distribution of the global production of fertilizers by macronutrient and region since 2002
0%
10%
20%
30%
40%
50%
East andSoutheast
Asia
NorthAmerica
East Europeand Central
Asia
South Asia West andCentralEurope
West Asia(Middle East)
Latin America Non Sub‐SaharanAfrica
Oceania Sub‐SaharanAfrica
Nitrogen Phosphate Potash
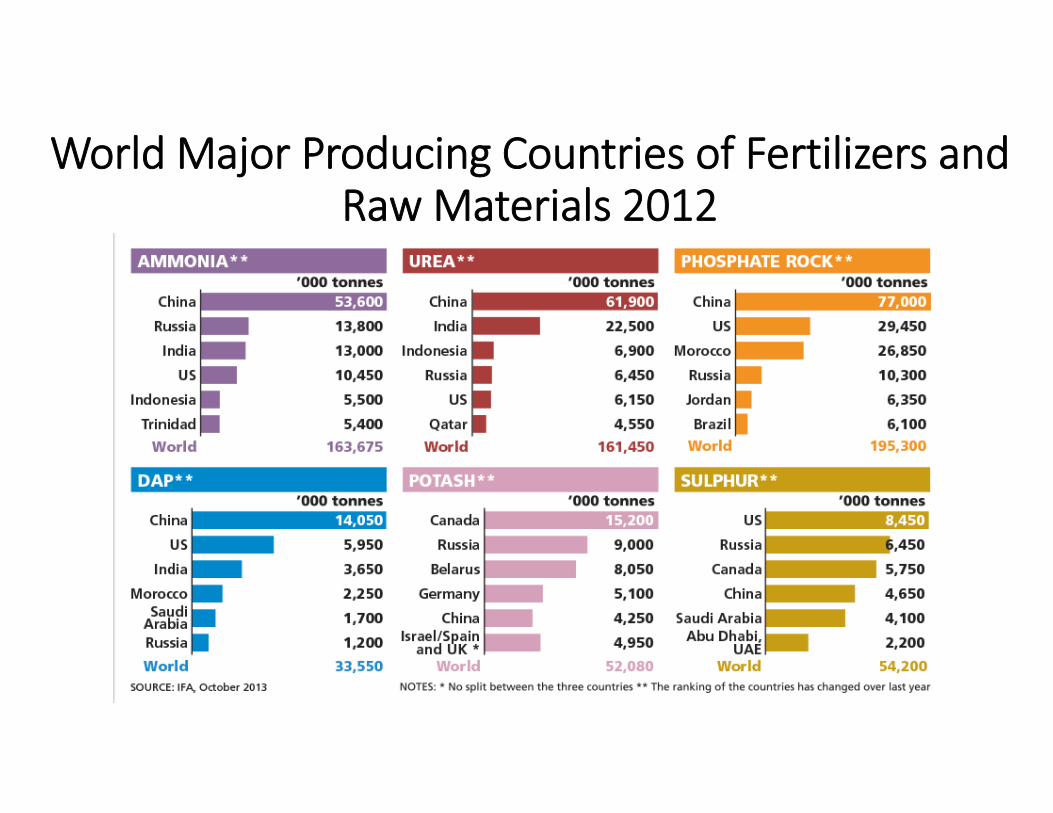
World Major Producing Countries of Fertilizers and Raw Materials 2012
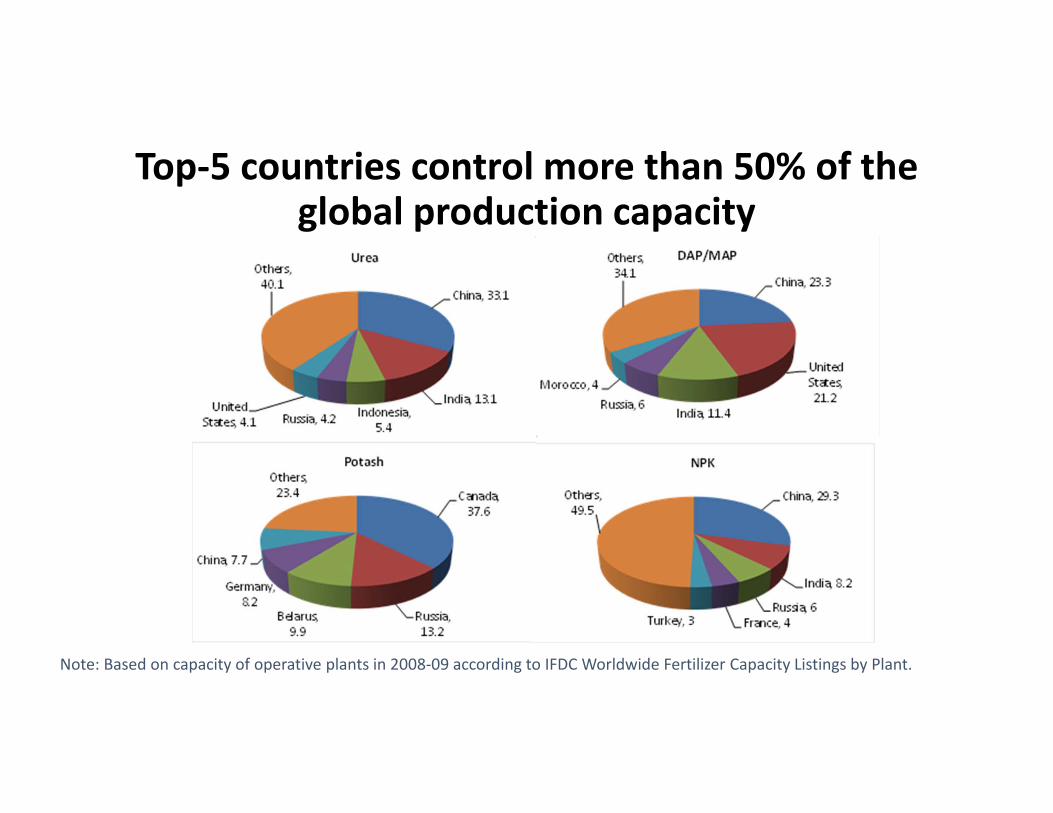
Top‐5 countries control more than 50% of the global production capacity
Note: Based on capacity of operative plants in 2008‐09 according to IFDC Worldwide Fertilizer Capacity Listings by Plant.
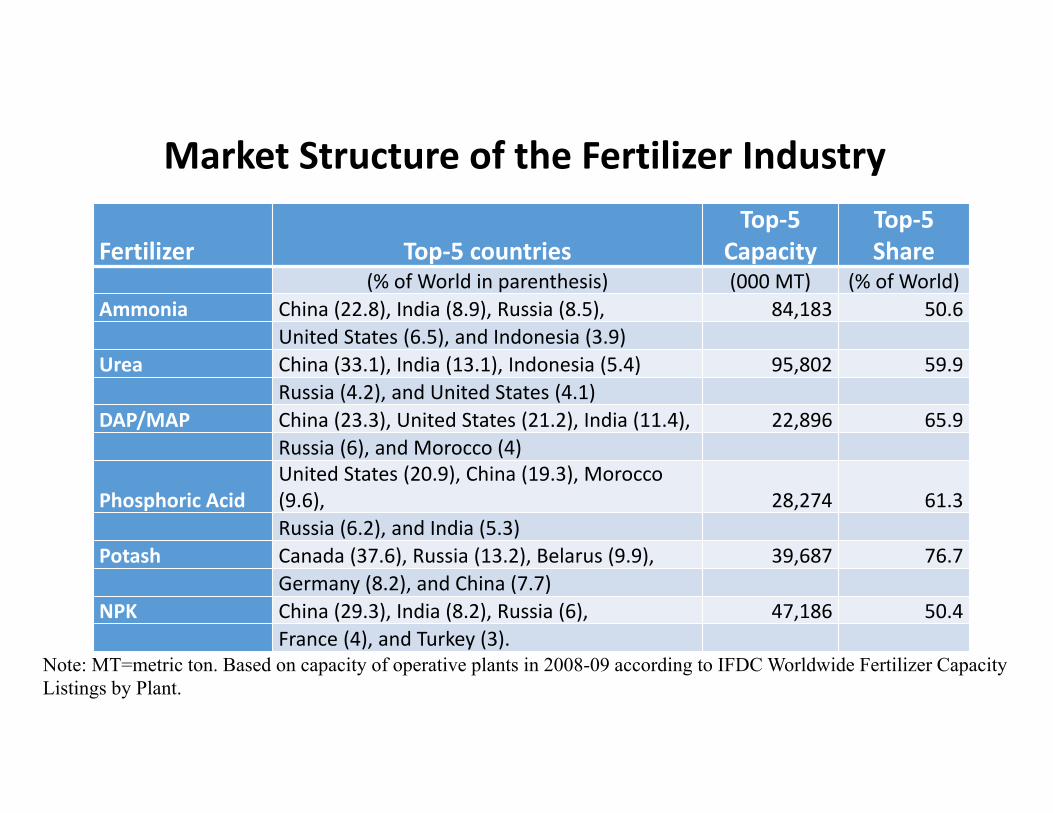
Market Structure of the Fertilizer Industry
Note: MT=metric ton. Based on capacity of operative plants in 2008-09 according to IFDC Worldwide Fertilizer Capacity Listings by Plant.
Fertilizer Top‐5 countriesTop‐5
CapacityTop‐5 Share
(% of World in parenthesis) (000 MT) (% of World)Ammonia China (22.8), India (8.9), Russia (8.5), 84,183 50.6
United States (6.5), and Indonesia (3.9)Urea China (33.1), India (13.1), Indonesia (5.4) 95,802 59.9
Russia (4.2), and United States (4.1)DAP/MAP China (23.3), United States (21.2), India (11.4), 22,896 65.9
Russia (6), and Morocco (4)
Phosphoric AcidUnited States (20.9), China (19.3), Morocco (9.6), 28,274 61.3Russia (6.2), and India (5.3)
Potash Canada (37.6), Russia (13.2), Belarus (9.9), 39,687 76.7Germany (8.2), and China (7.7)
NPK China (29.3), India (8.2), Russia (6), 47,186 50.4France (4), and Turkey (3).
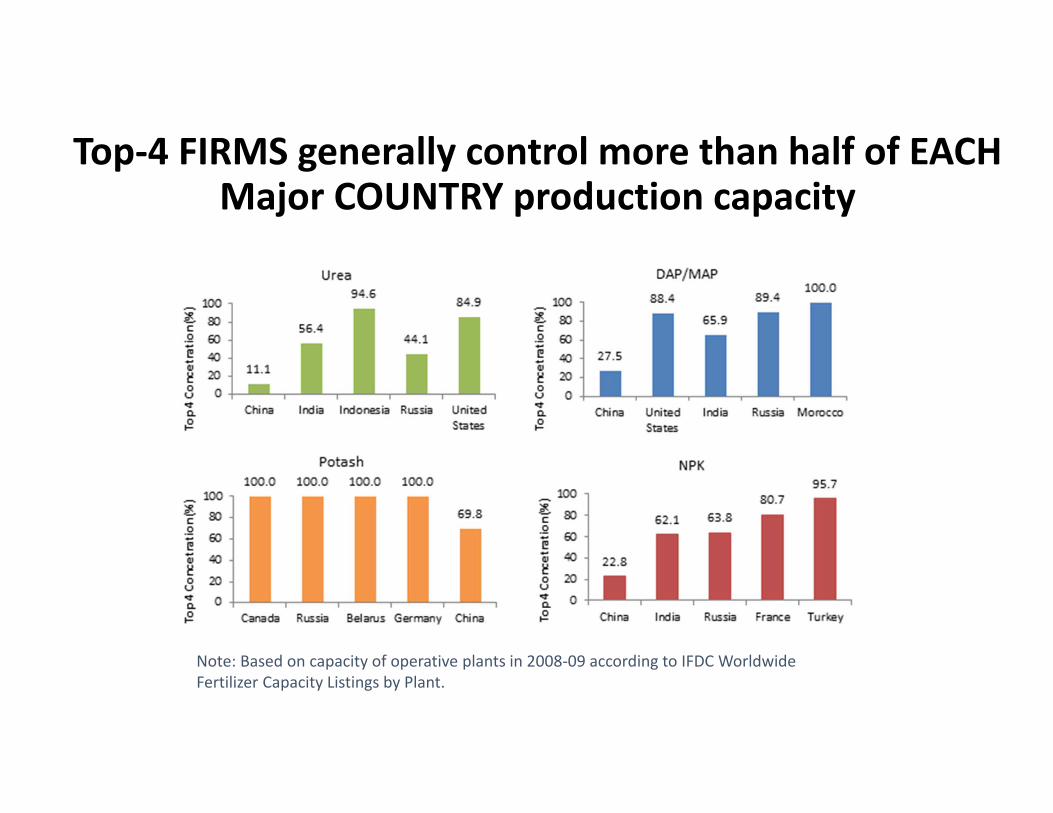
Top‐4 FIRMS generally control more than half of EACH Major COUNTRY production capacity
Note: Based on capacity of operative plants in 2008‐09 according to IFDC Worldwide Fertilizer Capacity Listings by Plant.
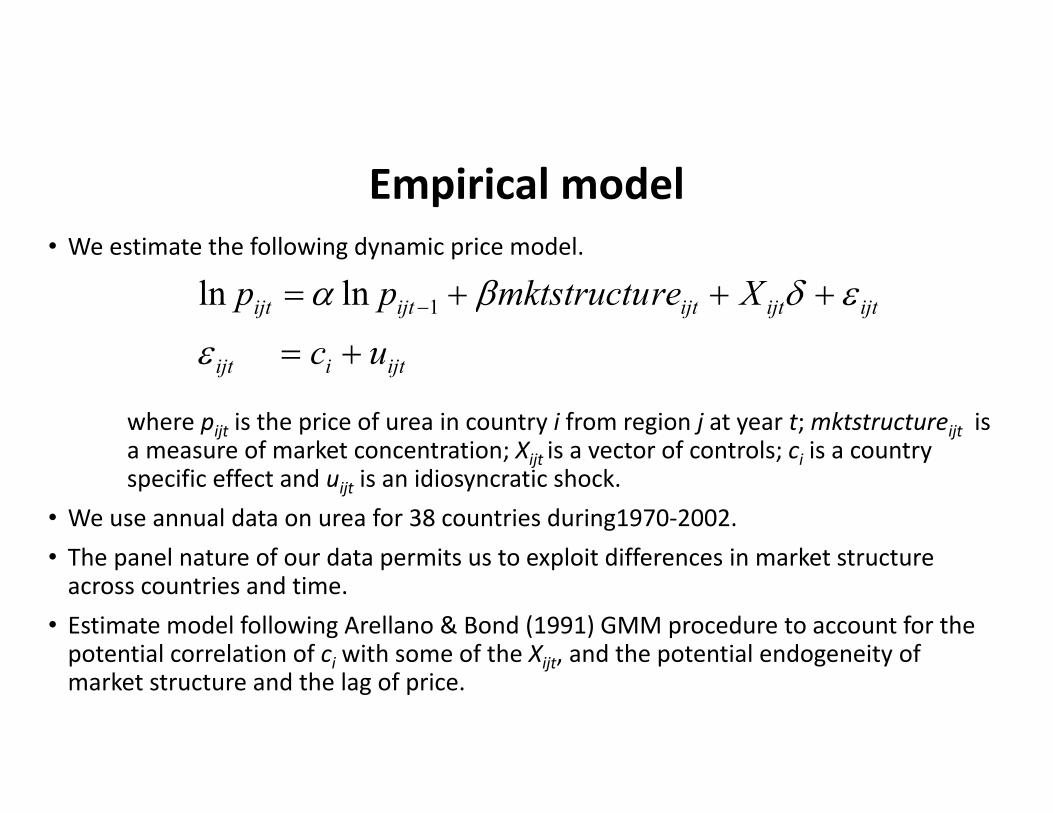
Empirical model• We estimate the following dynamic price model.
where pijt is the price of urea in country i from region j at year t; mktstructureijt is a measure of market concentration; Xijt is a vector of controls; ci is a countryspecific effect and uijt is an idiosyncratic shock.
• We use annual data on urea for 38 countries during1970‐2002.• The panel nature of our data permits us to exploit differences in market structure across countries and time.
• Estimate model following Arellano & Bond (1991) GMM procedure to account for the potential correlation of ci with some of the Xijt, and the potential endogeneity of market structure and the lag of price.
ijtiijt
ijtijtijtijtijt
uc
Xremktstructupp
lnln 1
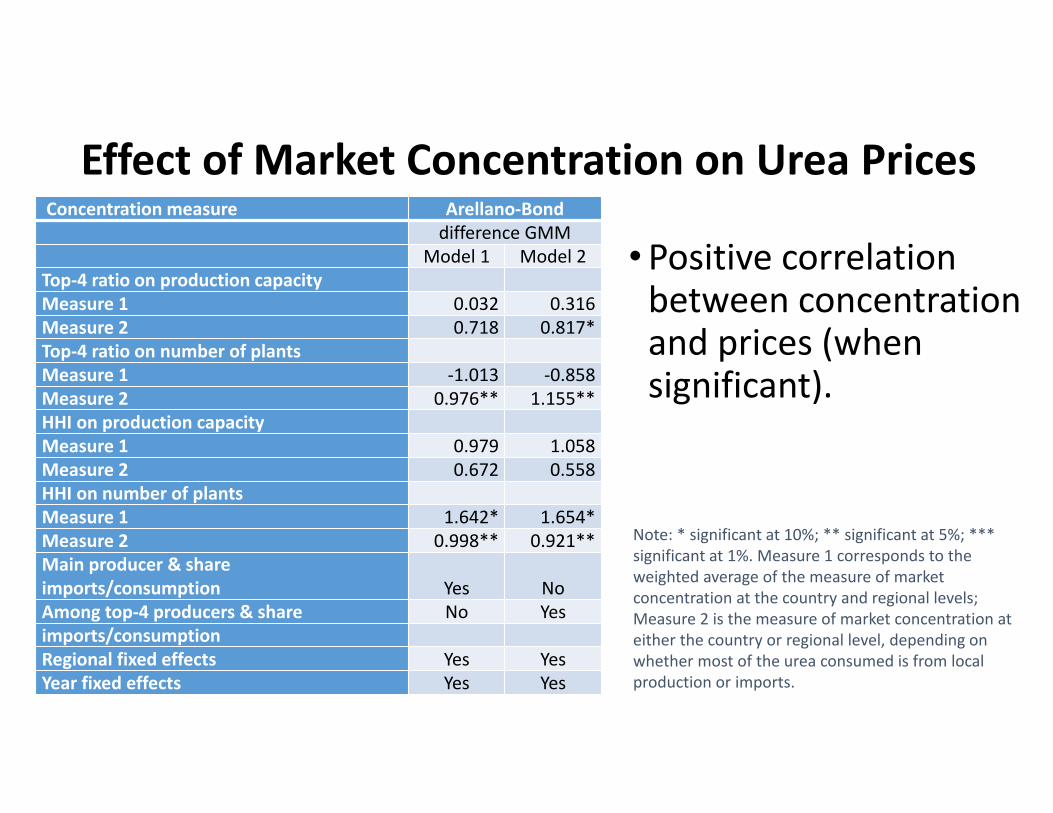
•Positive correlation between concentration and prices (when significant).
Note: * significant at 10%; ** significant at 5%; *** significant at 1%. Measure 1 corresponds to the weighted average of the measure of market concentration at the country and regional levels; Measure 2 is the measure of market concentration at either the country or regional level, depending on whether most of the urea consumed is from local production or imports.
Effect of Market Concentration on Urea PricesConcentration measure Arellano‐Bond
difference GMMModel 1 Model 2
Top‐4 ratio on production capacityMeasure 1 0.032 0.316Measure 2 0.718 0.817*Top‐4 ratio on number of plantsMeasure 1 ‐1.013 ‐0.858Measure 2 0.976** 1.155**HHI on production capacityMeasure 1 0.979 1.058Measure 2 0.672 0.558HHI on number of plantsMeasure 1 1.642* 1.654*Measure 2 0.998** 0.921**Main producer & share imports/consumption Yes NoAmong top‐4 producers & share No Yesimports/consumptionRegional fixed effects Yes YesYear fixed effects Yes Yes
• We conduct a basic simulation analysis.
‐ First simulate the general impact of increased competition on prices, fertilizer intake, crop production and rural income. (use elasticities derived above and from other related studies)
‐ Then perform a cost‐benefit analysis for selected countries.(Ghana, Kenya, Senegal and Tanzania in SSA; Bangladesh and India in SA)
• Based on the top‐4 concentration ratio results, a10% increase in competition leads to:
‐ Conservative scenario: 8.2% decrease in prices.‐ Optimistic scenario: 11.6% decrease in prices.
Simulating Effects of Increasing Competition
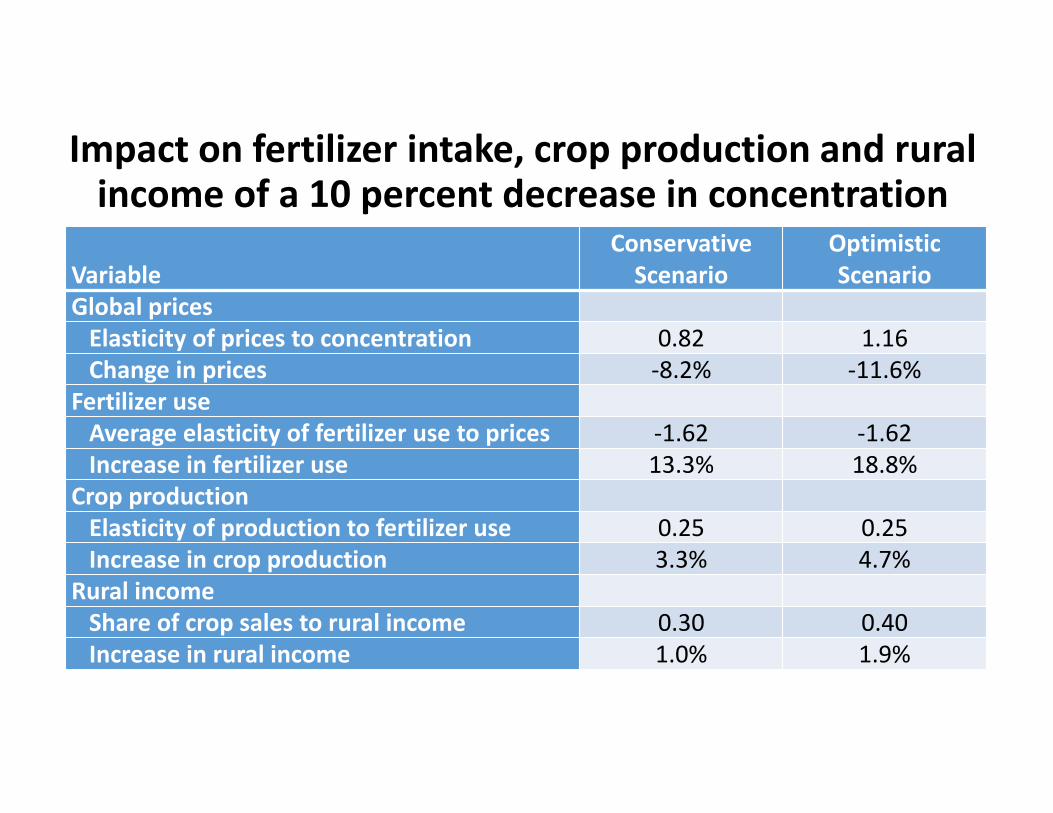
Impact on fertilizer intake, crop production and rural income of a 10 percent decrease in concentration
VariableConservative Scenario
Optimistic Scenario
Global pricesElasticity of prices to concentration 0.82 1.16Change in prices ‐8.2% ‐11.6%
Fertilizer useAverage elasticity of fertilizer use to prices ‐1.62 ‐1.62Increase in fertilizer use 13.3% 18.8%
Crop productionElasticity of production to fertilizer use 0.25 0.25Increase in crop production 3.3% 4.7%
Rural incomeShare of crop sales to rural income 0.30 0.40Increase in rural income 1.0% 1.9%
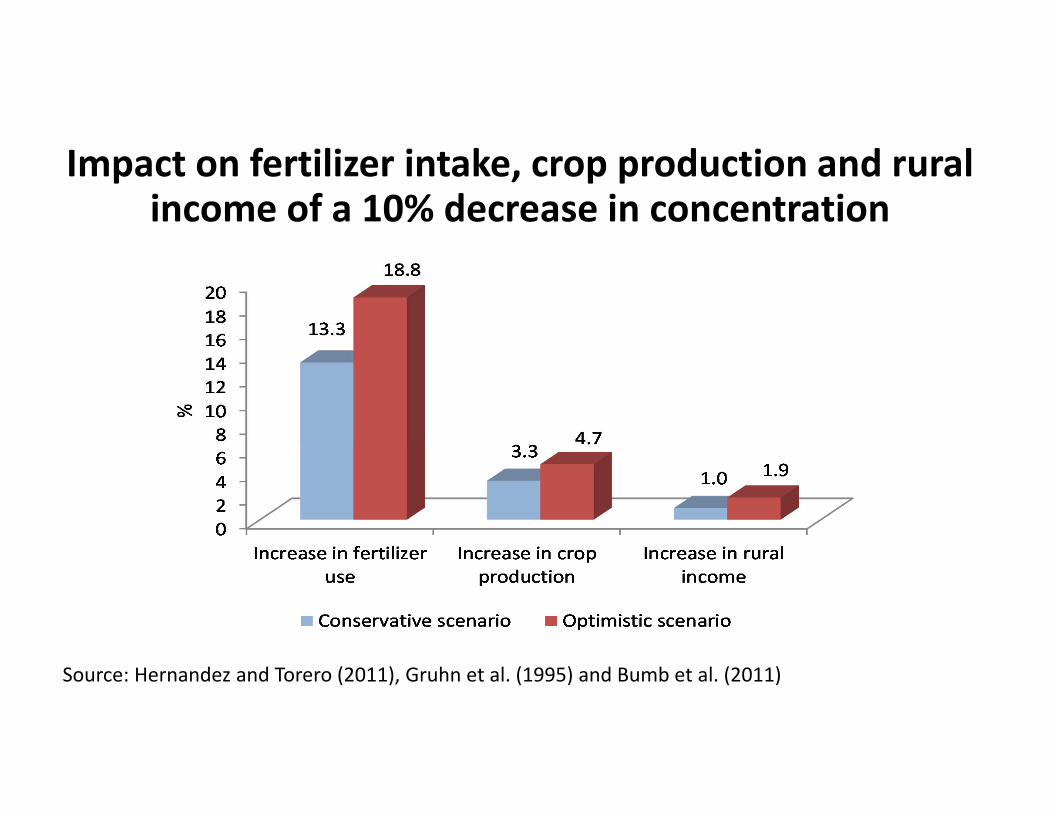
Impact on fertilizer intake, crop production and rural income of a 10% decrease in concentration
Source: Hernandez and Torero (2011), Gruhn et al. (1995) and Bumb et al. (2011)
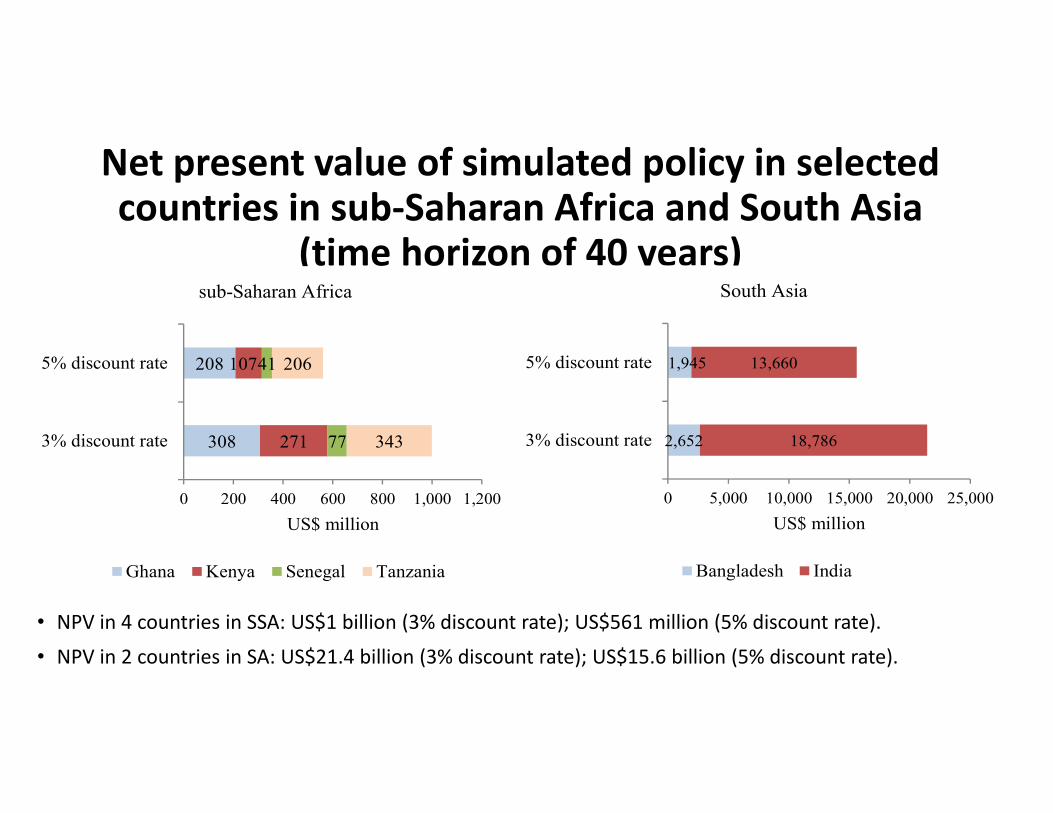
• NPV in 4 countries in SSA: US$1 billion (3% discount rate); US$561 million (5% discount rate).
• NPV in 2 countries in SA: US$21.4 billion (3% discount rate); US$15.6 billion (5% discount rate).
Net present value of simulated policy in selected countries in sub‐Saharan Africa and South Asia
(time horizon of 40 years)
2,652
1,945
18,786
13,660
0 5,000 10,000 15,000 20,000 25,000
3% discount rate
5% discount rate
US$ million
South Asia
Bangladesh India
308
208
271
107
77
41
343
206
0 200 400 600 800 1,000 1,200
3% discount rate
5% discount rate
US$ million
sub-Saharan Africa
Ghana Kenya Senegal Tanzania
020 40 60 80 100
0246810
0
1
2
3
4
5
6
yield(t/ha)
fertilization rate(kg[N]/ha)
irrigation rate(mm/ha/week)
Very Short Maturity Period Varieties
020 40 60 80 100
0246810
0
1
2
3
4
5
6
yield(t/ha)
fertilization rate(kg[N]/ha)
irrigation rate(mm/ha/week)
Short Maturity Period Varieties
020 40 60 80 100
0246810
0
1
2
3
4
5
6
yield(t/ha)
fertilization rate(kg[N]/ha)
irrigation rate(mm/ha/week)
Medium Maturity Period Varieties
020 40 60 80 100
0246810
0
1
2
3
4
5
6
yield(t/ha)
fertilization rate(kg[N]/ha)
irrigation rate(mm/ha/week)
Long Maturity Period Varieties
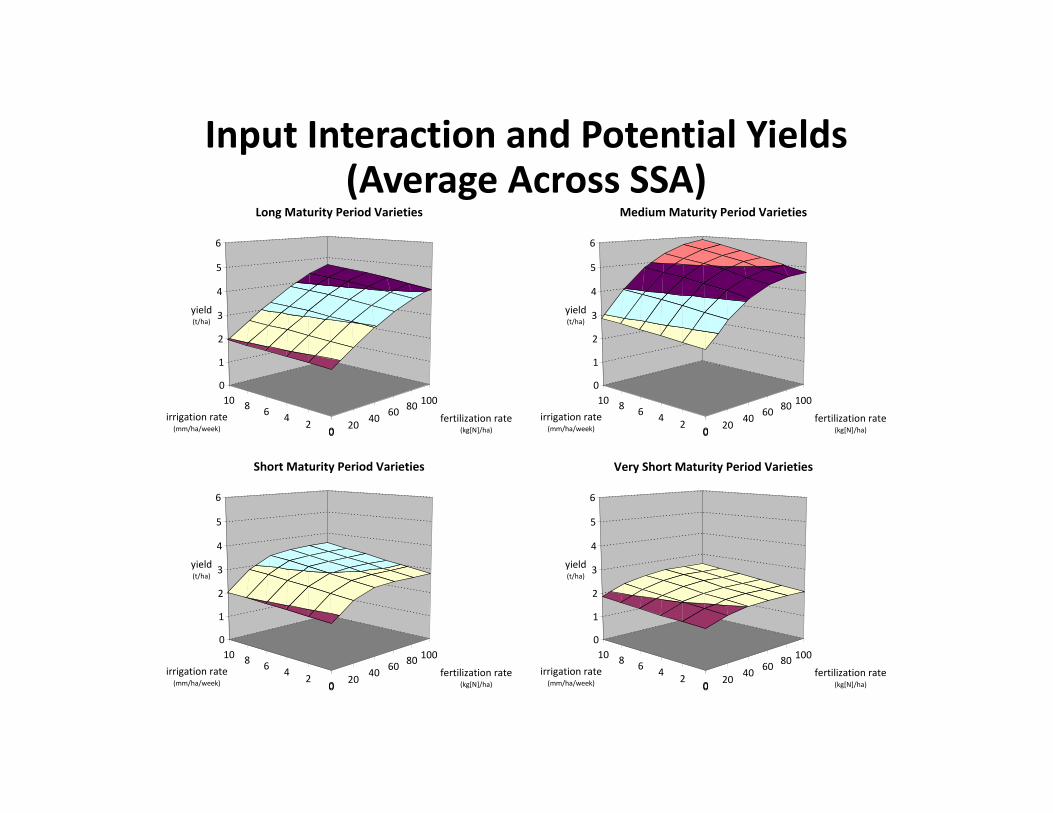
Input Interaction and Potential Yields(Average Across SSA)

Final Comments• There are significant benefits of increased competition in the fertilizer industry at the global / regional level
• Increasing competition in the global fertilizer industry could be given by:
• Investment through foreign investment , PPP, or multilateral platforms to create new plants in priority regions
• Coordination between the various competition agencies to avoid trade restrictions and promoting competition in the fertilizer industry
• It is necessary to promote the sustainable use of fertilizers and that it responds to a soil maps for a sustainable intensification agricultural strategy