THE FATIGUE BEHAVIOR SUPERSONIC TRANSPORT
96
NASA CONTRACTOR REPORT THE FATIGUE BEHAVIOR OF MATERIALS FOR THE SUPERSONIC TRANSPORT by M. S. Eleuly, C. W. Marschzll, F. C. Holden, and WT. S. Hyler Prepared under Contract No. NASr-lOO-(01) by BATTELLE MEMORIAL INSTITUTE Columbus, Ohio f Or NATIONAL AERONAUTICS AND SPACE ADMINISTRATION l WASHINGTON, D. C. l APRIL 1965
Transcript of THE FATIGUE BEHAVIOR SUPERSONIC TRANSPORT
NASA CONTRACTOR
REPORT
THE FATIGUE BEHAVIOR OF MATERIALS FOR THE SUPERSONIC TRANSPORT
by M. S. Eleuly, C. W. Marschzll, F. C. Holden, and WT. S. Hyler
Prepared under Contract No. NASr-lOO-(01) by
BATTELLE MEMORIAL INSTITUTE
Columbus, Ohio
f Or
NATIONAL AERONAUTICS AND SPACE ADMINISTRATION l WASHINGTON, D. C. l APRIL 1965
TECH LIBRARY KAFB, NM
0079807 --- NASA CR-213
THE FATIGUE BEHAVIOR OF MATERIALS
FOR THE SUPERSONIC TRANSPORT
By M. S. Healy, C. W. Marschall, F. C. Holden, and W. ‘S. Hyler
Distribution of this report is provided in the interest of information exchange. Responsibility for the contents resides in the author or organization that prepared it.
Prepared under Contract No. NASr-lOO-(01) by BATTELLE MEMORIAL INSTITUTE
Columbus, Ohio
for
NATIONAL AERONAUTICS AND SPACE ADMINISTRATION
For sole by the Clearinghouse for Federal Scientific ond Technic01 Information Springfield, Virginia 22151 - Price $3.00


ABSTRACT
Tests were conducted on sheet specimens of two materials, Ti-8Al-lM+lV and AM350 CRT to determine the fatigue lives, rates of fatigue-crack propagation, and residual static strengths at three temperatures, 550°F, -llOOF, and room temperature. The effects of prior exposure to 550'F for up to 10 000 hours on the same properties were also studied.
Neither material was significantly degraded by the elevated temperature soak. The fatigue characteristics were found to be comparable to those of contemporary aluminum alloys.
iii

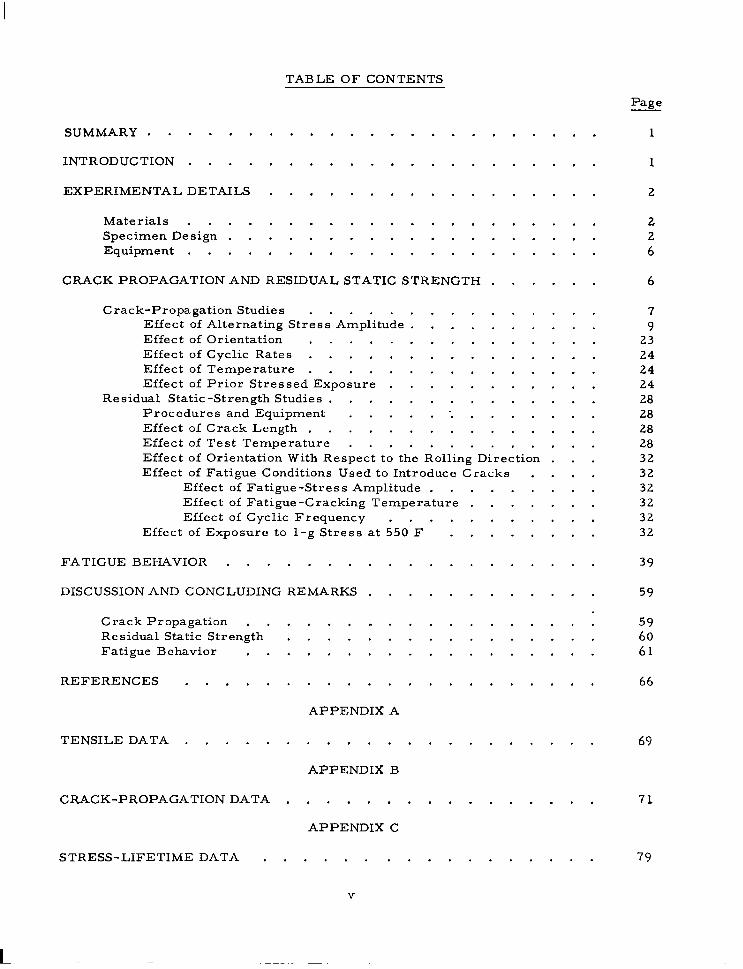
TABLE OF CONTENTS
SUMMARY ...............
INTRODUCTION .............
EXPERIMENTAL DETAILS .........
Materials ............. Specimen Design ........... Equipment .............
. . . . . . . .
. . . . . . . .
. . . . . . . .
........ 2
........ 2
........ 6
CRACK PROPAGATION AND RESIDUAL STATIC STRENGTH . . . . . . 6
Crack-Propagation Studies ............... Effect of Alternating Stress Amplitude .......... Effect of Orientation ............... Effect of Cyclic Rates ............... Effect of Temperature ............... Effect of Prior Stressed Exposure ...........
Residual Static-Strength Studies .............. Procedures and Equipment .............. Effect of Crack Length ............... Effect of Test Temperature ............. Effect of Orientation With Respect to the Rolling Direction ... Effect of Fatigue Conditions Used to Introduce Cracks ....
Effect of Fatigue-Stress Amplitude ......... Effect of Fatigue-Cracking Temperature ....... Effect of Cyclic Frequency ...........
Effect of Exposure to l-g Stress at 550 F ........
FATIGUE BEHAVIOR . . . . . . . . . . . . . . . . . . .
DISCUSSION AND CONCLUDING REMARKS . . . . . . . . . . . .
Crack Propagation ...... ., ........... Residual Static Strength ................ Fatigue Behavior ..................
REFERENCES . . . . . . . . . . . . . . . . . . . . .
APPENDIX A
TENSILEDATA . . . . . . . . . . . . . . . . . . . . . 69
APPENDIX B
CRACK-PROPAGATIONDATA . . . . . . . . . . . . . . , .
APPENDIX C
STRESS-LIFETIME DATA . . . . . . . . . . . . . . . . .
Page
1
1
2
7 9
23 24 24 24 28 28 28 28 32 32 32 32 32 32
39
59
59 60 61
66
71
79
v

THE FATIGUE BEHAVIOR OF MATERIALS FOR THE SUPERSONIC TRANSPORT
M. S. Healy, C. W. Mars&all, F. C. Holden, and W. S. Hyler
SUMMARY
This report describes an investigation of the fatigue behavior of two materials con- sidered as skin materials for the supersonic transport. The materials are AM-350 CRT stainless steel and triplex-annealed Ti-SAl- lMo- 1V alloy.
The three aspects of the program are (1) crack propagation behavior, (2) residual static strength, and (3) the base fatigue strength of the two materials. In each case, many variables have been evaluated that are related to the operating conditions of the supersonic transport. This report describes the research accomplished during the sec- ond year of the program. However, included in the discussion is information from the first year. This was done so that an over-all view of the results of the program could be obtained.
Based on this investigation it appears that the fatigue behaviors of the two mate- rials are not too different from those of materials currently used in subsonic aircraft. In addition, the studies of the effect of prior stressed exposure on fatigue behavior of the two materials showed that neither material exhibited a significant tendency toward metal- lurgy instability at an exposure temperature of 550 F after a stressed exposure of about 10,000 hours. This observation agrees with the results of other programs currently in progress at NASA and other organizations on the same materials.
INTRODUCTION
The National Aeronautics and Space Administration is engaged in research pro- grams directed toward the solution of the myriad problems associated with the develop- ment of the supersonic transport. One of these problem areas is the selection of suitable skin materials. As with all aircraft, the supersonic transport structure will experience cyclic stresses due to gust and maneuver loads, heating, noise, and other variable loads; thus the fatigue behavior of potential skin materials is an important factor in de- sign considerations.
The skin of the supersonic transport will be subjected to temperatures ranging from well below freezing to approximately 550 F. Actually, a major portion of the flight
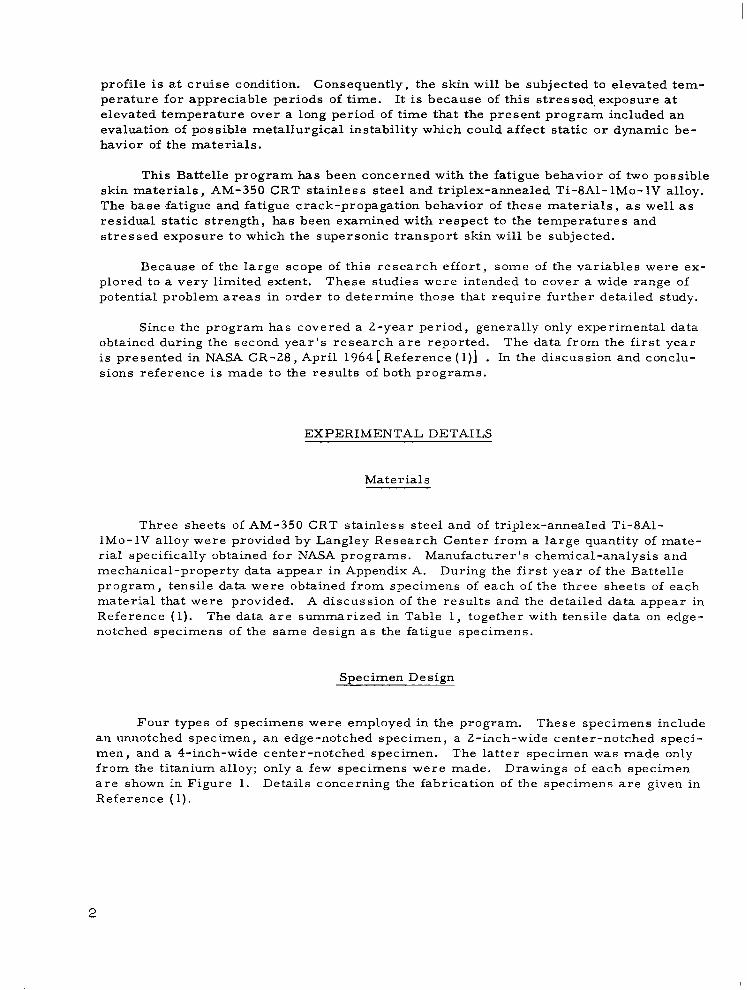
profile is at cruise condition. Consequently, the skin will be subjected to elevated tem- perature for appreciable periods of time. It is because of this stressed,exposure at elevated temperature over a long period of time that the present program included an evaluation of possible metallurgical instability which could affect static or dynamic be- havior of the materials.
This Battelle program has been concerned with the fatigue behavior of two possible skin materials, AM-350 CRT stainless steel and triplex-annealed Ti-SAl- lMo- 1V alloy. The base .fatigue and fatigue crack-propagation behavior of these materials, as well as residual static strength, has been examined with respect to the temperatures and stressed exposure to which the supersonic transport skin will be subjected.
Because of the large scope of this research effort, some of the variables were ex- plored to a very limited extent. These studies were intended to cover a wide range of potential problem areas in order to determine those that require further detailed study.
Since the program has covered a 2-year period, generally only experimental data obtained during the second year’s research are reported. The data from the first year is presented in NASA CR-28, April 1964 [Reference (l)] . In the discussion and conclu- sions reference is made to the results of both programs.
EXPERIMENTAL DETAILS
Materials
Three sheets of AM-350 CRT stainless steel and of triplex-annealed Ti-SAl- lMo-1V alloy were provided by Langley Research Center from a large quantity of mate- rial specifically obtained for NASA programs. Manufacturer’s chemical-analysis and mechanical-property data appear in Appendix A. During the first year of the Battelle program, tensile data were obtained from specimens of each of the three sheets of each material that were provided. A discussion of the results and the detailed data appear in Reference (1). The data are summarized in Table 1, together with tensile data on edge- notched specimens of the same design as the fatigue specimens.
Specimen Design
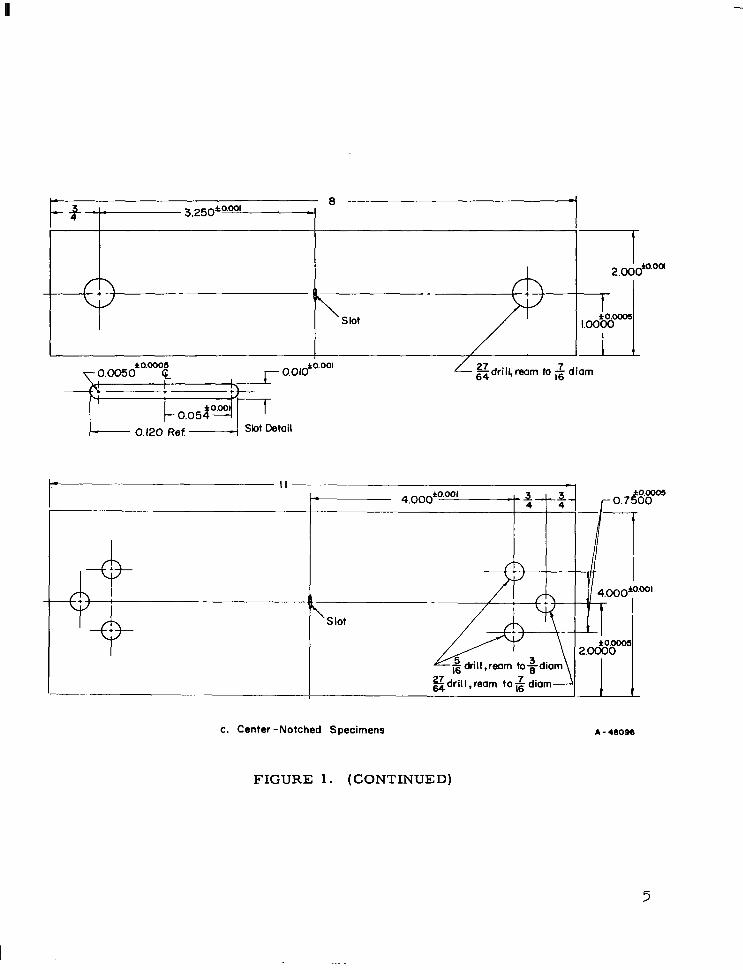
Four types of specimens were employed in the program. These specimens include an unnotched specimen, an edge-notched specimen, a Z-inch-wide center-notched speci- men, and a 4-inch-wide center-notched specimen. The latter specimen was made only from the titanium alloy; only a few specimens were made. Drawings of each specimen are shown in Figure 1. Details concerning the fabrication of the specimens are given in Reference (1).

TABLE 1. SUMMARY OF TENSILE DATA FOR AM-350 CRT AND TRIPLEX- ANNEALED Ti-SAl- lMo- 1V SHEET SPECIMENS
0.2 Per Cent Ultimate Offset Tensile Elongation Modulus of
Temperature, Yield Strength, Strength, in 2 Inches, Elasticity, F Orientation ksi ksi per cent lo6 psi
AM-350 CRT -100
RT
550
Ti-SAl- lMo- 1V - 100
RT
550
Unnotched-Specimen Data
L 221 273 20. 2 28. 1 L 221 233 21. 1 27.8 T 201 236 13. 1 29. 5 L 184 201 3. 7 25. 2
AM-350 CRT RT L
550 L
L 166 179 12.0 20. 0 L 140 152 12.9 18.8 T 132 144 11. 8 17.4 L 98 125 9. 5 16. 7
Notched-Specimen Data, kt = 4. 0
Ti-SAl- lMo- 1V RT L --
Notched Tensile
Strength, ksi
242
200
--
166 --
550 L -- 125 -- me
3

I‘ 4 - R=4
\/
D/2 * .001 -__t- -
D/2 A.001 -0 t
a. Unnotched specimen
0) -I
3 -7
e gdrill, reom tosdiom / 1
1 0.275 * 0.002 t
0.560 * 0.001 t - - + - - -
0.550 l 0.001
0.041 R ‘1’ y7, *0.0°2
b. Edge -notched specimen
FIGURE 1. FATIGUE SPECIMENS
4
II
-f 3.250*“OO’
+ V
Slot
t- II
Es drill ,reom tosdiom
gdrilI,ream to& diam Ll---l-
c. Center -Notched Specimens A - 400%
FIcuRE 1. (CONTINUED)
5
Examination of the finished notches showed them to be uniformly good. The edge notches had radii of 0. 041 f 0. 002 inch; the center notches had radii of 0. 0045 inch and lengths of 0. 125 f 0. 005 inch. The theoretical stress-concentration factor for the edge- notched specimen is 4.0, which is the same notch severity as that used in several Battelle and NASA 293) ported by Gerard{ 4
rograms. ( Using the relations of Inglis14) and Dixon(5), as re- the stress-concentration factor for the 2-inch-wide center-notched
specimens is approiimately 7.9. Similarly, Kt is about 8. 1 for the 4-inch-wide center- notched specimens.
Equipment
All fatigue testing was conducted in Krouse direct-stress fatigue machines of 5,000 or lO,OOO-pound capacity. These machines operate at 1725 and 1200 cpm, respectively. The smaller capacity machines are equipped with automatic hydraulic load maintainers that monitor test loads on each specimen. Accuracy of load setting and maintenance is about 3 per cent of the maximum test load.
For specimens that were stressed in compression for a portion of the cycle, anti- buckling jigs, similar in design to those used at Langley Research Center, were em- ployed. These jigs consist of graphite plates held in contact with the specimen by steel pressure plates and pressure screws mounted in a rigid frame.
The means of heating the elevated-temperature fatigue specimens has been modified as a consequence of some difficulties experienced occasionally with the antibuckling jig- heater method described in Reference (1). The present equipment consists of two nickel-chromium coiled resistance-wire heating units fixed to opposite sides of a closed section of asbestos pipe. This furnace type of heater encloses the antibuckling jig and specimen grips. The specimen temperature is indicated by a Chromel-Alumel thermo- couple located in a hole in the graphite plate of the antibuckling jig. The hole is drilled in the graphite plate on the side away from the specimen. The thermocouple is inserted into this hole to within about l/32 inch of the specimen surface. The thermocouple is connected to a potentiometer controller which regulates the electrical power to the heat- ing units.
The manner in which the fatigue specimens are cooled to - 110 F and the equipment for stress-elevated temperature exposures are discussed in Reference (1).
CRACK PROPAGATION AND RESIDUAL STATIC STRENGTH --
The flight profile of the supersonic transport indicates that there are a number of environmental factors that may influence both the manner in which a fatigue crack will propagate and the strength of a structural element that contains a fatigue crack. As a result, a wide variety of variables were studied to determine which ones may have a significant effect upon the crack-propagation behavior and residual static strength of the two materials. The factors that were explored were the following: alternating stress amplitude, cyclic frequency, specimen orientation with respect to principal rolling di- rection, temperature, and prior stressed exposure at elevated temperature. The studies
6

reported in Reference (1) were devoted to the AM-350 stainless steel. The work that is reported here is primarily concerned with the titanium alloy; however, the behavior of exposed stainless steel specimens has also been examined and is included in this report.
Crack-Propagation Studies
The fatigue-crack p’opagation studies were conducted in conjunction with the residual-strength investigations. In the latter effort, fatigue-cracked specimens with nominal tip-to-tip crack lengths of 3 / 16-, 3/8-, 3/4-, and l-inch were evaluated. Crack-propagation data were obtained from those specimens cracked to 3/4- and l-inch crack lengths in addition to several specimens in which the cracks were propagated until specimen failure occurred. All of the residual-strength tests were conducted on the 2-inch-wide specimens and therefore the majority of crack-propagation information per- tains to the 2-inch-wide specimens. A very limited number of 4-inch-wide Ti-8Al- lMo-1V specimens were also employed in the crack-propagation studies. Data on the crack-propagation behavior of the titanium alloy were obtained at a mean stress of 25 ksi, and the data for the AM-350 were obtained at a mean stress of 40 ksi.
All of the stainless steel specimens were cracked in a lO,OOO-poundKrouse fatigue machine at a cyclic rate of 1200 cpm. The titanium-alloy specimens were cracked in a 5000-pound Krouse machine at frequencies of 1725 cpm and 34 cpm; however, the larg- est stress amplitude employed in the program necessitated the use of the lO,OOO-pound machine. During cracking, the net-section stresses were held essentially constant with an allowable variation of *lo per cent for the steel [as in Reference (l)] and 0 to t 10 per cent for the Ti-8Al- lMo- 1V alloy. The net-section stresses are based on the untracked portion, regardless of whether the specimen went into compression or not. A few titanium-alloy specimens were cracked at constant gross- section stress for purposes of comparison with the data obtained under constant net-section stress. Crack-propagation measurements were made by stopping the machine and measuring crack length with a measuring microscope mounted on a traverse. Measurements were taken with the specimen subjected to the maximum stress of the particular test. At - 110 F and 550 F, the data were obtained in the same manner by observing the crack through a window in the enclosure.
From the experimental data, total crack length was plotted against total number of cycles. As was indicated in Reference (1)) the effect of the *lo per cent variation in stress is readily apparent in these plots for the steel; however, there seems to be little evidence of the 0 to t 10 per cent stress variation in similar curves for the titanium alloy.
In order to determine the effects of the several variables in terms of the crack- propagation behavior, curves were drawn on the crack length versus cycles plots to minimize the small effect of the load changes required to maintain a constant nominal net-section stress. Crack-propagation rates were determined by evaluating the slope of the curves at specific crack lengths of 0. 250, 0. 350, 0.500, 0.625, 0. 750, and 0. 950 inch. For purposes of this investigation, “initiation” has been defined as a total crack length of 0. 150 inch for the titanium and 0. 130 inch for the steel. Although most of the specimen tests were stopped at nominal crack lengths of 314 and 1 inch, two specimens, under each set of conditions, were tested to failure from a nominal crack length of 1 inch without further adjustment of the net-section stress. The propagation
7

0.E
Jz 0 .E ; 0.6
s? s Y :: 3 0.4 G ‘;; I--
0.2
0 0 IO 20 30 40 /
Total Number of Cycles X low3 6
d=0.38
I I 70 a
A-48097
FIGURE 2. TYPICAL FATIGUE-CRACK PROPAGATION CURVES FOR UNEXPOSED, LONGITUDINAL 2-INCH-WIDE Ti-8Al- lMo- 1V ALLOY SHEET SPECIMENS AT ROOM TEMPERATURE AND 1200-1725 CPM
Net-section stresses maintained within 0 to ‘10 per cent of nominal values .

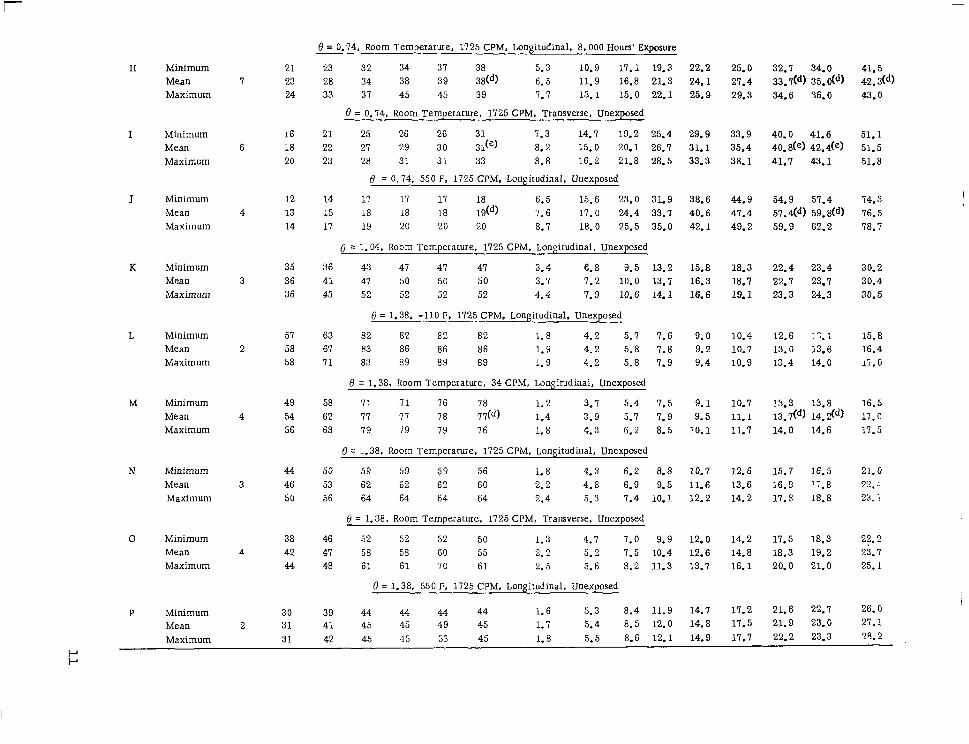
rates and total number of cycles to propagate a crack to the indicated crack lengths are given in detail in Appendix B. The data from tests of 2-inch-wide titanium alloy speci- mens at constant net-section stress are summarized in Table 2.
The effects of the variables examined, on crack propagation behavior, are pre- sented and discussed in the following subsections.
Effect of,Alternating Stress Amplitude
Alternating stress amplitude has been expressed in Table 2 and in subsequent tables and figures as the ratio, 8, of alternating stress amplitude to l-g mean stress. The effect of 6’ is illustrated by conditions A, B, G, K, N. and Q in Table 2.
As would be expected, 8 does have a significant influence upon crack propagation behavior. Figure 3, on which are stress-lifetime curves for various crack-length cri- teria, shows how the number of cycles to a given crack length is affected by 8. Figure 4 illustrates the increase in crack-propagation rates with increasing 8 for three values of crack length. Figure 2 and Table 2 show that following initiation, crack-propagation rate increases with increasing crack length for an initial portion of total crack growth. After this portion of crack growth has taken place, the propagation rate becomes virtu- ally constant with a further increase in crack length, to a nominal l-inch crack length. This appears to be consistent with other observations(7,8) f o crack propagation behavior under constant net-section stresses.
As a guide to determine the value of 0 at which a crack will not initiate in the starter notch in lo7 cycles, a specimen was tested at a 8 of 0. 25. After the specimen had accumulated lo6 cycles without any visible sign of a crack, the test was continued on the same specimen at 8 = 0. 30. Following a period of crack initiation and growth at 8 = 0. 30, it was decided to determine the value of 8 at which the crack would cease to propagate. The value of 8 was decreased successively in steps with sufficient cycles added at each 8 to insure that crack growth occurred and that some measure of the prop- agation rate was obtained. The results from this test appear in Table 3. As is indi- cated, the test was stopped after a crack failed to propagate at 8 = 0. 05 in 80,000 cycles.
The initiation curve in Figure 3 indicates that the fatigue limit, at 107 cycles, for a 2-inch-wide center-notched Ti-8Al-lMo-1V alloy specimen, with a Kt of approximately 7.9, will be at a 8 of about 0. 20. However, the data from the single specimen points out that once a crack has initiated, cracks will propagate at values of 8 which are consider- ably lower than the fatigue limit for the starter notch. It is recognized(9,10,11) that the 8 at which a fatigue crack will cease propagating also is a function of the crack length, but the results of this test illustrate that a crack will propagate at stresses below the fatigue limit. This adds to the complexity of cumulative damage assessment since both initiation and propagation behavior of a crack must be accounted for, and some of the lower stresses for propagation should be included in an analysis. To provide compa- rable information for both materials, a similar test was conducted on a single specimen of AM-350 stainless steel. During this test the same values of 8 were employed, and every effort was made to have initial and final crack lengths for each condition identical to those in the titanium specimen test. The results are given in Table 4. From a com- parison of the two sets of data, it is apparent that the same observations apply to the behavior of the stainless steel.
9

G TABLE 2. SUMMARY OF DATA FROM CRACK-PROPAGATION TESTS OF 2-INCH-WIDE Ti-8Al-lMo-1V ALLOY SHEET SPECIMENS AT CONSTANT NET-SECTION STRESS
Center-notched, triplex-annealed specimens. Constant net-section mean stress of 25 hi.
Crack-Propagation Rate, pin. /cycle, Total Thousands of Cycles to Indicated Crack Let&a), inch Teat Series Number at Indicated Crack Length(a), inch 0.150
Condition Value Tested 0.250 0.350 0.500 0.625 0.750 0.950 (Initiation) 0.250 0.350 0.500 0.625 0.750 0.950 1.000 Failure(b)
A Minimum Mean Maximum
B Minimum Mean Maximum
C Minimum Mean Maximum
D Minimum Mean Maximum
E Minimum Mean Maximum
F Minimum Mean Maximum
G Minimum Mean Maximum
1.3 1.4 1.4
1013 1945 1095 1107 1181 1199 1234 1289 1300 1380 1385 1422 1481 1492 1578
4.2 4.3 4.5
e(‘) = 6.26, Room Temperature, 1725 CPM, Longitudinal. Unexposed,
2.2 2.8 3.3 3.4 3.4 635 853 915 973 2.2 2.9 3.4 3.7 3.1 858 1041 1163 1161 2.2 2.9 3.4 4.0 4.0 1080 1229 1291 1349
0 = 6.38, Room 1725 CPM, LongitudinaL Unexposed Temperature,
5.3 7.2 8.1 8.7 8.7 53.0 92.5 105 127 5.8 8.1 8.8 9.4 9.0 61.2 93.7 115 136 6.7 8.6 9.6 10 9.6 67.2 101 123 146
0 = 6.38. Room Temperature, 1725 CPM, Transverse, Unexposed
141 156 177 181 228 151 165 186 192 234 161 176 199 205 240
3.6 4.0 4.5
4.5 4.7 4.9
5.8 7.4 7.4 8.0 71.3 119 146 6.4 7.9 8.1 8.4 86.6 129 153 7.2 8.3 9.2 9.2 103 151 179
0 = 0.38. 550 F. 1725 CPM, Longitudinal. Unexposed
4.6 5.,5 5.2 5.2 57.3 90.2 117 4.8 5.5 5.7 5.3 57.4 99.6 128 4.9 5.5 6.1 5.3 51 5 109 139
e = 0.74. -110 F, 1725 CPM, Longitudinal, Unexposed
b_ 34 34 33 8.3 14.7 19.1 36 36 37 38c-o 9.2 15.7 20.0 38 38 42 42 11.1 17.6 22.0
165 180 195 2l!! 222 269 178 196 212 236 241 291 206 224 239 264 271 312
3.0 3.8 3.4 3.9 3.8 4.0
149 174 195 229 289 296 162 187 209 241 256 316 175 199 223 264 213 333
20 23 22 24 23 26
24.7 28.0 31.4 25.5 29.0 32.5 27.5 31.1 34.8
36.2 37.4 38. dd) 39. s(d) 40.1 4b7
45.9 48.3 50.7
19 23 24
0 = 6.74. Room Temperature, 34 CPM, Longitudinal, Unexposed
26 33 36 36 38 6.0 11.7 15.4 20.3
28 34 38 38 39(d) 6.5 12.3 16.4 21.3 29 35 40 40 39 7.8 12.9 16.7 21.9
8= 9.74. Room Temperature, 1725 CPM, Longitudinal, Unexposed
23.7 26.9 32.0 32.9 39.4 24.8 28.1 32.7(d) 33.509 41;o 25.4 28.9 33.4 34.7 42.6
17 22 27 30 30 31 6.7 11.7 16.3 22.2 26.3 30.2 36.2 37.7 45.1 20 24 29 31 32 32(e) j 7.1 13.5 18.4 24.3 28.5 32.3 38,de) 39.8(e) 47.3 22 25 31 33 36 34 7.5 14.3 19.3 25.4 29.7 33.7 40.2 41.9 50.0
H Minimum 21 Mean I 23 Maximum 24
I Minimum 16 Mean 6 18 Maximum 20
J Minimum 12 Mean 4 13 Maximum 14
K Minimum 35 Mean 3 36 Maximum 36
L Minimum 51 Mean 2 58 Maximum 58
M Minimum 49 Mean 4 54 Maximum 56
N Minimum 44 Mean 3 46 Maximum 50
0 Mmimum 38 46 Mean A 42 41 Maximum 44 48
P Minimum 30 39 44 44 44 44 1.6 5.3 8.4 11.9 14.7 11.2 21.6 22.7 26.0
Mean 2 31 41 45 45 49 45 1.7 5.4 8.5 12.0 14.8 17.5 21.9 23.0 27.1
Maximum 31 42 45 45 53 45 1.8 5.5 8.6 12.1 14.9 17.1 22.2 23.3 28.2
8 = 0.74, Room Temperature. 1725 CPM, Longitudinal, 8,000 Hours’ Exposure -__
23 32 34 37 38 5.3 10.9 17.1 28 34 38 39 38td) 6.5 11.9 16.8 33 37 45 45 39 7.7 13.1 15.0
0 = 0.74. Room Temperature, 1725 CPM, Transverse. Unexposed
21 25 26 26 31 7.3 14.7 19.2 22 21 29 30 31(e) 8.2 15.0 20.1 23 28 31 31 33 8.8 16.2 21.8
0 = 0.74, 550 F, 1725 CPM, Longitudinal, Unexposed
14 17 17 17 18 6.5 15.6 23.0 15 18 18 18 19(d) 7.6 17.0 24.4 17 19 20 20 20 8.7 18.0 25.5
19.3 22.2 25.0 21.3 24.1 27.4 22.1 25.9 29.3
25.4 29.9 33.9 26.1 31.1 35.4 28.5 33.3 38.1
31.9 38.6 44.9 33.1 40.6 41.4 35.0 42.1 49.2
0 = 1.04. Room Temperature, 1725 CPM, Longitudinal, Unexposed
36 43 41 47 41 3.4 6.8 9.5 13.2 41 47 50 50 50 3.7 7.2 10.0 13.7 43 52 52 52 52 4.4 7.9 10.6 14.1
0 = 1.38, -110 F. 1725 CPM, Longitudinal, Unexposed
63 82 82 82 82 1.8 4.2 5.1 1.6 61 83 86 86 86 1.9 4.2 5.8 1.8 71 83 89 89 89 1.9 4.2 5.8 7.9
0 = 1.38. Room Temperature. 34 CPM, Longitudinal. Unexposed
58 71 71 16 78 1.2 3.7 5.4 7.5 62 77 77 18 77(d) 1.4 3.9 5.1 7.9 63 79 79 79 76 1.8 4.3 6.2 8.5
0 = 1.38. Room Temperature, 1725 CPM, Longitudinal, Unexposed
50 59 59 59 56 1.8 4.3 6.2 8.8 53 62 62 62 60 2.2 4.8 6.9 9.5 56 64 64 64 64 2.4 5.3 7.4 10.1
ti = 1.38. Room TemDerature. 1725 CPM, Transverse. UnexDosed
52 52 52 50 1.3 4.7 7.0 9.9 58 58 60 55 2.2 5.2 7.5 10.4 61 61 70 61 2.5 5.6 8.2 11.3
0 = 1.38, 550 F, 1725 CPM, Longitudinal, Unexposed
32.7 34.0 33.7(d) 35.0(d)
15.8 18.3 16.3 18.1 16.6 19.1
9.0 9.2 9.4
10.4 10.7 10.9
9.1 9.5
' 0.1
10.7 11.1 11.7
34.6 36.0
40.0 41.6 40.8ce) 42.4ce) 41.1 43.1
54.9 57.4 57.44 59.8(d) 59.9 62.2
22.4 23.4 22.7 23.1 23.3 24.3
12.6 :-,.I 13.0 13.6 13.4 14.0
13.3 13.8 13,7(d) 14.2(d)
41.5 42.3td) 43.0
51.1 51.5 51.8
14.3 76.5 78.7
30.2 30.4 30.5
15.8 16.4 li.o
14.0 14.6
16.5 17-n 17.5
10.1 12.6 15.7 11.6 13.6 16.3 12.2 14.2 17.6
16.5 3- I. 8 18.8
21.0 22.:. 28. ;
12.0 14.2 17.5 18.3 22.2 12.6 14.8 18.3 19.2 23.1 13.1 16.1 20.0 21.0 25.1

K TABLE 2. (Continued)
Crack Propagation Rate, p in. /cycle. Total Thousands of Cycles to Indicated Crack Length(a), inch Teat Series Number at Indicated Crack Length(a). inch 0.150
Condition Value Tested 0.250 0.350 0.500 0.625 0.750 0.950 (Initiation) 0.250 0.350 0.500 0.625 0.750 0.950 1.000 Failure(b)
-Q Minimum Mean Maximum
4 50 57 61
0 = 1.74, Room Temperature, 1200 CPM, Longitudinal, Unexposed
61 71 75 15 63 1.1 2.2 4.7 6.5 8.0 9.5 11.8 12.4 15.1 68 81 82 82 75 1.3 3.3 5.1 7.2 8.1 10.3 12.8 13.5 16.6 71 85 85 85 83 1.5 4.0 5.7 8.1 9.8 11.5 14.5 15.3 15.5
(a) Tip-to-tip crack length. (b) Two specimens under each set of conditions cycled to failure ftom l-inch nominal crack length without further adjustment of net-section suess. (c) 8= net-section alternating-saeu amplitude/l-g mean stress of 25 ksi. (d) Only two specimens tested to indicated crack length. (e) Only four specimens tested to indicated crack length.

--I---.
Crack Length (Tip to Tip) 0 0. IS0 in.(initiatianl A 0.250in. v 0.625in. 0 0.950in. 0 Failure-net-section
stress not reodjusted beyond l-inch crack length
IO'
Total Cycles, N
FIGURE 3. EFFECT OF THE RATIO f3 ON THE CRACK-PROPAGATION BEHAVIOR OF Ti-8Al-lMo- 1V ALLOY SHEET SPECIMENS
Specimens: Unexposed, 2 inches wide, longitudinal.
Conditions: Room temperature, 1200-1725 cpm, constant net-section I-g mean stress of 25 ksi.
13

100
80.
Crack Length (Tip to Tip), inch,
0 0.250 cl 0.350 A 0.750
I I I I I I I I 0 0.5 I 1.5 2
Alternating Stress/ l-g Mean Stress, 8 A-48099
FIGURE 4. EFFECTOFTHERATIO eONCRACK-PROPAGATIONRATE IN Ti-8Al-lMo-1V ALLOY SHEET SPECIMENS
Specimens: Unexposed, 2 inches wide, longitudinal.
Conditions: Room temperature, 1200- 1725 cpm, constant net-section stress.
14

TABLE 3. CRACK-PROPAGATION DATA FOR A Z-INCH-WIDE Ti-8Al-lMo-1V ALLOY SHEET SPECIMEN AT SEVERAL ALTERNATING STRESS AMPLITUDES AND CRACK LENGTHS
25-ksi mean stress, room temperature, unexposed, longitudinal, and 1725 cpm
:- - ~- Condition ASA e e, ff N WAN
1 6.25 0.25 0.1218 0.1218 1000 0 2 7.50 0.30 0.1218 0.2880 320 2,5(a) 3 I. 00 0.28 0.2880 0.3433 30 1.8 4 6.50 0.26 0.3433 0.3922 30 1.6 5 6.00 0.24 0.3922 0.4463 30 1.8 6 5.00 0.20 0.4463 0.4965 40 1.3 I 4.50 0.18 0.4965 0.5311 50 0.8 8 3.75 0.15 0.5371 0.5568 40 0.5 9 3.00 0.12 0.5568 0.5936 130 0.3
10 2.00 0.08 0.5936 0.6072 150 0.09 11 1.25 0.05 0.6072 0.6072 80 0.00
ASA - alternating stress amplitude in ksi. 0 - alternating suess amplitude/mean stress.
ei - initial tip-to-tip crack length at indicated condition. ef - final tip-to-tip crack length at indicated condition. N - number of cycles (x 10-3) under given condition.
he/AN - average crack propagation rate, pin. /cycle.
(a) Represents average crack-propagation rate over the final portion of this condition.
TABLE 4. CRACK-PROPAGATION DATA FOR A 2-INCH-WIDE AM-350 STAINLESS STEEL SHEET SPECIMEN AT SEVERAL ALTERNATING STRESS AMPLITUDES AND CRACK LENGTHS
40 ksi mean stress, room temperature, unexposed, longitudinal, and 1725 cpm
-.-_ Condition ASA e pi et N he/AN “..~-. _
1 10.0 0.25 0.1234 0.1234 2 12.0 0.30 0.1234 0.281 3 11.2 0.28 0.281 0.363 4 10.4 0.26 0.363 0.390 5 9.6 0.24 0.390 0.445 6 8.0 0.20 0.445 0.4935 7 7.2 0.18 0.4935 0.542 8 6.0 0.15 0.542 0.554 9 4.8 0.12 0.554 0.594
10 3.2 0.08 0.594 0.612 11 2.0 0.05 0.612 0.6205 12 1.2 0.03 0.6205 0.6205
84 16
6 14 11.5 22.5 10 45 61
108 110
0 5,0(a) 4.1 4.5 3.9 2.8 2.2 1.2 0.9 0.3 0.08 0.00
ASA - alternating stress amplitude in ksi. 8 - alternating sness amplitude/mean stress.
e i - initial tip-to-tip crack length at indicated condition. [f - final tip-to-tip crack length at indicated condition. N - number of cycles (X 10e3) under given condition.
At/AN - average crack propagation rate, n in. /cycle.
(a) Represents average crack-propagation rate over the final portion of this condition.
15
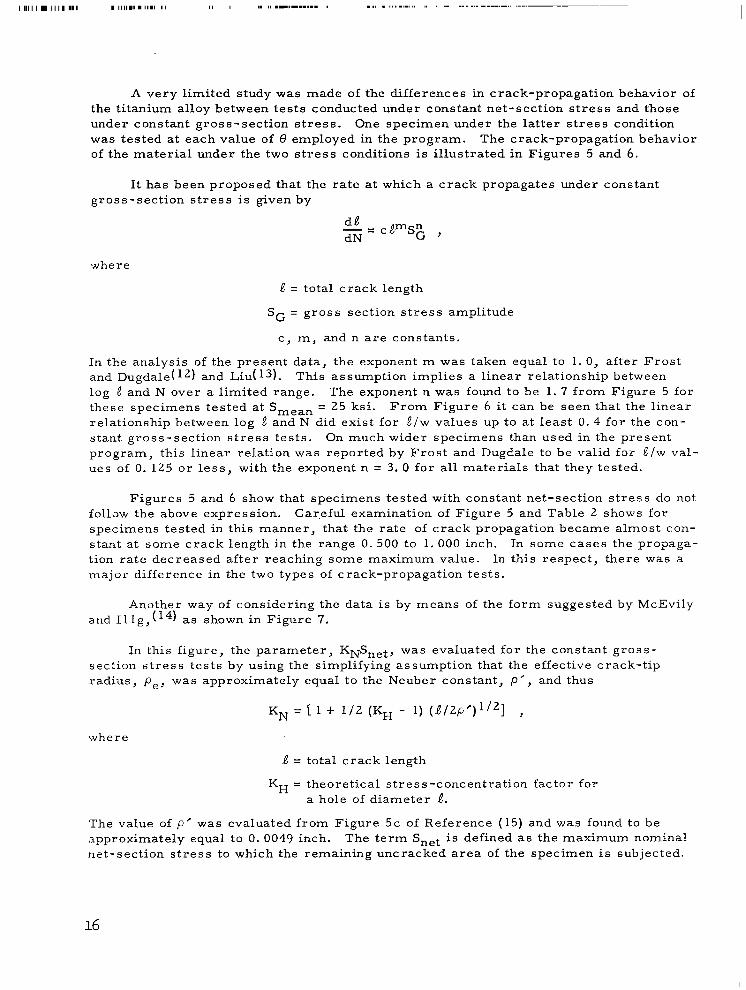
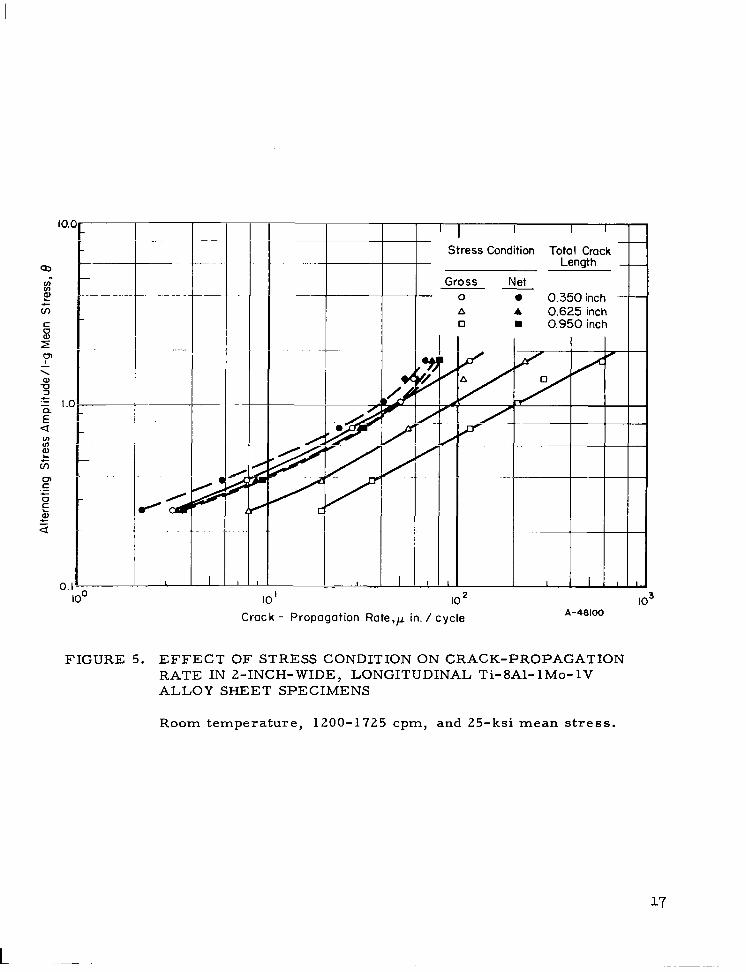
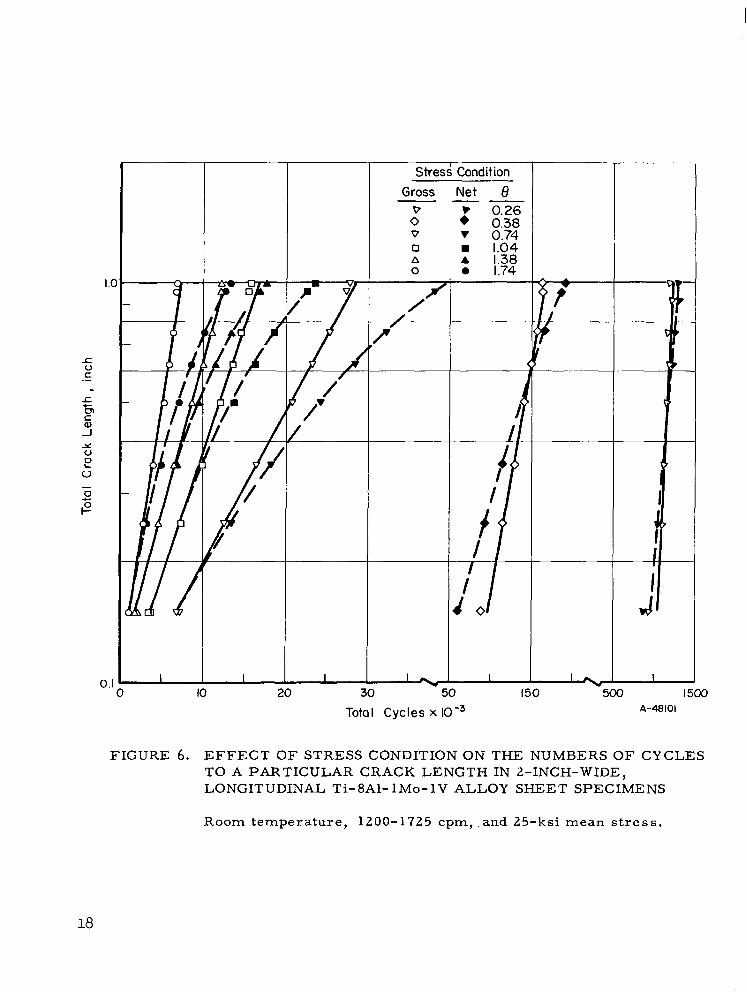
A very limited study was made of the differences in crack-propagation behavior of the titanium alloy between tests conducted under constant net-section stress and those under constant gross-section stress. One specimen under the latter stress condition was tested at each value of 8 employed in the program. The crack-propagation behavior of the material under the two stress conditions is illustrated in Figures 5 and 6.
It has been proposed that the rate at which a crack propagates under constant gross-section stress is given by
da - = cfpyp dN G ’
where
e = total crack length
SC = gross section stress amplitude
c, m, and n are constants.
In the analysis of the present data, the exponent m was taken equal to 1. 0, after Frost and Dugdale( 12) and Liu(l3). This assumption implies a linear relationship between log e and N over a limited range. The exponent n was found to be 1. 7 from Figure 5 for these specimens tested at S,,,, = 25 ksi. From Figure 6 it can be seen that the linear relationship between log f? and N did exist for &/w values up to at least 0. 4 for the con- stant gross-section stress tests. On much wider specimens than used in the present program, this linear relation was reported by Frost and Dugdale to be valid for e/w val- ues of 0. 125 or less, with the exponent n = 3. 0 for all materials that they tested.
Figures 5 and 6 show that specimens tested with constant net-section stress do not follow the above expression. Careful examination of Figure 5 and Table 2 shows for specimens tested in this manner, that the rate of crack propagation became almost con- stant at some crack length in the range 0. 500 to 1. 000 inch. In some cases the propaga- tion rate decreased after reaching some maximum value. In this respect, there was a major difference in the two types of crack-propagation tests.
Another way of considering the data is by means of the form suggested by McEvily aud Illg,(14) as shown in Figure 7.
In this figure, the parameter, KNS,,~, was evaluated for the constant gross- section stress tests by using the simplifying assumption that the effective crack-tip radius, p,, was approximately equal to the Neuber constant, p’, and thus
KN = 1.1 + l/2 (KH - 1) (a/2f+‘21 ’
where
d = total crack length
KH = theoretical stress-concentration factor for a hole of diameter a.
The value of p’ was evaluated from Figure 5c of Reference (15) and was found to be approximately equal to 0. 0049 inch. The term Snet is defined as the maximum nominal net-section stress to which the remaining untracked area of the specimen is subjected.
16
Stress Condition Total Crack
IO' IO2 Crack - Propagation Rote,p in. / cycle
IO3 A-48100
FIGURE 5. EFFECT OF STRESS CONDITION ON CRACK-PROPAGATION RATE IN Z-INCH- WIDE, LONGITUDINAL Ti- 8Al- 1 MO- 1V ALLOY SHEET SPECIMENS
Room temperature, 1200-1725 cpm, and 25-ksi mean stress.
17
L
T
,r-
6 / /’ /
t
Stresi Condition Gross
0” V D A
;/
f---
Net 8 -0.
: 0.38 v 0.74 8 A 1% 0 1.74
20 30 50
Total Cycles x low3
t F
I500 A-48101
FIGURE 6. EFFECT OF STRESS CONDITION ON THE NUMBERS OF CYCLES TO A PARTICULAR CRACK LENGTH IN 2-INCH-WIDE, LONGITUDINAL Ti-8Al-IMo-1V ALLOY SHEET SPECIMENS
Room temperature, 1200-1725 cpm, and 25-ksi mean stress.
18

*Curve for ’ 2024-T3 707%T6~ from Reference (l4).-v
w A 0.38 2024-T3,20 ksi n 0.74
I I I I I I I 150 250 350 450 550
K, Sne+, ksi
650 750 850
FIGURE 7. CRACK-PROPAGATION RATE AS A FUNCTION OF K$,et FOR 2-INCH-WIDE, LONGITUDINAL Ti-8Al-lMo-1V ALLOY SHEET SPECIMENS TESTED UNDER CONSTANT GROSS-SECTION STRESS CONDITION
Room temperature, 1200-1725 cpm, and 25-ksi mean stress.
19

Also shown on the figure are three additional curves from Reference (14). The dashed curve is plotted from an empirical expression relating crack-propagation rate with KNSnet for 2- and 12-inch-wide center-cracked specimens of 2024-T3 and 7075-T6 aluminum alloys. All tests were run essentially at R = 0, and the dashed curve fit all of the data reasonably well. To provide for a comparison of the results from the tests on Ti-8Al- lMo- 1V alloy and the aluminum alloys, two individual curves were singled out (one for each alloy) and are plotted in Figure 7. These were selected because the ratio of the mean test stress to tensile strength of each aluminum alloy was about equivalent to that of the titanium alloy. Thus, the latter two curves can be compared with the curve for titanium for 8 = 1. 04. This limited comparison showed that for equal values of KNSnet, the rate of crack propagation of the titanium was less than that of the aluminum alloys.
Also shown in Figure 7 is the fact that the titanium data cannot be represented con- veniently by a single curve. Further evaluation, particularly at low 8 values, would be required to establish a functional relationship between crack-propagation rate, R or A and KNSnet .
Another limited study concerned the manner in which specimen width affects the propagation behavior of a cracked titanium specimen. Two 4-inch-wide specimens were cracked at each of two values of 8 under constant net-section stress. The results are summarized in Table 5 and are illustrated in Figure 8. In general, the number of cycles to propagate a crack to a particular length and the rate of crack propagation at a partic- ular crack length are markedly different for the two specimen widths at the same value of 8. These effects of specimen width are similar to those observed by McEvily and Illg( 1 6), Rolfe and Munse(8), and Weibull(7). Again employing the parameter KNS,,t, Figure 9 shows that the difference between the propagation rates for the two specimen widths seems to be reasonably accounted for for crack lengths up to an a/w of about 0.30.
TABLE 5. DATA ON CRACK-PROPAGATION BEHAVIOROF LONGITUDINAL
Tl-BAl-lhlo-1V ALLOY AT ROOhl TEMPERATURE AND1125CPt.4
FOR TWO SPECIMEN WIDTHS AND TWO STRESS AMPLITUDES
Toral Crack Length. inch
__. - -_-..= Mean Crack-Propagation Rare. pin. /cycle.
for lndlcawd Specmen Width 2 Inches 4 Inchz
- _.____ ..--._.. -- ..-. ----
e= 0.36
0.250 4.3 5.9 0.350 5.6 6.6 0.500 6.1 13 0.625 6.6 16 0.150 9.4 17 0.950 9.0 21 1.250 __ 23 1.500 23 1.750 __ 23 1.900 . 23
8= 0.74
0.250 20 24 0.350 24 32 0.500 29 39 0.625 31 45 0.750 32 51 0.950 32 60 1.250 __ 66 1.500 -_ 66 1.750 __ 66 1.900 _. 66
~ _ -pci~::? rr ,z: -,=I
20

*o F ~~ ii-r-r
Specimen Width
A 2 inches o 4 inches
1.5
ii r 2
.-
” AZ s 1.0 5
[
I- .-. --- -
Tota I Cycles
Specimen Width
A 2 inches 0 4 inches
“0 IO 20 30 40 50 80 70 80 Crack- Propagation Rate, p in. /cycle
A- 48103
FIGURE 8. EFFECT OF SPECIMEN WIDTH ON THE CRACK-PROPAGATION BEHAVIOR OF LONGITUDINAL Ti-8Al- lMo- 1V ALLOY SHEET SPECIMENS UNDER CONSTANT NET-SECTION STRESS
Room temperature, 1200-1725 cpm, and 25-ksi mean stress.
21

Specimen Width
A 2 inches o 4 inches
-___-. _~ - -... I _
IO00 150 200 250 300 350 400 450
K,S,,+M A-48104
FIGURE 9. CRACK-PROPAGATION RATE AS A FUNCTION OF KNSnet FOR TWO SHEET SPECIMEN WIDTHS OF LONGITUDINAL Ti-8Al- lMo- 1V ALLOY UNDER CONSTANT NET-SECTION STRESS
Room temperature, 1200-1725 cpm, and 25-ksi mean stress.
22
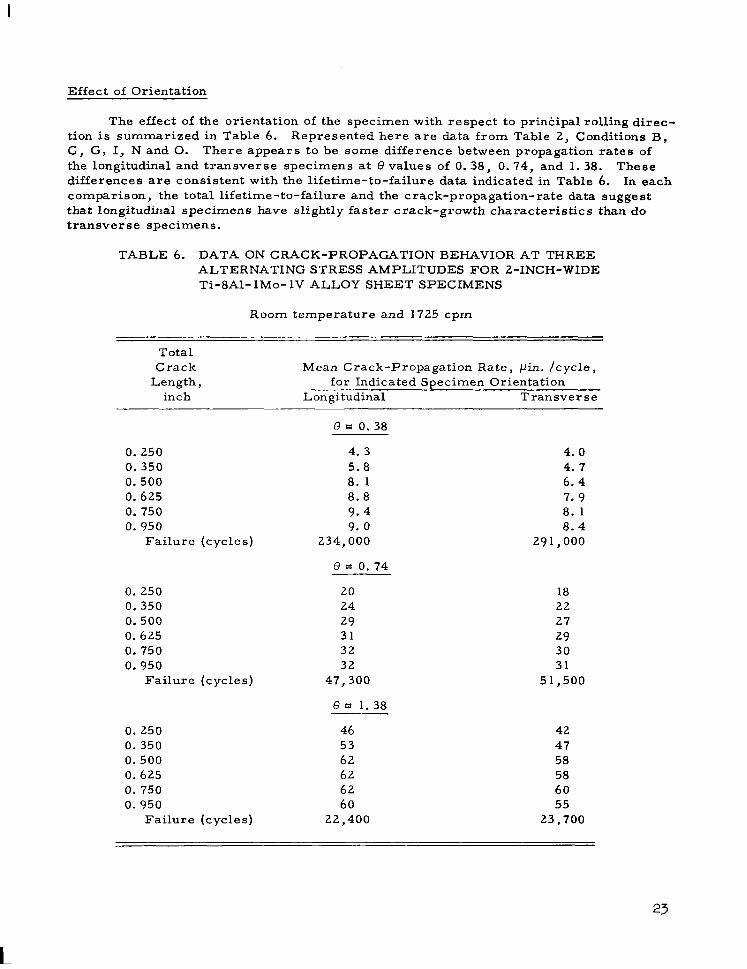
Effect of Orientation
The effect of the orientation of the specimen with respect to principal rolling direc- tion is summarized in Table 6. Represented here are data from Table 2, Conditions B, C, G, I, N and 0. There appears to be some difference between propagation rates of the longitudinal and transverse specimens at 8 values of 0. 38, 0.74, and 1. 38. These differences are consistent with the lifetime-to-failure data indicated in Table 6. In each comparison, the total lifetime-to-failure and the crack-propagation-rate data suggest that longitudinal specimens have slightly faster crack-growth characteristics than do transver’se specimens.
TABLE 6. DATA ON CRACK-PROPAGATION BEHAVIOR AT THREE ALTERNATING STRESS AMPLITUDES FOR 2-INCH-WIDE Ti-8Al- lMo- 1V ALLOY SHEET SPECIMENS
Room temperature and 1725 cpm
Total Crack Mean Crack-Propagation Rate, pin. /cycle,
Length, for Indicated Specimen Orientation inch Longitudinal Transverse
8 = 0. 38
0. 250 4. 3 4. 0 0.350 5. 8 4. 7 0.500 8. 1 6.4 0.625 8.8 7. 9 0.750 9. 4 8. 1 0.950 9. 0 8.4
Failure (cycles) 234,000 291,000
8 = 0.74
0. 250 20 18 0.350 24 22 0.500 29 27 0.625 31 29 0. 750 32 30 0.950 32 31
Failure (cycles) 47,300 51,500
8 = 1.38
0. 250 46 42 0.350 53 47 0.500 62 58 0.625 62 58 0. 750 62 60 0.950 60 55
Failure (cycles) 22,400 23,700
23
L
III III II I
Effect of Cyclic Rates
Data illustrating the effect of cyclic rate on crack propagation were obtained at 6 values of 0. 74 and 1. 38. The testing frequencies evaluated were 34 and 1725 cpm. These data are listed in Table 2 and include conditions F, G, M, and N. Figure 10 shows that if the cyclic rate decreases there is an increase in the rate of crack propaga- tion. In this figure data are illustrated for specimens with crack lengths of 0. 250 inch and 0. 750 inch. On the basis of the data, it appears that there is a small but significant effect of cycling rate on the rate of crack propagation and that this effect appears more important at high values of alternating stress amplitude and for longer cracks. For the limited conditions evaluated, increases in crack-propagation rate in the range 15 to 25 per cent were observed when testing speed was reduced from 1725 cpm to 34 cpm.
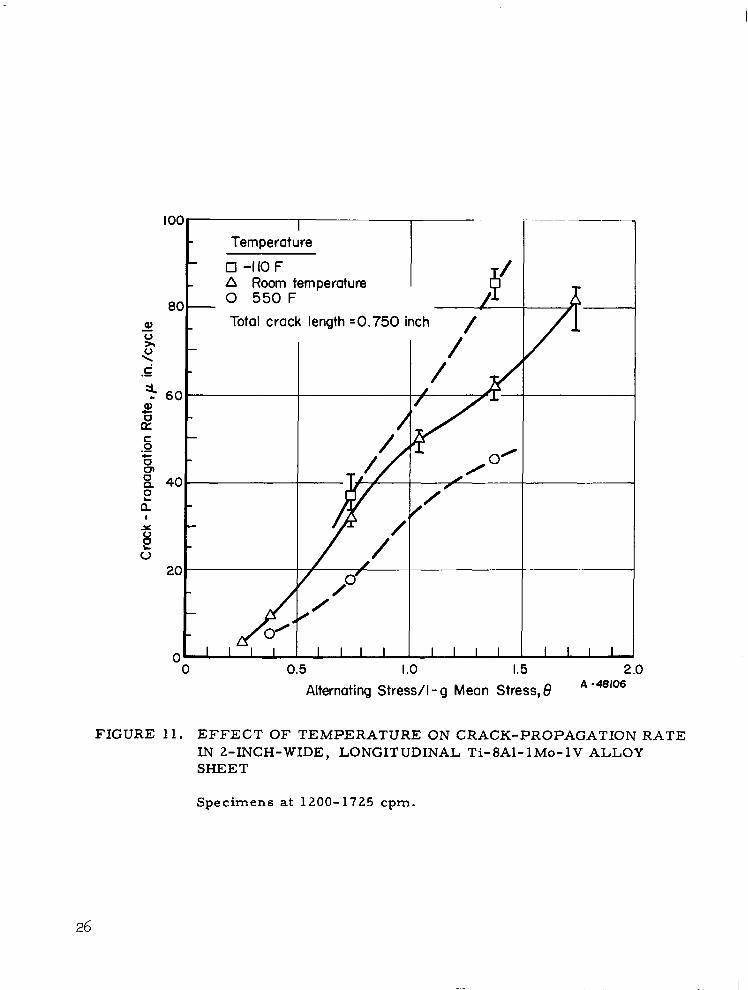
Effect of Temperature
To examine the effects of temperature on crack growth in the titanium alloy, specimens were tested at several values of 8 at -110 F and at 550 F. The behavior of these specimens was compared with the behavior of specimens evaluated at room tem- perature. The high- and low-temperature data correspond to Conditions D, E, J, L, and P in Table 2. Figure 11 shows the influence of temperature on the rate of crack propagation at a crack length of 0. 750 inch. Similar observations apply to shorter cracks. From this figure it is seen that at a given alternating stress the crack growth is more rapid the lower the temperature. Table 7 contains a summary of lifetime data for the points in Figure 11. The lifetime values for 8 = 0. 38 can be considered to be on S-N curves for the starter notch at the three temperatures in the vicinity of the fatigue limit. From the data in Table 7, the S-N curves would be ordered in the long-life region as were the S-N curves for notched specimens with Kt = 4.0 [Figure 2 1 in Reference (l)].
Effect of Prior Stressed Exposure
Specimens of AM-350 CRT stainless steel and triplex-annealed Ti-8Al-lMo-1V alloy were statically subjected to the appropriate l-g mean stress while the specimens were at 550 F. The steel specimens were exposed at 40 ksi for 10,000 hours; the tita- nium specimens at 25 ksi for 8,000 hours. The specimens then were fatigue cracked, and crack-growth measurements were made. Table 8 is a summary of data obtained on exposed and unexposed specimens. Two cases are illustrated: (1) where the starter crack has grown to 0.250 inch and (2) where the crack has grown to 0. 625 inch. The summary for stainless steel shows that the rate of crack propagation is not affected by 10,000 hours of stressed exposure. This is consistent with observations made at 1000 hours’ exposure. The titanium specimens show some increase in propagation rate with exposure.
24

----7 Rat: and Total
Crack Length
0 34 cpm, 0.250 inch 1200-1725 cpm,0.250 inch
80 - A 34 cpm ,0.750 inch _ a 1200-1725 cpm,0.750 inch
0.5 I 1.5
Alternating Stress /l-g Mean Stress, 8
2 A-48105
FIGURE 10. EFFECTOFCYCLICRATEONCRACK-PROPAGATIONRATE IN 2-INCH-WIDE, LONGITUDINAL Ti-8Al- lMo- 1V ALLOY SHEET SPECIMENS AT ROOM TEMPERATURE
25
80 l- 0 550 F
Total crack length =0.750 inch /
/
0 0.5 1.0 I.5 2.0 Alternating Stress/l - g Mean Stress, 8 A -46106
FIGURE 11. EFFECT OF TEMPERATURE ON CRACK-PROPAGATION RATE IN 2-INCH-WIDE, LONGITUDINAL Ti-8Al- lMo- 1V ALLOY SHEET
Specimens at 1200-1725 cpm.
26
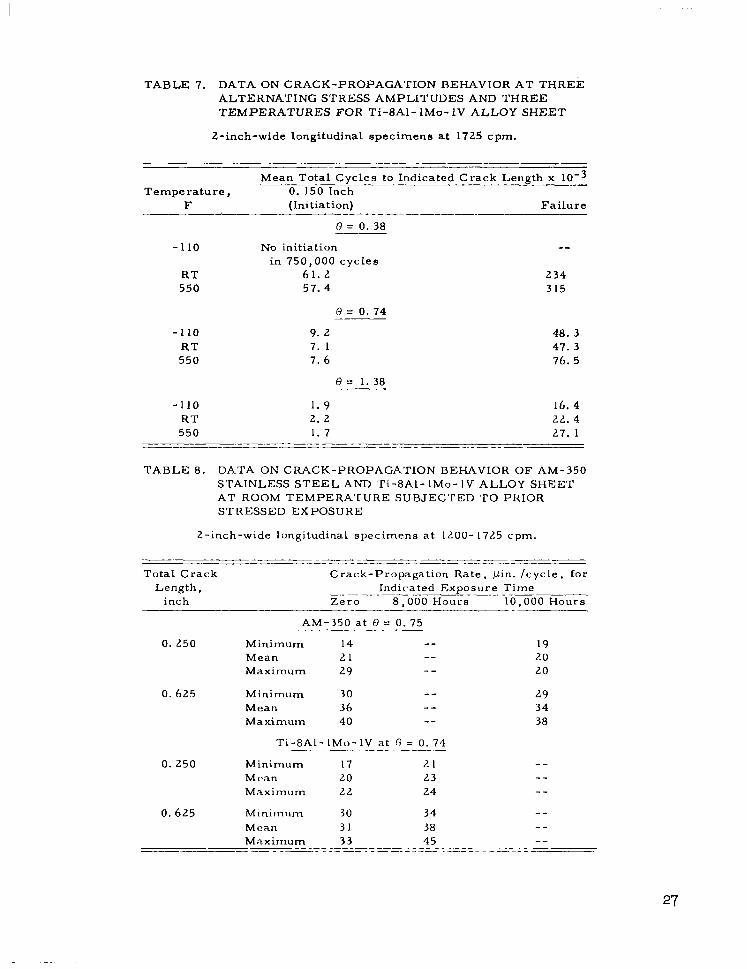
TABLE 7. DATA ON CRACK-PROPAGATION BEHAVIOR AT THREE ALTERNATING STRESS AMPLITUDES AND THREE TEMPERATURES FOR Ti-8Al- lMo- 1V ALLOY SHEET
Z-inch-wide longitudinal specimens at 1725 cpm.
--- Mean Total Cycles to Indicated Crack Length x 10m3 _-____
Temperature, 0. 150 Inch F (Initiation) Failure ----------__I_-.
8= 0.38 -- -110 No initiation --
in 750,000 cycles RT 61. 2 234 550 57.4 315
0 = 0.74
-110 9. 2 48. 3 RT 7. I 47. 3 550 7. 6 76. 5
8= 1.38
-110 1. 9 16. 4 RT 2. 2 22.4
550 1. 7 27. 1 --___ ___----.-_--__.-__-_
TABLE 8. DATA ON CRACK-PROPAGATION BEHAVIOR OF AM-350 STAINLESS STEEL AND Ti-8Al- lMo- IV ALLOY SHEET AT ROOM TEMPERA’TURE SUBJECTED TO PRIOR STRESSED EXPOSURE
Z-inch-wide longitudinal specimens at 1200- 1725 cpm.
Total Crack Length,
inch
-- .--___-I_-__-- __---___--____ -__ - Crack-Propagation Rate, pin. /cycle, for
Indicated Exposure Time Zero- 8,000 Hours 10,000 Hours
AM-350 at 0 = 0. 75
0. 250
0.625
0.250
o. 625
Minimum 14 -- 19 Mean 21 -- 20 Maximum 29 -- 20
Minimum 30 -- 29 Mean 36 -- 34 Maximum 40 -- 38
Ti-8hl- IMo- IV at 0 = 0. 74 _------- _--_ Minimum 17 21 -- Mean LO 23 -- Maximum 22 24 --
Minimum 30 34 -- Mean 31 38 -- Maximum 33 45 --
--- _ _____ _-_-- _ _-- ____ -- .----_----_--
27
Residual-Static-Strength Studies
Procedures and Equipment
To determine the residual static strength and its dependence on several variables, center-cracked sheet specimens, 2 inches wide by 8 inches long, were tested in tension. The specimen geometry was identical to that employed in fatigue crack-propagation experiments (see Figure 1), except for slight modifications in the grip section. To al- leviate difficulty with failures near the loading pin, stiffeners were spot welded-to the grip section of the specimen and 3/4-inch-diameter loading-pin holes were drilled.
In conducting the tension tests, a constant head speed of approximately 0. 02 inch/ minute was used. Low-temperature tests were conducted in a mixture of dry ice and alcohol with the specimen completely immersed. Tests at 550 F were conducted in a cylindrical furnace that completely enclosed the specimen. Test temperatures were measured by thermocouples in contact with the specimen near the center crack.
The variables investigated for their effect on the residual static strength of Ti-8Al-lMo-1V were crack length, test temperature, orientation with respect to the rolling direction, fatigue conditions employed to introduce the crack, and prior exposure to l-g stress at 550 F.
In addition, the effect at 10,000 hours’ exposure was examined for the AM-350 stainless steel. The residual-strength studies of unexposed steel and the steel after intermediate exposure are given in Reference 1.
Effect of Crack Length
Nominal crack lengths of 3116, 318, 314, and 1 inch were examined for their ef- fect on residual static strength. In Figure 12, residual strength at three test tempera- tures is shown as a function of crack length; Table 9 contains all the pertinent data.
The data presented in Figure 12 and Table 9 show that the residual strength (both net section and gross section) decreases with increasing crack length, with one excep- tion: specimens having crack lengths of 314 inch, when tested at 550 F, exhibited greater net-section strengths than those having crack lengths of 3116 or 318 inch. At room temperature and - 110 F, residual strength decreases continuously with increasing crack length.
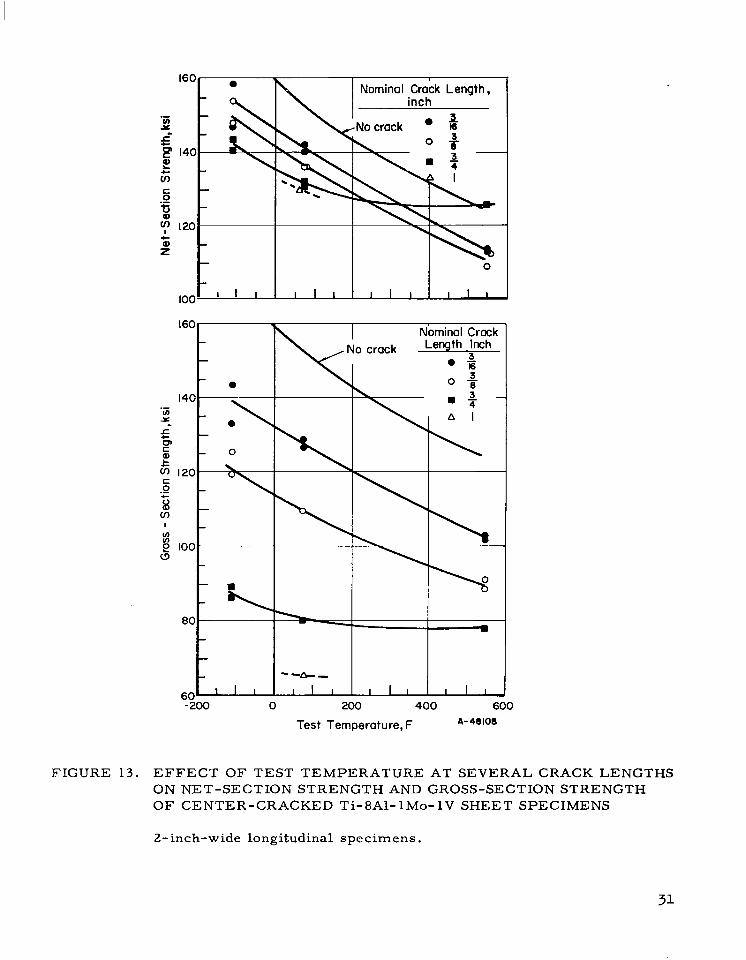
Effect of Test Temperature
Residual strength was determined at test temperatures of -110, 75, and 550 F. In Figure 13 residual strength is shown as a function of test temperature for various crack lengths. Included for comparison is a curve showing the variation of the ultimate tensile strength with temperature.
Examination of Figure 13 and Table 9 shows that the residual strength decreases continuously with increasing test temperature for all the crack lengths investigated. However, the decrease in strength between room temperature and 550 F of specimens containing 3/4-inch cracks is considerably less than that of specimens with smaller cracks.
28

160
GO- I I I I I
GROSS-SECTION STRENGT A -I IOF 0 75F 0 550F
I I I I I 1
0 0.2 0.4 0.6 0 .8 I .o A-474-46
Crack Length, inch FIGURE 12. EFFECT OF CRACK LENGTH, AT THREE TEST TEMPERATURES,
ON NET-SECTION STRENGTH AND GROSS-SECTION STRENGTH OF CENTER-CRACKED Ti-8Al-lMo-1V SHEET SPECIMENS
Longitudinal specimens, 2 inches wide.
29

TABLE 9. RESULTS OF TENSILE TESTS ON CENTER-CRACKED Ti-8Al-lMo-1V SHEET SPECIMENS FATIGUE CRACKED AT ROOM TEMPERATURE
2-inch-wide specimens 25-ksi mean stress, 18.5-ksi alternating stress amplitude (0 = 0.74) and 1725 cpm.
Specimen Orientation
Initial Test Crack
Temperature, Length, Tbickne s s , 6N(a), UGW, F inches inc he s ksi ksi
8325 L 75 0. 188 0. 042 139.9 126.9 6345 L 75 0. 186 0.047 142. 2 129. 0 6348 L 75 0.379 0.047 135.9 110. 1 8 169 L 75 0. 390 0. 042 136. 2 109.6 7338 L .75 0.754 0.0445 130.4 81. 2 8175 L 75 0. 767 0.0405 132. 2 81. 5 8328 L 75 0.959 0.0433 130. 1 65. 7 7337 L 75 0.997 0.044 130.0 65. 3
7329 L -110 0. 186 0.044 158. 6 143.8 7326 L -110 0. 186 0.045 147. 1 133.3 8176 L -110 0. 372 0.040 154.2 125.6 7349 L -110 0. 376 0. 0442 147.7 119. 9 6335 L -110 0. 763 0.0465 140.5 86. 9 8167 L -110 0. 752 0. 042 143. 6 89. 6
6351 L 550 0. 191 0.0465 113.0 102.3 8170 L 550 0. 188 0.0417 113. 6 102.9 7331 L 550 0.371 0.0435 112.6 91.5 6338 L 550 0.374 0.0465 109.3 88.8 7333 L 550 0. 752 0.0435 125.8 78. 5 6337 L 550 0. 752 0. 0465 125. 9 78. 5
8229 6206 6208 -8228 6209 8227 8225 7227
75 0.195 0. 0425 132. 3 119.4 75 0. 198 0. 048 130.1 117.2 75 0.373 0.0475 126. 2 102. 6 75 0.370 0. 0425 128. 5 104.7 75 0.753 0.0475 121.6 75. 8 75 0. 752 0.0415 123. 1 76.8 75 1.000 0. 042 121.5 60. 7 75 1.001 0.043 123.8 61. 9
(a) Net-section saength: o N = maximum load thickness x (width - crack length) *
(b) Gross-section saength: oG = maximum load thickness x width *
30
linal Crakk Length,
ti \ .!,,.,,k inc: Q
160 Nominal Crack
0 140
‘5 x \ - 0 f : - 0
6 120 \
5 ‘Z id cn I % g IOO-
W
60 ’ ’ I -200 0 200 400 600
Test Temperature, F A-48108
FIGURE 13. EFFECT OF TEST TEMPERATURE AT SEVERAL CRACK LENGTHS ON NET-SECTION STRENGTH AND GROSS-SECTION STRENGTH OF CENTER-CRACKED Ti-8Al-lMo-1V SHEET SPECIMENS
2-inch-wide longitudinal specimens.
31

11111 I I I II I II II II II I 111111111111 lllllllI II I llllI I I llllll I11111111111111 I II II I I I I II I II I I lIlllllllll llllll “1111111111111,
Effect of Orientation With Respect to the Rolling Direction
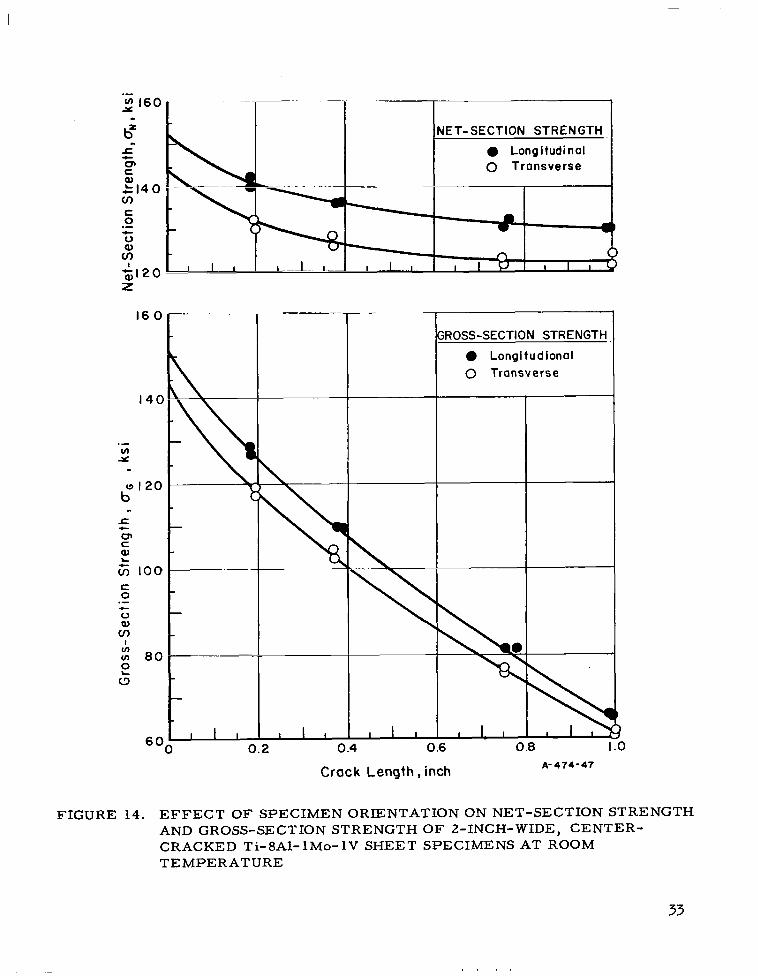
Specimens containing nominal 3/16-, 3/8-, 3/4-, and l-inch cracks were tested at room temperature, both parallel and perpendicular to the rolling direction, to deter- mine the effect of specimen orientation on residual strength. The results are shown in Figure 14 and Table 9. At all crack lengths investigated, transverse specimens (i. e. , those with the specimen axis perpendicular to the rolling direction) exhibited a lower residual strength than did longitudinal specimens. The difference in the strength levels between the two specimen orientations is about the same to crack lengths up to a/u = 0. 500.
Effect of Fatigue Conditions Used to Introduce Cracks
To determine whether or not the residual strength of fatigue-cracked Ti-8Al-lMo- 1V is influenced by the manner in which the crack is introduced, experiments were per-
formed in which the fatigue-stress amplitude, fatigue temperature, and cycling speed were varied.
Effect of Fatigue-Stress Amplitude. Four different stress amplitudes were em- ployed to introduce fatigue cracks in Ti-8Al-lMo-1V. These were 9.5-, 18.5-, 34.5- and 43.5-ksi (0 values of 0. 38, 0. 74, 1. 38, and 1. 74, respectively), all superposed upon a mean stress of 25 ksi. In Section C of Table 10, the net-section and gross- section strengths are given for several values of stress amplitudes (and 0) at several crack lengths and for both longitudinal and transverse specimen orientations. It is ap- parent that fatigue-stress amplitude, in the range studied, has virtually no effect on residual strength.
Effect of Fatigue-Cracking Temperature. Fatigue cracks 3/4-inch long were introduced at temperatures of -110, 75, and 550 F, prior to determination of residual strength at room temperature. An examination of Section A of Table 10 shows that there is no appreciable effect of fatigue-cracking temperature on the residual strength of the 8Al- lMo- 1V titanium alloy.
Effect of Cyclic Frequency. Two different cyclic frequencies, 1725 and 34 cycles per minute, were used to introduce 3/4-inch fatigue cracks in Ti-8Al-lMo-1V sheet specimens. As shown in Section B of Table 10, no effect of cyclic speed upon residual strength was observed.
Effect of Exposure to l-g Stress at 550 F
Center-notched Ti-8Al-lMo-1V sheet specimens were exposed in air to a l-g (25. 0 ksi) net-section stress at 550 F for 8000 hours prior to introducing fatigue cracks. Center-cracked specimens then were tested at -110, 75, and 550 F, with the results shown in Table 11 and Figure 15. The results indicate that an 8000-hour expo- sure weakens the titanium alloy slightly if long cracks are present (314 inch in a 2-inch- wide specimen). The data are somewhat inconsistent in this regard, with reference to
32
16 0
I I
GROSS-SECTION STRENGTH
0 Longitudional 0 Transverse
0.4 0.6 0.8 1.0
Crack Length, inch A-474-47
FIGURE 14. EFFECT OF SPECIMEN ORIENTATION ON NET-SECTION STRENGTH AND GROSS-SECTION STRENGTH OF 2-INCH-WIDE, CENTER- CRACKED Ti-8Al-lMo-1V SHEET SPECIMENS AT ROOM TEMPERATURE
33
.

TABLE 10. RESULTS OF ROOM-TEMPERATURE TENSILE TESTS ON S-INCH WIDE, CENTER-CRACKED, Ti-EAI- IMo- 1V SHEET SPECIMENS, FATIGUE-CRACKED AT VARIOUS TEMPERATURES, CYCLIC FRECJJENCIES, AND ALTERNATING STRESS AMPLITUDES
-~ .~~ Crack Fatigue-Cracking Conditions
Length, Thickness, Temperature, Frequency, omeam UaIP ’ oNta)# u G(b), Specimen Orientation inches inch F cpm ksi ksi 0 ksi ksi
Section A. Effect of Fatigue Temperature
0.041 -110 1725 25 0.0405 -110 1725 25 0.046 -110 1725 25
0.0445 75 1725 25 0.0405 75 1725 25
0.044 550 1725 25 0.047 550 1725 25
Section 9. Effect of Cyclic Frequency
0.0445 75 34 25 0.0415 75 34 25
0.0445 75 1725 25 0.0405 75 1725 25
Section C. Effect of Alternating Sness Amplitude
0.0445 75 34 25 0.0415 75 34 25
0.042 75 34 25 0.044 75 34 25
0.046 75 1725 25 0.042 75 1725 25
0.0433 75 1725 25 0.044 75 1725 25
0.044 75 1200 25 0.042 75 1200 25
0.0435 75 1725 25 0.042 75 1725 25
0.042 75 1725 25 0.043 75 1725 25
0.048 75 1725 25 0.044 75 1725 25
8162 8174 6354
7338 8175
7336 6344
7343 8163
7338 8175
7343 8163
8168 7347
6353 8332
8328 7337
7332 8330
7225 8230
8225 7227
6207 7353
0.766 0.768 0.752
0.754 0.767
0.748 0.749
0.750 0.752
0.754 0.767
0.750 0.752
0.779 0.755
1.000 1.000
0.989 0.997
1. OOQ 0.999
0.999 0.998
1.000 1.001
1.008 0.997
L L L
L L
L L
L L
L L
L L
L L
L L
L L
L L
T T
T T
T T
18.5 0.74 131.3 81.0 18.5 0.74 134.0 82.6 18.5 0.74 130.3 81.2
18.5 0.74 130.4 81.2 18.5 0.14 132.2 81.5
18.5 0.74 131.9 82.4 18.5 0.74 131.2 82.2
18.5 0.74 130.6 81.5 18.5 0.74 130.6 81.4
18.5 0.74 130.4 81.2 18.5 0.74 132.2 81.5
18.5 0.14 130.6 81.5 18.5 0.74 130.6 81.4
34.5 1.38 132.9 81.0 34.5 1.38 130.7 81.3
9.5 0.38 127.1 63.5 9.5 6.38 129.8 64.9
18.5 0.14 130.1 65.7 18.5 0.74 130.0 65.3
43.5 1.74 127.8 63.7 43.5 1.74 128.9 ‘54.6
9.5 0.38 122.4 61.2 9.5 0.38 122.2 61.2
18.5 0.74 121.5 60.7 18.5 0.74 123.8 61.9
34.5 1.38 119.0 59.0 34.5 1.38 124.0 62.3
(a) Net-section saength; o N = maximum load thickness x (width - crack length) *
(b) Gross-section strength; o-G maximum load
thickness x width .
34
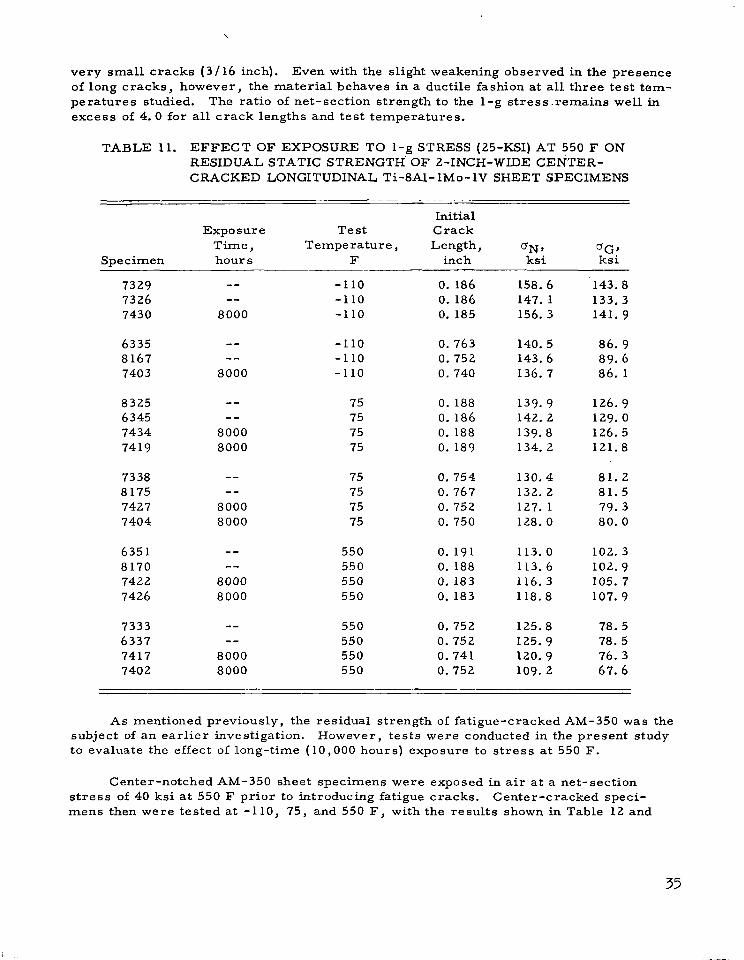
very small cracks (3/16 inch). Even with the slight weakening observed in the presence of long cracks, however, the material behaves in a ductile fashion at all three test tem- pe rature s studied. The ratio of net-section strength to the l-g stress.remains well in excess of 4.0 for all crack lengths and test temperatures.
TABLE 11. EFFECT OF EXPOSURE TO l-g STRESS (25-KSI) AT 550 F ON RESIDUAL STATIC STRENGTH OF Z-INCH-WIDE CENTER- CRACKED LONGITUDINAL Ti-8Al- lMo- 1V SHEET SPECIMENS
Specimen
Exposure Time, hours
Initial Test Crack
Temperature, Length, ON9 “G, F inch ksi ksi
7329 7326 7430
6335 8167 7403
8325 m m 75 0.188 139.9 126.9 6345 -- 75 0.186 142. 2 129.0 7434 8000 75 0.188 139.8 126.5 7419 8000 75 0. 189 134.2 121.8
7338 -- 75 0. 754 130.4 81.2 8175 B e 75 0. 767 132. 2 81. 5 7427 8000 75 0. 752 127. 1 79. 3 7404 8000 75 0.750 128. 0 80.0
6351 -- 550 0.191 113.0 102.3 8170 me 550 0. 188 113.6 102.9 7422 8000 550 0. 183 116. 3 105.7 7426 8000 550 0. 183 118.8 107.9
7333 -- 550 0. 752 125.8 78. 5 6337 -- 550 0. 752 125. 9 78. 5 7417 8000 550 0.741 120.9 76. 3 7402 8000 550 0. 752 109.2 67. 6
-a 8000
-- 8000
0. 186 0. 186 0.185
- --
As mentioned previously, the residual strength of fatigue-cracked AM-350 was the subject of an earlier investigation. However, tests were conducted in the present study to evaluate the effect of long-time (10,000 hours) exposure to stress at 550 F.
Center-notched AM-350 sheet specimens were exposed in air at a net-section stress of 40 ksi at 550 F prior to introducing fatigue cracks. Center-cracked speci- mens then were tested at -110, 75, and 550 F, with the results shown in Table 12 and
-110 0. 763 140.5 86. 9 -110 0. 752 143.6 89. 6 -110 0.740 136. 7 86. 1
158.6 143.8 147.1 133.3 156. 3 141.9
35

180fP
.- L “k 160C z 1401‘
A h!) C
3
I- loo-
0 0
==s I 1 I
, 0 I I j- I I I I I I
0.6 0.8
Crack Length, inch A- 48109
Ternperatur; Unexposed 80~x~~~u~e
-110 F A A 75 F 0 0 550 F n El
=?-LA
cl
FIGURE 15. EFFECT OF 8000-HOUR EXPOSURE TO 1-G STRESS OF 25-KS1 AT 550 F ON NET-SECTION STRENGTH OF 2-INCH-WIDE CENTER- CRACKED LONGITUDINAL Ti-BAl- lMo- 1V SHEET SPECIMENS
36

260-p
I\ I
-110 F
240
--- 0 Unexposed x IOOO-twr exposure 0 lO,CXlO-hour exposure
240. I I I
Room Temperature ’ 0 Unexposed X IOOO- hour exposure 0 lO,OOO- hour exposure
x 1000 -hour exposure 0 10,000 - hour exposure
,,,t.L, I I I I I I I I I I I 1 I I I I J 0 0.2 0.4 0.6 0.6 1.0
Crock Length, inch A-48111
FIGURE 16. EFFECT OF 10, OOO-HOUR EXPOSURE TO 1-G STRESS OF 40-KS1 AT 550 F ON NET-SECTION STRENGTH OF 2-INCH-WIDE CENTER- CRACKED LONGITUDINAL AM-350 SHEET SPECIMENS
37

TABLE 12. EFFECT OF EXPOSURE TO 1-G STRESS OF 40-KS1 AT 550 F ON RESIDUAL STATIC-STRENGTH OF 2-INCH-WIDE, FENTER- CRACKED, LONGITUDINAL AM-350 SHEET SPECIMENS
~. ---- . ..- ._ ..-_ --? -_ --.--.-_. . ~_
634 832
6320
-- 1,000
10,000
-110 -110 -110
0. 183 0. 190 0. 182
I:; 222.3
UGJ ksi ~~
(4 (4
202.0
6311 -- -110 0.375 215.4 175.0 73 17 1,000 -110 0.374 218. 9 177.9
6316 -- -110 0. 752 209. 0 130.4 8317 1,000 -110 0. 749 212.8 133. 1
838 10,000 -110 0. 753 209.5 131.0
6310 -- 834 1,000 831 1,000
7314 10,000 631 10,000
75 75 75 75 75
0. 188 0. 188 0. 186 0. 178 0. 191
217. 5 197. 1 (4 (4
218. 4 198. 0
I:; I:;
6313 -- 75 0.375 216.0 175.5 8320 1,000 75 0.375 220.8 179.4 8318 10,000 75 0. 376 218. 5 177.5
6317 -- 75 0.751 214. 1 133.7 8311 1,000 75 0.747 214.4 134.3 6314 10,000 75 0. 739 213. 7 134.8
731 10,000 75 0. 750 215. 5 134.8
638 -- 550 0. 181 8316 1,000 550 0. 189 6318 10,000 550 0.201
635 10,000 550 0. 180
6312 -- 550 0.373 174.7 142. 2 835 1,000 550 0.375 168.9 137.3
8315 10,000 550 il. 376 183. 4 149.0 7312 10,000 550 0. 412 >179. 8ta) >142. 7(a)
8319 -- 550 0. 753 168.2 104. 9 8313 1,000 550 0. 758 159.5 99. 0 6319 10,000 550 0. 746 203. 0 127. 4
739 10,000 550 0.744 198. 3 124.4
Specimen
Exposure Test Time, Temperature, hours F
Initial Crack
Length, inches
aN, ksi .-
(a) Specimen failed in grips.
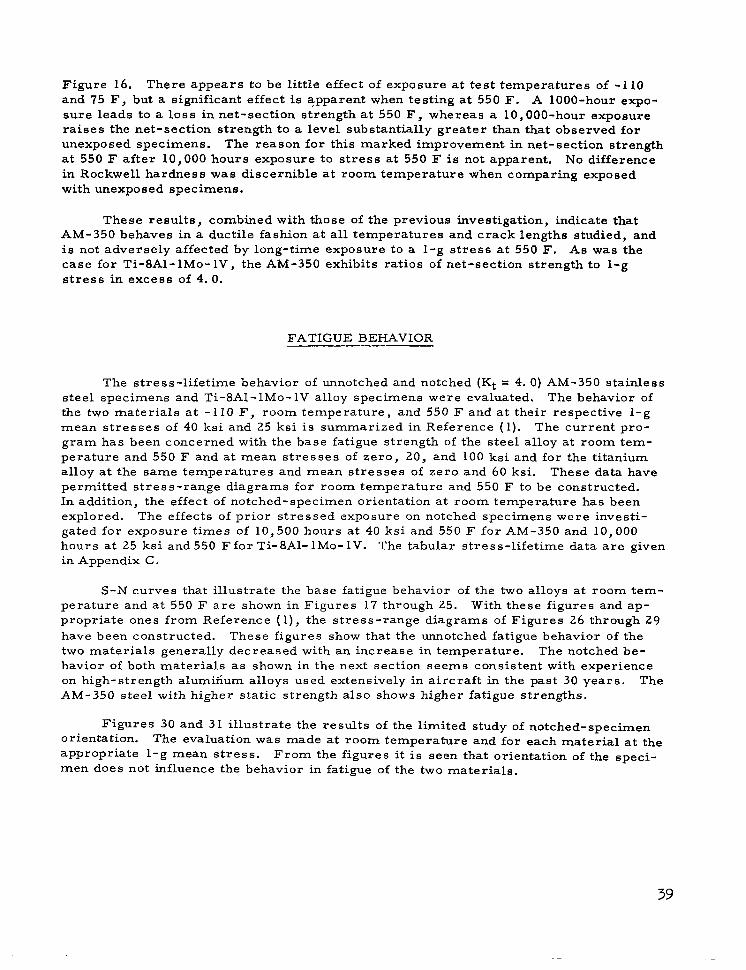
Figure 16. There appears to be little effect of exposure at test temperatures of -110 and 75 F, but a significant effect is apparent when testing at 550 F. A lOOO-hour expo- sure leads to a loss in net-section strength at 550 F, whereas a lO,OOO-hour exposure raises the net-section strength to a level substantially greater than that observed for unexposed specimens. The reason for this marked improvement in net-section strength at 550 F after 10,000 hours exposure to stress at 550 F is not apparent. No difference in Rockwell hardness was discernible at room temperature when comparing exposed with unexposed specimens.
These results, combined with those of the previous investigation, indicate that AM-350 behaves in a ductile fashion at all temperatures and crack lengths studied, and is not adversely affected by long-time exposure to a l-g stress at 550 F. As was the case for Ti-8Al-lMo-lV, the AM-350 exhibits ratios of net-section strength to l-g stress in excess of 4.0.
FATIGUE BEHAVIOR --
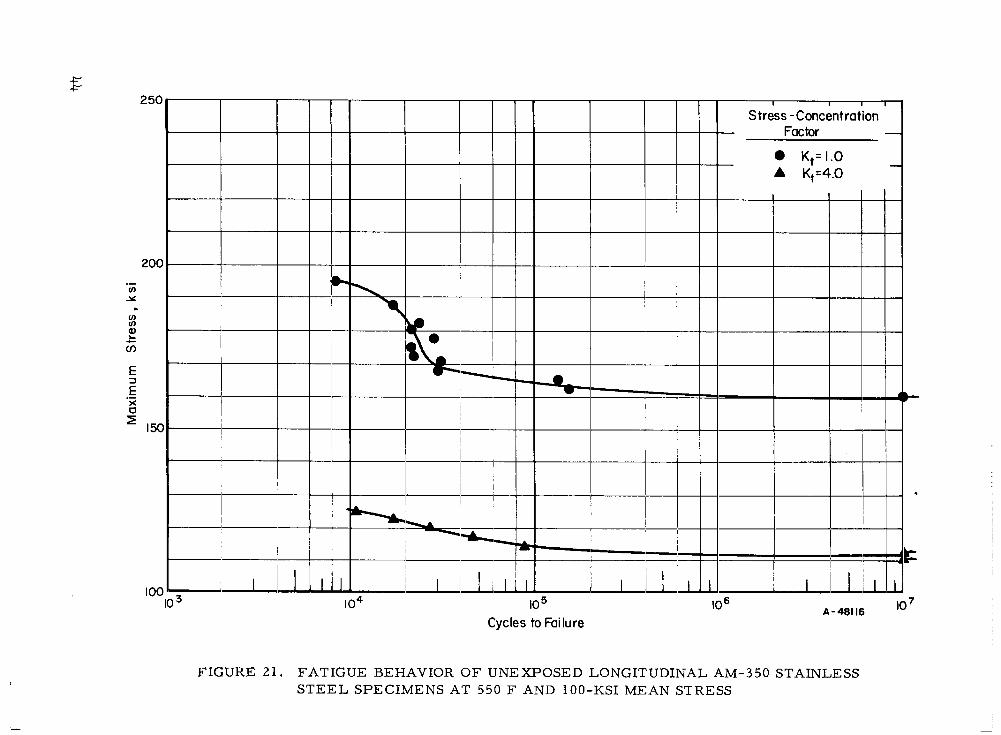
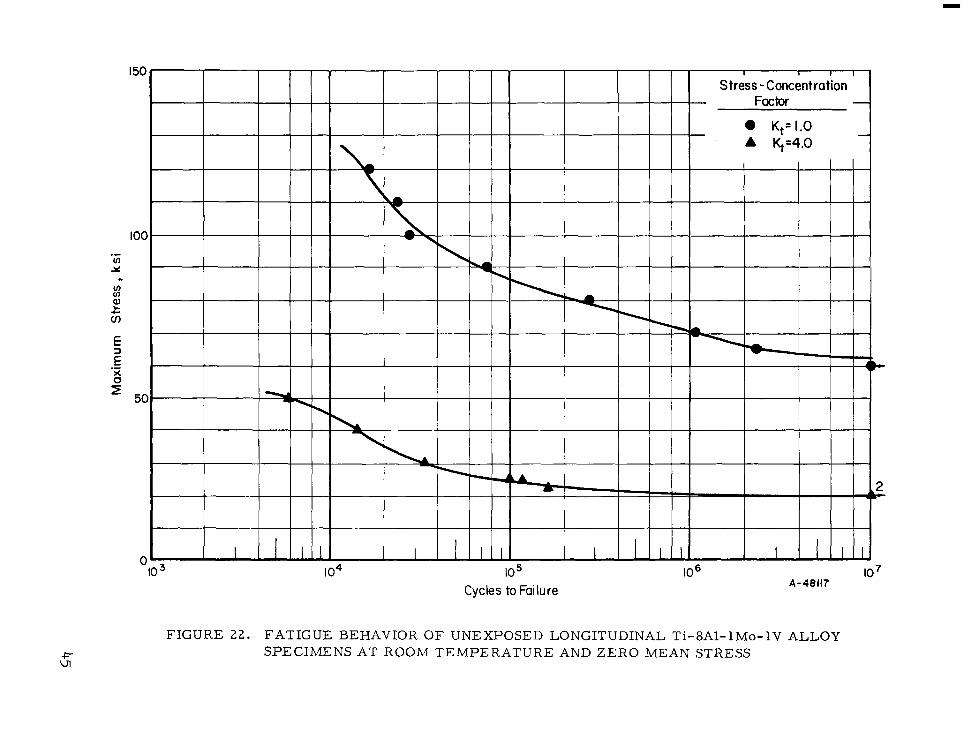
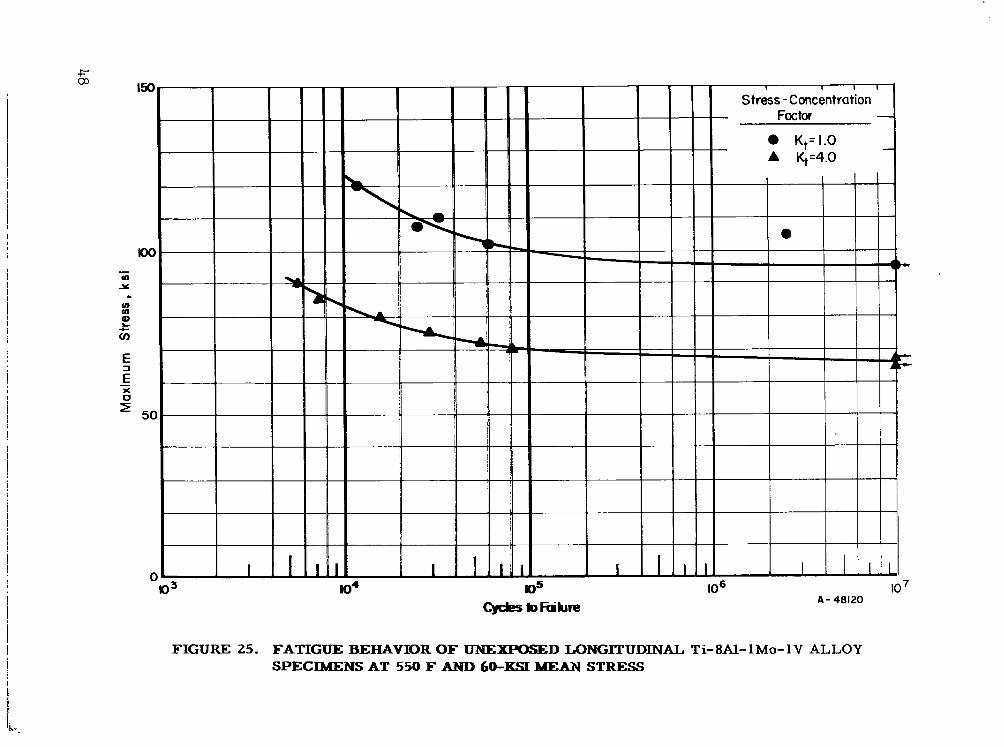
The stress-lifetime behavior of unnotched and notched (Kt = 4. 0) AM-350 stainless steel specimens and Ti-8Al- lMo- 1V alloy specimens were evaluated. The behavior of the two materials at - 110 F, room temperature, and 550 F and at their respective l-g mean stresses of 40 ksi and 25 ksi is summarized in Reference (1). The current pro- gram has been concerned with the base fatigue strength of the steel alloy at room tem- perature and 550 F and at mean stresses of zero, 20, and 100 ksi and for the titanium alloy at the same temperatures and mean stresses of zero and 60 ksi. These data have permitted stress-range diagrams for room temperature and 550 F to be constructed. In addition, the effect of notched-specimen orientation at room temperature has been explored. The effects of prior stressed exposure on notched specimens were investi- gated for exposure times of 10,500 hours at 40 ksi and 550 F for AM-350 and 10,000 hours at 25 ksi and 550 Ffor Ti-8Al-lMo-1V. The tabular stress-lifetime data are given in Appendix C.
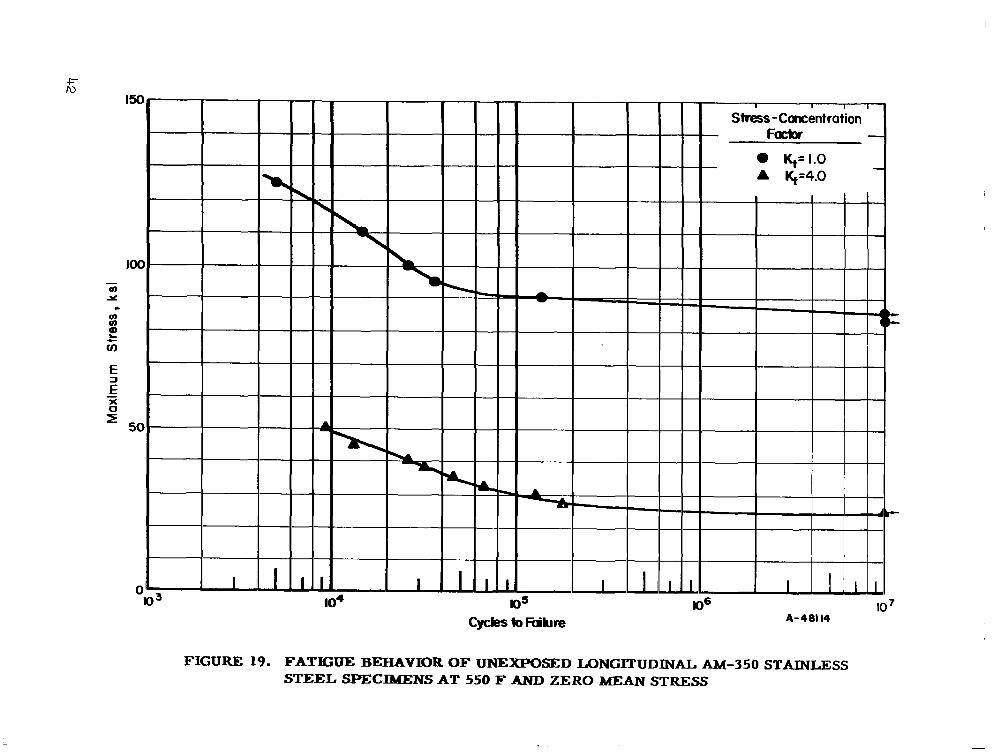
S-N curves that illustrate the base fatigue behavior of the two alloys at room tem- perature and at 550 F are shown in Figures 17 through 25. With these figures and ap- propriate ones from Reference (l), the stress-range diagrams of Figures 26 through 29 have been constructed. These figures show that the unnotched fatigue behavior of the two materials generally decreased with an increase in temperature. The notched be- havior of both materials as shown in the next section seems consistent with experience on high-strength alum&urn alloys used extensively in aircraft in the past 30 years. The AM-350 steel with higher static strength also shows higher fatigue strengths.
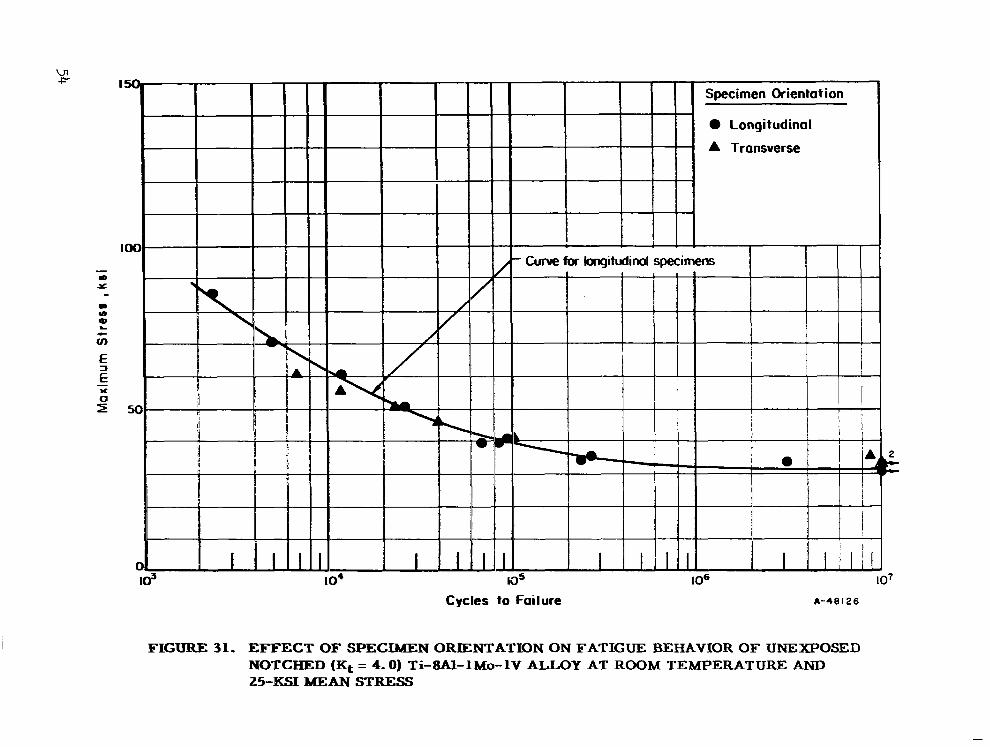
Figures 30 and 31 illustrate the results of the limited study of notched-specimen orientation. The evaluation was made at room temperature and for each material at the appropriate l-g mean stress. From the figures it is seen that orientation of the speci- men does not influence the behavior in fatigue of the two materials.
39

I
* 1 , I I I I I
Stress- Concentration Factor
0 K+=I.O A Kt=4.0 c
IO3 IO4 IO5 IO6
Cycles to Failure A-481 12
FIGURE 17. FATIGUE BEHAVIOR 01- UNEXPOSED LONGITUDINAL AM-350 STAINLESS STEEL SPECIMENS AT ROOM TEMPERATURE AND ZERO MEAN STRESS

100 IO3 IO4 IO5 IO6
Cycles to Failure
FIGURE 18. FATIGUE BEHAVIOR OF UNEXPOSED LONGITUDINAL AM-350 STAINLESS STEEL SPECIMENS AT ROOM TEMPERATURE AND loo-KS1 MEAN STRESS
4
-
-
-
-
I I I ,l
cycksbFbihlr6 A-481 14
FIGURE 19. FATIGUE BEHAVIOR OF UNEXPOSED LONGITUDINAL AM-350 STAINLESS STEEL SF?EXlMENS AT 550 F AND ZERO MEAN STRESS

-
Stress -Concentration
0 I I I I I I I, IO3 IO4 IO5 IO6 A-45115 IO7
Cycles to Failure
FIGURE 20. FATIGUE BEHAVIOR OF UNEXPOSED LONGITUDINAL AM-350 STAINLESS STEEL SPECIMENS AT 550 F AND 20-KS1 MEAN STRESS
E 250
I I I I I
Stress -Concentration
3 II I I
IO5 Cycles to Failure
IO6 A-48116 IO7
FIGURE 21. FATIGUE BEHAVIOR OF UNEXPOSED LONGITUDINAL AM-350 STAINLESS STEEL SPECIMENS AT 550 F AND loo-KS1 MEAN STRESS
-
l50- , 1 I 1 Stress-Concentration
FaCtor
- 0 K+= 1.0 A Kt=4.0
100 - .- U-J x
. t: E u,
E z
‘Z
IO5 Cycles to Failure
IO6 IO7 A-48117
FIGURE 22. FATIGUE BEHAVIOR OF UNEXPOSED LONGITUDINAL Ti-8Al- lMo- 1V ALLOY SPECIMENS AT ROOM TEMPERATURE AND ZERO MEAN STRESS

JJAJI~ --y--~~~Efgf#
me IO6 IO7
Cycles lo Fai lure A- 48118
l-m ~~ _ Strtiss -Con&ntration ’ I . --.-.
0 K.=l.O I
FIGURE 23. FATIGUE BEHAVIOR OF UNEXPOSED LONGITUDINAL Ti-8Al-lMo-1V ALLOY SPECIMENS AT ROOM TEMPERATURE AND 60-JSSI MEAN STRESS

-- -- I l -- -- --_ ---
100 100 - - -- -- -- -- --_ --- .- .- m m
Y Y . . , ,
8 8 s s
-__ -__ -- --_ I I
cn cn -- -- I I
E E z z 1 1 ---- ----
i- i- d) d)
‘Z ‘Z -- --
0 0 = = 50
! a-- 50 l , -
I
IO5 IO5 Cycles to Fai iu re Cycles to Fai iu re
IO6 IO6 IO7 IO7 A-48119 A-48119
FIGURE 24. FATIGUE BEHAVIOR OF UNEXPOSED LONGITUDINAL Ti-8Al-lMo-IV ALLOY SPECIMENS AT 550 F AND ZERO MEAN STRESS
lo3 lo= IO6 IO7 CycksbO~re A-48120
FIGURE 25. FATIGUE BEHAVIOR OF UNE XPOSED LONGITUDINAL Ti-8Al- lMo- 1V ALLOY SPECIMENS AT 550 F AND 60-KSC MEAN STRESS

.- 2 .
0 K, =I.0 I
0 K+=4.0 UTS =233 ksi
0 40 80 120 160 200 240 Mean Stress, ksi A-48121
FIGURE 26. STRESS-RANGE DIAGRAM FOR AM-350 STAINLESS STEEL AT ROOM TEMPERATURE
49

160 I
. Kt=l.O
0 Kt =4.0
UTS = 201 ksi
IO-and IO’ -
I I I I I I I I 40 80 120 160 200
Mean Stress , ksi A-48122
FIGURE 27. STRESS-RANGE DIAGRAM FOR AM-350 STAINLESS STEEL AT 550 F

& IO6 and lo’--
”
”
I I I I I I I I 25 50 75 loo 125 I50
Mean Stress, ksi A-40123
I
. Kt=l.O
0 Kt =4.0
UTS =I52 ksi
FIGURE 28. STRESS-RANGE DIAGRAM FOR Ti-8Al- lMo- 1V ALLdY AT ROOM TEMPERATURE
51

--5 L 1 106andm 011 I 11 I I 111 J 11.1 I
. Kt= 1.0
0 Kt=4.0
UTS = 125 ksi
0 25 50 75 100 125
Mean Stress, ksi A-48124
FIGURE 29. STRESS-RANGE DIAGRAM FOR Ti-8Al-lMo-1V ALLOY AT 550 F
52

r
150
Specimen Orientation
0 Longitudinal
A Transverse
- Curve for longitudinal specimens
IO5
Cycles to Failure
IO’
A- 48125
FIGURE 30. EFFECT OF SPECIMEN ORIENTATION ON FATIGUE BEHAVIOR OF UNEXPOSED NOTCHED (Kt = 4.0) AM-350 STAINLESS STEEL AT ROOM TEMPERATURE AND 40-KS1 MEAN STRESS
Specimen Orientation
0 Longitudinal
A Transverse
IO3 IO’ IO5 IO6 IO7
Cycles to Failure A-48126
FIGURE 31. EFFECT OF SPECIMEN ORIENTATION ON FATIGUE BEHAVIOR OF UNEXPOSED NOTCHED (Kt = 4.0) Ti-8A.bIMo-1V ALLOY AT ROOM TEMPERATURE AND 25-KS1 MEAN STRESS

0, I I IO= IO4 IO3
Cycles to Failure
IO6 A-48127
IO7
FIGURE 32. EFFECT OF STRESSED EXPOSURE ON FATIGUE BEHAVIOR OF NOTCHED (Kt = 4.0) AM-350 STAINLESS STEEL AT -110 F AND 40-K% MEAN STRESS

Exposure Duration. hours
T
50
0
IO3 IO4 I
IO5 IO6 I
I( I7 Cycles to Failure A-48128
FIGURE 33. EFFECT OF STRESSED EXPOSURE ON FATIGUE BEHAVIOR OF NOTCHED (Kt = 4.0) AM-350 STAINLESS STEEL AT 550 F AND 40-KS1 MEAN STRESS
0 Longitudinal, zero 0 Longitudinal, zero
A Transverse, 3000 hours’ A Transverse, 3000 hours’
100, 100
50
I IO5
Cycles to Failure IO6
A-48129
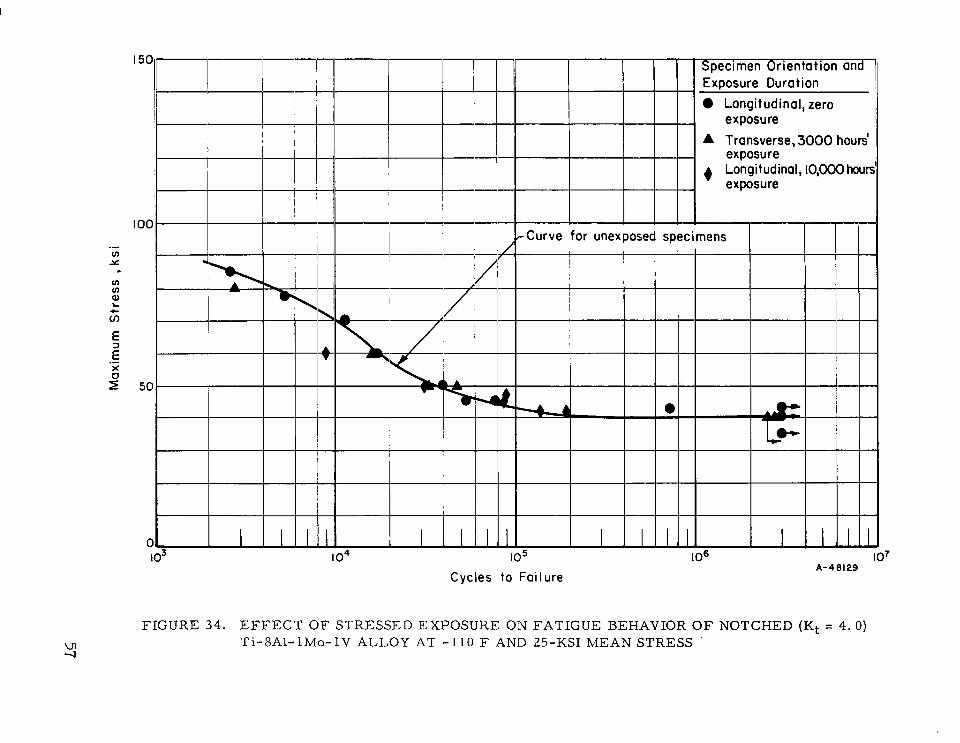
FIGURE 34. EFFECT OF STRESSED EXPOSURE ON FATIGUE BEHAVIOR OF NOTCHED (Kt = 4.0) Ti-8Al-lMo-IV ALLOY AT -110 F AND 25-KS1 MEAN STRESS

wl 03
Exposure Duration 0 Longitudinal unexposed
Tmnsverse, 3000 houd
I I Ilk Curve for unexposed specimens
Cycles to Failure A-48130
FIGURE 35. EFFECT OF STRESSED EXPOSU RE ON FATIGUE BEHAVIOR OF NOTCHED (Kt = 4.0) Ti-8Al-lMo-1V ALLOY AT 550 F AND 25-KSI MEAN STRESS

The manner in which prior stressed exposure affected the fatigue strength of the two alloys in question is shown by the data plotted on Figures 32 through 35. Figures 32 and 33 illustrate all of the data obtained on AM-350 CRT alloy. Involved are exposure times of 0 hours, 1000 and 3000 hours from Reference (l), and 10,500 hours. From the two figures it is seen that there is no influence of prior stressed exposure, to lifetimes of 10,500 hours, on fatigue strength.
Figures 34 and 35 show for the titanium alloy that prior stressed exposure also does not influence fatigue strength for lifetimes up to 10,000 hours.
Since the exposure temperature is higher than the expected service temperatures for skin surfaces other than leading edges, it would appear that metallurgical instability is not a problem for the two alloys, at least up to about 10,000 hours.
DISCUSSION AND CONCLUDING REMARKS
This program has been concerned with a study of the fatigue behavior of two mate- rials under consideration as skin materials for the supersonic transport: AM-350 CRT and triplex-annealed Ti-8Al- lMo- 1V alloy. The intended operating environment of this aircraft raises questions, concerned with structural material behavior, not encoun- tered in the past in relation to subsonic flight. One of these is concerned with the prob- lem of moderate-temperature exposure. The problem is that of metallurgical instability of the two materials for the operating life of 30,000 to 40,000 hours. Another is also stimulated by temperature. This relates to the fact that operating conditions include subzero temperatures in addition to the moderate-temperature regime.
It is for this reason that this program (consisting of 2 year’s research) has in- cluded examination of the effect of temperature on fatigue behavior over the range from - 110 F to 550 F. This range is somewhat broader than the expected service tempera- ture range.
A number of aspects are of interest in relation to fatigue of the skin and structural materials. In this program three were considered: (1) crack propagation, (2) remain- ing static strength, and (3) the base fatigue behavior. All of the testing was carried out on small laboratory specimens, so that the data in certain cases are indicative of what may be expected of the materials; however, J ‘udgment has to be exercised in translating the information to large scale structure.
In this concluding section, information obtained during the past 2 years is reviewed briefly and discussed in terms of prior experience. Conclusions are drawn when war- ranted in each subsection.
Crack Propagation
The factors that were considered important to examine in regard to its effect on crack propagation were as follows:
59
(1) Alternating stress amplitude
(2) Crack length
(3) Specimen orientation
(4) Stress-cycle rate
(5) Temperature
(6) Prior stressed exposure.
Mean stress also is a variable that is known to affect crack propagation. In this program, however, one mean stress was used for each material.
From the experimental program, the following conclusions appear warranted in regard to crack propagation:
(1) The alternating stress component and the crack length strongly influenced the rate of crack propagation. Where direct comparison was possible, the rate of crack propagation of the stainless steel frequently was slightly higher than that of the titanium alloy at the same relative alternating stress level (e) and crack length.
(2) Specimen orientation with rolling direction was a slight influence on crack propagation. For the titanium alloy, longitudinal specimens had higher propagation rates than did transverse specimens.
(3) Cyclic rate had an effect on the crack-propagation behavior of the tita- nium alloy. Crack-propagation rate increased with decreasing cyclic rate. This effect was more noticeable at high alternating stress and with long cracks. It was not clear whether there was a frequency effect for the stainless steel.
(4) Temperature at which the fatigue crack is propagated was found to be im- portant. For the titanium alloy, crack-growth rates increased with de- creasing temperature. However, for the steel alloy, crack-growth rates decreased with decreasing temperature.
(5) Exposure to steady stress and to a temperature of 550 F for 10,000 hours prior to crack propagation did not influence the rate of crack propagation of AM-350 alloy. Exposure time of 8,000 hours for the titanium alloy re- sulted in a slight increase in crack propagation rate.
Residual Static Strength
Once again there were many factors considered important that might influence the residual strength of these materials. Included in this program were the following:
(1) Crack length
(2) Specimen orientation with rolling direction
60
(3) Temperature
(4) Prior exposure
(5) Fatigue conditions to introduce the crack.
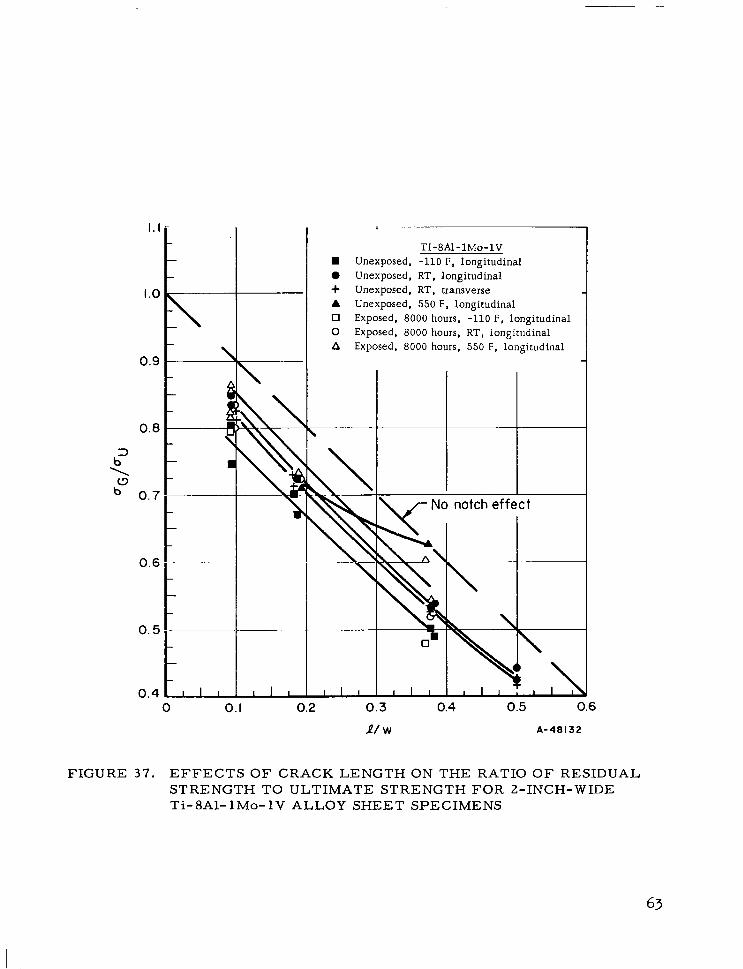
Since most of the data for AM-350 alloy were presented in Reference (l), Fig- ures 36 and 37 contain a summary of all pertinent data. Note that in these figures resid- ual static strength is expressed as a ratio of the gross-area stress to the ultimate strength of the material.
A number of conclusions can be stated based upon the program results:
(1)
(4
(3)
(4)
For both materials, the residual static strength was strongly affected by crack length at all temperatures. The fact that all specimens failed at net stress values at or above the yield strength indicates that both materials were relatively tough. AM-350 steel was slightly stronger than the titanium alloy at room temperature.
Specimen orientation with rolling direction had an influence on residual static strength. Transverse specimens of AM-350 alloy had much lower strength than did longitudinal specimens Ti-8Al- lMo- 1V alloy exhibited essentially no effect of orientation on residual strength based upon a~/b~ as shown in Figure 37. However, since a, in the transverse di- rection was less than that in the longitudinal direction, there was actually a small reduction in static strength of transverse specimens compared with longitudinal specimens.
Temperature of test also had an important influence on remaining strength. For AM-350 either the high or the low temperature reduced strength, whereas, with the titanium alloy only the low temperature reduced strength.
Prior exposure at 550 F to a static stress of 40 ksi for 10,000 hours for the steel and of 25 ksi for 8,000 hours for the titanium alloy did not pro- duce a large change in residual strength, in general, for either material. The results for AM-350 alloy were not consistent, suggesting no certain effect of exposure. Those for titanium showed a slight reduction in resid- ual strength after exposure.
Among the factors that were examined concerned with fatigue conditions used in growing cracks prior to residual strength testing were stress amplitude, fatigue crack- ing temperature, and cyclic frequency. The results indicate the following conclusions:
(5) Stress amplitude, fatigue cracking temperature, and cyclic frequency - all related to fatigue conditions to form the crack - did not influence the residual strength of either material.
Fatigue Behavior
The fatigue strength of the two materials has been evaluated primarily at room temperature and at 550 F. Some study was made at - 110 F. Notched and unnotched
61

I.1
0.9
0.8 b= \ bc3
0.7
0.6
8 0 + A cl 0 A
5 B(
AhI- Unexposed, -110 F, longitudinal Unexposed, RT, longitudinal Unexposed, RT, transverse Unexposed, 550 F, longitudinal Exposed, 1000 hours, -110 F, longitudi Exposed, 1000 hours, RT, longitudinal Exposed, 1000 hours, 550 F, longitudin Exposed, 10, 000 hours, -110 F, longin Exposed, 10,000 hours, RT, longitudin; Exposed, 10, 000 hours, 550 F, longituc
nal
al ldinal 31 linal
0 0.1 0.2 0.3 0.4 0.5 0.6
R/W A-48131
FIGURE 36. EFFECTS OF CRACK LENGTH Oi’J THE RATIO OF RESIDUAL STRENGTH TO ULTIMATE STRENGTH FOR Z-INCH-WIDE AM-350 STAINLESS STEEL SHEET SPECIMENS
62
I.1
Ti-8Al-lMo-1V W Unexposed, -110 F, longitudinal 0 Unexposed, RT, longitudinal + Unexposed, RT. transverse A Unexposed, 550 F, longitudinal 0 Exposed, 8000 hours, -110 F, longitudinal 0 Exposed, 8000 hours, RT, longitudinal A Exposed, 8000 hours, 550 F, longitudinal
\ L- \
3
L No notch effect
0 0.1 0.2 0.3 0.4 0.5 0.6
P/W A-48132
FIGURE 37. EFFECTS OF CRACK LENGTH ON THE RATIO OF RESIDUAL STRENGTH TO ULTIMATE STRENGTH FOR 2-INCH-WIDE Ti-8Al- lMo- 1V ALLOY SHEET SPECIMENS
63
specimen behavior was evaluated. A number of comments can be made regarding the data.
(1) From the stress-range diagrams of Figures 26 to 29, it is seen that both materials behaved in fatigue much like other structural materials.
(2) AM-350 had higher values of fatigue strength than did the titanium alloy.
(3) There was no evidence that prior stressed exposure of about 10,000 hours at 550 F influenced fatigue strength of the notched specimens.
A final point concerns notch sensitivity of the two materials. Table 13 has been prepared from the stress-lifetime diagrams for room-temperature conditions. In this table, Kf values are listed for several lifetimes and for two mean-stress conditions. These values were computed on the basis of the ratio of unnotched maximum stress to the notched maximum stress at the same mean stress and lifetime. The se values can be compared with similar information listed in Table 13 obtained on two aluminum al- loys extensively used in aircraft construction( 2, l7). In this table the mean stress for each aluminum alloy represents approximately the same ratio of mean stress to ulti- mate strength as existed for the two test materials. It appears from the tabulation that the fatigue strength reduction factors, Kf, for the two materials were comparable to Kf values for 2024-T3 and 7075-T6 aluminum alloys.
.- - - _-------_---_------------------------
On the basis of the investigation it appears that the fatigue behavior of both sheet Irlaterials, AM-350 and Ti-8Al- lMo- lV, are not too different from that of materials t-llrrently used in subsonic aircraft. Neither material exhibited a significant tendency toward metallurgical instability as a consequence of about 10,000 hours’ exposure at a temperature of 550 F.
64

TABLE 13. FATIGUE NOTCH FACTORS AT ROOM TEMPERATURE FOR EDGE-NOTCHED SPECIMENS OF AM-350 AND Ti-8Al- lMo- 1V WITH Kt = 4.0
Lifetime, cycles
Kf AM- 350 Ti-8Al- lMo- 1V
Zero Mean Stress Zero Mean Stress
4 x 10⁴ 2. 7 3. 5 1 x 10⁵ 2. 6 3. 0 1 x 10⁷ 2.. 3 3.4
40 Ksi Mean Stress 25-Ksi Mean Stress
TABLE 14. FATIGUE NOTCH FACTORS AT ROOM TEMPERATURE FOR TWO AIRCRAFT STRUCTURAL ALUMINUM ALLOYS WITH Kt = 4.0
Lifetime, cycles
___ ---_ - ~--._ _ _-- - -L-~- .- -
Kf 2024-T3 7075-T6
Zero Mean Stress Zero Mean Stress
4x 10⁴ 3. 0 2. 6 1 x 10⁵ 3.4 3. 1 1 x 10⁷ 3. 6 3. 6
12 Ksi Mean Stress 14-Ksi Mean Stress
4x 10⁴ 2.4 2. 8 lx 105 2. 6 2. 7 1 x 10⁷ 1.9 2. 7

REFERENCES
(1) Gideon, D. N. , Marschall, C. W. , Holden, F. C., and Hyler, W. S. , “Explora- tory Studies of Mechanical Cycling Fatigue Behavior of Materials for the Super- sonic Transport”, NASA CR-28 (April 1964).
(2) Grover, H. J. , Bishop, S. M. , and Jackson, L. R., “Fatigue Strengths of Air- craft Materials, Axial Load Fatigue Strengths of Notched Sheet Specimens of 24S-T3 and 75S-T6 Aluminum Alloys and of SAE 4130 Steel with Stress Concentra- tion Factors of 2. 0 and 4. O”, NACA TN 2389 (June 1951).
(3) Hardrath, H. F., Landers, C. B. , and Utley, E. C. , Jr. , “Axial Load Fatigue Tests on Notched and Unnotched Sheet Specimens of 6 IS-T6 Aluminum Alloy, An- nealed 347 Stainless Steel, and Heat-Treated 403 Stainless Steel”, NACA TN 3017 (October 1953).
(4) Inglis, C. E. , “Stresses in a Plate Due to the Presence of Cracks and Sharp Cor- ners”, Trans. Inst. Nav. Arch. , 55, Part 1 (1913).
(5) Dixon, I. R. , “Stress Distribution Around a Central Crack in a Plate Loaded in Tension: Effect of Finite Width of Plate”, J. Roy. Aero. Sot. , 64, 141-145 (March 1960).
-
(6) Gerard, G., “On the Residual Tensile Strength of Cracked Structural Elements”, New York University Tech. Report SM 62-7 (May, 1962). NOW 62-0176-d, Bur. of Naval Weapons, Dept. of Navy.
(7) Weibull, W. , “The Effect of Size and Stress History on Fatigue Crack Initiation and Propagation”, ASD-TDR-62-785 (August 1962).
(8) Rolfe, S. T., and Munse, W. H. , “Fatigue Crack Propagation in Notched Mild Steel Plates, Welding Journal Research Supplement (June 1963).
(9) Frost, N. E. , “Significance of Non-Propagating Cracks in the Interpretation of Notched Fatigue Data”, Journal of Mechanical Engineering Science (4), 3 (1961). -
(10) Thurston, R. C.A. , “Propagating and Non-Propagating Fatigue Cracks in Metals”, Mines Branch Information Circular IC 115, Department of Mines and Technical Surveys, Ottawa, Canada (January 20, 1960).
(11) Hardrath, H. F. , and McEvily, A. J. , Jr. , “Engineering Aspects of Fatigue Crack Propagation”, Proceedings of Crack Propagation Symposium, Cranfield England (September, 196 1).
(12) Frost, N. E. , and Dugdale, D. S. , “The Propagation of Fatigue Cracks in Sheet Specimens”, Journal of the Mechanics and Physics of Solids (2), 6 (1958). -
(13) Liu, H. W. , “Fatigue Crack Propagation in Thin Metal Sheets Under Repeated Loading”, Journal of Basic Engineering, Transactions ASME, Series D, 83 - (1961).
66
.
(14) McEvily, A. J. , Jr. , and Illg, W. , “The Rate of Fatigue-Crack Propagation in Two Aluminum Alloys”, NACA TN 4394 11958).
(15) Kuhn, Paul, “Notch Effects on Fatigue and Static Strength”, Symposium on Aero- nautical Fatigue, Rome, Italy, April, 1963.
(16) McEvily, A. J. , Jr. , and Illg, W. , “A Method for Predicting the Rate of Fatigue- Crack Propagation”, Symposium on Fatigue of Aircraft Structures, ASTM STP 274.
(17) Grover, H. J. , Bishop, S. M. , and Jackson, L. R. , “Fatigue Strengths of Air- craft Materials, Axial-Load Fatigue Tests on Unnotched Sheet Specimens of 24S-T3 and 75S-T6 Aluminum Alloys and of SAE 4130 Steel”, NACA TN 2324 (March 1951).
67


APPENDIX A
TENSILE DATA
69

APPENDIX A
TENSILE DATA ON AM-350 AND Ti-8Al-Mo-1V SHEETS
TABLE A-l. MANUFACTURER’S DATA ON AM-350 CRT STAINLESS STEEL
Material: AM-350 stainless steel, CRT condition Number of Sheets: Three, designated XA5, XA7, XA8 Size of Sheet: 36 x 96 x 0.050 in. Heat: 55431
Chemical Analysis Element Weight, per cent Mechanical Properties
c 0.096 Mn 0.75 P 0.015 S 0.010 Si 0.27 Cr 16.64 Ni 4.30 MO 2.79 N2 0.096
Yield Strength, 183,970 psi Tensile Strength, 233,460 psi Elongation, 13. 0 cent per Hardness, 48 RC
TABLE A-2. MANUFACTURER’S DATA ON Ti-8Al-lMo-1V ALLOY
Material: 8Al- 1 MO - 1 V titanium alloy Condition: Triplex annealed
8 hours, 1450 F, furnace cool t5 minutes, 1850 F, air cool t15 minutes, 1375 F, air cool
Number of Sheets: Three, designated TA6, TA7, TA8 Size of Sheets: 36 x 96 x (0.038 to 0. 049) inch
Chemical Analysis Weight,
Element per cent
C 0. 023 Fe 0.09 N2 0.013 Al 7. 6 Va 1.0 MO 1.1 H2 0.010-0.014
Mechanical Properties Yield Strength, Tensile Strength,
psi psi
130,300 min 142,300 min 141,100 max 152,600 max 133,000 avg 147,000 avg
Elongation, per cent
11 min 16 max 13 avg
70

APPENDIX B
CRACK-PROPAGATION DATA
71

TABLE B-l. CRACK-PROPAGATION DATA FOR S-INCH WIDE Ti-8A1-lMo-1V ALLOY SHEET SPECIMENS WITH CONSTANT NET-SECTmN STRESS
Center-notched. triplex-annealed specimens at a constant net-section mean sttess of 25 ksi.
Crack Propagation Rare, pin./cycle, at Total Thousands of Cycles to Indicated Crack Len&a), inch Indicated Crack Len@h(a), inch 0.150
Condition Specimen 0.250 0.350 0.500 0.625 0.750 0.950 (Initiation) 0.250 0.350 0.500 0.625 0.750 0.950 1.000 FaiIurAb)
C
A I$“)= 0.26, Room Temperature, 1725 cpm, Longitudinal, Unexposed
7335 1.3 2.2 8331 1.4 2.2
B
6330 4.2 5.3 6353 4.5 6.2 7327 4.2 5.4 8327 4.3 5.3 8332 4.5 6.7
2.8 3.3 4.0 4.0 635 853 915 973 2.9 3.4 3.4 3.4 1080 1229 1291 1349
19 = 0.38. Room Temperature, 1725 cpm. Longitudinal, Unexposed
8.1 8.1 8.7 8.7 66.0 101 123 146 8.5 8.7 10.4 9.0 59.5 95.5 116 136 7.2 8.8 8.8 8.8 60.2 92.5 113 135 8.6 8.6 9.6 9.6 53.0 84.0 105 127 8.0 9.6 9.6 9.0 67.2 95.7 116 138
8 = 0.38, Room Temperature. 1725 cpm, Transvene, Unexposed
1013 1045 1095 1107 1181 1385 1422 148 1 1492 1578
161 176 199 205 151 164 183 189 151 164 187 192 141 156 177 181 151 165 186 191
240 (4
228 mm mm
7225 4.3 4.9 7.2 8.3 9.2 9.2 17.3 119 142 165 180 195 217 222 __ 7351 4.5 4.5 6.7 7.8 7.8 8.3 88.0 127 149 172 190 207 232 236 269 7352 3.6 4.5 5.8 8.0 8.0 8.0 103 151 179 206 224 239 264 271 312 8230 3.7 4.8 5.8 7.4 7.4 8.0 77.9 119 143 169 189 206 230 236 mm
D
6350 3.0 3.8 4.6 6357 3.8 4.0 4.9
0 = 0.38. 550 F. 1725 cpm, Longitudinal, Unexposed
5.5 5.2 5.2 57.3 109 139 5.5 6.1 5.3 57.5 90.2 117
175 199 223 264 273 333 149 174 195 229 239 298
E 0 = 0.74, -110 F. 1725 cpm. Longitudinal, Unexposed
6356 23 7341 20 8162 21
23 38 38 42 42 8.6 14.7 19.1 24.7 28.0 24 34 34 34 34 11.1 17.6 22.0 27.5 31.1 26 35 35 35 -- 8.3 15.3 19.5 24.8 28.4 24 35 35 35 -- 8.8 15.3 19.4 24.8 28.4
31.4 36.2 37.4 34.8 40.1 41.1 31.9 -- --
45.9. 50.7 mm -_ 8174 22 32.0 -- --
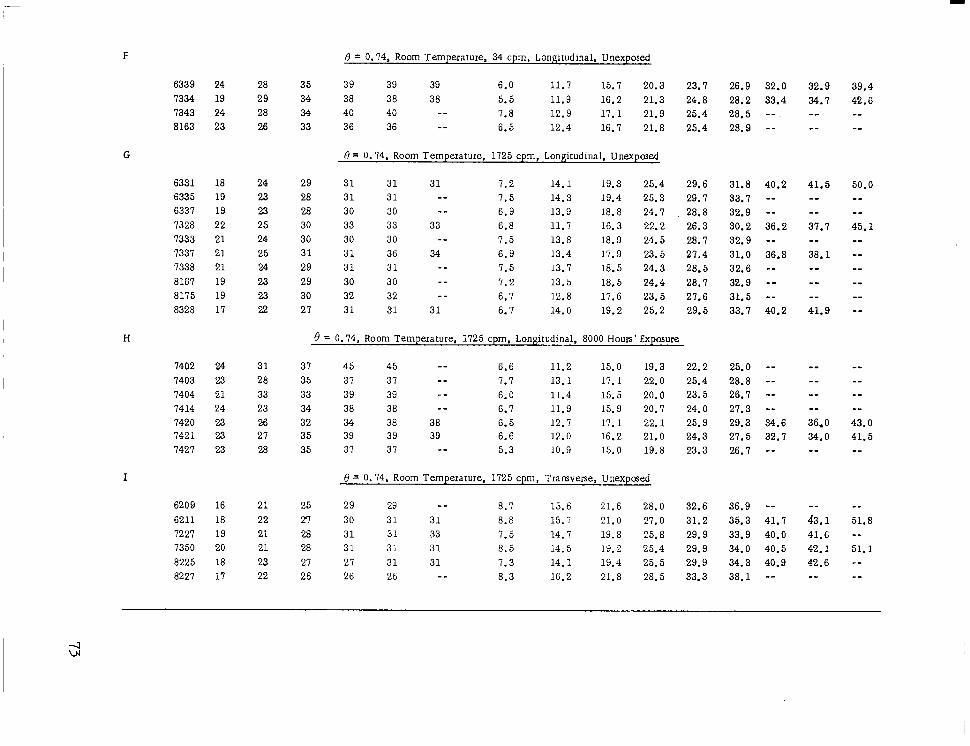
-
F 0 = 0.74, Room Temperature, 34 cpm, Longitudmal. Unexposed
6339 24 28 35 39 39 39 6.0 11.7 15.7 20.3 23.7 26.9 32.0 7334 19 29 34 38 38 38 5.5 11.9 16.2 21.3 24.8 28.2 33.4 7343 24 28 34 40 40 -- 7.8 12.9 17.1 21.9 25.4 28.5 --. 8163 23 26 33 36 36 -- 6.5 12.4 16. I 21.8 25.4 28.9 --
G 0 = 0.74, Room Temperature, 1725 cpm, Longitudinal, Unexposed
6331 18 24 29 31 31 31 7.2 14.1 19.3 25.4 29.6 6335 19 23 28 31 31 -- 7.5 14.3 19.4 25.3 29.7 6337 19 23 28 30 30 -- 6.9 13.9 18.8 24.7 28.8 7328 22 25 30 33 33 33 6.8 11.7 16.3 22.2 26.3 7333 21 24 30 30 30 -- 7.5 13.8 18.9 24.5 28.7 7337 21 25 31 31 36 34 6.9 13.4 17.9 23.5 27.4 7338 21 24 29 31 31 -- 7.5 13.7 18.5 24.3 28.5 8167 19 23 29 30 30 -- 7.2 13.5 18.5 24.4 28.7 8175 19 23 30 32 32 -- 6.7 12.8 17.6 23.5 27.6 8328 17 22 27 31 31 31 6.7 14.0 19.2 25.2 29.5
31.8 40.2 41.5 50.0 33.7 -- -- __ 32.9 -- mm -- 30.2 36.2 37.7 45.1 32.9 -- __ -- 31.0 36.8 38.1 -- 32.6 -- -m -- 32.9 -- -- -w 31.5 -- __ __ 33.7 40.2 41.9 __
H 6 = 0.74, Room Temperature, 1725 cpm, Longitudinal, 8000 Hours’ Exposure
7402 24 31 37 45 45 -- 6.6 11.2 15.0 19.3 22.2 25.0 -- 7403 23 28 35 37 37 -- 7-7 13.1 17.1 22.0 25.4 28.8 -- 7404 21 33 33 39 39 -- 6.0 11.4 15.5 20.0 23.5 26.7 _- 7414 24 23 34 38 38 -- 6.7 11.9 15.9 20.7 24.0 27.3 -- 7420 23 26 32 34 38 38 6.5 12.7 17.1 22.1 25.9 29.3 34.6 7421 23 27 35 39 39 39 6.6 12.0 16.2 21.0 24.3 27.5 32.7 7427 23 28 35 37 31 -- 5.3 10.9 15.0 19.8 23.3 26.7 --
6209 16 21 25 29 29 -- 8.7 15.6 21.6 28.0 32.6 36.9 -- 6211 18 22 2‘7 30 31 31 8.8 15.7 21.0 27.0 31.2 35.3 41.7 7227 19 21 28 31 31 33 7.5 14.7 19.8 25.8 29.9 33.9 40.0 7350 20 21 28 31 31 31 8.5 14.5 19.2 25.4 29.9 34.0 40.5 8225 18 23 27 27 31 31 7.3 14.1 19.4 25.5 29.9 34.3 40.9 8227 17 22 26 26 26 -- 8.3 16.2 21.8 28.5 33.3 38.1 --
0 = 0.74, Room Temperature, 1725 cpm, Tramverse, Unexposed
32.9 39.4 34.7 42.6 -- -- -- -_
-- -- -_ -_ mm __ __ __ 36.0 43.0 34.0 41.5 __ _-
__ 43.1 41.6 42.1 42.6 --
-- 51.8 _- 51.1 -_ -_
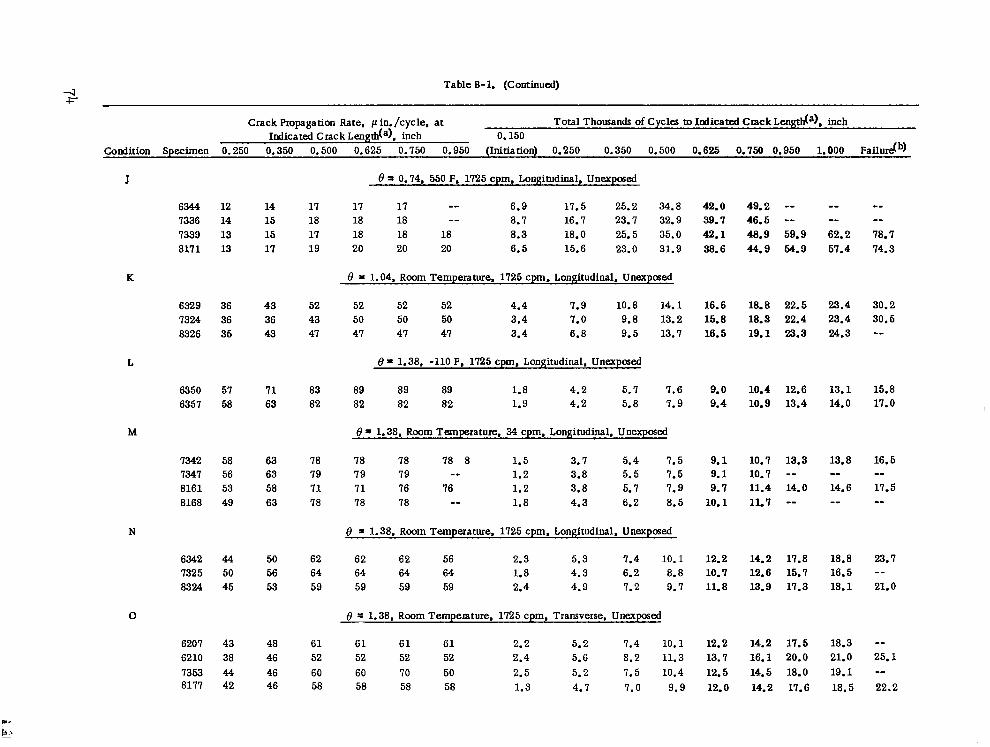
Table B-1. (Continued)
Crack Propagation Rate, pin. /cycle, at Total Thousands of Cycles to Iniicated Crack Leq~th(~), inch Indicated Crack Lengda). inch 0.150
Condition Specimen 0.250 0.350 0.500 0.625 0.750 0.950 (Initiation) 0.250 0.350 0.500 0.625 0.750 0.950 1.000 FaiIur&b)
J
6344 12 14 17 7336 14 15 18 7339 13 15 11 8171 13 17 19
K
6329 36 43 52 7324 36 36 43 8326 35 43 47
L
6350 57 71 83 6357 58 63 82
M
7342 58 63 78 7347 56 63 79 8161 53 58 71 8168 49 63 78
N
6342 44 50 62 7325 50 56 64 8324 45 53 59
0
6207 43 48 6210 38 46
7353 44 46 8177 42 46
61 61 61 61 2.2 5.2 7.4 10.1 12.2 14.2 11.5 52 52 52 52 2.4 5.6 8.2 11.3 13. I 16.1 20.0 60 60 70 50 2.5 5.2 7.5 10.4 12.5 14.5 18.0 58 58 58 58 1.3 4.7 7.0 9.9 12.0 14.2 17.6
0 = 0.74, 550 F. 1725 cpm, Longitudinal, Unexposed
17 11 -- 6.9 17.5 25.2 34.8 18 18 -- 8.7 16.7 23.7 32.9 18 18 18 8.3 18.0 25.5 35.0 20 20 20 6.5 15.6 23.0 31.9
0 = 1.04, Room Temperature, 1725 cpm. Longitudinal. Unexposed
52 52 52 4.4 7.9 10.6 14.1 50 50 50 3.4 7.0 9.8 13.2 47 47 47 3.4 6.8 9.5 13.7
0 = 1.38, -110 F, 1725 cpm, Longitudinal, Unexposed
89 89 89 1.8 4.2 5.7 7.6 82 82 82 1.9 4.2 5.8 7.9
0 * 1.38, Room Temperature, 34 cpm. Longitudinal, Unexposed
78 78 78 8 1.5 3.7 5.4 7.5 79 79 -- 1.2 3.8 5.5 7.5 71 76 76 1.2 3.8 5.7 7.9 78 78 -- 1.8 4.3 6.2 8.5
0 = 1.38, Room Temperature, 1725 cpm, Longitudinal, Unexposed
62 62 56 2.3 5.3 7.4 10.1 64 64 64 1.8 4.3 6.2 8.8 59 59 59 2.4 4.9 7.2 9.7
0 = 1.38, Room Temperature. 1725 cpm, Transverse, Unexposed
42.0 49.2 -- -- --
39.1 46.5 -- -- --
42.1 48.9 59.9 62.2 78.7
38.6 44.9 54.9 57.4 14.3
16.6 18.8 22.5 23.4 30.2 15.8 18.3 22.4 23.4 30.5 16.5 19.1 23.3 24.3 --
9.0 10.4 12.6 13.1 15.8
9.4 10.9 13.4 14.0 17.0
9.1 10.7 13.3 13.8 16.5
9.1 10.1 -- -- w-
9.1 11.4 14.0 14.6 17.5 10.1 11.7 -- -- --
12.2 14.2 17.8 18.8 23.7 10. I 12.6 15.7 16.5 __
11.8 13.9 11.3 18.1 21.0
18.3 -a
21.0 25.1
19.1 -w
18.5 22.2

Q
8 = 1.38, 550 F, 1725 Longitudinal, Unexposed cpm,
8165 31 39 45 45 53 45 1.6 5.3 8.4 11.9 8172 30 42 44 44 44 44 1.8 5.5 8.6 12.1
8 = 1.74, Room Temperature, 1200 cpm, Longitudinal, Unexposed
6347 57 70 83 83 83 76 1.4 3.6 5.3 7.3 7332 58 71 83 83 83 78 1.1 3.2 4.7 6.7 7340 61 71 85 85 85 83 1.1 2.2 4.7 6.5
8330 50 61 71 75 75 63 1.5 4.0 5.7 8.1
14.7 17.2 21.6 22.1 26.0 14.9 17.1 22.2 23.3 28.2
8.8 10.3 12.9 13.6 16.6 8.2 9.7 11.9 12.6 -- 8.0 9.5 11.8 12.4 15.1
9.8 11.5 14.5 15.3 __
(a) Tip-to-tip crack length. (b) Specimens cycled to failure from a l-inch nominal crack length without further adjustment of net-section stress. (c) 0 = Net-section alternating stress amplitude/net-section mean suers. (d) Blank indicates specimen teat stopped; specimen employed in residual-static-strength studies.
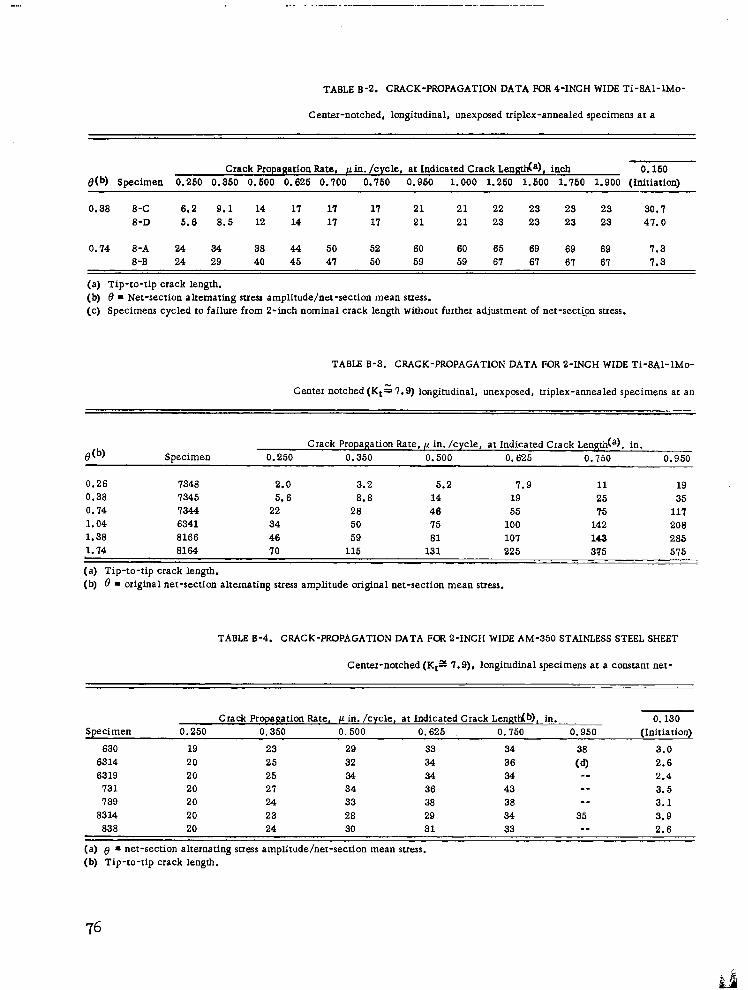
TABLE B-2. CRACK-PROPAGATION DATA FOR 4-INCH WIDE Ti-8Al-lMo-
Center-notched, longitudinal, unexposed triplex-annealed specimens at a -
Crack Propagation Rate, n in. /cycle, at Indicated Crack LenRth( *I, inch 0.150 e(b) Specimen 0.250 0.350 0.500 0.625 0.700 0.750 0.950 1.000 1.250 1.500 1.750 1.900 (Initiation)
0.38 8-C 6.2 9.1 14 17 17 17 21 21 22 23 23 23 30.7 8-D 5.6 8.5 12 14 17 17 21 21 23 23 23 23 47.0
0.74 8-A 24 34 38 44 50 52 60 60 65 69 69 69 7.3 8-B 24 29 40 45 47 50 59 59 67 67 67 67 7.3
(a) Tip-to-tip crack length. (b) 0 = Net-section alternating stress amplitude/net-section mean suess. (c) Specimens cycled to failure from 2-inch nominal crack length without further adjustment of net-sect&i stress.
TABLE B-3. CRACK-PROPAGATION DATA FOR P-INCH WIDE Ti-8Al-lMo-
Center notched (KtZ 7.9) longitudinal, unexposed, triplex-annealed specimens at an
,g(b) Specimen Crack Propagation Rate, p in. /cycle, at Indicated Crack Length(a), in.
0.250 0.350 0.500 0.625 0.750 0.950
0.26 7348 2.0 3.2 5.2 7.9 11 19 0.38 7345 5.6 8.8 14 19 25 35 0.14 7344 22 28 46 55 I5 111 1.04 6341 34 50 15 100 142 208 1.38 8166 46 59 81 101 143 285 1.74 8164 70 115 131 225 375 575 -_ -.-__~ ___-~-~-~ (a) Tip-to-tip crack length. (b) 0 = original net-section alternating stress amplitude original net-section mean stress.
TABLE 8-4. CRACK-PROPAGATION DATA FOR ?-INCH WIDE AM-350 STAINLESS STEEL SHEET
Center-notched (K,= 7.9). longitudinal specimens at a constant net-
-
Specimen Crack Propagation Rate, p in. /cycle, at Indicated Crack Len&b), in. 0.130
0.250 0.350 0.500 0.625 0.750 0.950 (Initiation)
630 19 23 29 33 6314 20 25 32 34 6319 20 25 34 34
731 20 27 34 36 739 20 24 33 38
8314 20 23 28 29 838 20 24 30 31
(a) ,g = net-section alternating stress amplitude/net-section mean stress. (b) Tip-to-tip crack length.
34 38 3.0 36 (4 2.6 34 -m 2.4 43 -- 3.5 38 -w 3.1 34 35 3.9 33 __ 2.6 ~-. --- .~ - -
76
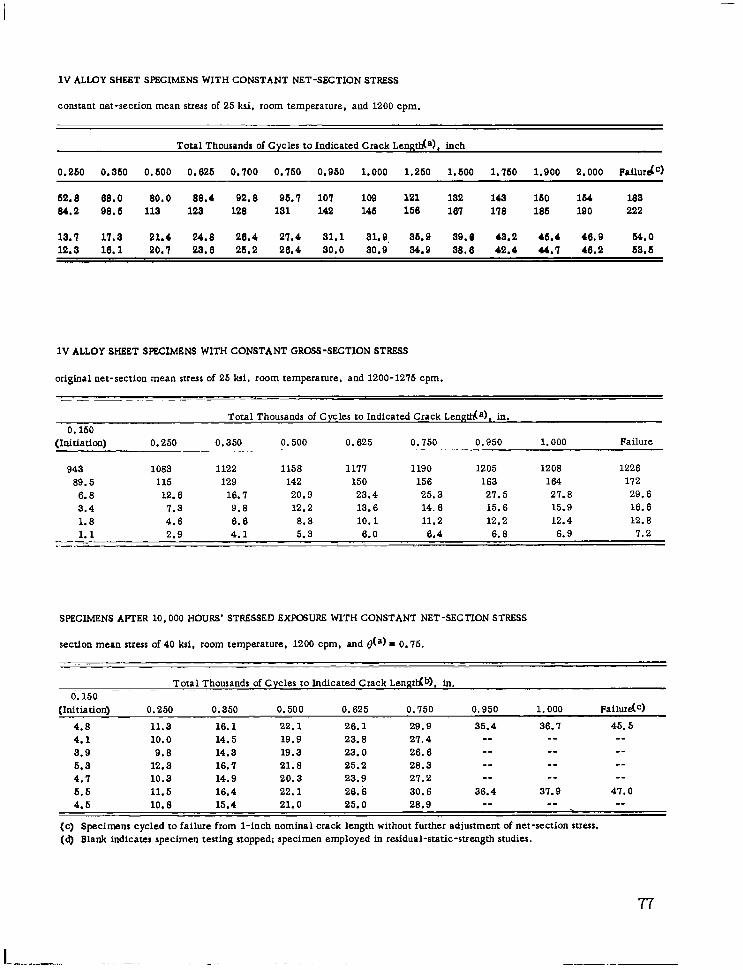
1V ALLOY SHEET SPECIMENS WITH CONSTANT NET-SECTION STRESS
constant net-section mean stress of 25 ksi, room temperature, and 1200 cpm.
Total Thousands of Cycles to Indicated Crack LenRth(a), inch
0.250 0.350 0.500 0.825 0.700 0.750 0.050 1.000 1.250 1.500 1.750 1.000 2.000 FailurJC)
52.8 68.0 80.0 00.4 02.8 05.7 107 199 121 132 143 150 154 183 64.2 08.5 113 123 128 131 142 145 156 187 178 185 100 222
13.7 17.3 21.4 24.0 26.4 27.4 31.1 31.0, 36.0 30.9 43.2 45.4 46.0 54.0 12.3 16.1 20.7 23.6 25.2 26.4 30.0 30.0 34.0 38.6 42.4 44.7 46.2 53.5
1V ALLOY SHEET SPECIMENS WITH CONSTANT GROSS-SECTION STRESS
original net-section mean stress of 25 ksi. room temperature, and 1200-1275 cpm.
0.150 (Initiation)
Total Thousands of Cycles to Indicated Crack LenRrh(a), in. ~~ -
0.250 0.350 0.500 0.625 0.750 0.050 1.000 Failure
043 1083 1122 1158 1177 1100 1205 1208 1226 80.5 115 120 142 150 156 163 164 172
6.8 12.6 16.7 20.0 23.4 25.3 21.5 21.8 20.6 3.4 7.3 0.8 12.2 13.6 14.6 15.6 15.0 16.6 1.8 4.6 6.6 8.8 10.1 11.2 12.2 12.4 12.8 1.1 2.0 4.1 5.3 6.0 6.4 6.8 6.0 1.2
- --
SPECIMENS AFTER 10,000 HOURS’ STRESSED EXPOSURE WITH CONSTANT NET-SECTION STRESS
section mean stress of 40 ksi, room temperature, 1200 cpm, and /$“) = 0.75.
--.-
Total Thousands of Cycles to Indicated Crack Lengttib), in. ~- ~- - - - 0.150
(Initiation) 0.250 0.350 0.500 0.625 0.750 0.050 1.000 Failure(c)
.~ 4.8 11.3 16.1 22.1 26.1 20.9 35.4 36.1 45.5 4.1 10.0 14.5 10.9 23.8 21.4 __ -_ __ 3.9 0.8 14.3 19.3 23.0 26.6 mm -_ -- 5.3 12.3 16.7 21.8 25.2 28.3 -- __ -- 4.7 10.3 14.0 20.3 23.9 27.2 mm mm __ 5.5 11.5 16.4 22.1 26.6 30.6 36.4 37.0 41.0 4.5 10.0 15.4 21.0 25.0 28.9 mm -- _-
---..- r- - (c) Specimens cycled to failure from l-inch nominal crack length without further adjustment of net-section stress. (d) Blank Indicates specimen testing stopped; specimen employed in residual-static-strength studies.


APPENDIX C
STRESS-LIFETIME DATA
79

TABLE C- 1. STRESS-LIFETIME DATA FOR AM-350 STAINLESS STEEL AT - 110 F
Specimen Maximum Stre s s ,
ksi Cycles to Failure
Unexposed, Notched (Kt = 4. 0), Longitudinal, 40-Ksi Mean Stress
7135 120.0 1,000 7163 105.0 7,000 7164 90. 0 25,000 7132 75. 0 58,000 6139 70. 0 120,000 7158 67. 5 177,000 6148 65. 0 5,959,000, D.N.F.(a)
10,500 Hours’ Exposure, Notched
Wt = 4. 0), Longitudinal, 40-Ksi Mean Stress
8145 90. 0 17,800 8128 80. 0 27,000 7150 70. 0 104,000 8146 65. 0 171,800 7138 60. 0 1,973,500 8135 57. 5 3,067,000, D.N.F.
(a) D.N.F. - did not fail.
80

TABLE C-2. STRESS-LIFETIME DATA FOR AM- 350 STAINLESS STEEL AT ROOM TEMPERATURE
Specimen Maximum Stre s 8,
kei Cycles to Failure
8166 160.0 12,300 8167 125.0 43,300 8171 110.0 87,500 8163 100.0 71,500 8165 90. 0 256,200 8169 80. 0 471,700 8150 75. 0 10,107,500, D.N.F.(a) 8148 75. 0 16,256,900, D.N.F. 8168 70. 0 10,041,600, D.N.F.
6319 65. 0 16,100 7318 55. 0 22,700 6316 50.0 30,000 7324 45. 0 43,400 7322 40. 0 99,000 8317 37. 5 116,000 6320 35.0 88,400 8322 32. 5 10,087,000, D.N.F.
7131 120.0 2,500 6143 98. 0 10,000 6156 80. 0 19,500 6158 70. 0 30,000 7130 60. 0 173,000 8138 57. 5 72,000 6144 56. 6 1,484,OOO 8133 55. 0 10,248,000, D.N.F.
Unexposed, Unnotched, Longitudinal Zero Mean Stress
Unexposed, Notched (Kt = 4.0), Longitudinal, Zero Me an St re s s
Unexposed, Notched (I$ = 4.0), Longitudinal, 40-Ksi Mean Stress
81

TABLE C- 2. (Continued)
Spe time n Maximum Stress,
ksi Cycles to Failure
6180 80. 0 17,800 6178 70. 0 37,300 6174 60. 0 99,400 6179 60. 0 119,100 6172 55. 0 195,300 6177 55. 0 10,115,500, D.N.F. 6173 55. 0 14,450,300, D. N. F. 6169 50. 0 17,026,300, D.N.F.
Unexposed, Unnotched, Room Temperature, 100-Ksi Mean Stress
8154 226.4 11,000 8158 210.0 19,400 6308 195.0 37,600 8309 185. 0 52,500 6301 175.0 104,200 7302 170.0 230,000 6310 165. 0 11,951,800, D.N.F.
Unexposed, Notched (Kt = 4. 0), Room Temperature, lOO-Ksi Mean Stress
7326 135.0 11,700 7311 134.8 13,700 8319 130.0 11,800 6311 125.0 18,000 8318 120.0 29,700 7321 115.0 80,000 7313 110.0 1,606,000 6324 107.5 10,118,000, D.N.F.
Unexposed, Notched (Kt = 4.0), Transverse, 40-Ksi Mean Stress
(a) D. N.F. - did not fail.
82
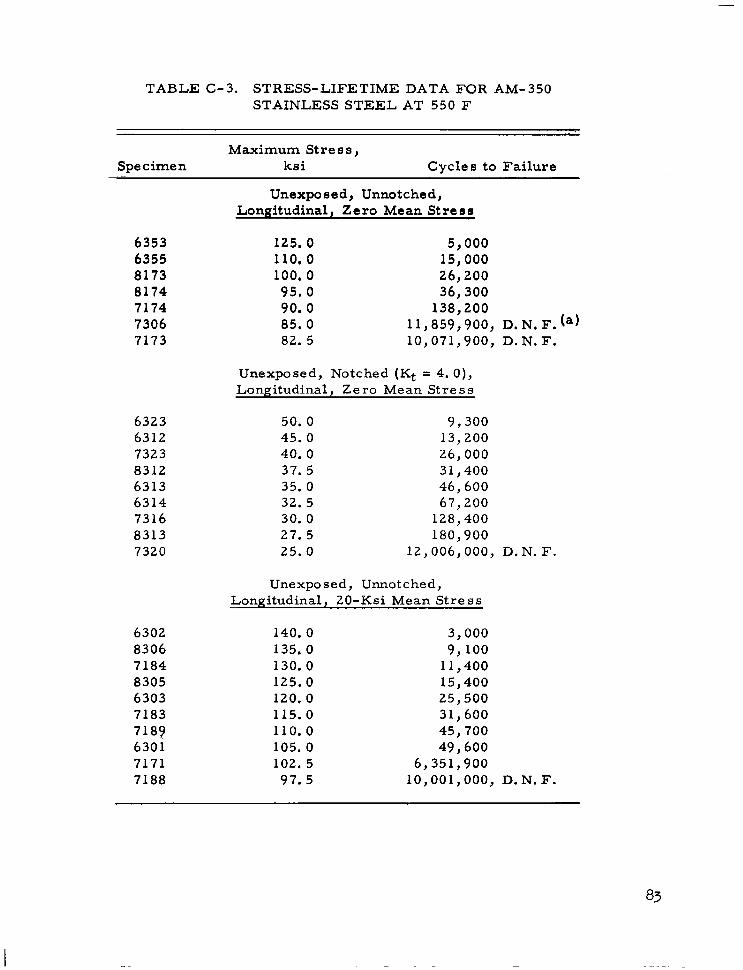
TABLE C-3. STRESS-LIFETIME DATA FOR AM- 350 STAINLESS STEEL AT 550 F
Specimen Maximum Stress,
ksi Cycles to Failure
Unexpoeed, Unnotched, Longitudinal, Zero Mean St rees
6353 125. 0 5,000 6355 110.0 15,000 8173 100.0 26,200 8174 95.0 36,300 7174 90. 0 138,200 7306 85. 0 11,859,900, D.N.F.ta) 7173 82. 5 10,071,900, D. N. F.
Unexposed, Notched (Kt = 4.0), Longitudinal, Zero Mean Stress
6323 50. 0 9,300 6312 45. 0 13,200 7323 40. 0 26,000 8312 37. 5 31,400 6313 35. 0 46,600 6314 32. 5 67,200 7316 30. 0 128,400 8313 27. 5 180,900 7320 25. 0 12,006,000, D.N.F.
6302 140.0 3,000 8306 135.0 9,100 7184 130.0 11,400 8305 125.0 15,400 6303 120.0 25,500 7183 115.0 31,600 7189 110.0 45,700 6301 105.0 49,600 7171 102.5 6,351,900 7188 97.5 10,001,000, D.N.F.
Unexposed, Unnotched, Longitudinal, 20-Ksi Mean Stress
83

TABLE C-3. (Continued)
Specimen Maximum St re s s ,
ksi Cycles to Failure _____~_ . . . . ~- -. - -T -z
Unexposed, Notched (Kt = 4.0), Longitudinal, 20-Ksi Mean Stress
6182 60. 0 6,600 8324 55. 0 15, 4.00 7325 52. 5 18,000 7327 50. 0 32,900 8326 47. 5 45,000 6317 45. 0 76,100 7329 42. 5 1,984,600, D. N. F. 7328 40. 0 10,032,000, D. N. F.
6138 100.0 2,500 6135 88. 0 3,500 6145 75. 0 11,000 6134 70. 0 27,000 8142 65. 0 58,000 8141 63. 7 38,000 7162 62. 5 12,598,000, D.N.F. 7157 60. 0 10,044,800, D.N.F.
Unexposed, Notched (Kt = 4.0), Longitudinal, 40-Ksi Mean Stress
10,500 Hours’ Exposure, Notched (Kt = 4. 0), Longitudinal, 40-Ksi Mean Stress
8139 75. 0 7,200 8131 67. 5 14,300 8147 65. 0 239,800 7146 62. 5 340,200 8129 60. 0 6,113,700
84
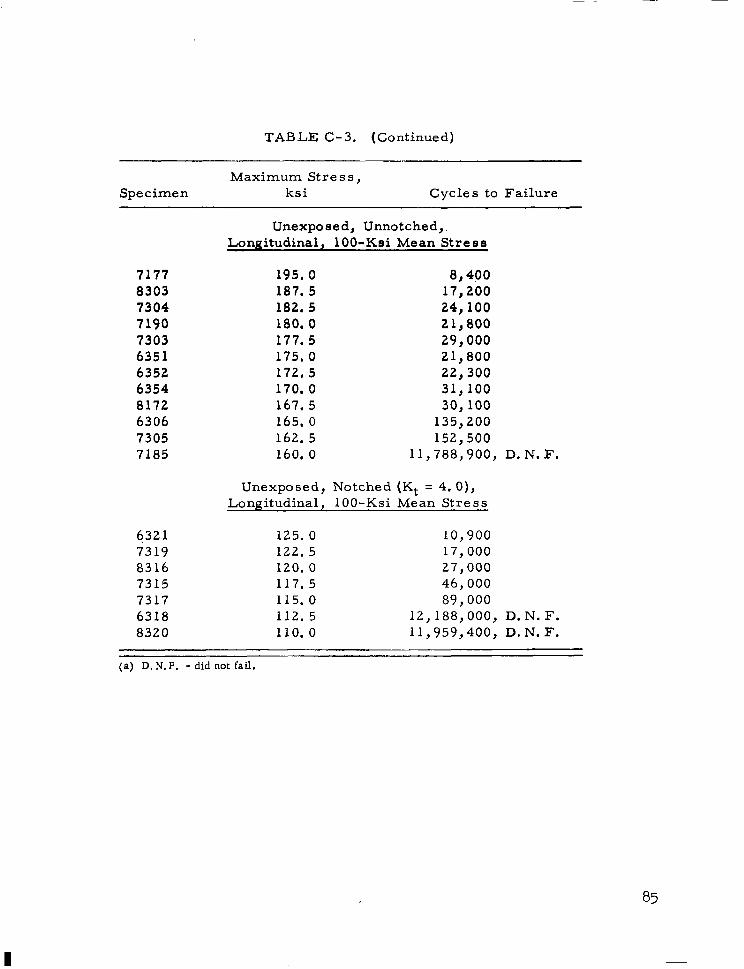
TABLE C-3. (Continued)
Specimen Maximum Stress,
ksi Cycles to Failure
7177 195.0 8,4pO 8303 187. 5 17,200 7304 182. 5 24,100 7190 180.0 21,800 7303 177.5 29,000 6351 175.0 21,800 6352 172.5 22,300 6354 170.0 31,100 8172 167. 5 30,100 6306 165. 0 135,200 7305 162. 5 152,500 7185 160.0 11,788,900, D.N.F.
Unexposed, Unnotched, Longitudinal, lOO-Kei Mean Streee
Unexposed, Notched (Kt = 4.0), Longitudinal, lOO-Ksi Mean Stress
6321 125. 0 10,900 7319 122.5 17,000 8316 120.0 27,000 7315 117.5 46,000 7317 115.0 89,000 6318 112.5 12,188,000, D. N. F. 8320 110.0 11,959,400, D.N. F.
(a) D. N.F. - did not fail.
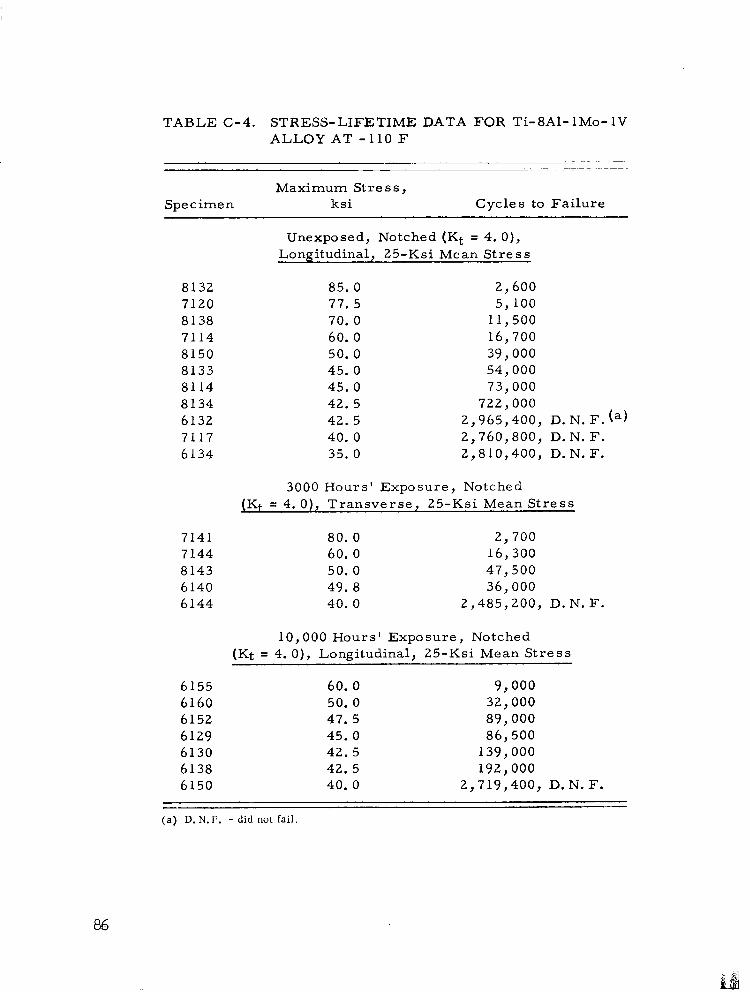
TABLE C-4. STRESS-LIFETIME DATA FOR Ti-8Al-lMo-1V ALLOY AT -110 F
Specimen Maximum Stress,
ksi Cycles to Failure
8132 85. 0 2,600 7120 77.5 5,100 8138 70. 0 11,500 7114 60. 0 16,700 8150 50. 0 39,000 8133 45. 0 54,000 8114 45. 0 73,000 8134 42. 5 722,000 6132 42. 5 2,965,400, D. N. F. (a) 7117 40. 0 2,760,800, D. N. F. 6134 35. 0 2,810,400, D. N. F.
3000 Hours’ Exposure, Notched ( + ), TransverseL 25-Ksi Mean Stress K = 4. 0
7141 80. 0 2,700 7144 60. 0 16,300 8143 50. 0 47,500 6140 49. 8 36,000 6144 40. 0 2,485,200, D. N. F.
10,000 Hours’ Exposure, Notched (Kt = 4. 0), Longitudinal, 25-Ksi Mean Stress
6155 60. 0 9,000 6160 50. 0 32,000 6152 47. 5 89,000 6129 45. 0 86,500 6130 42. 5 139,000 6138 42. 5 192,000 6150 40. 0 2,719,400, D.N.F.
Unexposed, Notched (Kt = 4. 0), Longitudinal, 25-Ksi Mean Stress
- (a) D.N.F. - did not fail.
86

TABLE C-5. STRESS-LIFETIME DATA FOR Ti-8Al-lMo- 1V ALLOY AT ROOM TEMPERATURE
Specimen Maximum Stress,
kei Cycles to Failure
7303 120.0 7310 110.0 6311 100.0 8134 90. 0 8302 80. 0 6309 70. 0 6308 65. 0 7309 60. 0
6177 50. 0 5,900 6146 40. 0 13,900 6147 30. 0 33,400 6176 25. 0 115,600 6179 22. 0 99,500 6188 22.0 156,300 6189 20. 0 10,015,900, D.N. F. 6148 20. 0 10,217,800, D.N.F.
6158 85. 0 2,400 7113 70. 0 5,000 6128 60. 0 12,000 8148 50. 0 26,000 7111 40. 0 94,000 6180 39.0 68,000 6181 39. 0 83,500 7118 35. 0 267,000 8111 33. 7 236,000 7119 33. 0 3,098,OOO 6145 32. 5 10,000,000, D.N.F. 8135 30. 0 11,483,600, D.N.F.
Unexposed, Unnotched, Longitudinal, Zero Mean Stress
17,000 23,800 28,200 74,000
286,000 1,089,500
l:$;;:::, D. N. F.(a)
Unexposed, Notched (Kt = 4. 0), Longitudinal, Z e ro Mean St re s s
Unexposed, Notched (Kt = 4. 0), Longitudinal, 25-Ksi Mean Stress
87

TABLE C-5. (Continued)
Specimen Maximum St re s s ,
ksi Cycles to Failure
8222 60. 0 6,900 8223 55. 0 11,600 8141 50. 0 22,500 6139 45. 0 40,000 7223 40. 0 101,300 7222 35. 0 8,681>200 7221 32. 5 10,012,900, D.N. F.
8307 150.0 9,700 8301 140.0 38,200 6318 130.0 42,500 7304 120.0 196,600 8305 110.0 106,900 7305 110.0 1,344,.300 7306 105.0 1,014,100 6317 100.0 3,862,500 6313 95. 0 8,739,OOO 8310 90.0 13,206,700
Unexposed, Notched (Kt = 4.0), Transverse, 25-Ksi Mean Stress
Unexposed, Unnotched, Longitudinal, 60-Ksi Mean Stress
Unexposed, Notched (Kt = 4. 0), Longitudinal, 60-Ksi Mean Stress
8113 110.0 1,300 6320 100.0 3,500 8137 90. 0 9,600 8145 80. 0 15,400 6203 70. 0 103,400 8128 70.0 109,600 6190 65. 0 10,076,000, D.N.F. 7318 65. 0 10,013,700, D. N. F.
(a) D.N.F. - did not fail.
88

TABLE C-6. STRESS-LIFETIME DATA FOR Ti-8Al-lMo-1V ALLOY AT 550 F
T---- ____- Maximum St re s s ,
Spe c ime n ksi Cycles to Failure
8303 100.0 5,000 6316 90. 0 17,200 8309 80. 0 35,800 7311 70. 0 65,400 7313 70. 0 83,400 8311 65. 0 7,815,800 6310 55. 0 10,936,500, D.N.F.(a)
Unexposed, Notched (Kt = 4.0), Longitudinal, Zero Mean Stress
6325 45. 0 11,300 8317 40. 0 13,300 8320 35. 0 22,000 6323 30. 0 30,000 6324 25. 0 57,000 7322 22. 5 79,100 7317 20. 0 10,093,700
Unexposed, Notched (Kt = 4. 0), Longitudinal, 25-Ksi Mean Stress
8149 70. 0 2,300 7115 60. 0 7,500 8147 50. 0 25,800 7112 40. 0 99,400 8130 35. 0 10,197,500, D.N. F. 8131 35. 0 14,379,400, D. N. F. 7116 32. 5 12,053,000, D.N. F. 6136 30.0 11,174,000, D.N.F.
7143 6142 8139 7146
3000 Hours’ Exposure, Notched
(Kt = 4.0), Transverse, 25-Ksi Mean Stress ---
60. 0 6,500 50. 0 17,300 40.0 78,100 35.0 9,827,400, D. N. F.
Unexposed, Unnotched, -Longitudinal, Zero Mean Stress
89

TABLE C-6. (Continued)
90
Specimen Maximum St re s s ,
ksi Cycles to Failure
10,000 Hours’ Exposure, Notched 0% = 4. 0), Longitudinal, 25-Ksi Mean Stress
6149 60. 0 7,500 6151 50. 0 21,500 6161 45. 0 35,900 6159 42. 5 44,600 6157 40. 0 713,400 6131 37. 5 11,805,000, D.N.F. 6156 35. 0 10,025,000, D. N. F.
Unexposed, Unnotched, Longitudinal, 60-Ksi Mean Stress
8312 120.0 12,200 7302 110.0 33,900 6306 107.5 25,000 7303 105.0 2,554,500 6307 102.5 62,700 7301 95. 0 10,036,000, D.N.F.
Unexposed, Notched (Kt = 4.0), Longitudinal, 60-Ksi Mean Stress
8319 90. 0 5,700 8324 85. 0 7,400 7316 80. 0 15,800 6322 75. 0 29,300 6321 72. 5 55,500 8321 70. 0 82,300 6327 67. 5 14,273,500, D. N. F. 8322 65. 0 11,202,900, D.N. F.
(a) D.N:F. - did not fail.
NASA-LZdeY, I!%5 CR-215
a ii