
The Evolution of Personal Wealth in the Former...
41
1/41 The Evolution of Personal Wealth in the Former Soviet Union and Central and Eastern Europe * Sergei Guriev † and Andrei Rachinsky ‡ We discuss evolution of personal wealth in transition economies. While the data availability is still a problem, the available indirect evidence suggests privatization has resulted in an increase in personal wealth but also in personal wealth inequality – especially in the countries that lagged behind in building effective institutions. Another source of wealth inequality is the high income inequality due to wage decompression coupled with the low saving rates among the poor. We pay a special attention to one of the most noticeable implications of this rise in personal wealth and wealth inequality – the emergence of so called “oligarchs”. Using the comprehensive dataset of Muscovites’ incomes we show that surveys that do not take into account the first- and second-tier rich (billionaires and millionaires) may drastically underestimate inequality. * This paper is prepared for World Institute for Development Economics Research (WIDER) project “Personal Assets from a Global Perspective”. The paper builds substantially on Guriev and Rachinsky (2005) and Guriev and Megginson (2006). The authors are grateful to Jim Davies, Patrick Honohan, Branko Milanovic, Tony Shorrocks, and Ruslan Yemtsov for insightful comments. † Human Capital Foundation Associate Professor of Corporate Finance, New Economic School, CEFIR, and CEPR. E-mail: [email protected] ‡ Economist, Center for Economic and Financial Research (CEFIR) at the New Economic School, E-mail: [email protected]
Transcript of The Evolution of Personal Wealth in the Former...
1/41
The Evolution of Personal Wealth
in the Former Soviet Union and
Central and Eastern Europe*
Sergei Guriev † and Andrei Rachinsky ‡
We discuss evolution of personal wealth in transition economies. While the data availability is still a problem, the available indirect evidence suggests privatization has resulted in an increase in personal wealth but also in personal wealth inequality – especially in the countries that lagged behind in building effective institutions. Another source of wealth inequality is the high income inequality due to wage decompression coupled with the low saving rates among the poor. We pay a special attention to one of the most noticeable implications of this rise in personal wealth and wealth inequality – the emergence of so called “oligarchs”. Using the comprehensive dataset of Muscovites’ incomes we show that surveys that do not take into account the first- and second-tier rich (billionaires and millionaires) may drastically underestimate inequality.
* This paper is prepared for World Institute for Development Economics Research (WIDER) project
“Personal Assets from a Global Perspective”. The paper builds substantially on Guriev and Rachinsky
(2005) and Guriev and Megginson (2006). The authors are grateful to Jim Davies, Patrick Honohan,
Branko Milanovic, Tony Shorrocks, and Ruslan Yemtsov for insightful comments.
† Human Capital Foundation Associate Professor of Corporate Finance, New Economic School, CEFIR,
and CEPR. E-mail: [email protected]
‡ Economist, Center for Economic and Financial Research (CEFIR) at the New Economic School, E-mail:
2/41
Introduction
Transition from plan to market is a natural experiment of historical significance. It has
affected economic relationships, social and political structures and – what is most
important – lives of 1.5 billion people in almost 30 countries. While the transformational
recession, subsequent recovery and other aggregate processes have been studied
extensively, our understanding of the evolution of personal wealth and of the
distributional effects of transition is still far from complete. This is not because these
issues are unimportant. On one hand, transition countries are on average rather wealthy.
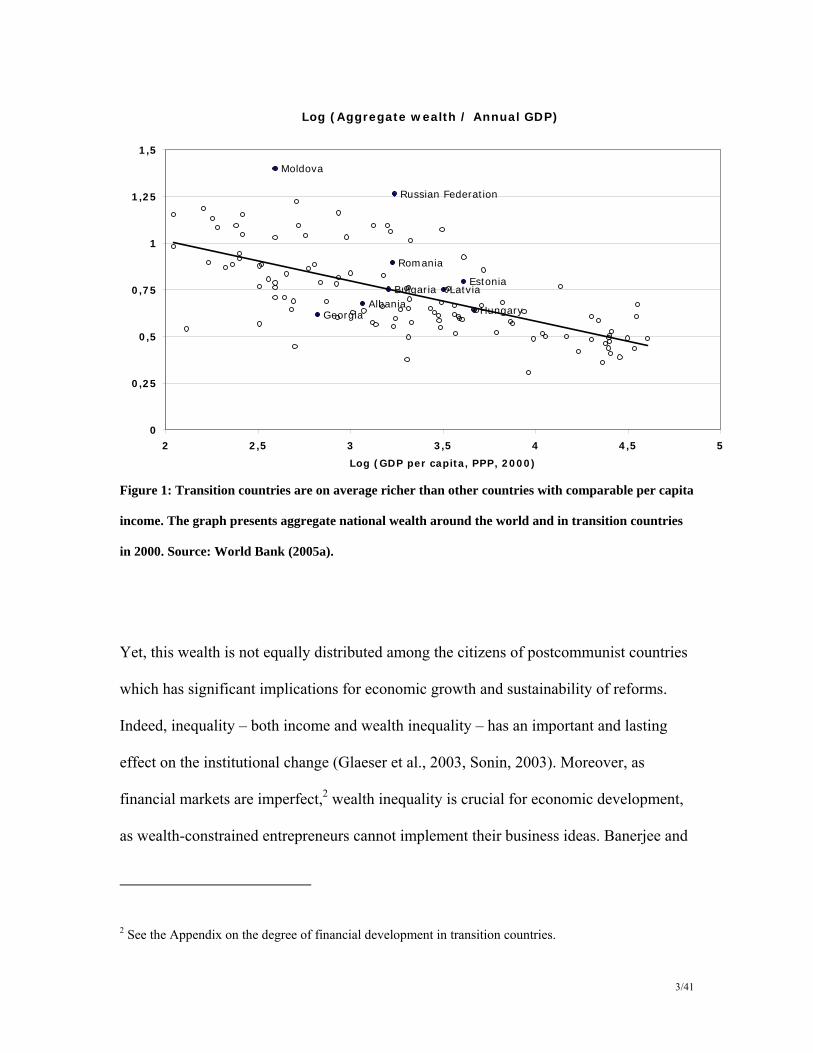
Figure 1 and Table 1 show the standing of transition countries in terms of wealth with
regard to other economies comparable per capita GDP.1 Unlike the pre-transition years,
much of this wealth is now owned by individuals. Privatization has provided many
citizens of transition countries with property rights for assets they were de facto
controlling and using during the communist era.
1 The graph presents national wealth including natural resources, production capital, infrastructure but
excluding human capital. The graph for production capital/GDP looks similar.
3/41
Log (Aggregate wealth / Annual GDP)
AlbaniaBulgaria
Estonia
Georgia Hungary
Latvia
Moldova
Romania
Russian Federation
0
0,25
0,5
0,75
1
1,25
1,5
2 2,5 3 3,5 4 4,5 5
Log (GDP per capita, PPP, 2000)
Figure 1: Transition countries are on average richer than other countries with comparable per capita
income. The graph presents aggregate national wealth around the world and in transition countries
in 2000. Source: World Bank (2005a).
Yet, this wealth is not equally distributed among the citizens of postcommunist countries
which has significant implications for economic growth and sustainability of reforms.
Indeed, inequality – both income and wealth inequality – has an important and lasting
effect on the institutional change (Glaeser et al., 2003, Sonin, 2003). Moreover, as
financial markets are imperfect,2 wealth inequality is crucial for economic development,
as wealth-constrained entrepreneurs cannot implement their business ideas. Banerjee and
2 See the Appendix on the degree of financial development in transition countries.
4/41
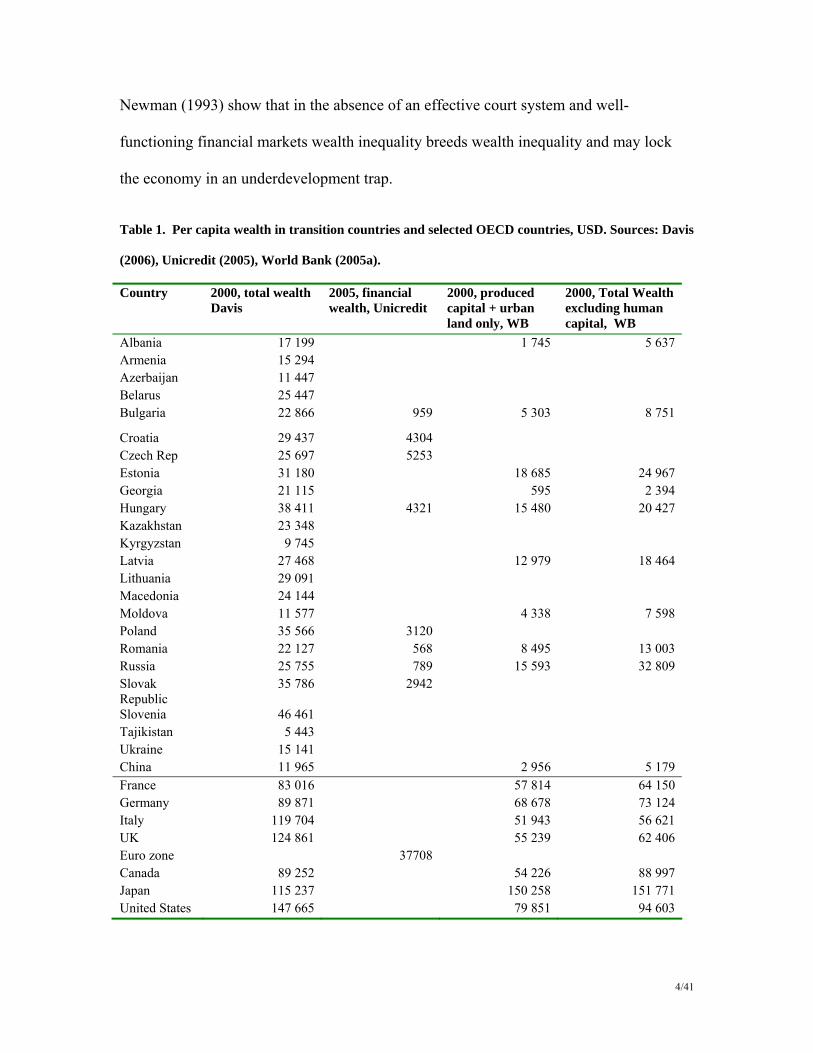
Newman (1993) show that in the absence of an effective court system and well-
functioning financial markets wealth inequality breeds wealth inequality and may lock
the economy in an underdevelopment trap.
Table 1. Per capita wealth in transition countries and selected OECD countries, USD. Sources: Davis
(2006), Unicredit (2005), World Bank (2005a).
Country 2000, total wealth Davis
2005, financial wealth, Unicredit
2000, produced capital + urban land only, WB
2000, Total Wealth excluding human capital, WB
Albania 17 199 1 745 5 637 Armenia 15 294 Azerbaijan 11 447 Belarus 25 447 Bulgaria 22 866 959 5 303 8 751
Croatia 29 437 4304 Czech Rep 25 697 5253 Estonia 31 180 18 685 24 967 Georgia 21 115 595 2 394 Hungary 38 411 4321 15 480 20 427 Kazakhstan 23 348 Kyrgyzstan 9 745 Latvia 27 468 12 979 18 464 Lithuania 29 091 Macedonia 24 144 Moldova 11 577 4 338 7 598 Poland 35 566 3120 Romania 22 127 568 8 495 13 003 Russia 25 755 789 15 593 32 809 Slovak Republic
35 786 2942
Slovenia 46 461 Tajikistan 5 443 Ukraine 15 141 China 11 965 2 956 5 179 France 83 016 57 814 64 150 Germany 89 871 68 678 73 124 Italy 119 704 51 943 56 621 UK 124 861 55 239 62 406 Euro zone 37708 Canada 89 252 54 226 88 997 Japan 115 237 150 258 151 771 United States 147 665 79 851 94 603

5/41
The research on wealth inequality is plagued by an array of data problems (Davies and
Shorrocks, 2005). First, there are no consistent microeconomic data on personal wealth
for transition countries. Whatever data are available are not comparable neither cross-
country nor over time. The wealth data for the pre-transition period are problematic for a
number of reasons (see the next section). Also, transition has been accompanied by a
substantial growth of informal sector (Shleifer and Treisman, 2005); what is more
important, the growth of informal sector may have been very different in different
countries (Alexeyev and Pyle, 2003) and cannot be accurately measured (Hanousek and
Palda, 2005).
Even given the imperfect data, there are a few strands of studies that promote our
understanding of wealth inequality in transition. First, as much of personal wealth
distribution today is driven by the privatization process, the existing research on
privatization provides important insights. Although the scholars of privatization also
complain about the lack of data, substantial progress has been made (Megginson, 2005,
Guriev and Megginson, 2006).
In addition to privatization of industrial assets, the reforms have also transferred real
estate to urban citizens and farm land to farmers. Prior to transition, socialist economies
provided each citizen with a virtually free access to public housing. Transition has
transformed these rights-to-use into private property rights essentially creating a market
for real estate (consistent with the logic of De Soto, 2002). In addition to registering the
private property titles, transition has resulted in a significant increase of supply of
housing in real terms. E.g. in Russia, a country traditionally plagued by the lack of
housing, an average citizen has seen a 20% increase in terms of per capita square meters

6/41
during 1990-2004. The transfer of housing has contributed to an increase in wealth
inequality as the value of housing in different locations varies greatly.3
Second, there is a substantial research on one of the most intriguing phenomena in
transition: the emergence of a handful of superrich tycoons in Russia – so called
“oligarchs”. Out of 691 billionaires in the Forbes list of 2005, 27 are from Russia – by far
many more than from the other transition countries combined (including China).4 It is
interesting to compare Russia’s standing in the Forbes Billionaire List and in the World
Wealth Report that cover the “second tier rich” – individuals with at least $1M in
financial assets. While Russia has 4% of the World’s billionaires both in terms of wealth
and number of individuals, there are only 103,000 Russian millionaires (only 1.2% of the
3 This is certainly a measurement issue: except for the De Soto’s collateral argument, the rental service flow
was the same before transition. Yet, as the differences in the value of the rental service flows were not
properly measured, transition has resulted in an observed increase in inequality. See Yemtsov (2006) for a
thorough empirical study of the effect of housing privatization on inequality in Poland, Serbia and Russia.
Gustafsson and Li (2001) argue that in China much of the urban-rural inequality is due to the high value of
the user rights for urban real estates that urban workers obtain at low rates.
4 Actually, in 2005 Forbes list, the total wealth of all non-Russian billionaires from transition countries
(including China but excluding Hong Kong) was below the wealth of the single richest Russian. In 2004,
the wealth of 26 Russian billionaires was about 19% of Russian GDP; the total wealth of all 262 US
billionaires was just 7% American GDP. The role of oligarchs increased even further in 2006 when their
wealth doubled to $174 billion (23% Russian GDP).
7/41
world’s total) who have about $670 billion wealth (2% of the world’s total).5 The
comparison of the Forbes List and the World Wealth Report suggests that there is a huge
inequality at the very the top end of Russia’s wealth distribution: 25 Russian oligarchs
have about 12% of the combined wealth of 103 thousand Russian millionaires.6
How and why did these “oligarchs” arise? Why did they emerge in Russia but not in
other transition countries? What is the impact of their wealth on the economic
development of Russia? We address these issues in detail below.
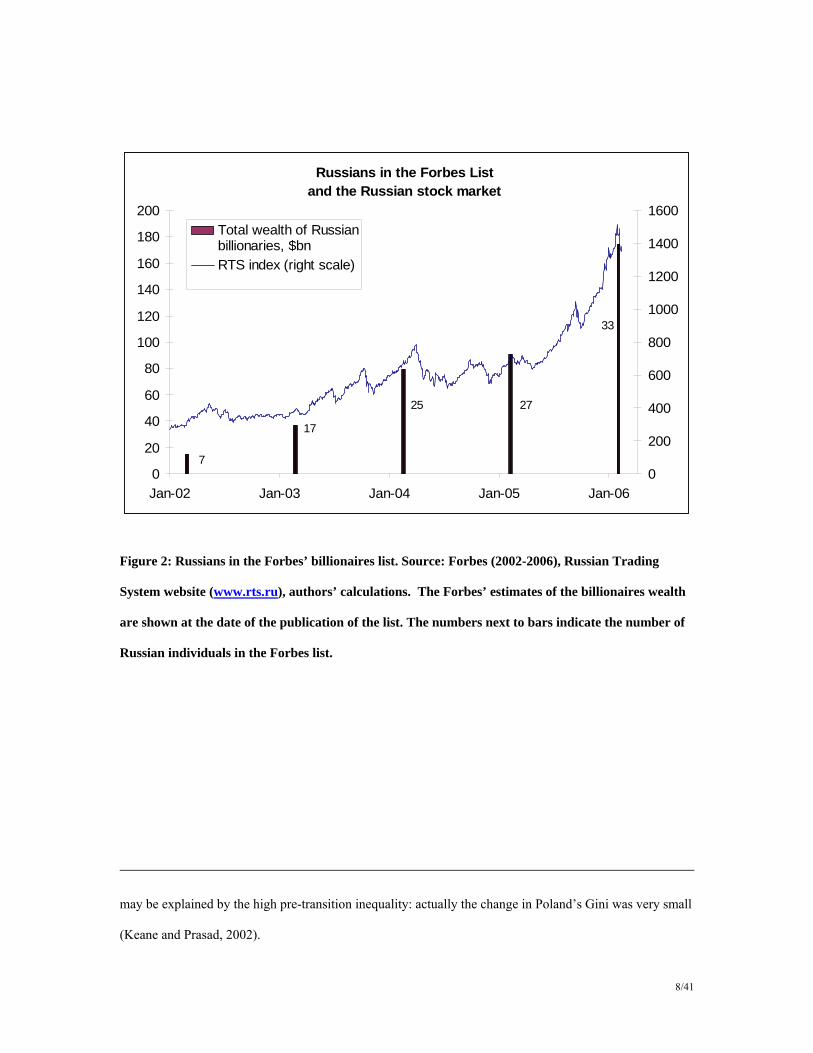
Third, the income inequality is studied and understood very well. Milanovic (1998)
provides a comprehensive analysis of income inequality in transition based on the
comparable data from household surveys in transition. Figure 3 illustrates the variety of
transition experiences in terms of increases in income inequality.7
5 The 2005 World Wealth Report does not provide an estimate of the total wealth of Russian billionaires.
We use the numbers of 544 and 573 billions for the 2002 and 2003 mentioned in the presentation of the
2004 World Wealth Report (Vedomosti, 2004) and extrapolate them for the next year.
6 The World Wealth Report (2005) is based on 2004 data; hence it has to be compared to the Forbes List in
2004 when Russia had 25 billionaires jointly owning $80 billion.
7 This scatterplot is very intuitively divided into three clusters. Within each cluster there is a positive
correlation between levels of income and inequality (interestingly, the relationship between changes in Gini
and per capita is actually negative, Keane and Prasad, 2002). One cluster is the advanced transition
countries except Poland, the other one is the war-torn countries plus resource-rich Russia and
Turkmenistan; other countries are in the third cluster. The fact that Poland is in the intermediate cluster
8/41
Russians in the Forbes List and the Russian stock market
0
20
40
60
80
100
120
140
160
180
200
Jan-02 Jan-03 Jan-04 Jan-05 Jan-060
200
400
600
800
1000
1200
1400
1600Total wealth of Russianbillionaries, $bnRTS index (right scale)
7
25
17
27
33
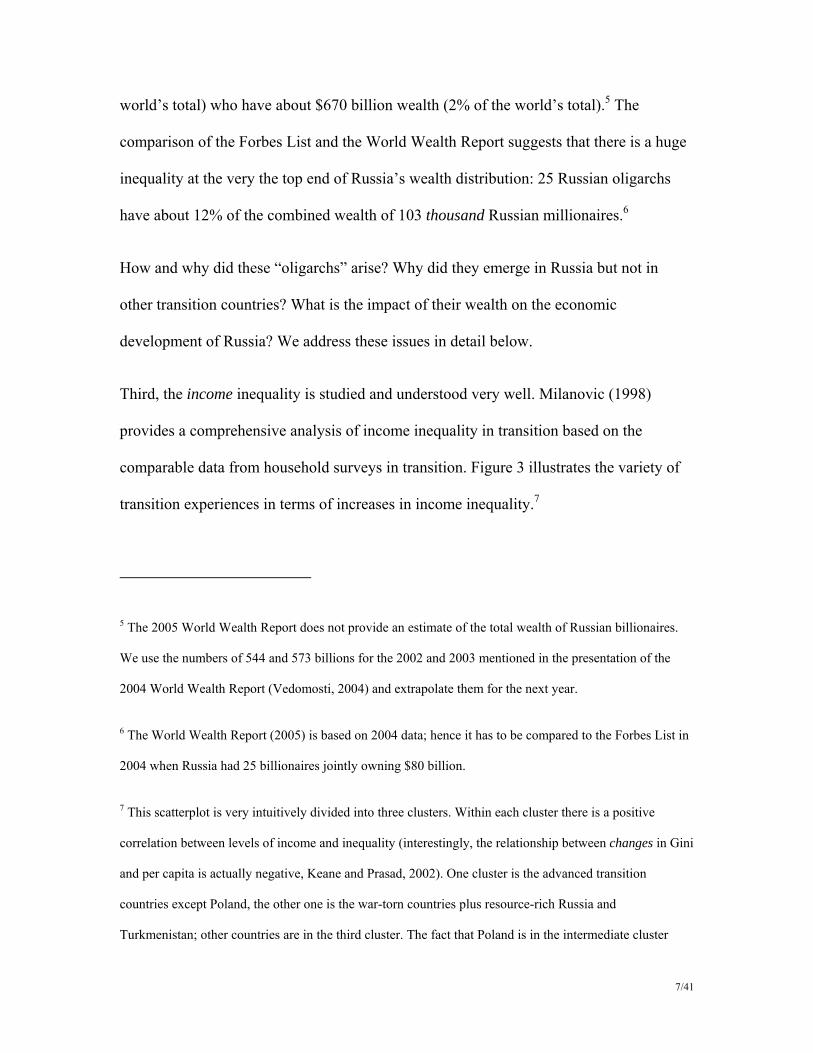
Figure 2: Russians in the Forbes’ billionaires list. Source: Forbes (2002-2006), Russian Trading
System website (www.rts.ru), authors’ calculations. The Forbes’ estimates of the billionaires wealth
are shown at the date of the publication of the list. The numbers next to bars indicate the number of
Russian individuals in the Forbes list.
may be explained by the high pre-transition inequality: actually the change in Poland’s Gini was very small
(Keane and Prasad, 2002).
9/41
Gini
Albania
ArmeniaAzerbaijan
BelarusBulgaria
Croatia
Czech Republic
EstoniaGeorgia
Hungary
Kazakhstan
Kyrgyz Republic
Latvia Lithuania
Macedonia, FYR
Moldova
PolandRomania
Russian Federation
Slovak Republic
Tajikistan
Turkmenistan
Ukraine
Uzbekistan
20
25
30
35
40
45
50
0 2000 4000 6000 8000 10000 12000 14000 16000 18000
GDP per capita, PPP, 2002
Figure 3: Income inequality Gini estimates are made in 1996-2002 period, for most countries in 2000-
2001. Source: World Development Indicators.
Given that prior to transition personal wealth inequality as well as personal wealth per se
were quite low, the current wealth inequality is essentially a function of income
inequality during the transition process. As transition countries are essentially middle
income countries, the poor face a subsistence constraint, so that within each economy, the
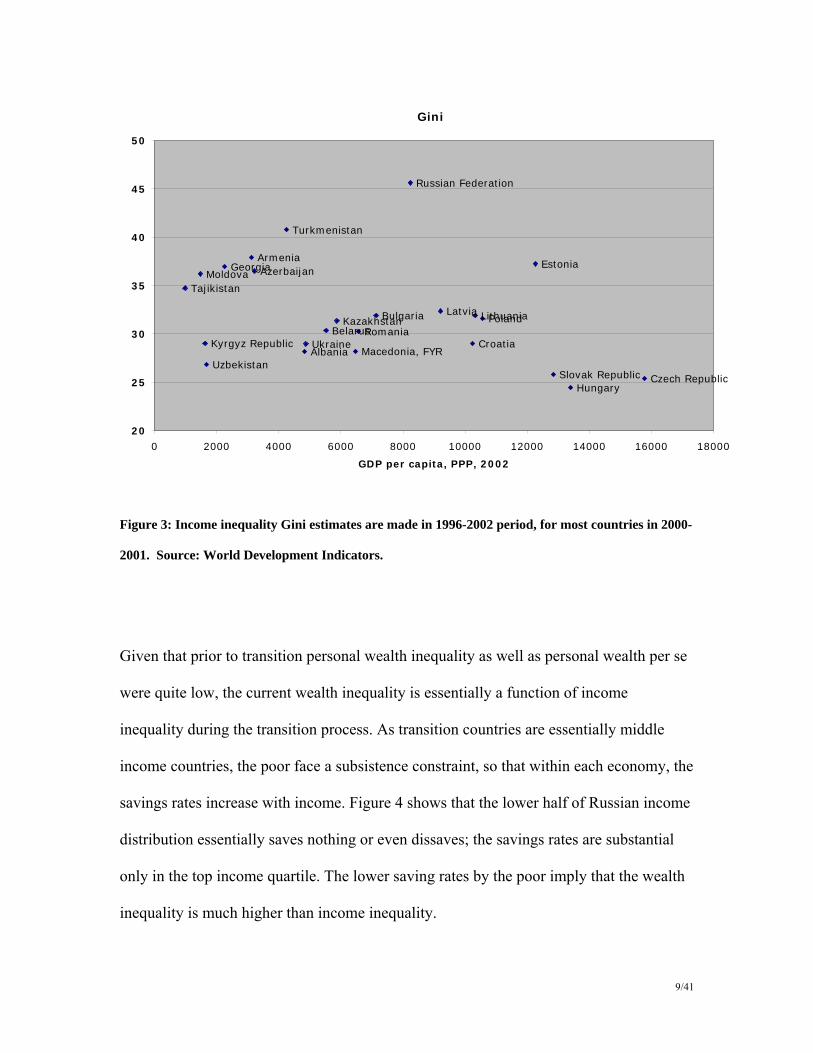
savings rates increase with income. Figure 4 shows that the lower half of Russian income
distribution essentially saves nothing or even dissaves; the savings rates are substantial
only in the top income quartile. The lower saving rates by the poor imply that the wealth
inequality is much higher than income inequality.
10/41
Figure 4: Majority of Russians saved very little or even dissaved during transition. The graph depicts
savings rates (including durables) by income quartiles, based on RLMS survey Rounds V-X (1994-
2001). Source: Foley and Pyle (2005).
This argument is incomplete without taking into account capital gains, in particular those
on the public housing and productive assets transferred to private hands in the course of
transition. While there is no data for such an adjustment, it would probably further
increase the estimated inequality. Indeed, the opportunities to earn higher income would
be higher for individuals, regions, and sectors where such assets are more valuable and
vice versa.
11/41
Initial conditions
Our knowledge of inequality in the socialist economies is highly incomplete. The first
problem is the lack of primary data. The official data have not been collected; so the most
reliable information on inequality has come from the emigrant surveys. Ofer and Vinokur
(1992) have surveyed 1250 Soviet Jewish emigrants to Israel who provided information
on their wealth prior to their decision to emigrate. These surveys suffer from two
important methodological problems. The emigrants are certainly not a representative
sample. Among other things, their decision to emigrate could be linked to their low
wealth (it is therefore not surprising that 58% of emigrants in the survey had no assets at
all!). Ofer and Vinokur recognize these problems and suggest that one should be very
careful interpreting their wealth inequality estimates (indeed, the 0.7-0.8 Gini coefficient
for the wealth distribution obtained by Ofer and Vinokur is strongly influenced by the
large share of assetless migrants).
The other, more important problem is that the pecuniary income/wealth inequality does
not measure the true inequality of living standards in a command economy. First, there
have been many missing markets (including real estate and financial markets). Second,
the real inequality is not in having the wealth but in the ability to use this wealth to buy
goods in shortage at state prices. These were driven by connections which in turn were a
function of one’s standing in the Soviet hierarchy.8 The acuteness of shortage differed
8 See Shleifer and Vishny (1994) for this theory explaining why centrally planned economies needed
shortages to provide incentives.
12/41
geographically. Those residing in larger cities would have access to much better
provision of goods in stores. The mobility was constrained through the system of
residence permits, so that relocation to a large city was a crucial non-monetary incentive.
The factories also were happy to provide the skilled workers with fringe benefits such as
good healthcare and housing (this legacy was still important during transition,
Commander and Schankerman, 1997, Friebel and Guriev, 2005, Juurikkala and Lazareva,
2004).
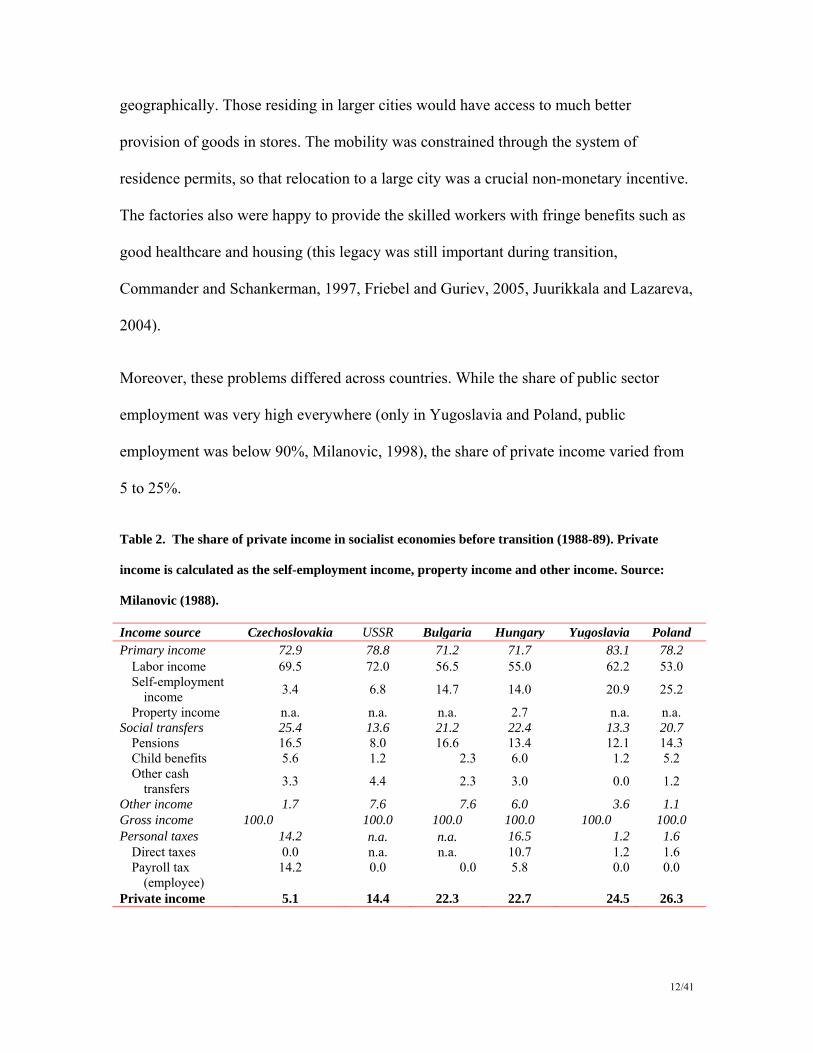
Moreover, these problems differed across countries. While the share of public sector
employment was very high everywhere (only in Yugoslavia and Poland, public
employment was below 90%, Milanovic, 1998), the share of private income varied from
5 to 25%.
Table 2. The share of private income in socialist economies before transition (1988-89). Private
income is calculated as the self-employment income, property income and other income. Source:
Milanovic (1988).
Income source Czechoslovakia USSR Bulgaria Hungary Yugoslavia Poland Primary income 72.9 78.8 71.2 71.7 83.1 78.2
Labor income 69.5 72.0 56.5 55.0 62.2 53.0 Self-employment
income 3.4 6.8 14.7 14.0 20.9 25.2
Property income n.a. n.a. n.a. 2.7 n.a. n.a. Social transfers 25.4 13.6 21.2 22.4 13.3 20.7
Pensions 16.5 8.0 16.6 13.4 12.1 14.3 Child benefits 5.6 1.2 2.3 6.0 1.2 5.2 Other cash
transfers 3.3 4.4 2.3 3.0 0.0 1.2
Other income 1.7 7.6 7.6 6.0 3.6 1.1 Gross income 100.0 100.0 100.0 100.0 100.0 100.0 Personal taxes 14.2 n.a. n.a. 16.5 1.2 1.6
Direct taxes 0.0 n.a. n.a. 10.7 1.2 1.6 Payroll tax
(employee) 14.2 0.0 0.0 5.8 0.0 0.0
Private income 5.1 14.4 22.3 22.7 24.5 26.3
13/41
Reform strategies and inequality
One of the most commonly held beliefs about transition is that the rise of inequality is
due to the reform and to privatization in particular. This argument is especially popular
among the scholars of Russian transition (Stiglitz, 2003) and goes as follows: Russian
reform has channeled state assets into the hand of a few, drastically reduced the
government funding of public goods therefore leaving majority of citizens at or below the
subsistence levels. The existing evidence suggests that the situation is more involved.
First, the income inequality has risen in all transition countries including China and
Vietnam. Second, even in Russia the major increase in inequality occurred prior to
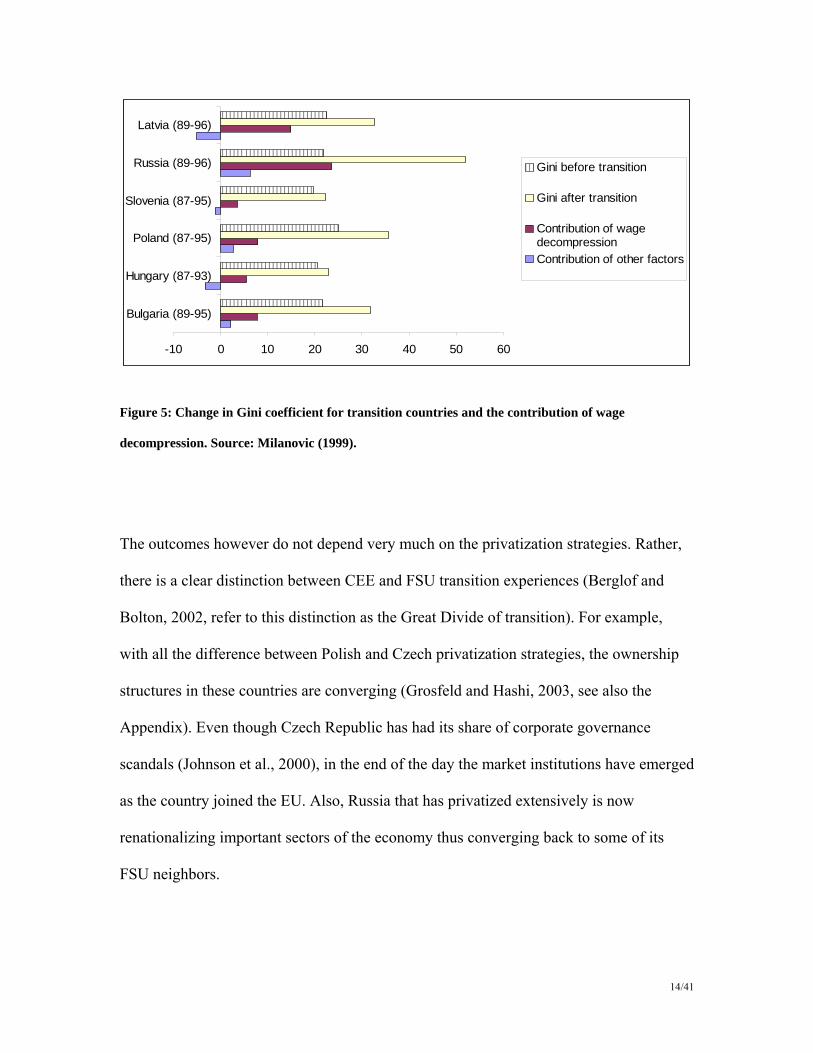
privatization. Third, as shown by Milanovic (1999), most of the increase in income
inequality in postcommunist countries is due to wage decompression. 9
Yet, all of the above refers to the income inequality. The dynamics of wealth inequality
was also driven by the privatization process. Transition countries have chosen very
different privatization strategies (Megginson 2005): some (most importantly, Russia and
Czech Republic) opted for voucher-based mass privatization, others sold in open auctions
allowing foreigners to bid, some sold to insiders, some did not privatize at all.
9 Milanovic’s study ends in mid 1990s but the levels of inequality in transition economies have remained
roughly constant since then.
14/41
-10 0 10 20 30 40 50 60
Bulgaria (89-95)
Hungary (87-93)
Poland (87-95)
Slovenia (87-95)
Russia (89-96)
Latvia (89-96)
Gini before transition
Gini after transition
Contribution of wagedecompressionContribution of other factors
Figure 5: Change in Gini coefficient for transition countries and the contribution of wage
decompression. Source: Milanovic (1999).
The outcomes however do not depend very much on the privatization strategies. Rather,
there is a clear distinction between CEE and FSU transition experiences (Berglof and
Bolton, 2002, refer to this distinction as the Great Divide of transition). For example,
with all the difference between Polish and Czech privatization strategies, the ownership
structures in these countries are converging (Grosfeld and Hashi, 2003, see also the
Appendix). Even though Czech Republic has had its share of corporate governance
scandals (Johnson et al., 2000), in the end of the day the market institutions have emerged
as the country joined the EU. Also, Russia that has privatized extensively is now
renationalizing important sectors of the economy thus converging back to some of its
FSU neighbors.
15/41
The simplest explanation of the Great Divide is the outside anchor of EU accession
available to CEE countries. In these countries, the commitment to reforms was credible,
while the FSU there has always been a fear of reversal and expropriation; the risk did
materialize in Russia, Belarus, and some other countries. This has determined the choice
of reform strategies. In order to provide demand for market institutions, reformers had to
create a critical mass of private owners, and do that quickly. While the voucher
privatization is suboptimal in terms of efficiency (Megginson, 2005), it had to be
implemented to make the reforms irreversible.10 On the other hand, as reformers did
realize already in the beginning of reforms and as the empirical research on privatization
showed later (Guriev and Megginson, 2006), privatization works better in the presence of
complementary reforms of market and state institutions. Therefore the reformers faced a
chicken-and-egg problem. In Russia, they chose to launch a rapid mass privatization to
transfer tens of thousands of industrial enterprises to private hands (usually to
incumbents) within the course of a couple of years.11
Initially, the assets were owned by tens of millions of Russians, but the ownership
quickly consolidated. As the market institutions were underdeveloped, there were huge
10 The risk of policy reversal was the major factor for not adopting China’s gradualist approach. The re-
nationalization of a few key enterprises in 2004-05 implies that this risk was and still is very tangible.
Unfortunately for the reformers, the rise in inequality due to hasty privatization has only strengthened
public support for policy reversal.
11 Beck and Laeven (2006) show that the institutional challenges were especially important in transition
countries with natural resources and with many years under communism. Russia has both.
16/41
“institutional economies of scale” – large owners have been able to influence the rules of
the game through capturing regulators, courts and legislatures (Glaeser et al., 2003,
Sonin, 2003, Hellman et al., 2002, Slinko et al., 2005). Hence the shares changed hands
from workers and retired workers to managers or outside majority owners.12
The next wave of privatization was the so-called loans-for-shares program. This program
was designed to overcome the parliament-imposed ban on privatization of mining
industries. The government did not sell the assets; rather, government borrowed cash
from private banks using the assets as collateral; as the government never intended to pay
back, the assets were actually transferred to the bankers. As the auctions were run by the
banks themselves, they were rigged and the assets were privatized at a small fraction of
their market value (Freeland, 2000).13
Both loans-for-shares privatization and post-voucher-privatization consolidation of
ownership resulted in an emergence of a few large business groups each owned by
handful of entrepreneurs known as oligarchs.
12 One of the important factors in this process was the spread of wage arrears in Russia in mid 1990s (Earle
and Sabirianova, 2002). As workers were not paid wages in time, they were desperate to get cash and sold
their shares at very low prices.
13 The important factor was the 1996 presidential elections; loans-for-shares helped Yeltsin enlist support of
the bankers (future oligarchs) as these assets would remain their property only in case of Yeltsin’s victory.
17/41
Oligarchs
According to Plato, “oligarchy” is a form of government by a small group; Plato
distinguished oligarchs from nobles as the latter are few but rightful rulers while
oligarchs come to power unlawfully. In its current meaning in Russia, the term “oligarch”
denotes a large businessman who controls sufficient resources to influence rules of the
game – politics, regulation, and judiciary – to further their fortunes.
As mentioned above, transition has created oligarchs in Russia but not in other
postcommunist countries. Russia differs from other transition countries in several
important respects. First, it holds vast natural resources (see Fig. 1) which creates
enormous potential for rent-seeking. Second, unlike the CEE countries, it has spent more
time under communism; it was therefore more difficult to rebuild market institutions (no
Russian had any memory of living in a capitalist economy). Besides, Russia did not have
an outside anchor such as EU accession that has created commitment to building these
institutions in the CEE. Third, Russia has undertaken a democratic and decentralized path
of political reform which allowed for private agents to build their estates independent of
the rulers. The latter factor is important for understanding the difference between Russia
on one hand and authoritarian post-Soviet regimes, on the other. While the latter have
successfully eliminated all private oligarchs, it is not clear how much wealth has been
amassed by the rulers themselves. Due to the oppression of free press, such data are not
18/41
available but even the sketchy evidence suggests that the post-Soviet authoritarian rulers
are rich enough to be considered the “ultimate oligarchs” within their own countries. 14
These distinguishing features of Russia’s economy have predetermined the emergence of
Russian oligarchs. While the conventional wisdom is that the Russian oligarchs were
created by the loans-for-shares scheme discussed above, this is only a part of the picture.
Indeed, among the 22 business groups listed in the Table 3, only 3 (led by Potanin,
Abramovitch and Khodorkovsky) owe their fortunes to this particular event as they – the
young bankers – have used the loans-for-shares auctions to acquire the crown jewels of
the mining industry. Two more oligarchs – then industry incumbents Bogdanov and
Alekperov – have used loans-for-shares to reinforce their control over their own
enterprises. Others have risen through voucher privatization or through purchasing
privatized firms from incumbents.15 Moreover, the first list of omnipotent tycoons of
14 One of the most liberal of these rulers, Kazakh President Nursultan Nazarbayev has allegedly tunneled at
least 1 billion dollars of oil export revenues to one of his private accounts; his family controls many other
key enterprises in the country (Kramner and Norris, 2005, Hiatt, 2005). Another common example is
Ukraine where three groups (those of Taruta, Akhmetov and Pinchuk) have become the pillars of President
Kuchma’s regime (not surprisingly, Kuchma is Pinchuk’s father-in-law) and did suffer a certain fallout
after Orange Revolution of 2004. Gorodnichenko and Grygorenko (2005) list 13 Ukrainian oligarchs
(including Pinchuk, Ahmetov and Taruta) who jointly control about 40% of the Ukrainian economy. Yet
only three of them – the very same Pinchuk, Ahmetov and Taruta – showed up in the Forbes list.
15 Guriev, Rachinsky, and Zhuravskaya (2006) track all the private Russian owners in the World Bank’s
(2004) dataset and find that 42% Russian firms were controlled in 2003 by owners who were industry
19/41
Russia – so called “Berezovsky’s Group of Seven” (FT 1996) included four businessmen
who actually lost all loans-for-shares tenders they took part in.
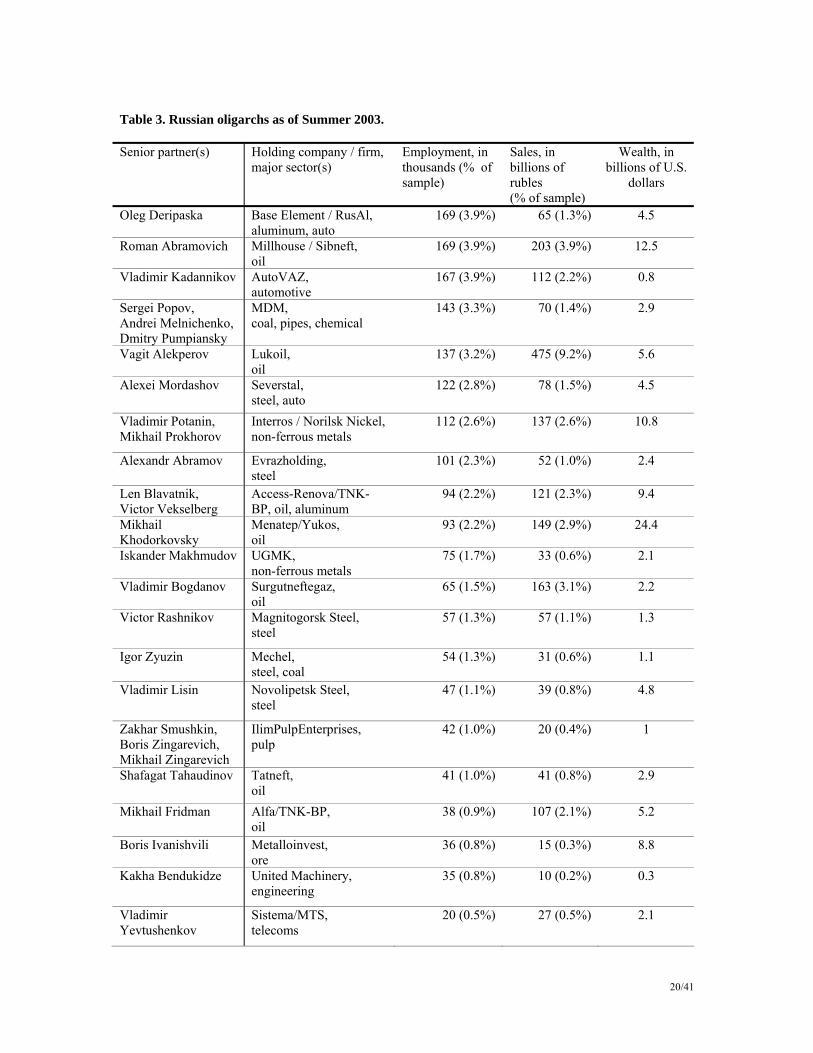
Table 3 is borrowed from Guriev and Rachinsky (2005) who used a unique dataset on
ownership of Russian industry in 2003 to classify the largest owners as oligarchs. In their
sample covering about 75% of Russian industry, the 22 oligarchs control about 40% of
sales and employment. It is therefore not surprising to see astonishing estimates of their
personal wealth in the Forbes list.
What do we know about Russian oligarchs? First, they do control enterprises in natural
resource industries and in protected industries such as automotive (Guriev and
Rachinsky, 2005). Their market shares in the industries that they control are very large.
Yet, it should not be a concern for the antitrust policy as almost all of these industries
produce globally tradable goods. What is more important is the “political antitrust”
(Rajan and Zingales, 2003) – policies restricting the state capture by the large influential
business groups. Even though the oligarchs are small in the global economy, they have a
huge weight within Russia.
insiders at the beginning of transition; 48% of the firms are controlled by owners who have served in high
government positions at some point in 1990s. The preliminary evidence in this paper suggests that while
political connections help to get better assets, the politically-connected owners are less efficient owners in
terms of productivity growth.
20/41
Table 3. Russian oligarchs as of Summer 2003.
Senior partner(s) Holding company / firm, major sector(s)
Employment, in thousands (% of sample)
Sales, in billions of rubles (% of sample)
Wealth, in billions of U.S.
dollars
Oleg Deripaska Base Element / RusAl, aluminum, auto
169 (3.9%) 65 (1.3%) 4.5
Roman Abramovich Millhouse / Sibneft, oil
169 (3.9%) 203 (3.9%) 12.5
Vladimir Kadannikov AutoVAZ, automotive
167 (3.9%) 112 (2.2%) 0.8
Sergei Popov, Andrei Melnichenko, Dmitry Pumpiansky
MDM, coal, pipes, chemical
143 (3.3%) 70 (1.4%) 2.9
Vagit Alekperov Lukoil, oil
137 (3.2%) 475 (9.2%) 5.6
Alexei Mordashov Severstal, steel, auto
122 (2.8%) 78 (1.5%) 4.5
Vladimir Potanin, Mikhail Prokhorov
Interros / Norilsk Nickel,non-ferrous metals
112 (2.6%) 137 (2.6%) 10.8
Alexandr Abramov Evrazholding, steel
101 (2.3%) 52 (1.0%) 2.4
Len Blavatnik, Victor Vekselberg
Access-Renova/TNK-BP, oil, aluminum
94 (2.2%) 121 (2.3%) 9.4
Mikhail Khodorkovsky
Menatep/Yukos, oil
93 (2.2%) 149 (2.9%) 24.4
Iskander Makhmudov UGMK, non-ferrous metals
75 (1.7%) 33 (0.6%) 2.1
Vladimir Bogdanov Surgutneftegaz, oil
65 (1.5%) 163 (3.1%) 2.2
Victor Rashnikov Magnitogorsk Steel, steel
57 (1.3%) 57 (1.1%) 1.3
Igor Zyuzin Mechel, steel, coal
54 (1.3%) 31 (0.6%) 1.1
Vladimir Lisin Novolipetsk Steel, steel
47 (1.1%) 39 (0.8%) 4.8
Zakhar Smushkin, Boris Zingarevich, Mikhail Zingarevich
IlimPulpEnterprises, pulp
42 (1.0%) 20 (0.4%) 1
Shafagat Tahaudinov Tatneft, oil
41 (1.0%) 41 (0.8%) 2.9
Mikhail Fridman Alfa/TNK-BP, oil
38 (0.9%) 107 (2.1%) 5.2
Boris Ivanishvili Metalloinvest, ore
36 (0.8%) 15 (0.3%) 8.8
Kakha Bendukidze United Machinery, engineering
35 (0.8%) 10 (0.2%) 0.3
Vladimir Yevtushenkov
Sistema/MTS, telecoms
20 (0.5%) 27 (0.5%) 2.1
21/41
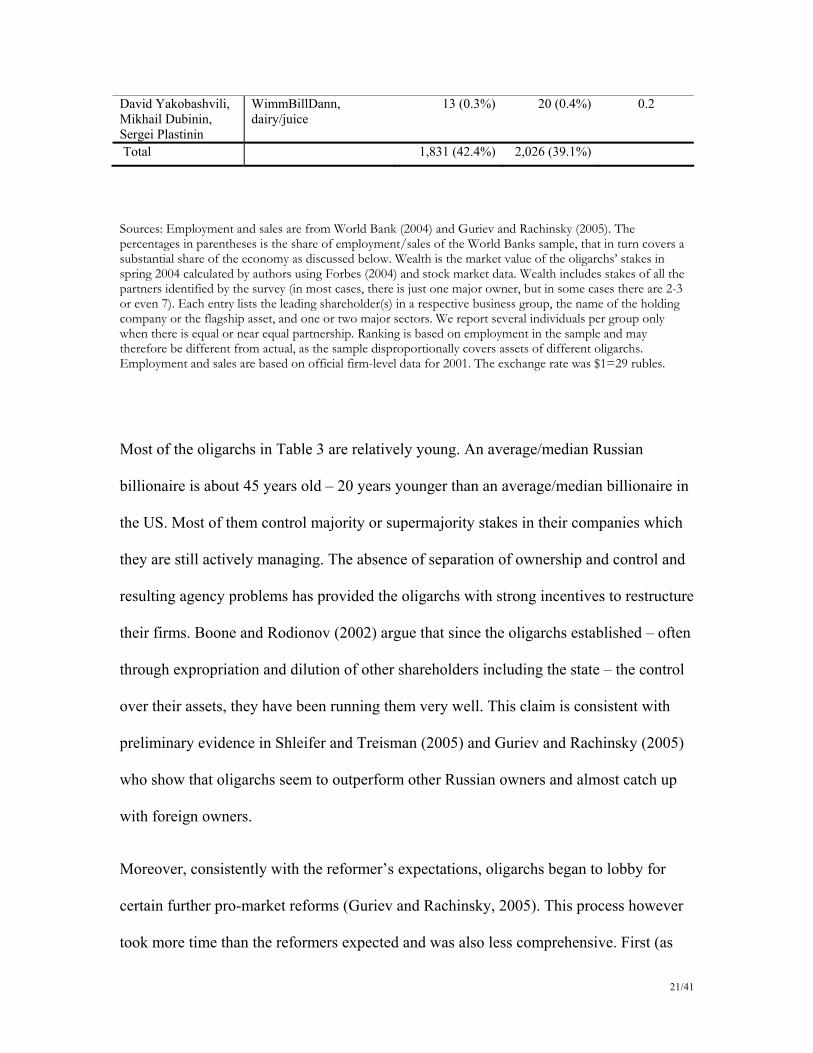
David Yakobashvili, Mikhail Dubinin, Sergei Plastinin
WimmBillDann, dairy/juice
13 (0.3%) 20 (0.4%) 0.2
Total 1,831 (42.4%) 2,026 (39.1%)
Sources: Employment and sales are from World Bank (2004) and Guriev and Rachinsky (2005). The percentages in parentheses is the share of employment/sales of the World Banks sample, that in turn covers a substantial share of the economy as discussed below. Wealth is the market value of the oligarchs’ stakes in spring 2004 calculated by authors using Forbes (2004) and stock market data. Wealth includes stakes of all the partners identified by the survey (in most cases, there is just one major owner, but in some cases there are 2-3 or even 7). Each entry lists the leading shareholder(s) in a respective business group, the name of the holding company or the flagship asset, and one or two major sectors. We report several individuals per group only when there is equal or near equal partnership. Ranking is based on employment in the sample and may therefore be different from actual, as the sample disproportionally covers assets of different oligarchs. Employment and sales are based on official firm-level data for 2001. The exchange rate was $1=29 rubles.
Most of the oligarchs in Table 3 are relatively young. An average/median Russian
billionaire is about 45 years old – 20 years younger than an average/median billionaire in
the US. Most of them control majority or supermajority stakes in their companies which
they are still actively managing. The absence of separation of ownership and control and
resulting agency problems has provided the oligarchs with strong incentives to restructure
their firms. Boone and Rodionov (2002) argue that since the oligarchs established – often
through expropriation and dilution of other shareholders including the state – the control
over their assets, they have been running them very well. This claim is consistent with
preliminary evidence in Shleifer and Treisman (2005) and Guriev and Rachinsky (2005)
who show that oligarchs seem to outperform other Russian owners and almost catch up
with foreign owners.
Moreover, consistently with the reformer’s expectations, oligarchs began to lobby for
certain further pro-market reforms (Guriev and Rachinsky, 2005). This process however
took more time than the reformers expected and was also less comprehensive. First (as
22/41
Glaeser et al., 2003 and Sonin, 2003, suggested), oligarchs originally benefited from
continued rent-seeking. Second, unlike robber barons in the USA, Russian oligarchs are a
part of a globalized economy (a few oligarchs from the Table 2 live in London, most
prominently Roman Abramovic), hence their commitment to building long-term security
of property rights in Russia is rather limited.
The oligarchs’ incentives are also weakened by the insecurity of their property rights. A
median Russian voter deems oligarchs’ property rights illegitimate and supports their
expropriation (see a discussion of poll data in Guriev and Rachinsky, 2005, and
Vedomosti, 2003b). This is well understood by all Russian politicians who use the threat
of expropriation to obtain political or pecuniary contributions from the oligarchs. In
particular, President Putin has used the anti-oligarch sentiment in his campaign in 2000;
once he came to power in, he offered the oligarchs the following pact. As long as the
oligarchs paid taxes and did not use their political power (at least not against Putin), Putin
would respect their property rights and refrain from revisiting privatization. This pact
defined the ground rules of oligarchs’ interaction with central and regional government
for Putin’s first term (2000-2004). Although the pact could have never been written
down, even general public was well aware of its existence. A poll by FOM (an
independent nonprofit Russian polling organization) a week after the meeting of Putin
and the oligarchs showed that 57 percent Russians knew about it.
Putin proved the credibility of the expropriation threat in 2003, when the prominent
oligarch Mikhail Khodorkovsky, the majority owner of the Yukos oil company, deviated
from the pact by openly criticizing corruption in Putin’s administration (Moscow Times,
2003) and supporting opposition parties and independent media (Vedomosti, 2003a). He
23/41
and his partners were soon arrested or forced into exile, and their stakes in Yukos
expropriated. Khodorkovsky was sentenced to 8 years in prison, and his personal estate is
now estimated to be only 2 billion dollars (down from 15 billion dollars).
The Yukos affair has clarified the rules of the game between oligarchs and the Kremlin.
Oligarchs have learned the risks related to violating the pact, and so in the future, they
will be less likely to interfere in national politics. Ironically, by crushing Russia’s most
transparent company, Putin has pursued the “political antitrust” policy that was crucial in
building the U.S. democracy and economy in the beginning of twentieth century (Rajan
and Zingales, 2003). Even though oligarchs remain economically powerful, they have no
longer any role in politics. This in turn removed any counterweights to bureaucracy
which then followed a steady course for re-nationalization. The nationalization occurs
through buyout of oligarch firms by state-owned companies. In some cases, the oligarchs
receive a large share of their assets’ market value, in others just a fraction.16 Therefore
any wealth estimate based on the assets’ market value (as those provided by Forbes) may
substantially overestimate the true wealth of the oligarchs; the wealth depends both on
the value of the assets and on the relationship with the government.
16 As the threatpoint is the full expropriation, one should expect that even if assets are acquired by the state
at the market value, the seller is asked to make substantial side payments. A prominent Russian journalist
Yulia Latynina suggests that this was the case in the purchase of Sibneft from Abramovich (Echo Moskvy,
March 11, 2006, www.echo.msk.ru/programs/code/42280).
24/41
In the next year or two the nationalization of the key oligarch-controlled assets will
continue. At the time of writing the paper, 4 out of 22 groups in the Table 3 are
nationalized (Abramovich’s Sibneft, the main division of Khodorkovsky’s Yukos,
Kadannikov’s Avtovaz, Bendukidze’s UMZ) and 2-3 more nationalizations are being
discussed. Given the notorious inefficiency and corruption of Russian bureaucracy, these
companies will eventually have to be reprivatized. If they are privatized in an open and
competitive fashion, the public will respect the new owners’ property rights which will in
turn result in efficient incentives to invest.
Yet another option is to reprivatize these companies to dispersed owners. This will
provide Russian middle class with a stake in the financial development and economic
growth and even increase their personal wealth. As shown in Megginson (2005),
privatization IPOs are usually underpriced by about 30%. Yet, if government fails to
enforce post-IPO corporate governance, the dispersed owners may fail to reap the value
of their investment.
Whether a direct sale to a strategic investor or share issue privatization (SIP) is selected
or the two approaches are combined is yet to be seen. In principle, these companies are
sufficiently large so that SIPs may be more efficient (Megginson, 2005). The
management of the state owned companies is biased towards SIP – indeed, if they have
stakes in their companies, they would rather benefit from a liquid market where they can
cash in. They will also be better-off under dispersed ownership as there will be less
shareholder monitoring so they will preserve the private benefits of control.
25/41
However, the most important choice is not the one of the method of privatization but
about the government’s commitment to transparent rules of reprivatization.17 If the
privatization auctions/IPOs are rigged again, the new buyers will benefit in the short
term, but the vicious circle of illegitimate property rights will result in another
expropriation. This may create a stable equilibrium like in Acemoglu and Robinson
(2001): high wealth inequality breeds support for expropriation, but as political
institutions are underdeveloped, the redistribution benefits the bureaucrats (who become
the new rich) rather than the poor; therefore high inequality may persist for quite a while.
Measuring inequality in the presence of superrich individuals:
evidence from Moscow income tax data
Given the presence of a score of billionaires and another 0.2% households of millionaires
in Russia, one has to question the reliability of the Gini indices that are obtained through
household surveys. Indeed, all the estimates of Gini for Russia are based on surveys of
households that probably include none of the millionaires. As these superrich own a
17 A reprivatization of Krivoryzhstal in Ukraine provide an important illustration of the argument (Kramer
and Timmons, 2005). In 2004, this crown jewel of Ukrainian steel industry was privatized to two out of
three most influential Ukrainian oligarchs at $0.85 billion. The public outrage over the rigged auction was
one of the important drivers of the Ukrainian “Orange Revolution”. The new government cancelled the
privatization of the plant and resold it in an open tender for $4.8 billion to a leading global player. The high
price and the transparency of the auction have secured public support for the property rights.
26/41
substantial share of the national wealth, including them should change the Gini estimates
significantly.18
In order to check the potential bias in Gini data, we looked at a database that describes
income (albeit not wealth) of all Moscow residents including most of the Russian
billionaires in Table 3 and probably many of the 88,000 millionaires (the number of
millionaires in Russia in 2004 according to World Wealth Report, 2005). This is the
database of 2004 income tax paid by and/or withheld on behalf of all Moscow residents
built by Moscow tax inspections and leaked to the public domain.19
The database contains more than 9 million entries; there can be several entries per person
in case the person received income from multiple sources. We have concentrated on labor
income as the other income categories are negligible; 20 in any case, including them
would further increase our estimate for Gini. Russian Tax Code provides incentives to
distribute profits as wage payments to owners (the corporate profit tax is 24%, while the
personal income tax is 13% and the social payments by employers are regressive
reaching 2% marginal rates for wages above $20,000 a year). After adding all labor
18 World Bank (2006) estimates that if the rich were included into household surveys in Azerbajan, Gini
would go up from 0.20 to 0.45-0.55.
19 Vedomosti (2005) discusses the authenticity of the database.
20 The only exception is the “income from selling securities” category. These however turned out to be a
proxy for financial intermediation – the highest incomes in this category included only brokerage house
owners and employees.
27/41
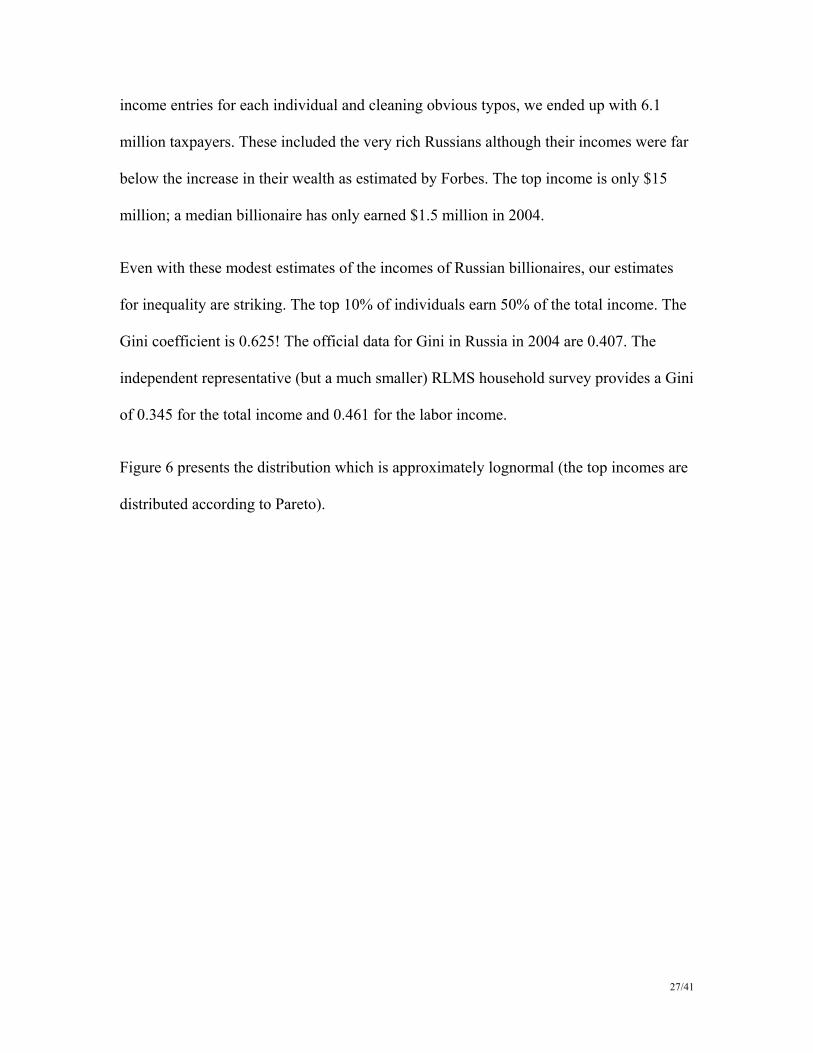
income entries for each individual and cleaning obvious typos, we ended up with 6.1
million taxpayers. These included the very rich Russians although their incomes were far
below the increase in their wealth as estimated by Forbes. The top income is only $15
million; a median billionaire has only earned $1.5 million in 2004.
Even with these modest estimates of the incomes of Russian billionaires, our estimates
for inequality are striking. The top 10% of individuals earn 50% of the total income. The
Gini coefficient is 0.625! The official data for Gini in Russia in 2004 are 0.407. The
independent representative (but a much smaller) RLMS household survey provides a Gini
of 0.345 for the total income and 0.461 for the labor income.
Figure 6 presents the distribution which is approximately lognormal (the top incomes are
distributed according to Pareto).
28/41
Figure 6. The distribution of annual income in Moscow based on income tax data. The horizontal
axis: ln(income) where income is in rubles; the exchange rate was 29 rubles/dollar.
The gap between the survey-based estimates and the ones we derive from the income tax
data is actually larger as Moscow compares favorably to the rest of Russia in terms of
poverty. There are no official regional estimates of inequality in Russia, and RLMS is not
regionally representative.21 We have used the National survey of household budgets and
21 Russian Statistics Agency (Rosstat, formerly Goskomstat) publishes regional Gini coefficients but the
methodology is at best problematic. Goskomstat assumes that the true distribution is lognormal, and
calculate the distribution’s parameters using median and mean from regional household surveys. The
Median $2,000 Mean $4,000
Subsistence level $1,000
29/41
access to social services (NOBUS). NOBUS was conducted in 2003 and covered about
117 thousand individuals in 79 regions. NOBUS is both nationally and regionally
representative. In Moscow NOBUS includes 2100 respondents out of which 1139
provided information on their labor income. As expected this survey does not cover the
top income quantiles of Muscovites. The median income in NOBUS is the same as in the
tax data, but the mean is substantially lower. The top NOBUS income would be in the
richest 2% in the tax data, however, already the second richest NOBUS respondent is
only at the top 10% of the tax data. Therefore it is not surprising that NOBUS estimate
for Gini is only 0.279.
One of the potential problems with the tax data is that there may be a much higher degree
of income underreporting at the lower end of the distribution rather at the top end. In
order to provide a very conservative lower bound for our estimate, we replaced all
income below the minimum living standard (about $2.7 a day) with the minimum living
standard. Even in this case (which assumes away any poverty in Moscow) we obtain a
Gini coefficient of 0.563.
median and mean are also adjusted to account for the gap between survey-based and macroeconomic-
accounts-based aggregate incomes. Interestingly, this methodology does result in a very high Gini for
Moscow close to ours; but Moscow is even more problematic as it stands out in Goskomstat methodology
as the only region for which Goskomstat adjusts the distribution manually by assigning weights that are
somewhat arbitrary. We are grateful to Goskomstat and to Ruslan Yemtsov for describing this methodology
to us.
30/41
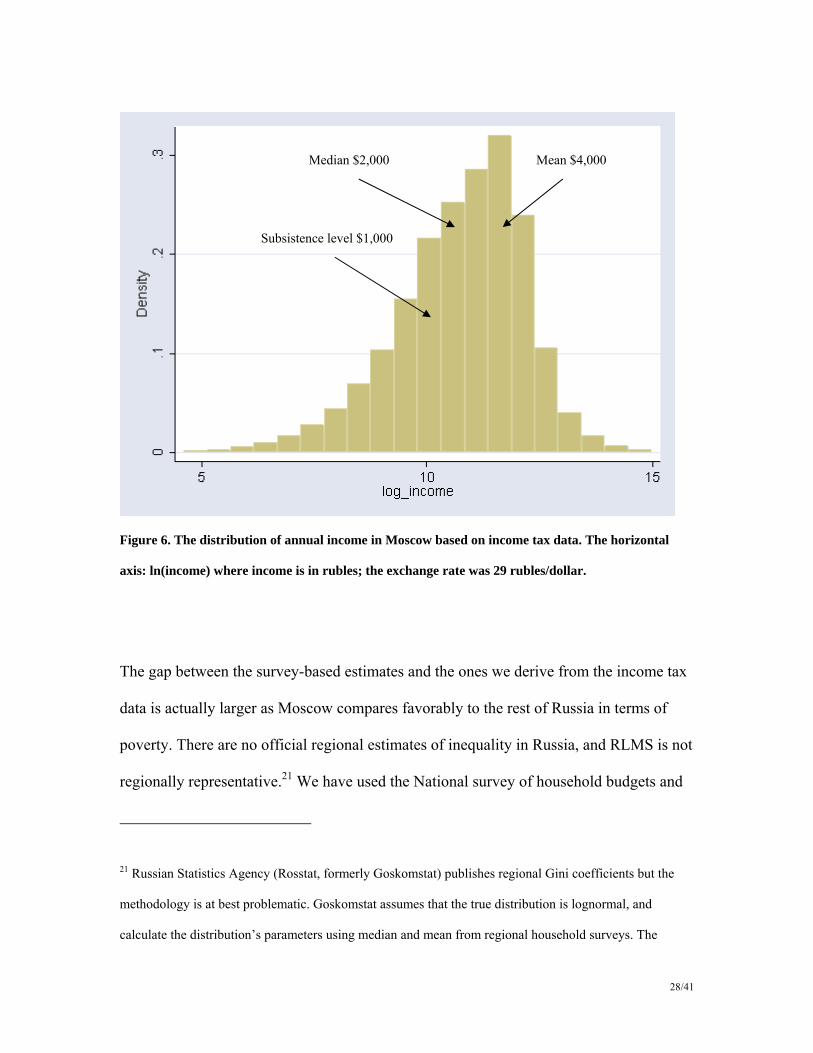
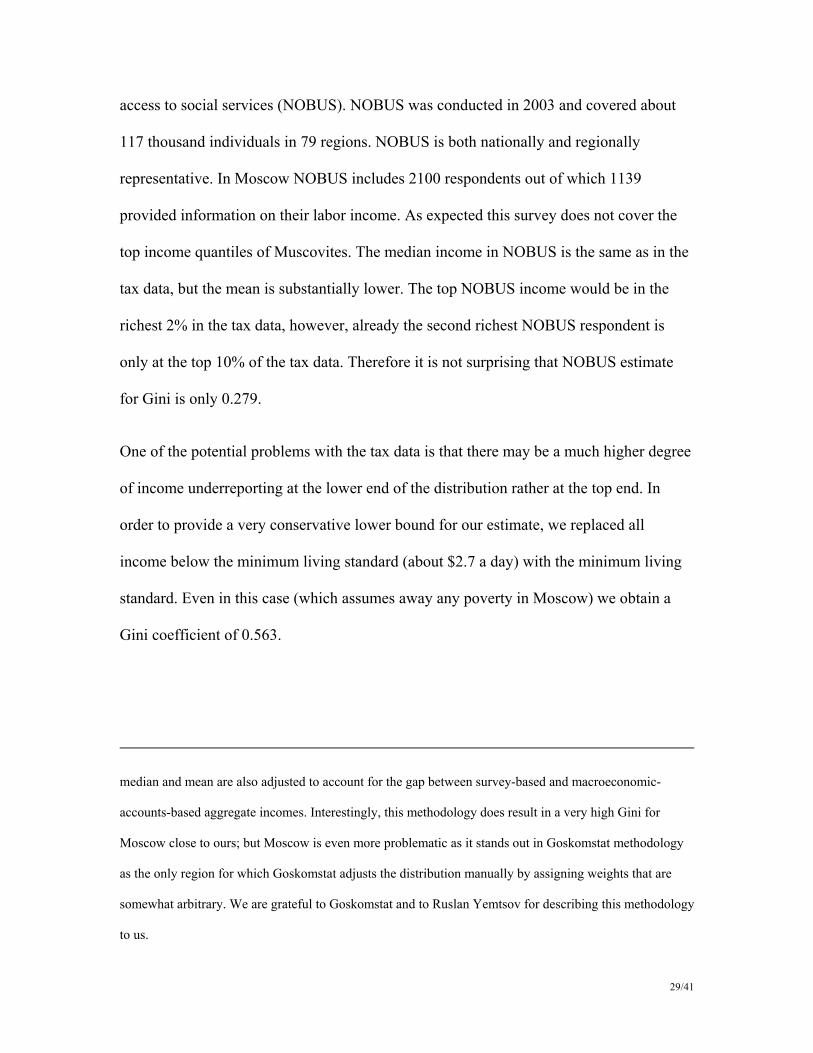
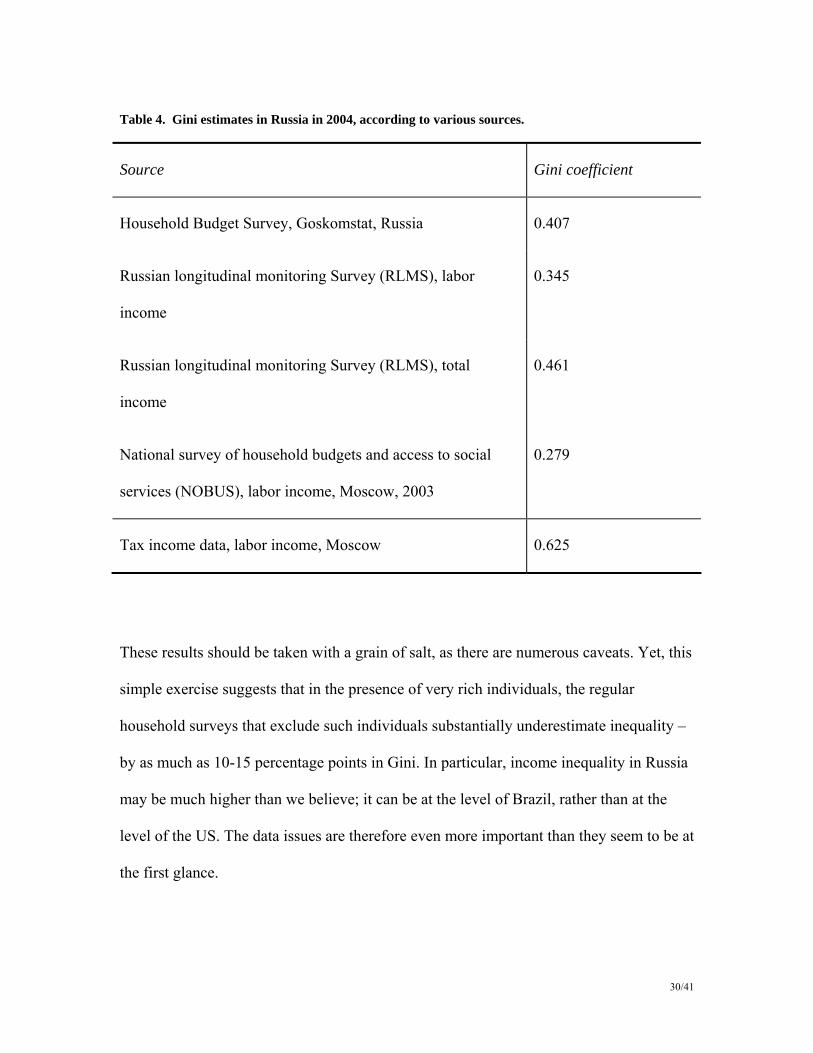
Table 4. Gini estimates in Russia in 2004, according to various sources.
Source Gini coefficient
Household Budget Survey, Goskomstat, Russia 0.407
Russian longitudinal monitoring Survey (RLMS), labor
income
0.345
Russian longitudinal monitoring Survey (RLMS), total
income
0.461
National survey of household budgets and access to social
services (NOBUS), labor income, Moscow, 2003
0.279
Tax income data, labor income, Moscow 0.625
These results should be taken with a grain of salt, as there are numerous caveats. Yet, this
simple exercise suggests that in the presence of very rich individuals, the regular
household surveys that exclude such individuals substantially underestimate inequality –
by as much as 10-15 percentage points in Gini. In particular, income inequality in Russia
may be much higher than we believe; it can be at the level of Brazil, rather than at the
level of the US. The data issues are therefore even more important than they seem to be at
the first glance.
31/41
Policy issues
Is there a simple solution for the wealth inequality problem? Given high corruption (often
driven by the very same inequality), redistribution does not necessarily benefit the poor.
And unless the corruption is reined in, the expropriation of oligarchs will only create new
oligarchs. It is therefore crucial to remove the fundamental cause of growth in wealth
inequality: the “institutional economies of scale”. As the market and government
institutions are underdeveloped, the rich have an advantage in furthering their riches
while the poor are denied opportunity. The transition countries should therefore focus on
providing equal access to education and healthcare,22 to the judiciary system and to
financial markets.
The institutional reforms of the kind require government’s commitment. Unfortunately,
commitment to reform is in turn harder to assure in unequal societies; high wealth
inequality reduces stability of economic policy in both democratic and authoritarian
regimes (in the latter, the stability of the regime itself is undermined). In the CEE
countries, such commitment is provided by the outside anchor of the EU accession and
most of the preconditions for reducing the inequality are already in place.
CIS countries have mostly lagged behind the accession countries in terms of building
market institutions, albeit to varying extent. The list of institutions to be introduced is
22 In this respect, the transition countries, especially the CIS, are yet to make the turnaround (World Bank
2005b). The access to public goods, to quality education and healthcare is still not improving after a decline
in the beginning of transition, and the situation is especially dire for the poor.
32/41
long. First, the households have to have access to savings, investment, credit and
insurance. For this, government should support competition in the financial markets, but
also introduce prudential regulation, regulation of stock market, credit history bureaus,
deposit insurance system. Second, property rights for real estate should be established
and the real estate market should be efficient. This is a major innovation for
postcommunist countries and it requires an overhaul of legislation and creation of a land
registry. Third, government should protect the property rights of entrepreneurs – both
from private racket and from predation from its own corrupt bureaucrats.
Every CIS country has made some of the steps above and none has completed all of
them. It is probably going to take more time than the reformers envisioned in the
beginning of transition. While these institutions benefit the median voter, the problem is
that in some of these countries the democratic transition is stifled or even reversed. Hence
the policy choices may be biased in favor of the ruling elite which is happy to continue
redistribution from the middle class. Moreover, reducing the wealth inequality may
empower the middle class and therefore endanger the power of the entrenched elites.
Thus it remains to be seen whether and how CIS countries manage to break out from the
high inequality trap.
Conclusions
Given the lack of reliable data on personal wealth, it is hard to speculate on the evolution
of personal wealth and of wealth inequality in transition countries. Yet, the indirect
evidence points to a stark increase both in average personal wealth and in wealth
inequality, especially in the former Soviet Union. While much of the income inequality is

33/41
explained by the wage decompression, the wealth inequality was in many cases driven by
privatization and subsequent consolidation of ownership. In particular, in Russia, the
transition resulted in an emergence of a new class of rich individuals. While these
“oligarchs” have restructured their companies and lobbied for further pro-market reforms,
the median voter’s perception of their illegitimacy has undermined the government’s
incentive to continue reforms. It is therefore not surprising that in Russia, as well as in the
other CIS countries, inequality has remained high and reforms – that could eventually
bring it down – have been abandoned or even reversed. On the other hand, in the CEE
countries, the outside anchor of EU accession has provided the governments with a
commitment device to introduce institutions for greater equality of opportunity.
Like every paper on wealth inequality, ours concludes with restating the obvious need for
more data. To illustrate the sheer extent of potential mismeasurement, we have estimated
Gini index for income using the only database that includes Russia’s superrich
individuals; we found that the official data may underestimate Gini by about 25
percentage points. The wealth inequality data are probable even more distorted. An
informed policy debate can only be based on reliable and comparable data on personal
wealth coming from representative household surveys which would indeed include some
very rich individuals. Unfortunately, such data are still non-existent.
34/41
References
Alexeyev, Michael and William Pyle (2003). “A Note on Measuring the Unofficial
Economy in the Former Soviet Republicsю” Economics of Transition vol. 11, No.
1, pp. 153-175.
Banerjee, Abhijit, and Andrew Newman (1993). “Occupational Choice and the Process of
Development.” Journal of Political Economy, 101, 274-298.
Beck, Thorsten. and Luc Laeven (2006) “Institution Building and Growth in Transition
Economies.” CEPR Discussion Paper No. 5718, London.
Berglof, Erik, and Patrick Bolton (2002) “The Great Divide and Beyond: Financial
Architecture in Transition” (in Symposium: Transition Economies) The Journal of
Economic Perspectives, Vol. 16, No. 1. pp. 77-100.
Boone, Peter, and Denis Rodionov (2002). “Rent seeking in Russia and the CIS”
Brunswick UBS Warburg, Moscow.
Commander, Simon, and Mark Schankerman (1997). “Enterprise Restructuring and
Social Benefits.” Economics of Transition 5(1), 1–24.
Davies, James, and Anthony Shorrocks (2005). “Wealth Holdings in Developing and
Transition Countries.” Paper for the Luxembourg Wealth Study (LWS)
conference on “Construction and Usage of Comparable Microdata on Wealth” in
Perugia, 27-29 January 2005.
35/41
De Soto, Hernando (2000). The Mystery of Capital: Why Capitalism Triumphs in the
West and Fails Everywhere Else. Basic Books.
Earle, John, and Klara Sabirianova (2002). ‘‘How Late to Pay? Understanding Wage
Arrears in Russia.’’ Journal of Labor Economics 20(3), pp. 661–707.
Freeland, Chrystia, John Thornhill, and Andrew Gowers (1996). “Moscow’s Group of
Seven.” Financial Times, Nov 1, p.17.
Freeland, Chrystia (2000). Sale of the Century: Russia’s Wild Ride from Communism to
Capitalism. NY: Crown Business.
Foley, Mark, and William Pyle (2005). “Household Savings in Russia During the
Transition. ” Mimeo, Middlebury College.
Friebel, Guido and Sergei Guriev (2005). “Attaching Workers Through In-kind
Payments: Theory and Evidence from Russia”, World Bank Economic Review,
September 2005.
Glaeser, Edward, Jose Scheinkman, and Andrei Shleifer (2003). “The Injustice of
Inequality”, Journal of Monetary Economics: Carnegie-Rochester Series on
Public Policy, 50(1), 199-222.
Gorodnichenko, Yuri, and Yegor Grygorenko (2005). “Are Oligarchs Productive? Theory
and Evidence.” Mimeo, University of Michigan
36/41
Grosfeld, Irena, and Iraj Hashi (2003). “Mass privatisation, corporate governance and
endogenous ownership structure.” William Davidson Institute Working Paper
596.
Guriev, Sergei, and William Megginson (2006) “Privatization: What Have We Learned?”
Forthcoming in Francois Bourgoinon and Boris Pleskovic, ed. Beyond Transition:
Proceedings of the Annual Bank Conference on Development Economics, World
Bank 2006.
Guriev, Sergei, and Andrei Rachinsky (2005). “The Role of Oligarchs in Russian
Capitalism.” Journal of Economic Perspectives 19(1), pp. 131-150.
Guriev, Sergei, Andrei Rachinsky, and Ekaterina Zhuravskaya (2006). “The Genezis of
Oligarchs.” Mimeo, CEFIR.
Gustafsson, Bjorn, and Shi Li (2001). “Effects of the Transition on the Distribution of
Income in China: A Study Decomposing the Gini Coefficient for 1988 and 1995.”
Economics of Transition 9(3), 593-618.
Hanousek, Jan , and Filip Palda (2005). “Mission Implausible III: Measuring the Informal
Sector in a Transition Economy using Macro Methods”, mimeo, CERGE-EI,
Prague.
Hellman, Joel, Geraint Jones, and Daniel Kaufman (2003). “Seize the State, Seize the
Day: State Capture, Corruption, and Influence in Transition.” Journal of
Comparative Economics, 31, 751-73.
37/41
Hiatt, Fred (2005). “Truth-Tellers in a Time of Terror.” Washington Post, Nov 25.
Johnson, Simon, Rafael La Porta, Florencio Lopez-de-Silanes, and Andrei Shleifer
(2000). “Tunneling.” American Economic Review Papers and Proceedings.
Filer, Randall, Thorvaldur Gustafson, Stepan, Juraida, and Janet Mitchell (2001).
“Markets and growth in the post-communist world.” in Randall Filer and Gur
Ofer (ed.) “Growth in Transition” Oxford University Press, forthcoming.
Juurikkala, Tuule, and Olga Lazareva (2004). “The Role of Social Benefits in the
Employment Strategies of Russian Firms.” Mimeo, Helsinki School of
Economics.
Keane, Michael, and Eswar Prasad (2002). “Inequality, Transfers and Growth: New
Evidence from the Economic Transition in Poland.” Review of Economics and
Statistics, 2002, 84:2, 324-341.
Kramer, Andrew, and Heather Timmons (2005). “World's Biggest Steel Maker Is
Acquiring Ukrainian Mill.” The New York Times , Oct 25, 2005
Kramer, Andrew, and Floyd Norris (2005). “Amid Growing Wealth, Nepotism and
Nationalism in Kazakhstan.” The New York Times , Dec 23, 2005.
Megginson, William L. 2005. The Financial Economics of Privatization (First edition,
New York: Oxford University Press).
Milanovic, Branko (1998). Inequality and Poverty During the Transition From Market
Economy. World Bank.
38/41
Milanovic, Branko (1999). “Explaining the increase in Inequality During Transition.”
Economics of Transition 7(2) pp.299-341.
Moscow Times. 2003. “Tycoons Talk Corruption in Kremlin.” February 20, 2003.
Ofer, Gur, and Aaron Vinokur, 1992, The Soviet Household Under the Old Regime:
Economic Conditions and Behavior in the 1970s, Cambridge University Press.
Rajan, Raghuram, and Luigi Zingales (2003). Saving Capitalism from the Capitalists:
Unleashing the Power of Financial Markets to Create Wealth and Spread
Opportunity. NY: Crown Business.
RLMS (2004) Monitoring Economic Conditions in the Russian Federation. The Russian
Longitudional Monitoring Survey 1992-2004. University of North Coro
Shleifer, Andrei, and Dan Treisman (2005). “Normal Country: Russia After
Communism.” Journal of Economic Perspectives 19(1), pp. 151-174
Shleifer, Andrei, and Robert Vishny (1994). “The Politics of Market Socialism.” Journal
of Economic Perspectives 8(2), pp.165-176.
Slinko, Irina, Evgeny Yakovlev, and Ekaterina Zhuravskaya (2005). “Laws for Sale:
Evidence from Russia.” American Law and Economics Review 7(1), pp. 284-318.
Sonin, Konstantin (2003). “Why the Rich May Favor Protection of Property Rights.”,
Journal of Comparative Economics, 31 (4), 715-731,
Stiglitz, Joseph (2002). Globalizaion and its Discontents. W.W. Norton.
39/41
Vedomosti. 2003a. “Khodorkovsky confessed: Yukos shareholders will support Union of
Right Wing Forces, Yabloko, and the Communist Party.” April 8. [In Russian]
Vedomosti. 2003b. “Take away and divide: people’s aspirations have not changed in 86
years.” July 18. [In Russian]
Vedomosti. 2004. “Money breeds money.” June 16. [In Russian]
World Bank (2005). Where Is the Wealth of Nations? Measuring Capital for the XXI
Century. World Bank.
World Bank (2005). Growth, Poverty, and Inequality: Eastern Europe and the Former
Soviet Union, World Bank, Ch. 4.
World Bank (2006). Azerbaijan Extended Poverty Profile, 2002-2004.
World Wealth Report (2005, 2006). Capgemini and Merrill Lynch, New York.
Yemtsov, Ruslan (2006). “Housing Privatization and Household Wealth in Transition.”
Mimeo, World Bank.
40/41
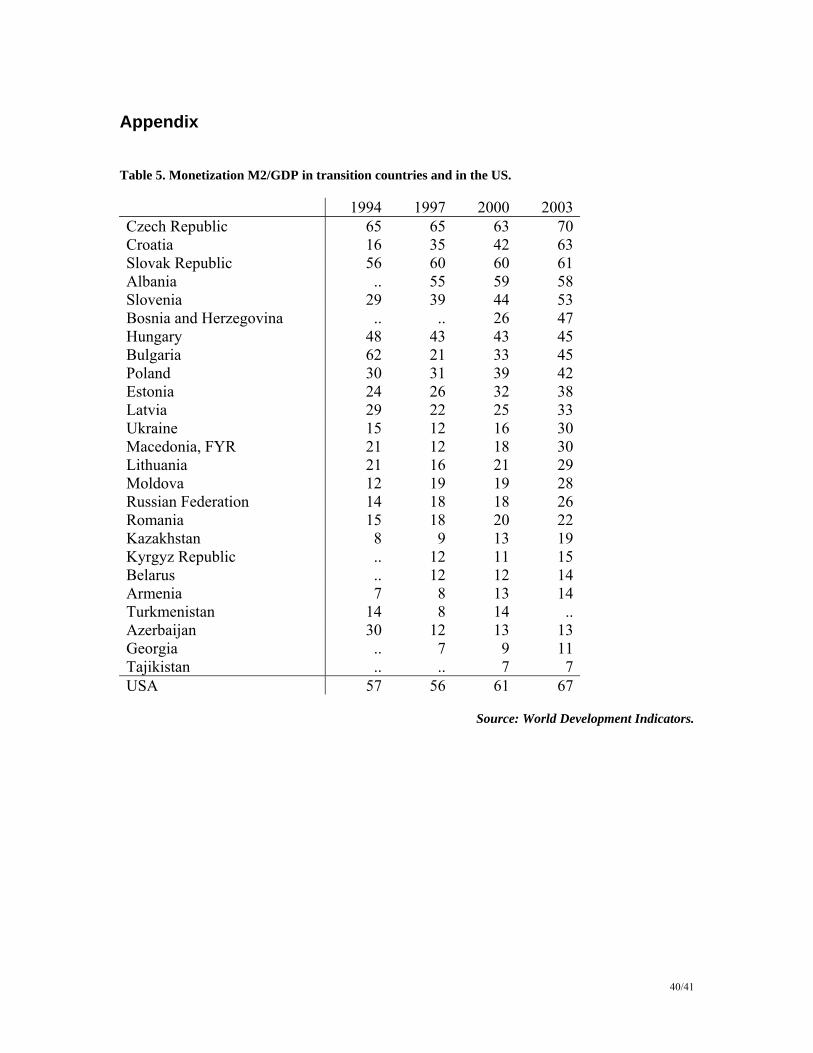
Appendix
Table 5. Monetization M2/GDP in transition countries and in the US.
1994 1997 2000 2003 Czech Republic 65 65 63 70 Croatia 16 35 42 63 Slovak Republic 56 60 60 61 Albania .. 55 59 58 Slovenia 29 39 44 53 Bosnia and Herzegovina .. .. 26 47 Hungary 48 43 43 45 Bulgaria 62 21 33 45 Poland 30 31 39 42 Estonia 24 26 32 38 Latvia 29 22 25 33 Ukraine 15 12 16 30 Macedonia, FYR 21 12 18 30 Lithuania 21 16 21 29 Moldova 12 19 19 28 Russian Federation 14 18 18 26 Romania 15 18 20 22 Kazakhstan 8 9 13 19 Kyrgyz Republic .. 12 11 15 Belarus .. 12 12 14 Armenia 7 8 13 14 Turkmenistan 14 8 14 .. Azerbaijan 30 12 13 13 Georgia .. 7 9 11 Tajikistan .. .. 7 7 USA 57 56 61 67
Source: World Development Indicators.
41/41
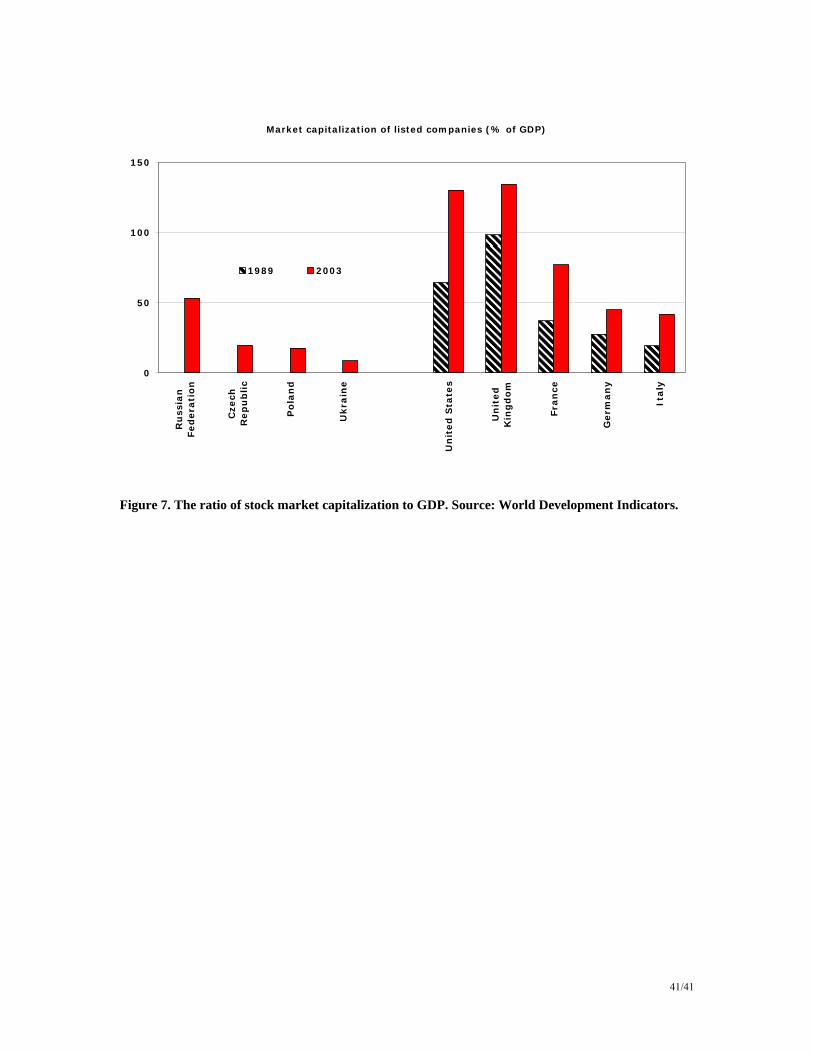
Market capitalization of listed companies (% of GDP)
0
50
100
150
Ru
ssia
nFed
era
tio
n
Cze
chR
ep
ub
lic
Po
lan
d
Ukra
ine
Un
ited
Sta
tes
Un
ited
Kin
gd
om
Fra
nce
Germ
an
y
Italy
1989 2003
Figure 7. The ratio of stock market capitalization to GDP. Source: World Development Indicators.