The evolution of a shock wave pressure induced by...
8
17 th International Symposium on Applications of Laser Techniques to Fluid Mechanics Lisbon, Portugal, 07-10 July, 2014 - 1 - The evolution of a shock wave pressure induced by a laser pulse in a liquid filled thin tube using the background-oriented schlieren technique Shota Yamamoto * , Yoshiyuki Tagawa † , Masaharu Kameda Department of Mechanical Systems Engineering, Tokyo University of Agriculture and Technology, Tokyo, Japan * , † Correspondent author: [email protected], [email protected] Abstract We investigate an angular variation of pressure at a laser-induced shock front in a liquid filled thin tube. We adopt the background-oriented schlieren (BOS) technique. This technique enables us to measure two- or three-dimensional pressure field in a small region with a simple setup. We obtain the spatiotemporal evolution of the pressure field thanks to an ultra high-speed video camera and a laser stroboscope. Remarkably, although shape of the shock wave is like a sphere, we find an angular variation of the pressure at the shock front. The maximum pressure is at the region in the direction of the laser shot. It is about four times higher than that in the perpendicular direction. Pressure measured by BOS technique are compared with those obtained by another method. Our results might be used for efficient generation systems of the microjet which can be applicable for needle free injection devices. 1. Introduction A laser-induced shock wave in a liquid is of great importance in various satisfied technological fields such as a laser medicine. Very recently, Tagawa et al. (2012) utilize the shock wave to generate a highly-focused supersonic microjet from a water-filled microtube. This unique microjet has a very high velocity up to 850 m/s and a highly-focused shape. Tagawa et al. (2013) showed that this microjet can be applicable for novel needle-free injection devices. Here the laser-induced shock wave plays a key role. Turangan (2013) numerically simulated this microjet generation assuming that the shock wave is spherical. This “spherical shock” assumption is often adopted in many researches for both numerics and experiments. Nevertheless it should be experimentally examined since the laser-induced shock wave might have an angular variation of pressure at the shock front as indicated by Georgy et al. (2008). The purpose of this study is to explore the angular variation of the pressure in two- or three-dimensional field. The observation is, however, challenging due to following reasons: An ultra high velocity of a shock wave in a liquid (more than 1500 m/s) and a narrow measurement region (milli meter scale). An accurate and complicated alignment of optics is required for traditional visualization techniques e.g. the schlieren method. A hydrophone is frequently used for measuring shock pressure (Georgy et al. 2008), while it provides only point-wise information. The position of the shock front is also commonly utilized for measurements (Vogel et al. 1996 and Brujan et al. 2008). This method often approximates the shape of the shock front as a perfect sphere. Thus, this method might average out the non-uniformity of the shock pressure. We need a quantification method which is able to provide the pressure field in the observation region. In this research we adopt the background-oriented schlieren (BOS) technique (Meier 1998 and Venkatakrishnan & Meier 2004). Its advantages are applicability to small scale with a simple setup and an ability of providing a pressure field in two- or three-dimensions. To the best of the authors’ knowledge we for the first time apply BOS technique to the laser-induced shock wave in a liquid filled thin tube. In order to acquire spatiotemporal evolution of the shock wave, we use an ultra high-speed video camera with a laser stroboscope. Using the BOS technique, Venkatakrishnan & Meier (2004) visualized a steady supersonic air flow over a cone-cylinder model, quantified its density field, and validated the technique. Hargather & Settles (2010) applied the BOS method for a large-scale imaging outside a laboratory with natural backgrounds and showed its great potential for measuring a wide range of length scales of the flows. Venkatakrishnan et al. (2012) and Suriyanarayanan et al. (2013) investigated the time evolution of the blast wave generated through a micro-explosion in the air.
Transcript of The evolution of a shock wave pressure induced by...
17th International Symposium on Applications of Laser Techniques to Fluid Mechanics Lisbon, Portugal, 07-10 July, 2014
- 1 -
The evolution of a shock wave pressure induced by a laser pulse in a
liquid filled thin tube using the background-oriented schlieren technique
Shota Yamamoto*, Yoshiyuki Tagawa†, Masaharu Kameda
Department of Mechanical Systems Engineering, Tokyo University of Agriculture and Technology, Tokyo,
Japan *, † Correspondent author: [email protected], [email protected]
Abstract We investigate an angular variation of pressure at a laser-induced shock front in a liquid filled thin tube. We adopt the background-oriented schlieren (BOS) technique. This technique enables us to measure two- or three-dimensional pressure field in a small region with a simple setup. We obtain the spatiotemporal evolution of the pressure field thanks to an ultra high-speed video camera and a laser stroboscope. Remarkably, although shape of the shock wave is like a sphere, we find an angular variation of the pressure at the shock front. The maximum pressure is at the region in the direction of the laser shot. It is about four times higher than that in the perpendicular direction. Pressure measured by BOS technique are compared with those obtained by another method. Our results might be used for efficient generation systems of the microjet which can be applicable for needle free injection devices. 1. Introduction A laser-induced shock wave in a liquid is of great importance in various satisfied technological fields such as a laser medicine. Very recently, Tagawa et al. (2012) utilize the shock wave to generate a highly-focused supersonic microjet from a water-filled microtube. This unique microjet has a very high velocity up to 850 m/s and a highly-focused shape. Tagawa et al. (2013) showed that this microjet can be applicable for novel needle-free injection devices. Here the laser-induced shock wave plays a key role. Turangan (2013) numerically simulated this microjet generation assuming that the shock wave is spherical. This “spherical shock” assumption is often adopted in many researches for both numerics and experiments. Nevertheless it should be experimentally examined since the laser-induced shock wave might have an angular variation of pressure at the shock front as indicated by Georgy et al. (2008). The purpose of this study is to explore the angular variation of the pressure in two- or three-dimensional field. The observation is, however, challenging due to following reasons: An ultra high velocity of a shock wave in a liquid (more than 1500 m/s) and a narrow measurement region (milli meter scale). An accurate and complicated alignment of optics is required for traditional visualization techniques e.g. the schlieren method. A hydrophone is frequently used for measuring shock pressure (Georgy et al. 2008), while it provides only point-wise information. The position of the shock front is also commonly utilized for measurements (Vogel et al. 1996 and Brujan et al. 2008). This method often approximates the shape of the shock front as a perfect sphere. Thus, this method might average out the non-uniformity of the shock pressure. We need a quantification method which is able to provide the pressure field in the observation region. In this research we adopt the background-oriented schlieren (BOS) technique (Meier 1998 and Venkatakrishnan & Meier 2004). Its advantages are applicability to small scale with a simple setup and an ability of providing a pressure field in two- or three-dimensions. To the best of the authors’ knowledge we for the first time apply BOS technique to the laser-induced shock wave in a liquid filled thin tube. In order to acquire spatiotemporal evolution of the shock wave, we use an ultra high-speed video camera with a laser stroboscope. Using the BOS technique, Venkatakrishnan & Meier (2004) visualized a steady supersonic air flow over a cone-cylinder model, quantified its density field, and validated the technique. Hargather & Settles (2010) applied the BOS method for a large-scale imaging outside a laboratory with natural backgrounds and showed its great potential for measuring a wide range of length scales of the flows. Venkatakrishnan et al. (2012) and Suriyanarayanan et al. (2013) investigated the time evolution of the blast wave generated through a micro-explosion in the air.
17th International Symposium on Applications of Laser Techniques to Fluid Mechanics Lisbon, Portugal, 07-10 July, 2014
- 2 -
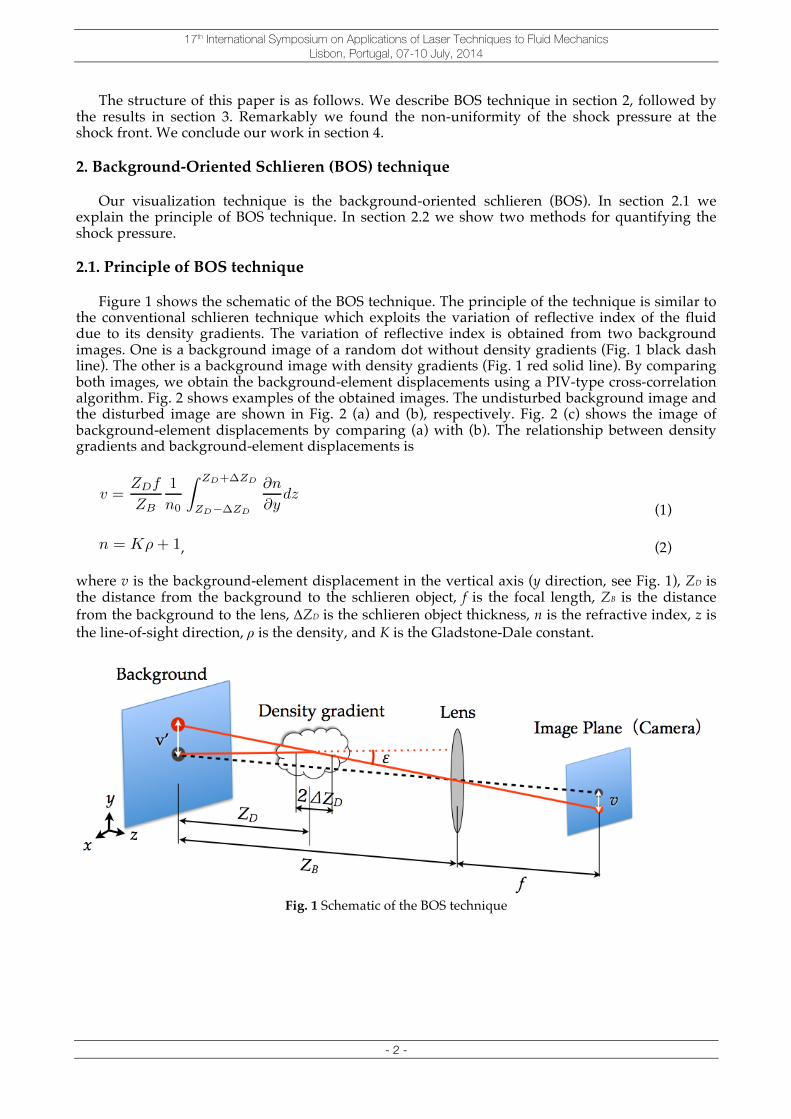
The structure of this paper is as follows. We describe BOS technique in section 2, followed by the results in section 3. Remarkably we found the non-uniformity of the shock pressure at the shock front. We conclude our work in section 4. 2. Background-Oriented Schlieren (BOS) technique Our visualization technique is the background-oriented schlieren (BOS). In section 2.1 we explain the principle of BOS technique. In section 2.2 we show two methods for quantifying the shock pressure. 2.1. Principle of BOS technique Figure 1 shows the schematic of the BOS technique. The principle of the technique is similar to the conventional schlieren technique which exploits the variation of reflective index of the fluid due to its density gradients. The variation of reflective index is obtained from two background images. One is a background image of a random dot without density gradients (Fig. 1 black dash line). The other is a background image with density gradients (Fig. 1 red solid line). By comparing both images, we obtain the background-element displacements using a PIV-type cross-correlation algorithm. Fig. 2 shows examples of the obtained images. The undisturbed background image and the disturbed image are shown in Fig. 2 (a) and (b), respectively. Fig. 2 (c) shows the image of background-element displacements by comparing (a) with (b). The relationship between density gradients and background-element displacements is
(1) , (2) where v is the background-element displacement in the vertical axis (y direction, see Fig. 1), ZD is the distance from the background to the schlieren object, f is the focal length, ZB is the distance from the background to the lens, ΔZD is the schlieren object thickness, n is the refractive index, z is the line-of-sight direction, ρ is the density, and K is the Gladstone-Dale constant.
Fig. 1 Schematic of the BOS technique
v =ZDf
ZB
1
n0
Z ZD+�ZD
ZD��ZD
@n
@ydz
n = K⇢+ 1

17th International Symposium on Applications of Laser Techniques to Fluid Mechanics Lisbon, Portugal, 07-10 July, 2014
- 3 -
Fig. 2 Background images (a) without density gradients and (b) with density gradient due to a flame. (c) The
image shows the difference between (a) and (b) using a PIV-type cross-correlation algorithm. Green vectors show the local displacements of the background.
2.2. Quantification methods for the shock pressure We estimate the shock pressure by two methods. Both methods utilize results of the BOS technique. The main method in this research employs the background-element displacements (section 2.2.1). This method provides pressure distribution in two- or three-dimensions. For comparison, we also adopt another method which uses the position of the shock front (section 2.2.2). 2.2.1. Pressure estimation from the background-element displacements (BOS technique) The displacement due to the shock wave obtained by BOS technique is the integrated value of the density gradients. Nonetheless the rim of the “disturbed” area of non-zero displacements is the density gradient of the shock front solely. Since we now discuss the pressure at the shock front, we solve a following two-dimensional Poisson equation yielded from Eqs. (1) and (2) (Glazyrin et al. 2012).
, (3) where u is the background-element displacement in x direction and v is that in y direction (see Fig. 1). We solve Eq. (3) using Successive Over Relaxation method with a boundary condition. We impose the Dirichlet condition ρ=ρ0 on the boundary of the image lying in the undisturbed area. Finally the shock pressure is calculated using the Tait equation
, (4) where p∞ is the hydrostatic pressure, T is 314 MPa, and n is 7. We also reconstruct the three-dimensional density field using one of the optical tomography techniques, i.e. Algebraic Reconstruction Technique (ART). Ota et al. (2011) successfully quantified the three-dimensional density field of supersonic flow field around an asymmetric body using ART and BOS technique. As we show later, the shock wave in this research has a line symmetry distribution to the direction of a laser. This symmetry enables us to assume an axisymmetric distribution of a density field of the shock wave. Thus three-dimensional field of density gradients can be reconstructed by only single two-dimensional image.
Flame
(a) (b) (c)
@
2⇢
@
2x
+@
2⇢
@
2y
= � 2
�ZDK(�ZD + 2ZD)
✓@u
@x
+@v
@y
◆
p+ T
p1 + T=
✓⇢
⇢0
◆n

17th International Symposium on Applications of Laser Techniques to Fluid Mechanics Lisbon, Portugal, 07-10 July, 2014
- 4 -
2.2.2. Pressure estimation from the shock front position This method utilizes the position of the shock front as a function of time or distance from a shock center (cf. Vogel et al. 1996 and Brujan et al. 2008). In order to extract the shock position we approximate the shape of the shock front as a sphere (a circle in two-dimensional projection). The obtained shock front position is fitted with a following equation proposed by Dewey (2001).
, (5) where R is the fitted shock front position, A, C and D are the fitting constants, B is set to 1 when the shock velocity asymptote the speed of sound for large time, a0 is the speed of sound in water, and t is an elapsed time after the laser being fired. The shock velocity us and pressure ps are then calculated with taking time derivative of R and using the isentropic Tait equation (Richardson & Arons 1947, Vogel et al. 1996), respectively.
(6)
(7) 2.3. Experimental setup Figure 3 shows our experimental setup. A BOS setup consists of a background with random dot pattern, a schlieren object (a density gradient), and a camera. A 532 nm, 6 ns laser pulse is focused through a 10× microscope objective to a point inside a water-filled glass cuvette (10×10× 45 mm), where a shock wave emerges. We record the shock wave using an ultra high-speed video camera (Kirana, Specialized Imaging co., UK) with up to 5 M frames per second and 924×768 pixel array. The experiment requires exceedingly short exposure time due to the non-stationary flow. Hence we utilize a laser stroboscope with a pulse width of 20 ns as an illumination source (CAVILUX Smart, CAVITAR co., Finland). A digital delay generator synchronizes the camera, the laser, and the stroboscope. In our setup, the distance from the background to the schlieren object ZD is 8 mm, the focal length f is 200 mm, the distance from the background to the lens ZB is 220 mm.
Fig. 3 Schematic of the experimental setup
R = A+Ba0t+ Cln(1 + a0t) +Dpln(1 + a0t)
us =dR
dt= a0
B +
C
1 + a0t+
D
2(1 + a0t)pln(1 + a0t)
!
ps = (p1 + T )
✓2nu2
s
(n+ 1)a20� n� 1
n+ 1
◆� T
Ultra high-speed camera
Light source(stroboscope)
Pulse laserMicroscope objective
Diffuser
Background(random dot)Water filled Glass cuvette
(10×10×45 mm)
Mirror
Frame rate: 5 Mfps Exposure time: 20 ns
Wavelength: 532 nm Pulse width: 6 nsEnergy: 30 mJ
Digital delay generator
closeup ring

17th International Symposium on Applications of Laser Techniques to Fluid Mechanics Lisbon, Portugal, 07-10 July, 2014
- 5 -
3. Results and Discussion This section presents the results of visualization and quantification of a shock wave using BOS technique and an ultra high-speed video camera. The spatiotemporal evolution of the shock wave is shown in section 3.1. The shock pressure is described in section 3.2. Remarkably, we find the angular variation of the pressure at the shock front. These results are also compared with the other method. 3.1 Visualization of the laser-induced shock wave in water Figure 4 shows the visualized laser-induced shock wave in water. We successfully obtained the image sequences of the shock wave at every 0.2 µs thanks to an ultra high-speed video camera with 5 M frames per second. Although the shock wave propagates like a sphere, we found the angular variation of the displacement magnitude at the shock front. Red color at the shock front shows the largest displacement magnitude. The maximum value is at bottom of the shock front, i.e. the direction of the laser shot. The values at right and left of the shock front are much lower than those at top and bottom. The images show line symmetry. Thus, we assume that the laser-induced shock wave has axisymmetrical pressure distribution. Note that the laser-induced bubble (red area in the center of Fig. 4) has spheroidal shape.
Fig. 4 The time evolution of the laser-induced shock wave visualized by BOS technique. The images show
the displacement magnitude after the laser being fired. The laser pulse is illuminated from the top. The bubble is shown as a red elliptic area. The value of the color bar is in the unit of pixel.
3.2 Quantification of the shock pressure This section describes pressure distribution. In section 3.2.1, we show the results obtained by our main method; BOS technique. In section 3.2.2, we present the results by the other method. These results are compared in section 3.2.3. 3.2.1 Results of the BOS technique Figure 5 shows shock pressure distribution obtained by BOS technique. Remarkably it exhibits an angular variation of pressure at the shock front. The local pressure at the shock front in the direction of laser shot is about four times higher than that in the perpendicular direction. Figure 5 indicates axisymmetric distribution of the shock pressure. The bubble grows not as spherical shape but as spheroidal shape. The growth of the direction toward laser shot is faster than that of the perpendicular direction. Thus a likely explanation for the non-uniformity of the shock pressure distribution is that the non-uniformity is caused by the non-spherical growth of the laser-induced bubble. Figure 5 also shows negative pressure in the right and left region of the bubble. In order to obtain the shock pressure there, we reconstruct three-dimensional pressure field by ART. Figure 6 shows a cross section of the reconstructed pressure field at t=1.8 µs. We found that an image at t=1.8 µs in Fig. 5 shows similar distribution to the image in Fig. 6, particularly at the shock front. The shock pressure in the right and left region of the bubble is lower in Fig. 6 than that in Fig. 5.
t = 1.0 µs t = 1.4 µs t = 1.8 µs t = 2.2 µs
ROI: x=65 y=220 w=252 h=291
0.05
0.1
0.15
0.2
0.25
0.3
0
0.5
0.1
0.2
0.3
0.4
pixel
Bubble Shock front
Laser pulse

17th International Symposium on Applications of Laser Techniques to Fluid Mechanics Lisbon, Portugal, 07-10 July, 2014
- 6 -
Fig. 5 The time evolution of shock pressure distribution calculated by solving the Poisson equation Eq. (3)
The value for the color bar is in the unit of MPa.
Fig. 6 An image obtained by ART at t=1.8 µs. 3.2.2 Pressure estimation from the shock front position Figure 7 (a) shows the time evolution of the shock front position. In this method we approximate the shape of the shock front as a perfect sphere. The data is fitted with a curve of Eq. (5). Coefficient A, C, D, and the speed of sound a0 in Eq. (5) are A=4.54e-05, C=-0.06269, D=0.008966, and a0=1483 m/s, respectively. Figure 7 (b) shows the shock velocity obtained from Eq. (6). The shock pressure is displayed as a function of propagation distance in Fig. 8 (black line). It decreases with the propagation distance: At the early stage of the propagation, the shock pressure materially decreases. Then it asymptotically decreases to the speed of sound in water a0. This behavior is reported by many researches (e.g. Vogel et al. 1996, Dewey 2001).
Fig. 7 (a) Propagation of the shock front plotted as a function of time. The solid line presents the fitting curve of Eq. (5). (b) Shock velocity as a function of time. The curve is obtained from Eq. (6).
0 1 2 30
1
2
3
4
5
Time,µs
Dis
tanc
e,m
m
Experimental resultsFitting cureve
0 0.5 1 1.5 2 2.5 31400
1500
1600
1700
1800
1900
2000
Time,µs
Shoc
k ve
loci
ty,m
/s
(a)! (b)!

17th International Symposium on Applications of Laser Techniques to Fluid Mechanics Lisbon, Portugal, 07-10 July, 2014
- 7 -
3.2.3 Comparison of the shock pressure From now on, we compare the results presented in section 3.2.1 and 3.2.2. Fig. 8 shows the shock pressure as a function of the propagation distance. A black line shows a pressure estimated from the shock front position. The markers show those from the BOS technique (plotted pressure values are at top, bottom, left and right part of the shock front). The shock pressures from both methods gradually decrease with the propagation distance. The pressure from the shock front position exists between the maximum and minimum values from the BOS technique. The reason is that the method using the shock front position regards a shock wave as a perfect sphere, resulting in averaging out the value of the non-uniform distribution of the pressure. In this measurement, the maximum pressure at the bottom is roughly twice as high as the value from the shock front position (black line). The minimum value from the BOS technique is about a half value of that from the shock front position.
Fig. 8 Comparison of shock pressure as a function of the propagation distance from two quantification
methods. The pressure value from the shock front position: thin line and those from the solving the Poisson equation Eq. (3): markers.
4. Conclusion We have investigated the angular variation of pressure at the laser-induced shock front in a liquid filled thin tube. We have visualized the shock wave using the BOS technique and quantified the spatiotemporal evolution of the shock pressure. We have obtained images every 0.2 µs thanks to an ultra high-speed video camera with 5 M frames per second. The pressure field has been obtained by solving the Poisson equation Eq. (3). Remarkably, we found an angular variation of the pressure at the shock front shown in Fig. 5. There is the maximum value of the shock pressure at the region in the direction of the laser shot. The value of the shock pressure at the region in the axial direction of the laser shot is much higher than that in the perpendicular direction. In addition, we have reconstructed the three-dimensional pressure field using the optical tomography technique (ART). We have estimated shock pressure from two quantification methods. Overall trend of the
0 1 2 3 4 50
100
200
300
400
Disitance,mm
Pres
sure
,MPa
Data obtained through the Tait equationBOS data(the top part of the shock front )BOS data(the bottom part of the shock front)BOS data(the right part of the shock front )BOS data(the left part of the shock front )

17th International Symposium on Applications of Laser Techniques to Fluid Mechanics Lisbon, Portugal, 07-10 July, 2014
- 8 -
pressure obtained from both methods show a good agreement. The pressure from the shock front position exists between the maximum and minimum values from BOS technique. Our quantification method can provide the detailed pressure field in two- or three-dimensions. Our results might be used for efficient generation systems of the microjet which can be applicable for needle free injection devices (Tagawa et al 2012). By changing the direction of a laser shot we could generate the microjet faster than 850 m/s yielded by Tagawa et al. (2012). References Brujan E A, Ikeda T, Matsumoto Y (2008) On the pressure of cavitation bubbles. Experimental Thermal and Fluid Science 32: 1188-1191 Dewey J M (2001) Expanding spherical shocks (blast waves). In: Ben-Dor G, Elperin T (eds.) Handbook of Shock Waves, Vol. 2, Academic Press, 13(1): 441-448 Georgy N S, Yufeng Z, Pei Z (2008) Focusing of shock waves induced by optical breakdown in water. Journal of the Acoustical Society of America 123(6): 4071-4081 Glazyrin F N, Znamenskaya I A, Mursenkova I V, Sysoev N N, Jin J (2012) Study of shock-wave flows in the channel by schlieren and background oriented schlieren methods. Optoelectronics, Instrumentation and Data Processing 48(3): 303-310 Hargather M J, Settles G S (2010) Natural-background-oriented schlieren imaging. Experiments in Fluids 48: 59-68 Meier G E A (1998) New optical tools for fluid mechanics. Sadhana 23(5-6): 557-567 Ota M, Hamada K, Noda R, Kato H, Maeno K (2011) Three-dimensional CT measurement of supersonic flow field around an asymmetric body by background oriented schlieren (BOS) technique. Journal of the Japan Society for Aeronautical and Sciences 59(689): 154-159 Richardson J M, Arons A B (1947) Hydrodynamic properties of sea water at the front of a shock wave. The Journal of Chemical Physics 15: 785-795 Suriyanarayanan P, Karthikeyan N, Venkatakrishnan L, Samuelraj O, Sriram R, Jagadeesh G (2012) Density field measurement of a micro-explosion using BOS. In: Proceedings of the 28th International Symposium on Shock Waves 2012, Manchester, UK Tagawa Y, Oudalov N, Ghalbzouri A E, Sun C, Lohse D (2013) Needle-free injection into skin and soft matter with highly focused microjets. Lab on a Chip 13 (7): 1357-1363 Tagawa Y, Oudalov N, Visser C W, Peter I R, van der Meer D, Sun C, Prosperetti A, Lohse D (2012) Highly focused supersonic microjets. Physical Review X 2: 031002 Turangan C K (2013) Highly focused microjet simulations using the free-Lagrange method (FLM). In: Proceedings of the 8th International Conference on Multiphase Flow 2013, Jeju, Korea Venkatakrishnan L, Meier G E A (2004) Density measurements using the background oriented schlieren technique. Experiments in Fluids 37: 237-247 Venkatakrishnan L, Suriyanarayanan P, Jagadeesh G (2013) Density field visualization of a micro- explosion using background-oriented schlieren. Journal of Visualization 16: 177-180 Vogel A, Busch S, Parlitz U (1996) Shock wave emission and cavitation bubble generation by picosecond and nanosecond optical breakdown in water. Journal of the Acoustical Society of America 100: 148-165