2006(-07)TAMDAR aircraft impact experiments for RUC humidity, temperature and wind forecasts

The Effects of Temperature, Humidity and Aircraft Fluid Exposure onT800H/3900-2 Composites Bonded with AF-555M Adhesive *
Gilda A. Miner, Tan-Hung Hou, Sharon E. Lowther, Sheila A. Thibeault, John W. ConnellNASA Langley Research Center
Hampton, VA 23681
and Sheila Roman BlasiniUniversity of Puerto Rico, Rio Piedras, Puerto Rico
ABSTRACT
Fiber reinforced resin matrix composites and structural adhesives have found increased usage oncommercial and military aircraft in recent years. Due to the lack of service history of theserelatively new material systems, their long-term aging performance has not been wellestablished. In this study, single lap shear specimens (SLS) were fabricated by secondarybonding of Scotch-WeldTM AF-555M between pre-cured adherends comprised of T800H/3900-2uni-directional laminates. The adherends were co-cured with wet peel-ply for surfacepreparation. Each bond-line of the SLS specimen was measured to determine thickness andinspected visually using an optical microscope for voids. A three-year environmental aging planfor the SLS specimens at 82°C (180°F) and 85% relative humidity was initiated. SLS strengthswere measured for both controls and aged specimens at room temperature and 82°C. The effectof this exposure on lap shear strength and failure modes to date is reported.
In addition, the effects of water, saline water, deicing fluid, JP-5 jet fuel and hydraulic fluid onboth the composite material and the adhesive bonds were investigated. The up to date results onthe effects of these exposures will be discussed.
1. INTRODUCTION
Fiber reinforced resin matrix composites and structural adhesives have been introducedincreasingly in recent years for structural applications on military and commercial aircraft (e.g.A380, B787, YF-22). These materials offer advantages in weight savings without sacrificingstrength and mechanical performance. Due to the lack of service history of these relatively newmaterial systems, their long-term aging performance has not been well established. As part of aprogram to address this unknown behavior, an Aviation Safety Program (ASP) was initiatedunder NASA’s Aeronautics Research Mission Directorate (ARMD) in 2007. As a part of ASP,the Aircraft Aging and Durability Project (AADP) was formulated to characterize, predict anddevelop mitigation approaches to minimize damage and degradation issues associated with aging
* This paper is declared a work of the U.S. Government and is not subject to copyright protection in the UnitedStates.
https://ntrs.nasa.gov/search.jsp?R=20100019160 2018-08-29T02:58:48+00:00Z

effects on composites and adhesives. The focus of the AADP is aging and damage processes in “young”aircraft, rather than life extension of legacy vehicles, thus the emphasis of research is on the behavior ofnew composite and adhesive systems.
Previous work has demonstrated that high quality joints were bonded using a peel-ply surfacetreatment that serves to provide increasing surface roughness and prevents mould release agentsand other materials from contaminating the surface [1-3]. In this approach, the peel-ply was co-cured as part of the top laminate ply and subsequently removed just prior to bonding. It waseasily released by peeling off the adherend surface because of the non-stick nature of the carrierfabric substrate (typically a polyester or polyamide). Increasing surface roughness resulted in anincrease in surface area, which allowed the adhesive to flow in and around the irregularities onthe surface to form a mechanical interlocking bond. In the present study for an AADP subtaskentitled “Bonded Joints for Construction and Repair”, the bonding surfaces were prepared by co-curing Toray T80011/3900-2 composite prepregs with a resin impregnated wet peel-ply. Single-lap-shear (SLS) specimens were bonded using AF-555M adhesive. Processing pitfalls forproducing porosity-free, high quality bonds have been reported previously [4]. The behavior ofon-going aging of SLS specimens in a temperature/humidity chamber is reported herein.
Aircraft are exposed to many fluids, such as: rain, salt spray, fuel, deicing fluid and hydraulicfluid, while sitting on the tarmac and during normal maintenance operations. Environmental andchemical degradation of carbon- and glass-reinforced polymeric composites have been reported[5-7]; polymer degradation has been shown to affect flammability properties and increase therisk of pyrolysis [8]. Thus, while investigating the effects of elevated temperature and humidity,it was decided to expand the project to include the effects of exposures of the composite materialand the adhesive bonds to these fluids. The expanded project involves soaking (immersion)composite and lap shear specimens in these fluids for times ranging from a few hours to 1000hours. This report addresses the results from short exposures of these fluids on the TorayT80011/39900-2 composite and Scotch-Weld adhesive by measuring changes to the glasstransition temperature (Tg) and SLS bond strength.
2. MATERIALS †
The materials used in this study are presented in Tables 1 and 2. Specifications of the materialsin Table 1 have been reported previously [4]. All materials for the solvent study were used asreceived without further treatments with the exception of the saline water. Saline water wasprepared by mixing 3.5 grams of Morton Sea Salt with 96.5 grams of deionized water.
† Use of trade names or manufacturers does not constitute an official endorsement, either expressed or implied, by the NationalAeronautics and Space Administration.

Table 1. Materials used in Environmental and Solvent Study
Material Form Material Designation SupplierPrepreg T800H/3900-2 Toray
Adhesive S/W AF-555M 3MWet peel ply Hysol EA-9895 Henkel
Table 2. Solvents used in Solvent Study
Solvent ManufacturerDeionized Water Milli-Q filtered water
Saline Water 3.5% (w/w) Morton Sea Salt in deionized waterDeicing Fluid AVL-TKSJP-5 Jet Fuel Chevron Phillips Chemical Company
Hydraulic Fluid Skydrol
3. EXPERIMENTAL
3.1 Fabrication of composite adherends
The composite adherend panel, 61 cm by 81 cm (24” by 32”) - [0] 16, was assembled by stacking16 plies of uni-directional T800H/3900-2 prepreg. A wet peel-ply strip of 61 cm by 5.1 cm (24”by 2”) was laid down on the top prepreg layer, perpendicular to the fiber direction and separatedby a pre-determined distance as shown in Figure 1a. This assembly was cured at 177°C (350°F)for 2 hours under 690 KPa (100 psi) in an autoclave with vacuum bagging.
3.2 Bonding of adherends
Peel-ply co-cured composite adherend panels were then cut into six 61 cm by 10.8 cm (24” by4.25”) strips along the center of the 5.08 cm (2”) wide peel-ply as indicated in Figure 1 a. Thepeel plies were then removed to expose the co-cured surfaces. Peel-ply surfaces were used as-peeled without any additional chemical cleaning or wiping. The surfaces were visually inspected
(a) (b)
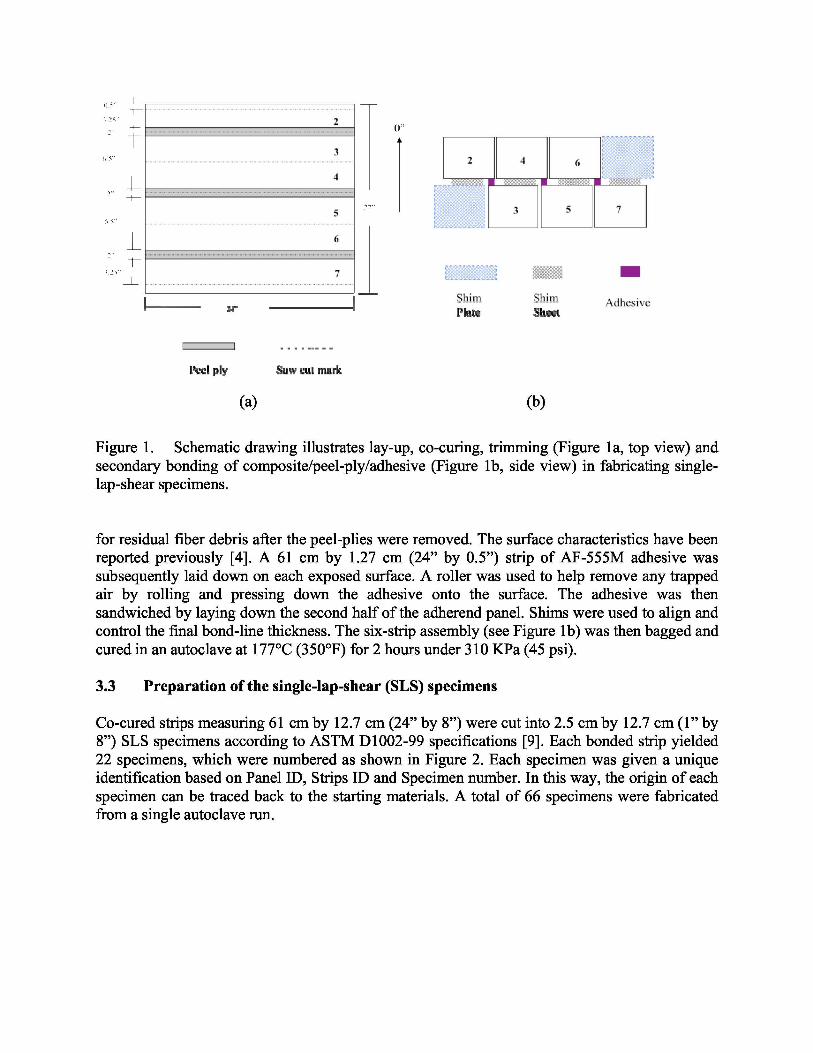
Figure 1. Schematic drawing illustrates lay-up, co-curing, trimming (Figure 1a, top view) andsecondary bonding of composite/peel-ply/adhesive (Figure 1b, side view) in fabricating single-lap-shear specimens.
for residual fiber debris after the peel-plies were removed. The surface characteristics have beenreported previously [4]. A 61 cm by 1.27 cm (24” by 0.5”) strip of AF-555M adhesive wassubsequently laid down on each exposed surface. A roller was used to help remove any trappedair by rolling and pressing down the adhesive onto the surface. The adhesive was thensandwiched by laying down the second half of the adherend panel. Shims were used to align andcontrol the final bond-line thickness. The six-strip assembly (see Figure 1b) was then bagged andcured in an autoclave at 177°C (350°F) for 2 hours under 310 KPa (45 psi).
3.3 Preparation of the single-lap-shear (SLS) specimens
Co-cured strips measuring 61 cm by 12.7 cm (24” by 8”) were cut into 2.5 cm by 12.7 cm (1” by8”) SLS specimens according to ASTM D1002-99 specifications [9]. Each bonded strip yielded22 specimens, which were numbered as shown in Figure 2. Each specimen was given a uniqueidentification based on Panel ID, Strips ID and Specimen number. In this way, the origin of eachspecimen can be traced back to the starting materials. A total of 66 specimens were fabricatedfrom a single autoclave run.

Figure 2. Schematic drawing (top view) illustrates identification of single-lap-shear specimens.Panel ID is #1, bonded strip pair IDs are 2/3, 4/5 and 6/7 (see Figure 1), and specimen IDs foreach bonded strip pair is numbered 1 to 22 from right to left.
3.4 SLS strength measurement
SLS strengths were measured by a MTS test frame. Details of the testing have been reportedpreviously [4]. Failure modes were characterized according to ASTM D5573 [10].
3.5 Aging chamber
The environmental chamber used was a MicroClimate TM model MCB-1.2 manufactured by CSZ(Cincinnati Environment Chamber). This chamber has a standard temperature range of -73°C to190°C (-100°F to 375°F) and a maximum relative humidity (RH) of 95%. The aging conditionselected in this study was 82°C (180°F)/85% RH [11].
3.6 3-point Bend Specimens
The composite panel, 30.5 cm by 30.5 cm (12” by 12”) - [0] 16, was assembled by stacking up 16plies of uni-directional T800H/3900-2 prepreg and cured by vacuum press using the parameterspresented in 3.1 above. The panel was cut into 60 mm X 10 mm 3-point bend specimens. Half ofthe specimens had a graphite fiber orientation of 0° (carbon fiber running parallel to the 60 mmdimension) and the other half had an orientation of 90° (carbon fiber running perpendicular tothe 60 mm dimension). The thickness of the specimens averaged 2.70 mm.

3.7 Solvent Soak
Each specimen was placed in an individual test tube and covered with solvent and soaked for 6hours using the soaking procedure described in ASTM Standard D 896-04 [12].
3.8 Dynamic Mechanical Analyzer Testing
The glass transition temperature (Tg) was measured using a TA Instruments DynamicMechanical Analyzer (DMA), Model 2980DMA and the 3-point bend accessory with operatingconditions of 1Hz constant frequency, amplitude of 10 microns and ramp rate of 5 °C per minutefrom -50 to 250 °C. The viscoelastic parameter, Tan Delta, was used to define the Tg.
4. RESULTS And DISCUSSION
Bond-line characteristics and thickness of each specimen were documented prior to aging ortesting. Due to the specimen size and limitations with our equipment, ultrasonic characterizationof the bond quality was not feasible. Thus inspection of the bond quality was assessedqualitatively by examining the bond line edges under an optical microscope. A typical specimenwith voids present in the bond-line is shown in Figure 3. One side of the bond-line exhibited noporosity, while the other side showed visible voids. For this study, each humidity aging timeexposure test contained a mixture of specimens consisting of some that were void-free and somecontaining voids.
Specimens numbered 3, 11, and 20 in each bonded strip (see Figure 2) were selected to be testedat room temperature (RT) as controls before aging. Results for Panel #2 are shown in Table 3.Specimens from Strips 1 and 2 were void-free and exhibited SLS strengths which wereconsistently 30% above the nominal value of 35.9 MPa (5,200 psi) reported by the manufacturer[13]; while Strips 3 and 4, and 6 and 7 yielded void-containing specimens, with strength valuesthat were 85 to 95% of this nominal value. Results from another panel (Panel #4), which yieldedvoid-free specimens are presented in Table 4. The SLS strengths measured were consistentlyover 10% of the nominal strength value.
Figure 3. Visual evidence of porosity in the bond-line. Adhesive is sandwiched between topand bottom composite adherends.

It was noted that Panel #4 yielded uniform bond-line thicknesses, while Panel #2 did not. Theorigin of bond-line variations came from the thickness variations in the bonding adherend strips.In an autoclave run, three sets of adherend strips were bonded using a single large caul plate,which made the control of bond-line uniformity difficult.
Table 3. RT strength values for Panel #2 control specimens
StripID
SpecimenID
Bond-linethickness, mil
SLS strength,MPa
% of nominalstrength**
1/2 3 1 46.8 13011 1 46.6 13020 1 47.6 133
3/4 3 9 41.5 1161 1 * 13 30.5 8520* 10 34.0 95
6/7 3 * 10 33.0 9211 * 7 32.8 9120* 8 30.2 84
Avg. 38.1 ± 7.4 106*Specimens with visible voids on the bond-line edge.
**Nominal strength 35.9 MPa (5,200 psi) from the supplier
4.1 Aging plan
The 3-year aging plan is presented in Table 5. Specimens were selected according to themeasured RT strengths of controls from each bonded adherend strip. Bond-lines werephotographed and characterized by 3 categories: Void-free, those containing 1-2 visible voidsand those containing 3-5 visible voids. It is important to note that the voids are only visible alongthe bond edges. Specimens were too small for ultrasonic inspection of voids within non-visiblebonded area. Thus it was not possible to assess overall bond quality for each specimen. At leastfive specimens in each aging group (i.e. exposure time) were randomly selected from these threecategories and were also selected such that they were not derived from a single co-cured panel.Specimens were aged at 82°C (180°F) and 85% RH with pre-determined aging times. Prior toplacing the specimens in the aging chamber, they were labeled, baked-out at 66°C (150°F) for 1hour to eliminate moisture, and weighed. Control specimens were wrapped in a plastic bag and“aged” in desiccators at RT. A total of 160 specimens were required to conduct this study. Testsof control and aged specimens were conducted at RT and 82°C (180°F). The test intervals weremore frequent in the first year. Specimen weights after aging were recorded and fracture surfaceswere examined after testing.

Table 4. RT strength values for Panel #4 control specimens
StripID
SpecimenID
Bond-linethickness, mil
SLS strength,MPa
% of nominalstrength*
2/3 3 1 39.7 11111 1 40.7 13320 1 35.9 100
4/5 3 1 42.1 11711 1 45.6 12720 1 44.3 123
6/7 3 1 39.5 11011 1 44.4 12420 1 39.8 111
Avg. 41.3 ± 3.0 115*Based on nominal strength 35.9 MPa (5,200 psi) from the supplier
Table 5. Planned three-year aging schedule in 82°C/85% RH chambers and completed tests
Year Plannedaging time,
days
Completedaging time,
days
No.specimen
s
No.controls
No. specimenstested at RT
No. specimenstested at 82°C
1 0 0 0 10 5 530 35 12 0 6 690 95 12 0 6 6180 125 12 10 11 11270 185* 12 0 6 6360 12 10 11 11
2 540 12 10 11 11720 12 10 11 11
3 900 12 10 11 111080 12 10 11 11
Total 108 70 89 89* Specimens were not included in this report because the environmental chamber failed and the actual number ofdays of exposure is unknown
4.2 Results of control specimens “aged” in desiccators
The proposed three-year aging plan was revised after viewing the 95-day specimens results.Because the average strengths for the 35-day and 95-day specimens were substantially reducedcompared to the controls, the plan was modified and the remaining specimens were removedfrom the environmental chambers and tested on a monthly basis.
Results of control specimens aged up to 125 days in desiccators are tabulated in Table 6.Specimen grouping for each aging interval consisted of 6 specimens that were a mixture of void-free and specimens with voids. Strengths at RT and 82°C (180°F) for each aging time weremeasured and average strengths and strength retentions calculated. Elevated temperature (82°C)average strengths are provided in Tables 6 and 7 for completeness of the study; however, only

the RT nominal strength was provided by the supplier. Therefore, all comparisons are based onthis value.
Table 6. Strengths of control specimens aged in desiccators at RT
SpecimenID
No. ofvoids in
bone-line
Bond-linethickness,cm (mil)
Daysaged
Testtemp,
°C
SLSstrength,
MPa
Failure mode** Avg.strength,
MPa
% RTstrength
retention*A0-1 0 0.018 (7) 0 RT 37.3 80 CF, 20 TLC 37.8 ±
2.7105
A0-2 1-2 0.028 (11) 33.8 80 CF, 20 TLCA0-3 3-5 0.025 (10) 38.6 95 CF, 5 TLCA0-4 3-5 0.043 (17) 38.0 95 CF, 5 TLCA0-5 3-5 0.020 (8) 41.4 95 CF, 5 TLCA0-6 0 0.031 (12) 0 82 31.1 50 CF, 50 TLC 30.4 ±
2.085
A0-7 1-2 0.038 (15) 33.1 60 CF, 40 TLCA0-8 1-2 0.010 (4) 30.4 80 TLC, 20 CFA0-9 3-5 0.028 (11) 27.6 70 TLC, 30 CF
A0-10 3-5 0.008 (3) 29.7 80 TLC, 20 CFA180-1 0 0.031 (12) 125 RT 41.1 85 CF, 10 TLC, 5 LFT 36.6 ±
6.7102
A180-2 1-2 0.033 (13) 42.0 90 CF, 5 TLC, 5 LFTA180-3 1-2 0.025 (10) 30.4 70 CF, 20 TLC, 10 ASA180-4 3-5 0.025 (10) 28.3 70 CF, 20 AS, 10 TLCA180-5 3-5 0.028 (11) 41.1 90 CF, 5 TLC, 5 LFTA180-6 0 0.031 (12) 125 82 31.1 60 TLC, 40 CF 31.8 ±
0.888
A180-7 1-2 0.031 (12) 32.4 60 TLC, 40 CFA180-8 1-2 0.041 (16) 31.1 75 CF, 15 TLC, 10 ASA180-9 3-5 0.038 (15) 32.4 85 CF, 15 TLCA180-10 3-5 0.025 (10) n/a 60 TLC, 40 CF
*Based on nominal strength 35.9 MPa (5,200 psi) from the supplier**Failure modes: CF – cohesive, TLC – thin layer cohesive, LFT – light fiber tear, FT – fiber tear, AS – adhesivestarvation. Numerical values depict percentages.
Table 7. Strengths of control specimens aged in desiccators at RT
SpecimenID
Days agedin desiccators
Bond-linecharacteristics
Test temp,°C
Avg. strength,MPa
% Strengthretention*
A0 0 Void-free RT 37.3 ± 0 10482 31.1 ± 0 87
A180 125 RT 41.1 ± 0 11482 31.1 ± 0 87
A0 0 Void-containing RT 37.9 ± 3.0 10682 30.2 ± 2.3 84
A180 125 RT 35.5 ± 7.1 9982 32.0 ± 0.8 89
*Based on nominal strength 35.9 MPa (5,200 psi) from the supplier
As previously observed, SLS strength values were independent of bond-line thickness. Theseresults were further re-grouped for clarity by specimens with and without voids in Table 7. Void-free fresh specimens (i.e., specimens A0) exhibited RT average strength of 37.3 MPa (5,459 psi),

which was 104% of the nominal 35.9 MPa (5,200 psi) from the supplier. An average strength of30.2 MPa (4,380 psi) was measured at 82°C (180°F) and represented 84% retention of the RTvalue. Void-free specimens aged in the desiccators for 4.2 months (125 days) yielded an averagestrength of 41.1 MPa (5,954 psi) and 31.1 MPa (4,505 psi) at RT and 82°C (180°F), andrepresented strength retentions of 114% and 87%, respectively. As expected, RT aging indesiccators had no apparent effect on void-free specimens as both strength and strength retentionat RT and 82°C (180°F) were unchanged.
Void-containing specimens aged in desiccators behaved similarly to those void-free specimensreported above (see Figure 6). Apparently the presence of voids along the bond-line edge was notan effective discriminator in this aging condition. It was also noted that the standard deviationswere large in all cases for reasons that were not clear; +/-10% was a reasonable deviation for theadhesively bonded specimens
4.3 Results of strength retention for specimens aged in humidity chambers
Results of specimens aged at 82°C/85% RH up to 4.2 months (125 days) are tabulated in Table8. Typically the specimens exhibited an increase in weight of about 1% due to moisture uptake.

Table 8. Strengths of specimens aged in humidity chambers
SpecimenID
No. ofvoids in
bone-line
Bond-linethickness,cm (mil)
Daysaged
Testtemp,
°C
SLSstrength,
MPa
Failure mode** Avg.strength,
MPa
% RTstrength
retention*A30-1 0 0.018 (7) 35 RT 47.2 95 CF, 5 TLC 37.5 ±
6.3104
A30-2 0 0.003 (1) 37.7 70 CF, 30 TLCA30-3 0 0.031 (12) 38.3 95 CF, 5 LFTA30-4 1-2 0.031 (12) 34.1 95 CF, 5 TLCA30-5 3-5 0.031 (12) 30.3 75 CF, 25 TLCA30-6 0 0.010 (4) 35 82 27.8 80 CF, 20 TLC 26.8 ±
5.275
A30-7 0 0.018 (7) 30.8 75 CF, 25 TLCA30-8 0 0.038 (15) 32.1 75 CF, 25 TLCA30-9 1-2 0.028 (11) 24.2 70 CF, 15 TLC, 15 AS
A30-10 3-5 0.013 (5) 19.3 75 AS, 15 CF, 15 TLCA90-1 0 0.033 (13) 95 RT 36.8 55 CF, 40 LFT, 5 AS 30.7 ±
5.486
A90-2 0 0.020 (8) 35.6 70 CF, 20 TLC, 10 LFTA90-3 0 0.031 (12) 24.5 90 LFT, 10 FTA90-4 1-2 0.010 (4) 30.3 60 TLC, 40 CFA90-5 3-5 0.028 (11) 26.5 60 LFT, 40 CFA90-6 0 0.033 (13) 95 82 24.9 60 TLC, 40 CF 23.7 ±
2.966
A90-7 0 0.003 (1) 23.9 80 TLC, 20 CFA90-8 0 0.046 (18) 23.4 65 TLC, 35 CFA90-9 1-2 0.023 (9) 19.3 65 TLC, 25 CF, 10 AS
A90-10 3-5 0.020 (8) 27.3 60 CF, 40 TLCA180-1 0 0.038 (15) 125 RT 28.8 85 CF, 15 FT 29.6 ±
4.382
A180-2 0 0.003 (1) 37.0 50 CF, 50 TLCA180-3 0 0.031 (12) 29.8 90 CF, 5 TLC, 5 FTA180-4 3-5 0.028 (11) 28.5 95 CF, 5 FTA180-5 3-5 0.025 (10) 30.0 70 CF, 30 TLCA180-6 0 0.043 (17) 125 82 23.7 50 CF, 50 TLC 23.4 ±
1.565
A180-7 0 0.010 (4) 25.2 65 TLC, 35 CFA180-8 0 0.031 (12) 22.9 65 TLC, 35 CFA180-9 1-2 0.020 (8) 24.9 60 TLC, 40 CFA180-10 3-5 0.036 (14) 22.3 40 CF, 40 TLC, 20 AS
*Based on nominal strength 35.9 MPa (5,200 psi) from the supplier**Failure modes: CF – cohesive, TLC – thin layer cohesive, LFT – light fiber tear, FT – fiber tear, AS – adhesivestarvation
Specimen groupings for each aging interval consisted of 5 specimens that were a mixture ofvoid-free and specimens with visible voids along the bond-line edges. Strengths at RT and 82°C(180°F) for each aging time were measured and the average strength and strength retentionvalues were calculated. These results were further re-grouped for clarity by specimens with andwithout voids, with the results presented in Table 9.

Table 9. Avg. strengths of specimens aged in humidity chambers: void-free vs. void-containing
SpecimenID
Days aged Bond-linecharacteristics
Test temp,°C
Avg. strength,MPa
% Strengthretention*
A30 35 Void-free RT 41.0 ± 5.3 11482 30.2 ± 2.2 84
A90 95 RT 36.2 ± 0.8 10182 24.1 ± 0.8 67
A180 125 RT 31.9 ± 4.5 8982 23.9 ± 1.1 67
A30 35 Void-containing
RT 32.2 ± 2.6 9082 21.8 ± 3.4 61
A90 95 RT 28.4 ± 2.7 7982 23.3 ± 5.6 65
A180 125 RT 29.3 ± 1.1 8282 23.6 ± 1.8 66
*Based on nominal strength 35.9 MPa (5,200 psi) from the supplier
Percent strength retention measured at RT in Table 9 was plotted in Figure 4 for comparisonbetween void-free and void-containing specimens. Strength retention for the void-free specimenswas clearly better than those containing voids. Aged void-free specimens exhibited 100%strength retention up to 3.2 months (95 days) in the humidity chambers and 90% strengthretention after 4.2 months (125 days). On the other hand, the void-containing specimensexhibited 90% strength retention after only 1.2 months (35 days) of aging; then rapidly droppedto 80% retention afterwards.
Percent strength retention measured at 82°C (180°F) in Table 9 was plotted in Figure 5. In thiscase, strength retention for the void-free specimens is only marginally better than for thosecontaining voids. Aged void-free specimens maintained 85% strength retention up to 1.2 months(35 days), and then began to diminish. For the specimens containing voids, the strength retentionwas noted to drop immediately and reached 60% level at 1.2 months (35 days) of aging. Thevoid-containing specimens were more susceptible to moisture ingression and consequently beganto degrade quicker. After 35 days of aging, strength retention for both the void-free and void-containing specimens remained at ~65% up to 4.2 months (125 days) of aging.

Figure 4. Percent strength retention measured at RT for void-free vs. void-containing specimensaged in 82°C/85% RH chambers up to 125 days.
Figure 5. Percent strength retention measured at 82°C for void-free vs. void-containingspecimens aged in 82°C/85% RH chambers up to 125 days.

Percent strength retention in Figure 5 was comparable between void-free and void-containingspecimens aged after 35 days, with strength retention values leveling off in spite of the bond-linequality. This observation raised the possibility that voids were actually entrapped in the bulk ofthe “void-free” specimens but were not visibly detectable. As discussed, these specimens wereonly examined optically along the bond-line edges as shown in Figure 3.
The poor strength retention observed in this study requires further investigation to determine ifbond quality, excessive exposure temperature, or a combination of both were responsible. Sincethe bonded area of these specimens was too small for ultrasonic inspection, this issue will beaddressed in future work by fabricating specimens with larger bond areas. Additional SLSspecimens will be fabricated, aged and tested following ASTM D5868 [14] which specifies a 6.5sq-cm (1 sq-in) shear area versus the 3.2 sq-cm (0.5 sq-in) (ASTM D1002) used in the currentstudy. This larger bonded surface area will retard moisture ingression and allow for bond qualityinvestigation by non-destructive techniques such as c-scan. In addition, a lower agingtemperature of 71°C (160°F) under 85% RH will be investigated.
4.4 Failure modes of SLS specimens
Fracture surface failure modes were characterized according to ASTM D5573 [10]. Forspecimens aged up to 125 days, the failure modes were dominated by cohesive failure and thin-layer cohesive failure.
4.5 Solvent Exposure Results
At the time of this writing, solvent exposures had been conducted for only 6 hours. Thespecimens were placed in a container with sufficient liquid so as to immerse the samplescompletely. Tables 10 and 11 list the measured thermal transitions (i.e. Tgs) for the 0° and 90° 3-point bend specimens using the vicoelastic parameter, tan S , as measured by DMA; the graphsof the DMA runs are shown in Figures 6 and 7. The higher temperature transitions are due to theTg of the epoxy resin, the lower temperature transitions (~150-160 C) are not fully understood atthis time, but may be emanating from the thermoplastic polymeric toughener used in the resinformulation. Due to the measurement technique, the 0° specimens are configured in a manner sothat the properties of the fiber dominate the behavior of the specimens, likewise the 90°specimens are configured such that the properties of the matrix resin dominate the behavior. Theshift to higher Tgs for both the 0° and 90° specimens were surprising considering the shortexposure time to the solvent. In this study, the water exposure had little effect; however,prolonged exposure to water is known to result in significant drops in tensile and flexuralproperties due to the degradation of the fiber-matrix interface [6]. The T gs for the 0° (fiberproperty dominated) saline, jet fuel, deicer and hydraulic fluid exposed specimens increasedbetween 1 and 6 °C over the control and water exposed specimens. The 90° (resin propertydominated) specimens, showed a similar pattern; however, the increase in T g was morepronounced with the increase being between 4 and 12 °C.

Table 10. Glass Transition Temperature Values for 0° Specimens
Chemical Conditions Tg (°C)Control 219Water 217Saline 224
Jet Fuel 224Deicer 224
Hydraulic Fluid 226
Figure 6. Graph of the viscoelastic parameter vs. temperature for the fiber propertydominated, 0° specimens.

Table 11. Glass Transition Temperature Values for 90° Specimens
Chemical Conditions Tg (°C)Control 227Water 230Saline 241
Jet Fuel 240Deicer 241
Hydraulic Fluid 240
Figure 7. Graph of the viscoelastic parameter vs. temperature for the resin propertydominated, 90° specimens.

5. SUMMARY
SLS specimens were fabricated using state-of-the-art carbon fiber/epoxy laminates and AF-555M adhesive. The adhesive bond was cured in an autoclave under 310 KPa (45 psi) at 177°C(350°F) for 2 hours. Fresh specimens, with either void-free or void-containing bond-lines,yielded RT SLS strengths which were consistently >10% higher than the nominal 35.8 MPa(5,200 psi) reported by the manufacturer, and had 85% strength retention when measured at 82°C(180°F).
A three-year aging plan was initiated in 82°C (180°F)/85% RH chambers. Due to anunanticipated decrease in the measured SLS after the thirty and the ninety-day results the planwas modified to incorporate a monthly inspection, thereafter. Specimens were removed atspecific aging times and SLS strengths measured. Bond-line characteristics and thickness, andspecimen weights before and after aging were documented. Each aging time was composed of amixture of void-free and void-containing specimens for a total of five specimens. Control andaged specimens were tested under RT and 82°C (180°F) conditions.
For the controls stored in desiccators, both RT and 82°C (180°F) strength values remainedunchanged after 125 days for both void-free and void-containing specimens. For the agedspecimens in humidity chambers, RT strength retention for the void-free specimens was clearlybetter than for those with voids. Void-free specimens exhibited 100% strength retention with upto 3.2 months (95 days) of aging and 90% retention after 125 days of aging. On the other hand,specimens containing voids exhibited 90% strength retention after only 1.2 months (35 days) ofaging; subsequently, strength diminished more rapidly.
The 82°C (180°F) strength retentions for the void-free specimens were only marginally betterthan those with voids. Void-free specimens maintained 85% strength retention up to 1.2 months(35 days) of aging before diminishing.
The poor strength retention behavior after aging at 82°C (180°F) and 85% RH observed in thisstudy requires further investigation to determine if porosity in the bulk of the specimens is thecause of degradation of properties. Also, the exposure temperature may be too high for theadhesive.
After just a 6-hour exposure to commonly used aircraft solvents, the Tgs of the laminatesincreased between 1 and 11 ° C demonstrating the effect of the solvents on the carbon epoxycomposite. An increased Tg is indicative of increased stiffness and/or brittleness in the epoxymatrix. Future work will address solvent effects on the adhesive.
6. ACKNOWLEDGEMENT
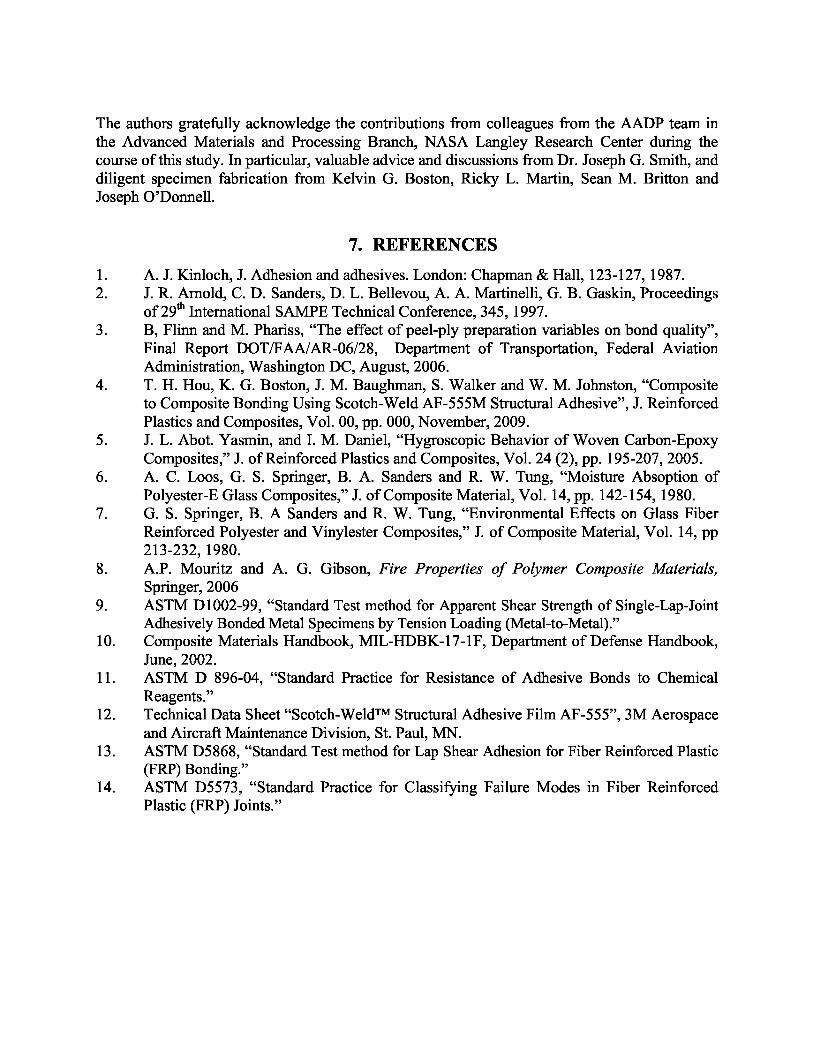
The authors gratefully acknowledge the contributions from colleagues from the AADP team inthe Advanced Materials and Processing Branch, NASA Langley Research Center during thecourse of this study. In particular, valuable advice and discussions from Dr. Joseph G. Smith, anddiligent specimen fabrication from Kelvin G. Boston, Ricky L. Martin, Sean M. Britton andJoseph O’Donnell.
7. REFERENCES
1. A. J. Kinloch, J. Adhesion and adhesives. London: Chapman & Hall, 123-127, 1987.2. J. R. Arnold, C. D. Sanders, D. L. Bellevou, A. A. Martinelli, G. B. Gaskin, Proceedings
of 29th International SAMPE Technical Conference, 345, 1997.3. B, Flinn and M. Phariss, “The effect of peel-ply preparation variables on bond quality”,
Final Report DOT/FAA/AR-06/28, Department of Transportation, Federal AviationAdministration, Washington DC, August, 2006.
4. T. H. Hou, K. G. Boston, J. M. Baughman, S. Walker and W. M. Johnston, “Compositeto Composite Bonding Using Scotch-Weld AF-555M Structural Adhesive”, J. ReinforcedPlastics and Composites, Vol. 00, pp. 000, November, 2009.
5. J. L. Abot. Yasmin, and I. M. Daniel, “Hygroscopic Behavior of Woven Carbon-EpoxyComposites,” J. of Reinforced Plastics and Composites, Vol. 24 (2), pp. 195-207, 2005.
6. A. C. Loos, G. S. Springer, B. A. Sanders and R. W. Tung, “Moisture Absoption ofPolyester-E Glass Composites,” J. of Composite Material, Vol. 14, pp. 142-154, 1980.
7. G. S. Springer, B. A Sanders and R. W. Tung, “Environmental Effects on Glass FiberReinforced Polyester and Vinylester Composites,” J. of Composite Material, Vol. 14, pp213-232, 1980.
8. A.P. Mouritz and A. G. Gibson, Fire Properties of Polymer Composite Materials,Springer, 2006
9. ASTM D1002-99, “Standard Test method for Apparent Shear Strength of Single-Lap-JointAdhesively Bonded Metal Specimens by Tension Loading (Metal-to-Metal).”
10. Composite Materials Handbook, MIL-HDBK-17-1F, Department of Defense Handbook,June, 2002.
11. ASTM D 896-04, “Standard Practice for Resistance of Adhesive Bonds to ChemicalReagents.”
12. Technical Data Sheet “Scotch-WeldTM Structural Adhesive Film AF-555”, 3M Aerospaceand Aircraft Maintenance Division, St. Paul, MN.
13. ASTM D5868, “Standard Test method for Lap Shear Adhesion for Fiber Reinforced Plastic(FRP) Bonding.”
14. ASTM D5573, “Standard Practice for Classifying Failure Modes in Fiber ReinforcedPlastic (FRP) Joints.”