Salanity stress,Salinity stressHeavy Metals toxicity,Effects of salinity on plants,Salt tolerance

THE EFFECTS OF SALINITY AND PHARMACEUTICALS ON THE
PHYSIOLOGY OF THE SHEEPSHEAD MINNOW (CYPRINODON
VARIEGATUS)
An Undergraduate Research Scholars Thesis
by
TAYLOR CUBBAGE
Submitted to the Undergraduate Research Scholars program at
Texas A&M University
in partial fulfillment of the requirements for the designation as an
UNDERGRADUATE RESEARCH SCHOLAR
Approved by Research Advisor: Dr. Lene Petersen
May 2019
Major: Marine Biology
Marine Fisheries

TABLE OF CONTENTS
Page
ABSTRACT .................................................................................................................................. 1
ACKNOWLEDGMENTS ............................................................................................................ 2
NOMENCLATURE ..................................................................................................................... 3
CHAPTER
I. INTRODUCTION ...................................................................................................... 4
Background ........................................................................................................... 4
Environmental and Anthropogenic Stressors........................................................ 7
Purpose of Thesis ................................................................................................ 11
II. METHODS ............................................................................................................... 13
The Effects of Salinity on Swimming Performance and Metabolism ................ 13
The Effects of Prednisone on Swimming Performance and Metabolism ........... 17
III. RESULTS ................................................................................................................. 20
Results of the Salinity Experiment ..................................................................... 20
Results of the Seven Day Prednisone Experiment .............................................. 23
Preliminary Results of the 21 Day Prednisone Experiment................................ 27
Comparison of the 21 Day and Seven Day Prednisone Experiments ................ 30
IV. DISCUSSION AND CONCLUSION ...................................................................... 34
Salinity Experiment ............................................................................................ 34
Seven Day Prednisone Experiment .................................................................... 37
Preliminary 21 Day Prednisone Experiment ...................................................... 40
Conclusion .......................................................................................................... 45
REFERENCES ........................................................................................................................... 46

1
ABSTRACT
The Effects of Salinity and Pharmaceuticals on the Physiology of the Sheepshead Minnow
(Cyprinodon variegatus)
Taylor Cubbage
Department of Marine Biology
Texas A&M University
Research Advisor: Dr. Lene Petersen
Department of Marine Biology
Texas A&M University
Natural and anthropogenic stressors in the environment, such as salinity and pharmaceuticals,
may affect fishes in sublethal ways measurable through non-invasive swim tunnel respirometry.
This method quantifies aerobic metabolism which represents the confines within which all
oxygen-requiring processes (e.g. growth and reproduction) occur. Critical swimming speed
(Ucrit) is also measured and further determines fishes’ ability to forage, evade predators, and
migrate. Three experiments using Sheepshead Minnow (Cyprinodon variegatus, SHM) were
conducted to determine the metabolism and swimming performance of freshwater and saltwater
acclimated SHM, SHM exposed to the pharmaceutical prednisone and a control for 7 days
(short-term), and 21 days (long-term). In the salinity experiment, no significant differences were
seen between groups, but interesting trends emerged. In the short-term prednisone experiment,
no differences were present, but changes in metabolism, Ucrit, COT, and EPOC were seen when
long-term prednisone exposed fish were compared with short-term prednisone exposed fish.
These results show that SHMs tolerate a wide range of salinities and while short-term prednisone
exposure had no effect on SHMs, long-term pharmaceutical exposure affects some of the
measured parameters. These studies further support the use of swim tunnel respirometry for
understanding how stressors affect fish physiology, and ultimately survival, in sublethal ways.

2
ACKNOWLEDGEMENTS
I would like to thank my undergraduate research scholar adviser and mentor, Dr. Lene
Petersen, for her constant support and guidance throughout my undergraduate career, as well as
PhD candidate Patricia Faulkner for her dedication to ensuring this project’s success, and finally
the multiple undergraduate students volunteering their time in the TAMUG physiology lab for
both initiating and one day completing this extensive study.
Thanks also to the chair of undergraduate research, Dr. Orissa Moulton and the
Undergraduate Research Scholars team, as well as Texas Sea Grant and the Aggies Commit to
Excellence Scholarship program for funding this research.
3
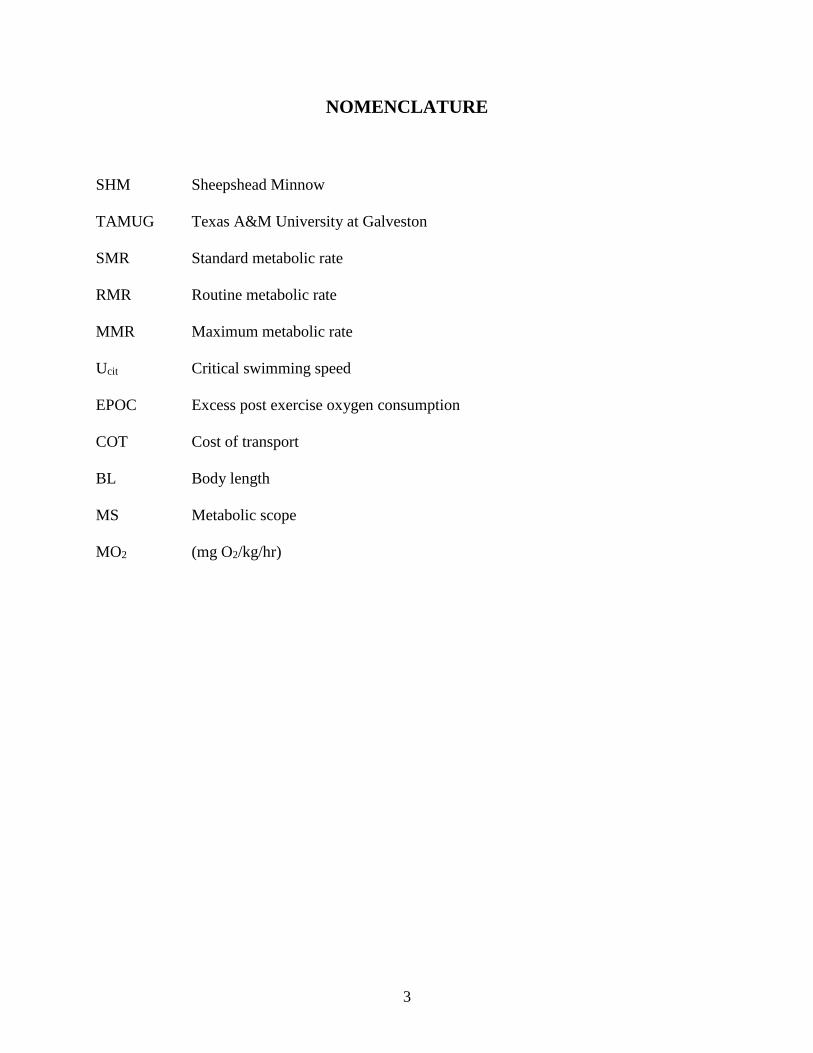
NOMENCLATURE
SHM Sheepshead Minnow
TAMUG Texas A&M University at Galveston
SMR Standard metabolic rate
RMR Routine metabolic rate
MMR Maximum metabolic rate
Ucit Critical swimming speed
EPOC Excess post exercise oxygen consumption
COT Cost of transport
BL Body length
MS Metabolic scope
MO2 (mg O2/kg/hr)

4
CHAPTER I
INTRODUCTION
The ultimate goal of animal physiology is to further our understanding of how organisms
function, interact with, and are impacted by their environment (Schmidt-Nielsen, 1997). In the
marine environment, the effects of natural abiotic parameters such as pH, temperature, dissolved
oxygen, and salinity on organismal function are of interest, particularly in understanding how
fluctuations or extremes in these parameters affect the physiological responses. General trends in
organism function can be determined through relatively non-invasive measurements such as
metabolism and swimming performance (Steffensen, Johansen, & Bushnell, 1984), which can
then help predict large scale changes in wild populations, ultimately leading to better
management and conservation of economically and ecologically important aquatic organisms
(Claireaux & Lefrançois, 2007). While this approach stemmed from a general curiosity to
explain how organisms cope with natural changes in the environment, anthropogenic actions
have led to considerable alterations to ecosystems that are also affecting aquatic organism
survival (Gebersdorf et al., 2015; Daughton & Ternes, 1999). Thus, this study will focus on how
both a natural stressor (e.g. salinity) and an anthropogenic stressor (e.g. pharmaceuticals)
separately impact the physiology of the Sheepshead Minnow (Cyprinodon variegatus), and to
elucidate how changes, if any, in organismal function may affect necessary life processes such as
locomotion and metabolism.
Background
Species of Interest: Sheepshead Minnow

5
One species of fish among the few considered ideal model organisms is the Sheepshead
Minnow (Cyprinodon variegatus, SHM). Found in Atlantic coastal waters and estuaries from
Maine to northern South America and the Caribbean (Rosen, 1973), numerous field and lab
studies have relied on the SHM’s abundance and manageable husbandry requirements to learn
about general fish physiology, morphology, and behavior (Nordlie,1985; Haney & Nordlie,
1997; Rountos, Gobler, & Pikitch, 2017). The ubiquity and success of the SHM in many habitats
is due in part to their euryhaline and eurythermal nature, with salinity tolerances from 0-142 ppt
(Renfro, 1960) and a thermal range of 0.6 to 45.1 degrees Celsius, depending on acclimation
temperature (Bennett & Beitinger, 1997). While these fish are able to tolerate wide fluctuations
in salinity (Nordlie, 1985; Haney & Nordlie, 1997), the question remains whether the cost of
osmoregulation in either salt or freshwater causes a notable difference in their ability to carry out
basic physiological processes. The SHM is also an ideal model organism for determining
potential sub-lethal effects of pharmaceutical exposure as it is one of the recommended fish
species by the EPA and OECD for toxicity testing of compounds (USEPA, 1996). If the
physiology of such a eurytopic and robust fish species is negatively affected by varying salinity
and/or pharmaceutical exposure, then this may highlight the need to study such stressors on more
sensitive, economically important fishes.
Response Variables of Interest: Swimming Performance and Metabolism
Swimming performance and metabolic parameters are useful parameters to determine the
ability of a fish to carry out all necessary life processes (Willmer, Stone, & Johnston, 2005).
Metabolism is essentially the sum of all enzyme-catalyzed chemical reactions an organism
carries out to maintain itself, and there are various metrics used to separate and better understand
metabolism as a whole. It is nearly impossible to quantify the minute cellular processes that
6
combine together to make up an organism’s metabolism, so oxygen consumption is measured
under the assumption that all reactions are aerobic and therefore require oxygen (Willmer, Stone,
& Johnston, 2005). Standard metabolic rate (SMR) is the oxygen consumption required only for
an organism to function and maintain life, with no other oxygen demands than cellular
respiration, active ion pumping, the heart beating, and blood flowing. This is impossible to
measure, so it is extrapolated from routine metabolic rate (RMR), which includes an organism’s
oxygen consumption when it is completely at rest with minimal movement, in a post-absorptive
state, and not influenced by reproductive activities. In contrast, maximum metabolic rate (MMR)
is the oxygen consumption of an organism that is performing at its maximum capacity, whether
that be escaping from predators, chasing prey, or being required to swim or run maximally in a
laboratory setting. This rate is measured as the oxygen consumption right before exhaustion is
reached (Willmer, Stone, & Johnston, 2005). For aquatic animals in particular, critical swimming
speed (Ucrit) can then be calculated after the organism has experienced an incremental velocity
swim trial in a swim tunnel respirometer (Steffensen, Johansen, & Bushnell, 1984). Ucrit is the
maximum swimming speed reached before exhaustion, and represents the greatest locomotory
capabilities of an organism (Petersen & Gamperl, 2010). Metabolic scope can then be measured
by subtracting MMR from SMR to understand the aerobic metabolic confines in which that
organism carries out all processes necessary for life (Willmer, Stone, & Johnston, 2005), and is
an important measure of fitness for linking environmental changes to organismal function
(Claireaux & Lefrançois, 2007). This range can then be compared across individuals and
treatment groups to elucidate if changes in metabolic scope occur based on the factor being
tested. Any decrease in metabolic scope will compromise aerobic processes such as growth,
7
reproduction, and immune function. On the contrary, an increase in metabolic scope suggests
that the animal has a larger aerobic capacity which can enhance the above-mentioned processes.
Two additional metabolic parameters are excess post-exercise oxygen consumption
(EPOC) and cost of transport (COT) that provide more insight on organismal function. EPOC is
the measure of oxygen consumption after Ucrit has been reached, and is an indicator of recovery
time as well as the non-aerobic demands of restoring balance to the body after exercise. Post-
exercise, organisms must expend extra energy regaining oxygen and phosphate stores in tissues,
metabolizing buildup of lactic acid, and realigning osmotic and ionic balances, and EPOC is an
estimation of this cost of recovery as well as anaerobic capacity (Lee et al., 2003). COT is the
energetic cost (in Joules) required to move one kilogram of body weight one kilometer, and
indicates how efficiently an organism can move itself (Willmer, Stone, & Johnston, 2005). For
instance, a low COT shows a more efficient way of locomotion. In addition, the COT curve
usually has a dip in the middle speed ranges where swimming is more efficient, while the
slowest and fastest speeds usually curve upwards and require more energy.
Environmental and Anthropogenic Stressors
Salinity and its Effects on Fish Physiology
Fishes are found in a variety of aquatic habitats ranging from salinities of 0 parts per
thousand (ppt) to 142 ppt (Gonzales, 2012; Renfro, 1960). While most fishes are adapted to a
specific range of salinity due to the constant ionic concentrations of most freshwater and marine
habitats, some euryhaline species can tolerate wide ranges of salinities. Strictly freshwater fishes
are hyper-osmotic, maintaining internal solute concentrations at higher levels than the external
environment. This is carried out by actively absorbing sodium and chloride ions at the gills,
gaining ions through their food, resorbing ions in the kidney tubules, and excreting excess water
8
that passively enters the body by producing large amounts of dilute urine (Evans et al., 2005). In
contrast, marine fishes are considered hypo-osmotic and have internal solute concentrations
lower than their saline environments. Maintenance of this gradient is carried out by active
excretion of ions at the gills, constant intake of seawater to replace water lost through osmosis,
and excretion of ions gained through imbibed seawater and those diffused into the branchial
tissue, while limiting urine release (Gonzales, 2012).
Many studies have attempted to quantify this cost of osmoregulation by measuring
changes in metabolism of whole, living fishes as they acclimate to different salinities, with
oxygen consumption being measured as a proxy for total aerobic metabolism. Certain trends in
the literature have emerged, including studies that have found no change in metabolism,
metabolism is lowest in an isotonic environment to the fish, metabolism and fluctuant salinity are
linearly related, the highest metabolic rates are found in freshwater, and the highest metabolic
rates are found in saltwater (Ern et al., 2014). The variability in these results is mainly due to the
different species used, their natural habitats, exposure time, and oxygen consumption
measurement methodologies. With estimates of osmoregulation processes requiring 20-68% of
total organismal oxygen consumption (Boef & Payan, 2001), the energy sources used to fuel
osmoregulation are of interest. Tseng and Hwang (2008) reviewed many studies on the use of
lipids, proteins, and carbohydrates as the main energy source for osmoregulatory processes in
fishes, and found that the literature heavily supported the latter as the most important
macromolecule. This could be due to the greater volume of studies performed on carbohydrates
such as glucose, but the recent discovery of a novel glucose transporter in gill ionocytes (Tseng
et al., 2007) further proves its importance and that we still have much to learn about
osmoregulation in fishes. As osmoregulation requires considerable energy reserves to maintain
9
internal homeostasis, salinity conditions outside a fish’s optimal range may be so metabolically
demanding for osmoregulation that swimming performance and hence foraging, predator
evasion, and ability to migrate may be impaired. It is therefore imperative to study the effects of
salinity on basic physiological processes such as swimming performance, while measuring
metabolism will inform us of potential increases in metabolic demands.
Micropollutants in Aquatic Environments
As we become more aware of our impacts on natural ecosystems, an emerging
anthropogenically induced threat is the low-level release of micropollutants such as
pharmaceuticals, personal care products, and industrial chemicals into waterways and eventually
the ocean (Gebersdorf et al., 2015; Daughton & Ternes, 1999). Common point sources for these
compounds include manufacturing facilities and municipal, domestic, and industrial waste water
treatment plants (WWTPs), while serious flooding events that damage waste water infrastructure
can lead to diffuse release of untreated sewage. The unregulated release of these compounds has
occurred for decades as regulating agencies did not consider relatively low quantities (ng-µg/L) a
danger to habitats and biota because required ecotoxicology assays, such as lethal dosage (LD50),
mainly quantify acute effects focusing on mortality (Daughton & Ternes, 1999). A considerable
body of evidence is emerging that consistent release of micropollutants into aquatic
environments may have sub-lethal, transgenerational effects on resident organisms (Daughton
&Ternes, 1999; Gerbersdorf et al., 2015; Fent, Weston, & Caminada, 2006). The list of novel
compounds entering the global market continues to grow, and the task to monitor the impacts of
individual compounds as well as cocktail mixtures on natural systems is daunting. By
determining the effects of the most common compound classes at environmentally relevant
concentrations on resident model species, such evidence can be used to highlight the need for a
10
more precautionary approach to regulate the creation, evaluation, and management of
micropollutants (Gerbersdorf et al., 2015).
Effects of Pharmaceuticals on Fishes
Pharmaceuticals are of particular interest of the micropollutants because of their purpose
to alter human and domestic animal physiology; once in aquatic habitats, active parents and
metabolites of pharmaceuticals can affect nontarget organisms in both predictable and
unpredictable ways (Corcoran, Winter, & Tyler, 2010). Fishes are of particular concern because
of their incredibly diverse niches, global distribution, physiological and genetic similarity to
mammals, and particular vulnerability to pharmaceuticals and xenobiotics (Corcoran, Winter, &
Tyler, 2010). Absorption of generally nonpolar pharmaceuticals can occur through the skin,
highly permeable gills, eaten in the diet, and transferred maternally through lipid stores in eggs,
with sensitive early life stages even more at risk. Studies concerning the most common
pharmaceuticals in the aquatic environment (non-steroidal anti-inflammatory drugs, azoles,
fibrates, beta-blockers, antibiotics, antidepressants, and synthetic steroidal oestrogens) and their
effects on fishes are reviewed by Corcoran, Winter, and Tyler (2010). While detection levels are
often between the ng/L and µg/L in surface waters, most laboratory studies have only observed
negative effects on fishes using concentrations a magnitude higher than environmentally relevant
levels. It is important to consider, though, that most studies are confined to measure responses
from relatively acute, high-dose, single generation experiments that do not focus on sub-lethal or
whole organism effects. The main pharmaceutical class with a clear correlation between
environmentally relevant pharmaceutical levels and negative impacts are synthetic oestrogens,
particularly ethinylestradiol (EE2), that cause intersex development and reduced fertility in
certain fish populations near WWTP effluent sources (Jobling et al., 2005).

11
One class of pharmaceuticals that is widely used, yet relatively under-researched in
fishes, are synthetic glucocorticoids that are prescribed heavily in humans to reduce
inflammation. Human subject studies reveal persistent negative side-effects such as proteolysis,
hyperglycemia, reduced immunity, and psychological distress (Horber & Haymond, 1990; Judd
et al., 2014). Recent studies exposing fishes to synthetic glucocorticoids have revealed similar
effects to those in humans (increased blood glucose, reduced lymphocyte counts) as well as
unexpected (decreased plasma vitellogenin, increased expression of male secondary sex
characters) results at concentrations from 0.1-10 µg/L (Kugathas, Runnalls, & Sumpter, 2013;
Margiotta-Casaluci et al., 2016). Both studies by Kugathas et al. (2013) and Margiotta-Casaluci
et al. (2016) highlight the need to determine and subsequently expose fishes to environmentally
relevant concentrations of synthetic glucocorticoids. Courtesy of consistent sampling by the
TAMUG Toxicology laboratory, remarkably high concentrations of the glucocorticoid
prednisone (~2000 ng/L) were detected in Galveston Bay after a hurricane event that caused
incredibly widespread flooding and failing of WWTPs in and around Houston, Texas (Petersen
& Hala, unpublished). This empirical evidence now provides an accurate, environmentally
relevant exposure concentration for future studies such as this to understand the sub-lethal effects
of prednisone on fishes.
Purpose of Thesis
Analyzing the relevant literature concerning how both natural and anthropogenic
stressors impact fishes and recognizing the importance of using advanced, non-invasive
techniques in physiology have driven the purpose of this thesis. Evident gaps in the literature,
such as aspects of osmoregulation and pharmaceutical exposure in fishes, will be augmented by
the results of this study, which entails quantifying variation in swimming performance and

12
metabolism due to osmoregulatory differences in freshwater and saltwater SHM and, separately,
acute and chronic synthetic glucocorticoid exposure on freshwater SHM. My testable and
working research hypotheses are: 1) salinity has a significant negative effect on SHM swimming
performance but increases metabolism due to increased energy demand of osmoregulation; and
2) seven-day and 21-day prednisone exposure will independently cause an increase in swimming
performance and metabolism due to the known hyperglycemic effects of prednisone which
should enhance aerobic glucose metabolism that can fuel energy demanding tissues such as
swimming muscles.
13
CHAPTER II
METHODS
This study of fish physiology covers two separate experiments, first observing the effects
of salinity on the swimming performance of SHM, and second observing acute and chronic
effects of the pharmaceutical prednisone on SHM swimming performance and metabolism.
The Effects of Salinity on Swimming Performance and Metabolism
Sheepshead Minnow Husbandry
To determine the effects of ambient salinity on the swimming performance and metabolic
processes of SHM, two groups with a target sample size of eight fish each (N=8) were used. The
first group consisted of juvenile-adult (5-month old) female SHM purchased from Aquatic
BioSystems, Inc. (Fort Collins, CO, USA) that were maintained in a 300-liter recirculating
system of 0.5 ppt freshwater in the TAMUG physiology lab. The second group consisted of
female SHM raised through the SHM culturing class at TAMUG. Fish were constantly
maintained at 15-20 ppt saltwater in 150 L recirculating tanks. Both FW and SW fishes were fed
a diet of Tetra Flakes, with FW fish being fed once daily and SW fish being fed three times daily
until satiation. Only female fish were selected due to the possible differences in metabolic
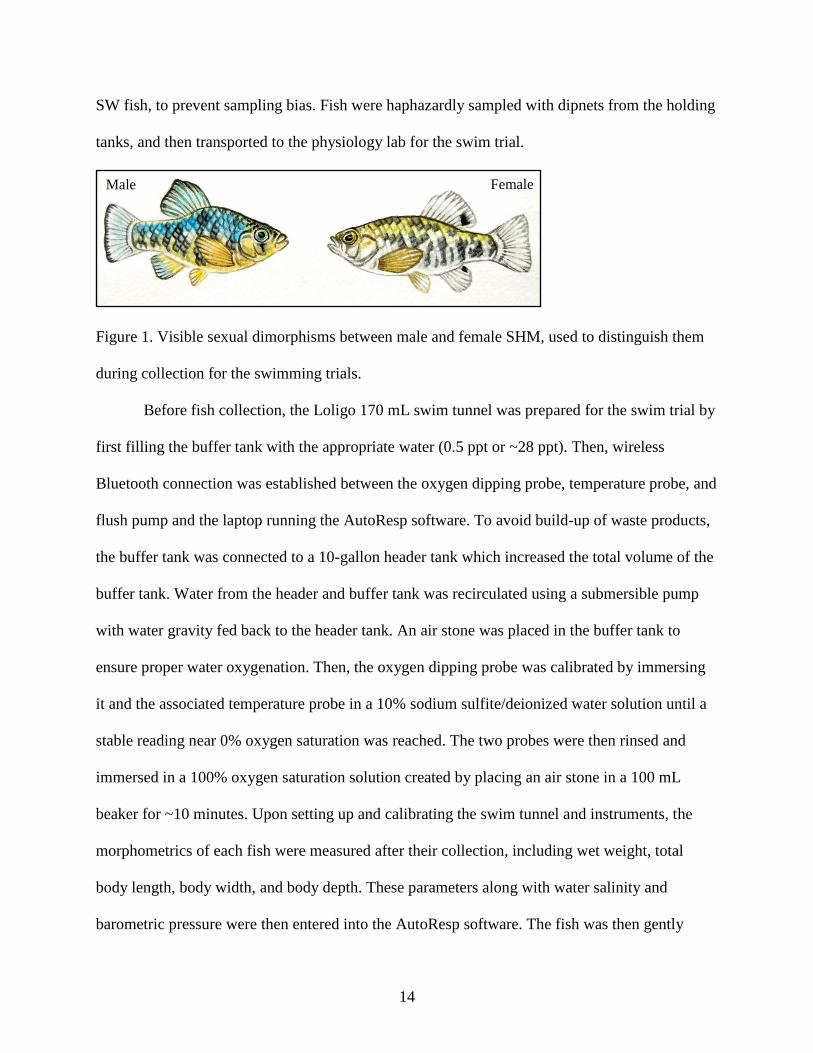
demands and swimming performance between the sexes. All females were distinguished from
males based on the sexually dimorphic traits seen in Figure 1.
Experimental Design
Fish from either the freshwater (FW) group or the saltwater (SW) group were collected
for swim trials alternately, i. e. if a FW fish was swum one day, the next fish swum would be a
14
SW fish, to prevent sampling bias. Fish were haphazardly sampled with dipnets from the holding
tanks, and then transported to the physiology lab for the swim trial.
Figure 1. Visible sexual dimorphisms between male and female SHM, used to distinguish them
during collection for the swimming trials.
Before fish collection, the Loligo 170 mL swim tunnel was prepared for the swim trial by
first filling the buffer tank with the appropriate water (0.5 ppt or ~28 ppt). Then, wireless
Bluetooth connection was established between the oxygen dipping probe, temperature probe, and
flush pump and the laptop running the AutoResp software. To avoid build-up of waste products,
the buffer tank was connected to a 10-gallon header tank which increased the total volume of the
buffer tank. Water from the header and buffer tank was recirculated using a submersible pump
with water gravity fed back to the header tank. An air stone was placed in the buffer tank to
ensure proper water oxygenation. Then, the oxygen dipping probe was calibrated by immersing
it and the associated temperature probe in a 10% sodium sulfite/deionized water solution until a
stable reading near 0% oxygen saturation was reached. The two probes were then rinsed and
immersed in a 100% oxygen saturation solution created by placing an air stone in a 100 mL
beaker for ~10 minutes. Upon setting up and calibrating the swim tunnel and instruments, the
morphometrics of each fish were measured after their collection, including wet weight, total
body length, body width, and body depth. These parameters along with water salinity and
barometric pressure were then entered into the AutoResp software. The fish was then gently
Male
Female
15
guided into the tunnel, the tunnel stopper put into place, and the flush pump turned on to
circulate water through the tunnel. The body length (BL) of the fish was input into an Excel
calibration sheet to generate the appropriate BL/s speeds and associated measurement on the
swim tunnel motor that generates the desired water current. The 0.25 BL/s speed was then set on
the swim tunnel system to generate a comfortable flow for the fish and a black sheet was placed
over the tunnel to create a calm environment for the overnight acclimation period. A small video
camera was used to monitor the fish’s condition without disturbance.
The following morning, the Ucrit swim trial with intermittent respirometry began. The
intermittent velocity steps were set up in the AutoResp program by setting the flush pump to run
for 240 seconds. This “flushes” the tunnel with fresh water to replenish the water in the tunnel.
This step is followed by closing the tunnel by turning off the flush pump for 600 seconds. The
change in dissolved oxygen level in the tunnel is then recorded over 600 seconds as the fish
swims at the initial 0.25 BL/s. The third step includes another flushing period to return the
dissolved oxygen level in the tunnel back to initial levels before the speed was increased and the
measuring period began again. This cycle was repeated with increasing water current (increase of
0.5 BL/sec per cycle), requiring the fish to swim faster to maintain position in the tunnel. The
swim intervals continued at faster speeds until the fish reached exhaustion, a condition
determined by the fish resting at the back of the tunnel for more than ten seconds as the speed
was turned down and the fish did not attempt to continue swimming. Upon the fish reaching
exhaustion, the water flow was reduced to 0.25 BL/s and the tunnel settings turned to “flushing”,
to introduce oxygenated water. The AutoResp program was then adjusted to measure excess
post-exercise oxygen consumption (EPOC). During this cycle of measurement, the tunnel was
flushed for 120 seconds, closed, and then dissolved oxygen was measured for 240 seconds. This
16
cycle was repeated at 0.25 BL/s until the calculated fish oxygen consumption (MO2) reached
resting oxygen consumption levels (those measured at the initial 0.25 BL/s interval at the
beginning of the swim trial) and remained relatively constant for two measuring periods. Upon
completion of the trial, the fish was euthanized in a solution of sodium bicarbonate buffered MS-
222 at a concentration of 2.5mg/L, and then tissues samples of the brain, heart, liver, gonads, and
muscle were taken for steroid analysis to be conducted using LC-MS/MS at a later date.
Calculation of Metabolic and Swimming Performance Parameters
All data was collected during the swim trial using the AutoResp software on a laptop,
which was wirelessly connected to the swim tunnel and its associated oxygen and temperature
probes. Constantly during the trial, MO2 values (mg O2/kg/hr) of the fish are calculated and
saved in AutoResp. The data collected are then transferred to Microsoft Excel with the raw mg
of O2 data points, fish weight, and time listed. MMR was determined as the highest MO2 value
each fish obtained prior to exhaustion, and RMR was determined as the MO2 obtained as the
resting speed of 0.25 BL/s. SMR of each fish was estimated as the y-intercept of the semi-log
plot of MO2 vs speed in BL/s that was generated post-swim trial in Excel. Metabolic scope (MS)
was then calculated as the difference between MMR and SMR for each fish. Maximum
swimming speed, Ucrit, for each fish was calculated using the following formula from Brett
(1965), where Ucrit is the critical swimming speed in BL/s, Uf is the water velocity of the
penultimate increase in BL/s, tf is the time spend swimming at the final increase in speed, ts is the
time interval of each full cycle, and Us is the change in water velocity of each cycle in BL/s.
Ucrit= Uf + tf (tsUs) -1
Excess-post exercise oxygen consumption (EPOC) was estimated by calculating the area
under the curve of the 6th order polynomial equation fitted to MO2 vs. time (in minutes) collected
17
during the EPOC measurement period. Cost of transport (COT) was then calculated for each
swimming speed of each fish, by converting the MO2 (g O2/kg/hr) to calories/kg/hr with the
conversion factor 3.14 cal per g O2, then to Joules/kg/hr with the conversion factor of 4.18 J per
calorie; then the speed values in cm/s were converted to cm/hr and then to km/hr, so that finally
the J/kg/hr value was divided by the speed at km/hr to get a COT value in J/kg/km.
The Effects of Prednisone on Swimming Performance and Metabolism
Experimental Design
Two prednisone dosing trials were carried out, one exposing treatment group SHM to
1000 ng/L prednisone and control group SHM 0.001% dimethylformamide (DMF) solvent
(solvent control) for seven days before the swim trial, and another exposing treatment and
control SHM for 21 days before the swim trial.
Seven Day Exposure Study
A total of 32 female SHM were utilized from the freshwater-acclimated Aquatic
BioSystems, Inc. stock for the seven-day exposure study. Four 9.5 L static tanks were set up in
the physiology laboratory, two serving as prednisone “treatment”, tanks 1 and 2, and two serving
as the DMF “solvent control”, tanks 1 and 2. Four female SHMs were then placed into each of
the four tanks. To maintain an exposure period of seven to eight days, and because only one fish
could be swum per day, a staggered approach was taken by adding all four fish to one of the four
tanks every other day, for eight days. In each tank, two fish were used for the swim trial to
collect swimming performance and metabolism data and then sacrificed for tissue samples, and
the remaining two fish were not swum and only sacrificed for tissue samples to avoid the conflict
of potential stress from the swimming trial.
18
Once the first tank reached seven days of exposure, one fish was taken from the tank and
subjected to the swim trial and tissue collection as described above. Two non-swimming fish
were then sacrificed and their tissues were collected on the day of the swim trial. The subsequent
day the remaining fish was removed from the tank for the swim trial and tissues were collection.
This cycle was repeated for each of the two treatment and two solvent control tanks during the
first seven-day exposure trial. Upon completion of the first seven-day trial, this entire process
was repeated again with four fish in each tank. This process was repeated due to limitation of
tanks and personnel to maintain the exposure tanks. A total of 16 fish (eight treatment and eight
control) were swum and sampled for tissues, and 16 fish sacrificed for tissue samples only (eight
treatment and eight control).
As this was a static and not a flow-through system, a 50% water change was performed
on each of the four tanks ever day to maintain dosing levels and adequate water parameters.
Water quality parameters (ammonia, nitrite, nitrate, free/total chlorine, pH, hardness,
temperature, and dissolved oxygen) were recorded for each tank every three days using
commercial testing kits, test strips, and a YSI probe. The prednisone treatment tanks were
maintained at an exposure of 1000 ng/L prednisone, while the solvent control tanks were
maintained at 0.001% DMF. The 9.5 L tanks were marked at the four liter and two-liter levels,
and each day two liters were siphoned out along with any food and debris, and then replaced in
each of the four tanks. For a water change in the DMF solvent control tanks, water and debris
was siphoned out to the two-liter water mark into a waste bucket, and then two liters of filtered
fresh water from the 300 L stock tank was added back to the tank. Then, 20µl of 100% DMF was
added to the four liters of tank water to return the DMF concentration to 0.001%. For a water
change in one of the prednisone treatment tanks, water and debris were siphoned from the tank

19
until two liters of water was siphoned out into a waste bucket. Then, a mixture of 1000ng/L
prednisone was created by diluting 400 µl of 10 ppm prednisone solution into 3999.6 ml of fresh
water taken from the 300 L stock tank. This solution was mixed with a stir bar on a magnetic
plate for approximately two minutes, and then the two liters removed from the 1000 ng/L
treatment tanks were replaced with this newly prepared prednisone solution. After ever water
change in the prednisone treatment tanks, a one-ml water sample was taken, placed in an amber
vial, preserved with 0.5 µl of 6 molar hydrochloric acid, and 5 µl of 100 ppb D9-progesterone
was added for future LC-MS/MS analysis to confirm that the prednisone concentration was
continuous throughout the exposure period. Fish were fed approximately two crushed Tetra
Flakes each, every other day, and this process of water changes and measuring water chemistry
was carried out over 14 days so that each group of fish was exposed to either the prednisone
treatment or solvent control for seven days prior to being swum in the tunnel and/or sacrificed
for tissue samples. Upon reaching the seven-day mark for a tank, a fish was removed and the
same methodology for the intermittent swim tunnel respirometry trial was used that is described
in the salinity experiment above, including euthanasia and tissue collection.
21 Day Exposure Study
The same husbandry, tank maintenance, and swim trial methodology for the seven-day
experiment was utilized during the chronic prednisone exposure experiment, with the exception
of fish being maintained for 21 days before the swim trial instead of seven days. Two 21-day
exposure periods will be completed for an expected total of N=8 for the treatment and control
groups, but at the time of composing this thesis only the first 21-day exposure period was
complete for analysis.

20
CHAPTER III
RESULTS
Results of the Salinity Experiment
Swim trials were successfully completed for four saltwater acclimated female SHM and
seven freshwater acclimated female SHM. Average body morphometric data of the two groups
can be seen in Table 1. None of the morphometric parameters were significantly different
between the SW and FW groups.
Table 1. Average body morphometrics of the saltwater and freshwater acclimated SHM used in
the salinity study. All values are mean ± standard error.
Body Morphometric Saltwater Fish Freshwater Fish T-test p-value
Total length (cm) 4.25±0.68 3.8 ±0.13 0.11
Wet weight (grams) 2.81±2.24 1.64±0.77 0.22
Condition factor (K) 3.130.88 3.03±1.58 0.91
The metabolic parameters measured during the swim trials, including SMR, RMR, and
MMR as well as metabolic scope can be seen in Figure 2. As expected, SMR had the lowest
MO2 values, RMR the second highest values, and MMR had the highest values for both groups.
No metabolic parameters were significantly different between the FW and SW groups. As seen
in Figure 3, there was a linear increase in the log of the oxygen consumption (LogMO2) as
swimming speed increased for both FW and SW fish, with little variation between them. The
average Ucrit values were 5.37 BL/s for FW fish and 5.58 BL/s for SW fish, and did not vary
significantly (Figure 4).

21
Figure 2. Comparisons of average metabolic parameters between the FW (N=7) and SW (N=4)
acclimated groups. Data shown are mean ± standard error.
Figure 3. Comparison of average linear increase in oxygen consumption (LogMO2) with
swimming speed between the FW and SW acclimation groups.

22
Figure 4. Comparison of average Ucrit during the swimming trial between the FW (N=7) and SW
(N=4) acclimated groups. Data shown are mean ± standard error.
There were also no significant differences in the COT or EPOC values between FW and
SW fish, but certain data points show potential trends. For example, the COT across multiple
speeds was higher for SW fish than FW fish (Figure 5), and the average EPOC for SW fish was
greater than the average EPOC of FW fish (Figure 6).
Figure 5. Comparison of COT values with increasing speed between FW and SW fish.

23
Figure 6. Comparison of MO2 values post-exercise, and the resulting calculated EPOC values
under the curve for both FW and SW fish.
Results of the Seven-day Prednisone Experiment
We successfully completed swim trials for six solvent control fish, and five prednisone
exposed fish, and the average morphometric values measured (total length, weight, and condition
factor) were not significantly different between the control and prednisone groups (Table 2).
Table 2. Average body morphometrics of the solvent control and treatment SHM groups used in
the seven-day prednisone study. All values are mean ± standard error.
Body Morphometric Solvent
Control Fish Treatment Fish
T-test p-value
Total length (cm) 3.83±0.25 4.18±0.25 0.59
Wet weight (grams) 1.18±0.58 1.37±0.29 0.52
Condition factor (K) 2.72±0.29 2.56±0.52 0.53
24
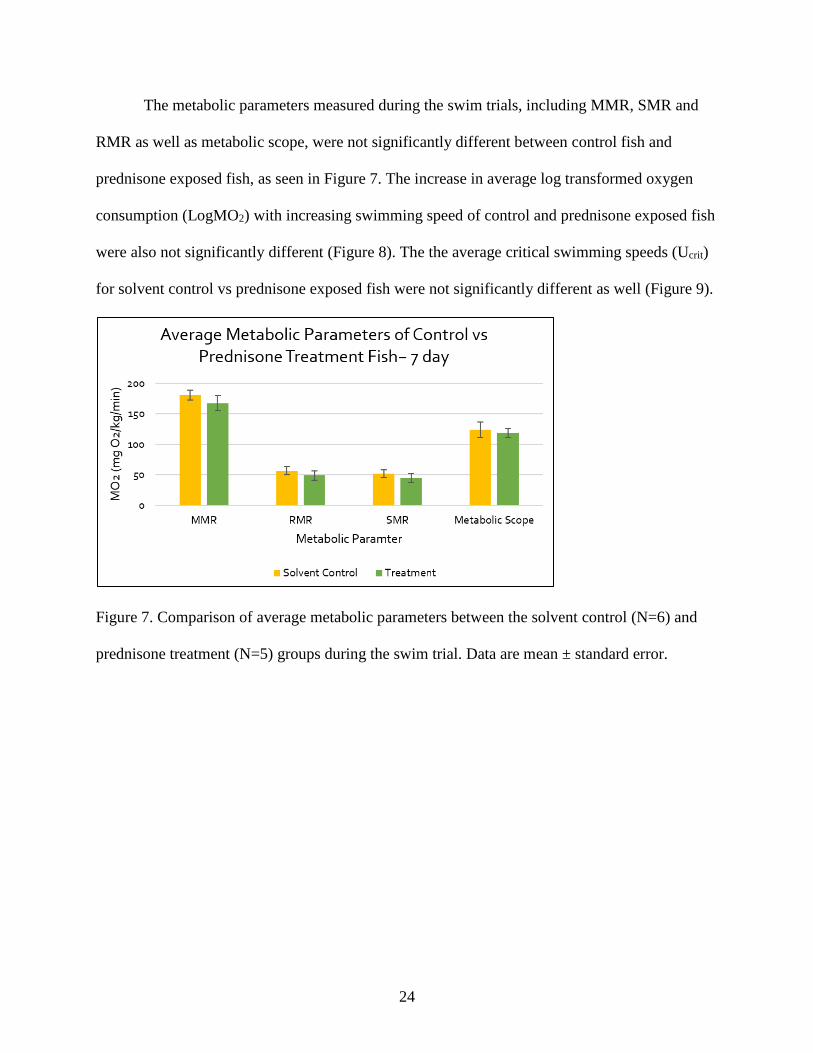
The metabolic parameters measured during the swim trials, including MMR, SMR and
RMR as well as metabolic scope, were not significantly different between control fish and
prednisone exposed fish, as seen in Figure 7. The increase in average log transformed oxygen
consumption (LogMO2) with increasing swimming speed of control and prednisone exposed fish
were also not significantly different (Figure 8). The the average critical swimming speeds (Ucrit)
for solvent control vs prednisone exposed fish were not significantly different as well (Figure 9).
Figure 7. Comparison of average metabolic parameters between the solvent control (N=6) and
prednisone treatment (N=5) groups during the swim trial. Data are mean ± standard error.

25
Figure 8. Comparison of the average linear increase in oxygen consumption (LogMO2) with
swimming speed between the solvent control and prednisone exposed groups.
Figure 9. Comparison of average Ucrit during the swimming trial between the solvent control
(N=6) and prednisone exposed (N=5) groups. Data are mean ± standard error.
Similar to the metabolic parameters and Ucrit measurements, both COT and EPOC values
were not significantly different between the solvent control and prednisone treatment groups,
with considerable similarity in the response variables between the control and treatment fish
(Figures 10 and 11).

26
Figure 10. Comparison of COT values with increasing speed between solvent control and
treatment fish.
Figure 11. Comparison of MO2 values post-exercise, and the calculated EPOC values for solvent
control and treatment fish.

27
Preliminary Results of the 21-day Prednisone Experiment
We successfully completed swim trials for three prednisone exposure fish and two
solvent control fish during the first 21-day trial. The morphometrics of sample fish, including
total length, wet weight, and condition factor, are included in Table 3 and did not differ
significantly between prednisone exposure and control fish.
Table 3. Average body morphometrics of the solvent control and treatment SHM groups used in
the seven-day prednisone study. All values are average ± standard error.
Body Morphometric Solvent
Control Fish Treatment Fish
T-test p-value
Total length average
±SD (cm) 3.9±0.20 3.43±0.13
0.13
Wet weight average
±SD (grams) 1.06±0.05 1.09±0.18
0.90
Condition factor
average ±SD (K) 2.83±0.63 2.93±0.36
0.86
The average metabolic parameters, including MMR, RMR, SMR, and metabolic scope
did not vary between the prednisone and control fish, as seen in Figure 12. LogMO2 values
increased linearly with increasing swimming speed as seen in Figure 13, and also did not vary
significantly between the two groups.

28
Figure 12. Comparison of average metabolic parameters between the 21-day prednisone exposed
(N=3) and solvent control (N=2) fish. Data are mean ± standard error.
Figure 13. Comparison of LogMO2 values and increasing swimming speed between 21-day
prednisone and solvent control fish.

29
Figure 14. Comparison of average Ucrit speeds between 21-day prednisone (N=3) and solvent
control (N=2) fish. Data are mean ± standard error.
The COT values for all speeds of the 21-day prednisone exposed and solvent control fish
were not significantly different (Figure 15), and MO2 values post exercise as well as total EPOC
were not significantly different between the two groups (Figure 16).
Figure 15. Comparison of COT over the entire swimming speed range of 21-day prednisone and
solvent control fish.

30
Figure 16. Comparison of EPOC measures after exercise between 21-day prednisone and solvent
control fish.
Comparison of Seven-day and 21-day Prednisone Experiments
In addition to comparing the treatment and control fish in the independent seven and 21-
day studies, the parameters measured were compared between the seven and 21-day studies to
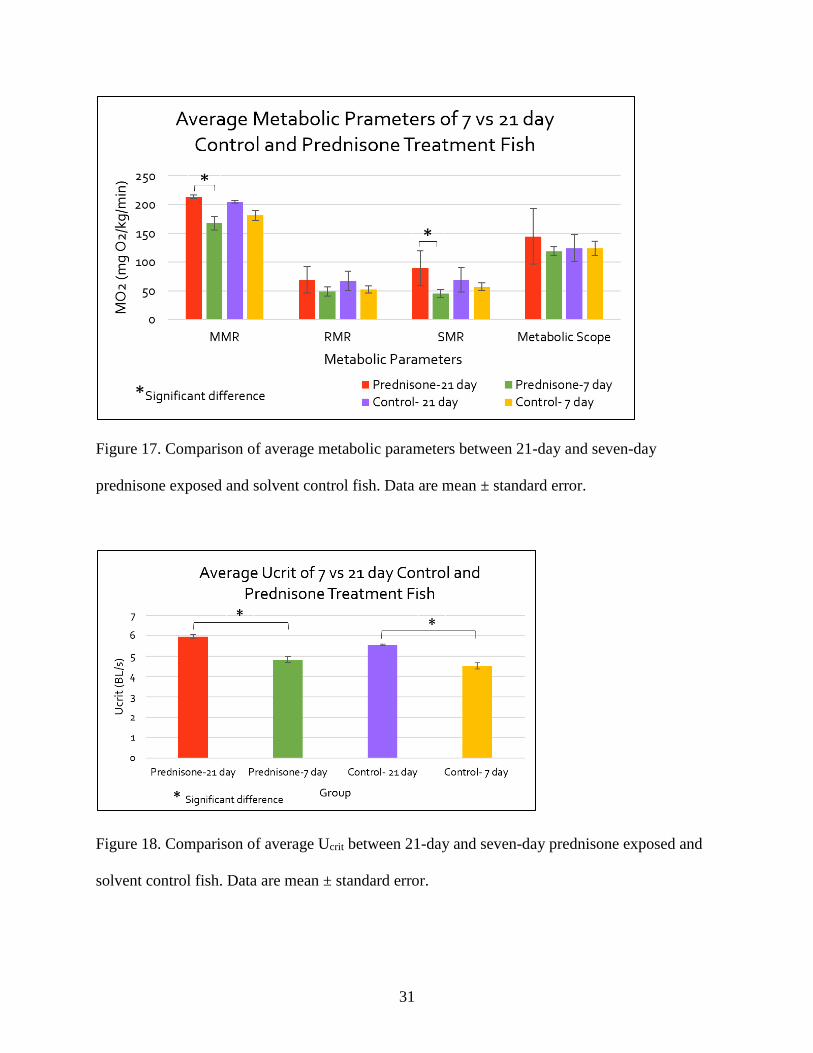
observe effects of chronic exposure to prednisone. When comparing the metabolic parameters,
all four groups (21-day prednisone N=3, seven-day prednisone N=5, 21-day control N=2, and
seven-day control N=6), the MMR and SMR values for 21-day prednisone exposed fish were
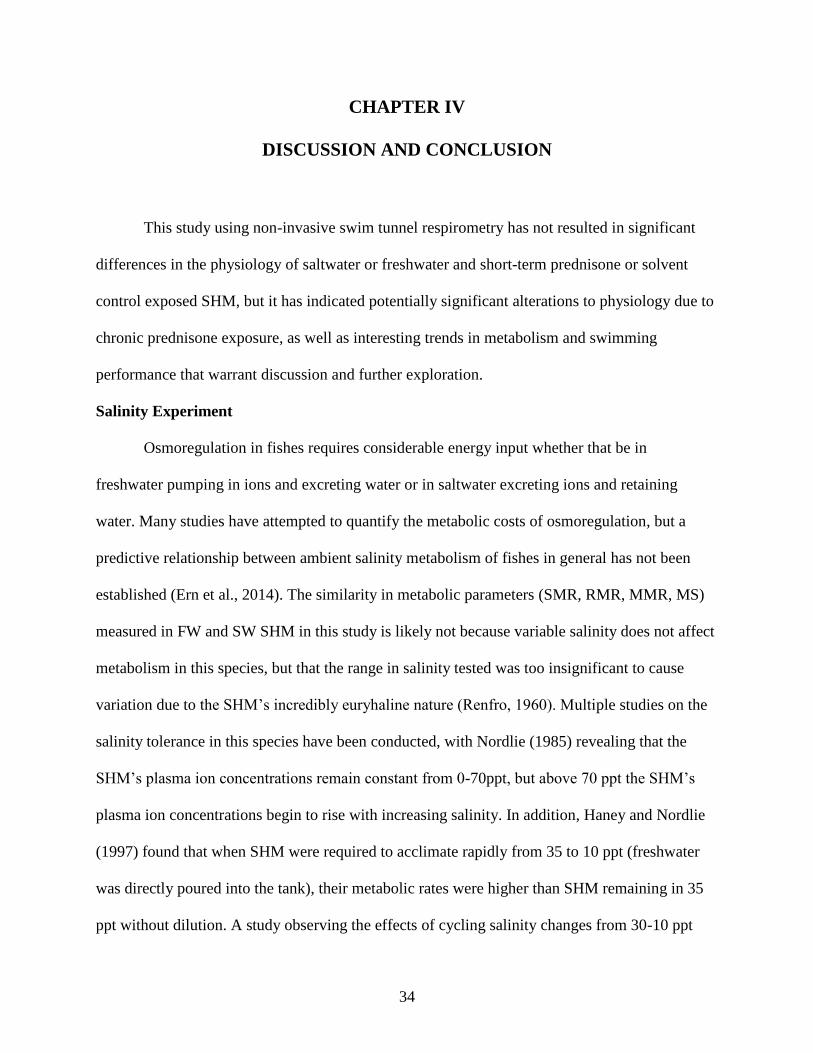
significantly greater than the seven-day prednisone exposed group (Figure 17). The Ucrit values
for all four groups are shown in Figure 18, and both 21-day prednisone and solvent control fish
had significantly greater Ucrit values than their respective seven-day study counterparts.
31
Figure 17. Comparison of average metabolic parameters between 21-day and seven-day
prednisone exposed and solvent control fish. Data are mean ± standard error.
Figure 18. Comparison of average Ucrit between 21-day and seven-day prednisone exposed and
solvent control fish. Data are mean ± standard error.

32
Figure 19. Comparison of COT values across the swimming speed range between 21-day and
seven-day prednisone exposed and solvent control fish.
Figure 20. Comparison of EPOC measures after exercise between 21-day and seven-day
prednisone exposed and solvent control fish.
When comparing the COT values for all four groups (Figure 19), the 21-day prednisone
exposed fish had significantly higher COT values for speeds between 0.5 BL/s and 4.5 BL/s
when compared to the seven-day prednisone exposed fish, with the solvent control groups having

33
no significant differences in COT values. In addition, the individual MO2 values for 0, 7, and 14
minutes post-exercise as well as overall average EPOC values were significantly greater for the
21-day prednisone exposed fish when compared to the seven-day prednisone exposed group
(Figure 20).
34
CHAPTER IV
DISCUSSION AND CONCLUSION
This study using non-invasive swim tunnel respirometry has not resulted in significant
differences in the physiology of saltwater or freshwater and short-term prednisone or solvent
control exposed SHM, but it has indicated potentially significant alterations to physiology due to
chronic prednisone exposure, as well as interesting trends in metabolism and swimming
performance that warrant discussion and further exploration.
Salinity Experiment
Osmoregulation in fishes requires considerable energy input whether that be in
freshwater pumping in ions and excreting water or in saltwater excreting ions and retaining
water. Many studies have attempted to quantify the metabolic costs of osmoregulation, but a
predictive relationship between ambient salinity metabolism of fishes in general has not been
established (Ern et al., 2014). The similarity in metabolic parameters (SMR, RMR, MMR, MS)
measured in FW and SW SHM in this study is likely not because variable salinity does not affect
metabolism in this species, but that the range in salinity tested was too insignificant to cause
variation due to the SHM’s incredibly euryhaline nature (Renfro, 1960). Multiple studies on the
salinity tolerance in this species have been conducted, with Nordlie (1985) revealing that the
SHM’s plasma ion concentrations remain constant from 0-70ppt, but above 70 ppt the SHM’s
plasma ion concentrations begin to rise with increasing salinity. In addition, Haney and Nordlie
(1997) found that when SHM were required to acclimate rapidly from 35 to 10 ppt (freshwater
was directly poured into the tank), their metabolic rates were higher than SHM remaining in 35
ppt without dilution. A study observing the effects of cycling salinity changes from 30-10 ppt
35
every two days for a 21-day period also found that SHM were able to osmoregulate rapidly via
measuring plasma ion concentrations, but metabolism was not measured (Haney, 1999). These
studies support the findings here that variation in MMR, SMR, RMR, and metabolic scope due to
osmoregulatory demands between 0 and 28 ppt is not significant, but salinity or other factors
could be the cause for slight differences that were seen in other parameters.
For example, freshwater SHM had visibly lower MO2 values post-exercise and lower
overall EPOC compared to the saltwater acclimated (20-28 ppt) SHM. As EPOC is a measure of
the excess oxygen consumed to repay anaerobic metabolic demands, it represents the total
anaerobic capacity of an organism (Killen et al., 2016; Lee et al., 2003). While not significant,
this trend toward a lower EPOC indicates that the FW SHM’s anaerobic capacity is lower than
the SW SHM’s. This difference in EPOC could be due to SW SHM possessing and utilizing
more white, anaerobically powered muscle than red, aerobically powered muscle to swim during
the trial, compared to the FW fish. Multiple studies have shown fishes’ muscle plasticity in
response to various factors including hypoxia, temperature, exercise, sexual harassment, and
natural habitat (Sänger, 1993; Killen et al., 2016), so acclimation to different salinities could also
affect red to white muscle ratios or mitochondrial densities due to osmoregulatory demands that
affect activity patterns and muscle usage. In future studies, tissue samples will be taken post-
swim to analyze ratios of lactate and pyruvate, which are end-products of anaerobic and aerobic
metabolism, respectively. These results will assist in determining relative levels of aerobic and
anaerobic metabolism, and if they differ based on a wider range of salinity levels.
When observing the results of COT between SW and FW fish (Figure 5), the 2nd order
polynomial curve follows a U-shaped pattern that is similar in other fishes, where COT is higher
at minimum and maximum speeds and an optimum COT is reached at an intermediate speed

36
(Wakeman & Wohlschlag, 1982, Lee et al., 2003). While COT was not significantly different at
any speed between groups, the curve shows that COT in the slowest speeds is greater for SW
SHMs, suggesting that they are less efficient swimmers at the slowest speeds. Killen et al. (2016)
remarked that greater locomotory efficiency in an animal results in using less of its metabolic
scope for swimming, and more for other regulatory activities. In this case, the SW SHMs may
have had greater osmoregulatory demands in a higher salinity, resulting in more of their
metabolic scope being diverted towards osmoregulation and less diverted towards efficient
swimming, resulting in visibly higher COT values for the lower speeds of SW fish. When
observing the COT curves for both groups in Figure 5, it is important to note that the lowest
point on the curve represents the optimal swimming speed for that group because it costs the
least amount of energy. For both FW and SW fish, this optimal speed was about 3.5 BL/s,
indicating that visible, but not significant, differences in COT are only evident at the slower,
more energetically expensive speeds between freshwater and saltwater fish.
It is important to note that, while interesting trends have emerged from the data, certain
limitations to this physiological study are present. The ideal sample size of eight fish for both
FW and SW swimming trials was not met due to the unavailability of more SW SHM, and the
authors plan on running additional SW SHM swim trials to make the sample sizes more
comparable and robust. The SW and FW SHM were also sourced from different stocks, with the
FW SHM from the reputable SHM provider Aquatic Biosystems, Inc., and the SW SHM from
the multi-generation culture at Texas A&M Galveston. While some differences in husbandry are
likely present, both populations were reared completely in captive systems, kept with the same
sex to prevent male harassment and potential gonadal maturation, fed the same flake diet, and
were of similar size and condition factor prior to the swim trials (Table 1). The inherent variation
37
present in complex organisms such as fishes incurs a certain amount of difficulty in discerning if
differences in response variables are from the factors being tested, or this individual variation
that may mask overall population trends. Therefore, sample sizes in physiological studies must
be very large to result in significant differences (if present) that are indeed due to the factor being
tested, and thus emerging trends in the data are treated as critical compasses to direct future
studies. As potential trends in EPOC and COT were seen between the SW and FW SHM, they
warrant further exploration of how salinity affects metabolism and swimming performance,
possibly due to differential osmoregulatory demands. Future studies here and elsewhere should
incorporate a broader salinity range when testing response variables in the SHM due to its
euryhaline nature to encompass the entire scope of response across multiple levels of salinity.
Such studies will potentially confirm and highlight the trends witnessed here, and ultimately lead
to determining how the natural stressor of salinity affects SHM physiology.
As our coastal habitats are further impacted by urbanization, alterations of drainage
systems, and potentially more severe tropical storm systems due to global climate change,
estuaries and freshwater systems will be subject to more or less salinity fluctuation (Fulton et al.,
1993, Lorenz, 2014). While the salinity range observed here had little alterations on SHM
physiology, repeated studies on a larger salinity range in the SHM as well as studies on other
estuarine species may reveal significant alterations to swimming performance and metabolism
that could lead to individual and population level effects in the wild when salinity fluctuations
occur.
Seven-day Prednisone Experiment
Multiple studies have begun to explore the effects of pharmaceuticals on fishes as we
become more aware of micropollutants in our waterways (Daughton & Ternes, 1999, Jobling et

38
al., 2005). Certain initial studies focusing on synthetic glucocorticoids (Kugathas & Sumpter,
2011, Kugathas et al. 2013) chose arbitrary exposure concentrations because they lacked
accurate surface water measurements, and thus stressed the importance of determining and
utilizing environmentally relevant concentrations when reporting significant impacts to fish
physiology. Consistent sampling of water in Galveston Bay, Texas, before and after a large
hurricane and flooding event in 2017, yielded such environmentally relevant concentrations
(~1000 ng/L) of the synthetic glucocorticoid prednisone (Petersen & Hala, unpublished), which
were then employed in this seven-day exposure study.
Similar to the salinity study, no significant differences in metabolic parameters nor
swimming performance were seen between fish exposed to prednisone or the solvent control for
seven days. This is interesting considering the range of side effects that prednisone has on
humans at prescribed doses, including proteolysis, hyperglycemia, reduced immunity, and
psychological distress (Horber & Haymond, 1990; Judd et al., 2014). It is thought that synthetic
glucocorticoids result in higher plasma glucose levels by acting as the natural glucocorticoid
cortisol. Cortisol initiates gluconeogenesis in the liver, decreasing liver glycogen content and
increasing plasma glucose. In fishes, the injection of cortisol and resulting effects on plasma
glucose are slightly variable, with the majority of studies showing increases in plasma glucose,
and few studies showing no change or decreases in plasma glucose due to cortisol, suggesting
variation among species (Mommsen et al., 1999). Studies also suggest that increased plasma
glucose associated with cortisol release is not due to cortisol itself, but catecholamines that are
also released during stress to increase glucose availability for potential fight or flight situations
(Wendelaar Bonga, 1997). Subsequent studies on how fishes are affected by synthetic
glucocorticoids are variable as well, with Kugathas and Sumpter (2011) measuring increased

39
plasma glucose levels in fathead minnows exposed to 1000 ng/L of prednisolone for 21 days,
Kugathas et al. (2013) measuring increased plasma glucose levels, reduced lymphocyte counts,
induction of male secondary sex characteristics, and reduced plasma vitellogenin in females
again in fathead minnows exposed to 1000 ng/L of prednisolone for 21 days, and Nakayama et
al. (2014) measuring no change in plasma glucose levels or leukocyte counts, but an increase in
serum amino acids possibly due to proteolysis and gluconeogenesis in carp exposed to 1000ng/L
of synthetic glucocorticoids for 21 days. While plasma glucose levels were not measured in these
experiments, it was hypothesized that prednisone exposure would alter metabolism and/or
swimming performance via higher plasma glucose concentrations in SHM, which are more
similar in size and lifestyle to the fathead minnows which showed increased plasma glucose
(Kugathas et al., 2013, Kugathas and Sumpter, 2011).
Another similar characteristic between cortisol and synthetic glucocorticoids is peripheral
proteolysis and increased serum amino acids when fish are exposed to chronic stress or when
fitted with a cortisol implant. Proteolysis occurs to supply amino acids for gluconeogenesis in the
liver to increase plasma glucose, and has shown to cause weight and muscle loss in fishes during
extended exogenous or endogenous cortisol exposure in some studies (Mommsen et al., 1999). A
study on rainbow trout metabolism, nitrogen excretion, and aerobic swimming performance
indicated that proteins were not being metabolized more in fishes with cortisol implants relative
to controls. In addition, anaerobic metabolism and production of lactate increased, which is also
a substrate used for gluconeogenesis in fishes (De Boek, Aslop, & Wood, 2001). In contrast,
increased levels of serum amino acids possibly due to proteolysis was seen in common carp
exposed to 1000ng/L of synthetic glucocorticoids (Nakayama et al., 2014). If exposure to
synthetic glucocorticoids leads to proteolysis in fishes, as seen in humans, then potential negative
40
effects on swimming performance or metabolism may have resulted from reduced muscle mass
and protein reserves.
As most studies observing effects of glucocorticoids are for 21 days rather than seven, it
is possible that the exposure period was simply not long enough to detect measurable differences
in metabolism and swimming performance due to prednisone. Preliminary results from the first
21-day study indicate potential trends in measured parameters relative to the seven-day exposed
fish that will likely become clearer with completion of the second 21-day study when sample
size is increased (n=8).
Preliminary 21-day Prednisone Experiment
The first 21-day exposure experiment successfully completed swimming trials for three
prednisone exposure and two solvent control SHM, and results indicated that there were no
significant differences in metabolism or swimming performance. Trends in slightly higher
metabolic rates, Ucrit, EPOC, and COT were apparent when visualizing the data (Figures 12-16),
and subsequently all the parameters between the 21-day and seven-day prednisone exposed fish,
as well as the 21-day and seven-day solvent control fish were compared to determine if
extending prednisone exposure resulted in significant differences in the data.
Comparison of the 21-day and 7-day Prednisone Experiments
Upon comparing the data of both prednisone exposed and solvent control exposed SHM
between the 21-day and seven-day studies, it became clear that chronic prednisone exposure
resulted in significant alterations to metabolism and swimming performance. These differences
were absent in the seven-day prednisone vs control fish, and the 21-day vs seven-day solvent
control fish. Significantly higher MMR and SMR values were seen in the 21-day prednisone
exposed fish relative to the seven-day prednisone fish, with evident trends that RMR and

41
metabolic scope were also elevated. This increased oxygen consumption at basal levels as well
as during maximum activity is possibly due to an increase in plasma glucose known as
hyperglycemia that has been recorded in multiple studies on fishes due to chronic synthetic
glucocorticoid exposure (Kugathas et al. 2011, Kugathas, Runnalls, & Sumpter, 2013, Margiotta-
Casaluci et al., 2016). Increased plasma glucose could either result in simple accumulation of
glucose in the bloodstream because there is no subsequent uptake of tissues for metabolism, but
glucocorticoids are known to increase glucose receptor expression in liver tissue (Kugathas,
Runnalls, & Sumpter, 2013; Margiotta-Casaluci et al.,2016) and it is therefore possible that
prednisone also increases glucose receptors in muscle tissue, allowing for increased glucose
uptake and aerobic metabolism. Increased glucose metabolism and energy availability could
have also led to the significantly higher Ucrit values seen in the 21-day prednisone exposed fish
relative to the seven-day exposed fish. It is important to note, however, that increased Ucrit values
were also seen in the 21-day control fish relative to the seven-day control fish, which could have
been an artifact of different batches of fish used for the two studies.
While studies have yet to connect the effects of increased plasma glucose due to synthetic
glucocorticoids to alterations in metabolism and swimming performance, studies linking the
natural glucocorticoid cortisol to these response variables may provide insight. For example,
Gregory and Wood (1999) found that when rainbow trout were fitted with chronic cortisol
implants, they had a higher “cost of living”, with low growth rates and food conversion
efficiency, while Ucrit values were unaffected. Lankford et al. (2005) used physical stressors to
elevate plasma cortisol in green sturgeon, resulting in increased plasma glucose and greater
metabolic scope, but unaffected Ucrit, and hypothesized that the stressors increased overall
maintenance metabolism. These increases in maintenance metabolism due to chronic cortisol
42
elevation are similar to the increased MMR and SMR values and a trend towards increased
metabolic scope seen in the chronically exposed prednisone fish. Stressful situations in fishes
elicit many other responses in addition to cortisol elevation, so it is difficult to connect the results
from these studies to those seen here due to chronic prednisone exposure. Higher Ucrit values
were seen for both groups of 21-day fish relative to the seven-day fish, indicating that alterations
to Ucrit may not have been due to chronic prednisone exposure but different batches of SHM
from Aquatic Biosystems. The seven-day study fish were 7 to 8 months old during the trial in
mid-October, while a new batch of specifically 7 to 8-month old SHM were ordered and allowed
to acclimate to use for the 21-day study. No other parameters were significantly different when
comparing the control fish between the 21-day and seven-day studies, so this only highlights the
robustness and similarity of the SHM batches provided by Aquatic Biosystems, Inc.
Higher COT values were seen in the 21-day prednisone fish between speeds of 0.5 to 4.5
BL/s relative to the seven-day prednisone fish, which indicates that they swim less efficiently
than the seven-day exposed fish at those speeds. This could be due to the hypothesized increase
in plasma glucose levels due to chronic prednisone exposure, making more glucose available and
aerobically metabolized than necessary to reach the same speeds, ultimately increasing their cost
of transport and reducing efficiency. An interesting trend when comparing COT values is that the
lowest point on the COT curve represents the speed at which the fish can swim most efficiently;
this speed was at 4.5 BL/s for the 21-day prednisone fish, while it was about 3.5 BL/s for the
seven-day prednisone fish, as well as the 21-day and seven-day control fish (Figure 19). While
overall COT was greater for the 21-day prednisone fish, this slightly faster optimal swimming
speed could be linked to the differences in EPOC seen between the groups.
43
Overall EPOC as well as MO2 values measured at 0, 7, and 14 minutes post-exercise
were greater for the 21-day prednisone exposure fish relative to the three other groups (Figure
20), indicating that the anaerobic capacity of the 21-day prednisone fish was greater. A study on
changes in rainbow trout metabolism due to chronic cortisol implants found elevated levels of
lactate, indicating that the natural glucocorticoid may have increased anaerobic metabolism (De
Boek et al., 2001). Perhaps synthetic glucocorticoids such as prednisone have similar effects on
anaerobic metabolism, leading to the increased anaerobic capacity seen here in the 21-day
prednisone fish. This increased anaerobic capacity may have allowed the 21-day prednisone fish
to shift to anaerobic metabolism during the incremental swim tunnel trials for a longer period of
time than the other groups, resulting in the faster optimal speed, seen in the COT curve in Figure
19. While their optimal speed was faster potentially due to increased anaerobic capacity,
anaerobic swimming is less efficient as it ultimately results in exhaustion. This finding also
supports the evidence here that 21-day prednisone exposed fish are metabolizing too quickly for
maximum efficiency. An interesting observation was that the seven-day prednisone exposed fish
had the lowest COT values of all the groups, particularly for the lowest speeds (Figure 19),
indicating that perhaps short-term prednisone exposure may make swimming more efficient at
those speeds, due to slightly increased plasma glucose levels fueling more efficient aerobic
metabolism.
The significant alterations to swimming performance and metabolism seen here from the
preliminary results will likely be further supported by the completion of the second 21-day trial
that will increase sample sizes. Considering the individual variability associated with
physiological studies such as this, the significant differences in responses observed even with
small sample sizes (N=2, 3) may be particularly robust. The tissues collected from all fish after

44
exposure will be analyzed for compounds such as cortisol, androgens, estrogen, and
progestogens via LC-MS/MS to further determine if the responses seen are indeed due to
prednisone exposure, and if prednisone affects reproductive hormones. Water samples of the
prednisone tanks were also taken daily during the exposure period, and will be analyzed via the
LC-MS/MS to measure ng/L concentrations of prednisone to ensure exposure concentrations
were constant throughout both studies. While the semi-static renewal system used here is
recommended by the EPA and OECD for toxicity testing (USEPA, 1996), future efforts to
expose fishes to relevant pharmaceutical concentrations in this lab will likely incorporate a flow
through system with constant water turnover and automatic pharmaceutical dosing to reduce
maintenance time. Future studies will also incorporate measuring pyruvate and lactate levels in
the SHMs after the exposure period and swimming trial. Measuring these end-products of
aerobic and aerobic metabolism will further support the differences in aerobic and anaerobic
metabolism seen here by measuring oxygen consumption and activity levels alone.
The differences in metabolism and swimming performance observed due to chronic
prednisone exposure indicate that synthetic glucocorticoids do indeed affect fish physiology. An
overall increase in metabolic rates, a trend towards increasing metabolic scope, increasing cost of
swimming, and increasing anaerobic capacity certainly have implications when considering basic
organism function and survival. This chronic prednisone exposure increases swimming and
metabolic activities, which may be diverting energy away from other critical processes such as
growth, immune system functioning, and reproduction. On the other hand, the trend indicating
increased metabolic scope would only enhance the above mentioned aerobic processes. Increased
anaerobic capacity would also be beneficial, improving the SHM’s already high tolerance of
hypoxic conditions that are especially common in their estuarine habitats. While the underlying
45
mechanisms were not determined in this study, chronic exposure to prednisone clearly has
complex effects on SHM physiology and increased plasma glucose is potentially the driver of
increased metabolism and swimming activity. With a growing body of evidence indicating that
environmentally relevant levels of pharmaceuticals such as synthetic glucocorticoids are
affecting fish physiology, it is all the more important to increase monitoring efforts and
awareness about pharmaceutical presence in aquatic ecosystems. Critical research such as this
provides convincing evidence that these micropollutants can cause measurable, sublethal
changes to EPA and OECD designated model organisms like the SHM (USEPA, 1996), and that
pharmaceutical release into the environment must be monitored and eventually prevented by
improving our waste water treatment systems.
Conclusion
Understanding how both natural and anthropogenic stressors impact non-invasive
response variables such as swimming performance and metabolism can provide key insights into
how fishes are being affected by these stressors. This study supports the use of swim tunnel
respirometry as an important tool for future physiology research as we attempt to move towards
more non-invasive methods, particularly when considering research on endangered species
where sacrifice is avoided. Subtle changes in optimal organism functioning required for feeding,
breeding, evading predators, and supporting immune function can have effects on individual
survival and ultimately the success of populations as a whole.
46
REFERENCES
Bennett, W. A., & Beitinger, T. L. (1997). Temperature tolerance of the sheepshead minnow,
Cyprinodon variegatus. Copeia, 77-87.
Boef, G. & Payan, P. (2001). How should salinity influence fish growth? Comparative
biochemical physiology. C 130, 411–423.
Brett, J. R. (1965). The relation of size to rate of oxygen consumption and sustained swimming
speed of Sockeye Salmon (Oncorhynchus nerka). Journal of the Fisheries Research
Board of Canada, 22, 1491-1501.
Claireaux, G. & Lefrançois C. (2007). Linking environmental variability and fish performance:
integration through the concept of scope for activity. Philosophical transactions of the
Royal Society London B, 362(1478), 2031-2041.
Corcoran, J., Winter, M. J., & Tyler, C. R. (2010). Pharmaceuticals in the aquatic environment: a
critical review of the evidence for health effects in fish. Critical reviews in toxicology,
40(4), 287-304.
Daughton, C. G. & Ternes, T. A. (1999). Pharmaceuticals and personal care products in the
environment: agents of subtle change? Environmental health perspectives, 107, 907-938.
De Boeck, G., Alsop, D., & Wood, C. (2001). Cortisol effects on aerobic and anaerobic
metabolism, nitrogen excretion, and whole-body composition in juvenile rainbow trout.
Physiological and biochemical zoology, 74(6), 858-868.
Ern, R., Huong, D. T. T., Cong, N. V., Bayley, M., & Wang, T. (2014). Effect of salinity on
oxygen consumption in fishes: a review. Journal of fish biology, 84(4), 1210-1220.
Evans, D. H., Piermarini, P. M., & Choe, K. P. (2005). The multifunctional fish gill: dominant
site of gas exchange, osmoregulation, acid-base regulation, and excretion of nitrogenous
waste. Physiological reviews, 85(1), 97-177.
Fent, K., Weston, A. A., & Caminada, D. (2006). Ecotoxicology of human pharmaceuticals.
Aquatic toxicology, 76(2), 122-159.
47
Fulton, M. H., Scott, G. I., Fortner, A., Bidleman, T. F., & Ngabe, B. (1993). The effects of
urbanization on small high salinity estuaries of the southeastern United States. Archives
of Environmental Contamination and toxicology, 25(4), 476-484.
Gerbersdorf, S. U., Cimatoribus, C., Class, H., Engesser, K. H., Helbich, S., Hollert, H., ... &
Seiler, T. B. (2015). Anthropogenic trace compounds (ATCs) in aquatic habitats—
research needs on sources, fate, detection and toxicity to ensure timely elimination
strategies and risk management. Environment international, 79, 85-105.
Gonzalez, R. J. (2012). The physiology of hyper-salinity tolerance in teleost fish: a review.
Journal of comparative physiology B, 182(3), 321-329.
Gregory, T. R., & Wood, C. M. (1999). The effects of chronic plasma cortisol elevation on the
feeding behavior, growth, competitive ability, and swimming performance of juvenile
rainbow trout. Physiological and Biochemical Zoology, 72(3), 286-295.
Haney, D. C. (1999). Osmoregulation in the sheepshead minnow, Cyprinodon variegatus:
influence of a fluctuating salinity regime. Estuaries, 22(4), 1071-1077.
Haney, D. C., & Nordlie, F. G. (1997). Influence of environmental salinity on routine metabolic
rate and critical oxygen tension of Cyprinodon variegatus. Physiological zoology, 70(5),
511-518.
Horber, F. F., & Haymond, M. W. (1990). Human growth hormone prevents the protein
catabolic side effects of prednisone in humans. The Journal of clinical investigation,
86(1), 265-272.
Jobling, S., Williams, R., Johnson, A., Taylor, A., Gross-Sorokin, M., Nolan, M., ... & Brighty,
G. (2005). Predicted exposures to steroid estrogens in UK rivers correlate with
widespread sexual disruption in wild fish populations. Environmental health
perspectives, 114(Suppl 1), 32-39.
Judd, L. L., Schettler, P. J., Brown, E. S., Wolkowitz, O. M., Sternberg, E. M., Bender, B. G., ...
& Joëls, M. (2014). Adverse consequences of glucocorticoid medication: psychological,
cognitive, and behavioral effects. American Journal of Psychiatry, 171(10), 1045-1051.

48
Killen, S. S., Croft, D. P., Salin, K., & Darden, S. K. (2016). Male sexually coercive behavior
drives increased swimming efficiency in female guppies. Functional ecology, 30(4), 576-
583.
Kugathas, S., & Sumpter, J. P. (2011). Synthetic glucocorticoids in the environment: first results
on their potential impacts on fish. Environmental science & technology, 45(6), 2377-
2383.
Kugathas, S., Runnalls, T. J., & Sumpter, J. P. (2013). Metabolic and reproductive effects of
relatively low concentrations of beclomethasone dipropionate, a synthetic glucocorticoid,
on fathead minnows. Environmental science & technology, 47(16), 9487-9495.
Lankford, S. E., Adams, T. E., Miller, R. A., & Cech Jr, J. J. (2005). The cost of chronic stress:
impacts of a nonhabituating stress response on metabolic variables and swimming
performance in sturgeon. Physiological and biochemical zoology, 78(4), 599-609.
Lee, C. G., Farrell, A. P., Lotto, A., Hinch, S. G., & Healey, M. C. (2003). Excess post-exercise
oxygen consumption in adult sockeye (Oncorhynchus nerka) and coho (O. kisutch)
salmon following critical speed swimming. Journal of experimental biology, 206(18),
3253-3260.
Lorenz, J. J. (2014). A review of the effects of altered hydrology and salinity on vertebrate fauna
and their habitats in northeastern Florida Bay. Wetlands, 34(1), 189-200.
Margiotta-Casaluci, L., Owen, S. F., Huerta, B., Rodríguez-Mozaz, S., Kugathas, S., Barceló, D.,
... & Sumpter, J. P. (2016). Internal exposure dynamics drive the Adverse Outcome
Pathways of synthetic glucocorticoids in fish. Scientific reports, 6, 21978.
Mommsen, T. P., Vijayan, M. M., & Moon, T. W. (1999). Cortisol in teleosts: dynamics,
mechanisms of action, and metabolic regulation. Reviews in fish biology and fisheries,
9(3), 211-268.
Nakayama, K., Inoue, Y., Ikeda, N., Hashizume, N., Murakami, H., Ishibashi, T., ... & Suzuki,
G. (2014). Uptake and biological effects of synthetic glucocorticoids in common carp
(Cyprinus carpio). Marine pollution bulletin, 85(2), 370-375.
Nordlie, F.G. (1985). Osmotic regulation in the sheepshead minnow Cyprinodon variegatus

49
Lacepede. Journal of fish biology, 26,161-170
Petersen, L. H., & Gamperl, A. K. (2010). Effect of acute and chronic hypoxia on the swimming
performance, metabolic capacity and cardiac function of Atlantic cod (Gadus morhua).
Journal of experimental biology, 213(5), 808-819.
Peterson, M. S. (1990). Hypoxia-induced physiological changes in two mangrove swamp fishes:
sheepshead minnow, Cyprinodon variegatus Lacepede and sailfin molly, Poecilia
latipinna (lesueur). Comparative Biochemistry and Physiology--Part A: Physiology,
97(1), 17-21.
Renfro, W. C. (1960). Salinity relations of some fishes in the Aransas River, Texas. Tulane
Studies in zoology, 8(3), 83-91.
Rosen, D. E. (1973). Suborder Cyprinodontoidei. Superfamily Cyprinodontoidea. Families
Cyprinodontidae, Poeciliidae, Anablepidae. Fishes of the western North Atlantic, 229-
262.
Rountos, K. J., Gobler, C. J., & Pikitch, E. K. (2017). Ontogenetic Differences in Swimming
Behavior of Fish Exposed to the Harmful Dinoflagellate Cochlodinium polykrikoides.
Transactions of the American Fisheries Society, 146(5), 1081-1091.
Sänger, A. M. (1993). Limits to the acclimation of fish muscle. Reviews in Fish Biology and
Fisheries, 3(1), 1-15.
Schmidt-Nielsen, K. (1997). What is physiology In Animal Physiology: Adaptation and
Environment (pp. 1-2). New York, New York: Cambridge University Press.
Steffensen, J. F., Johansen, K., & Bushnell, P. G. (1984). An automated swimming respirometer.
Comparative biochemistry and physiology--Part A: Physiology, 79(3), 437-440.
Tseng, Y. C., & Hwang, P. P. (2008). Some insights into energy metabolism for osmoregulation
in fish. Comparative biochemistry and physiology Part C: Toxicology & pharmacology,
148(4), 419-429.
Tseng, Y.C., Huang, C.J., Chang, J.C.H., Teng, W.Y., Baba, O., Fann, M.J., Hwang, P.P. (2007).
Glycogen phosphorylase in glycogen-rich cells is involved in the energy supply for

50
ion regulation in fish gill epithelia. American journal of physiology 293, R482–R491.
USEPA. (1996). Ecological Effects Test Guidelines OPPTS 850.1400 Fish Early-Life Stage
Toxicity Test.
Wendelaar Bonga, S. E. (1997). The stress response in fish. Physiological reviews, 77(3), 591-
625.
Wakeman, J. M. & Wohlschlag, D. E. (1982). Least-cost swimming speeds and transportation
costs in some pelagic estuarine fishes. Fisheries research 1, 117–127.
Willmer, P., Stone, G., Johnston, I. (2005). Metabolism and energetics In Environmental
Physiology of Animals (pp. 127-128). Malden, Massachusetts: Blackwell Publishing.