The Effects of Fare Payment and Crowding on Dwell...
44
The Effects of Fare Payment and Crowding on Dwell Time: A fine Grained Analysis Supervised Research Project Prepared by: Grant Fletcher Supervisor: Ahmed El‐Geneidy In partial fulfillment of the requirements for the degree: Master’s of Urban Planning McGill School of Urban Planning July 7, 2012
Transcript of The Effects of Fare Payment and Crowding on Dwell...

F a r e P a y m e n t , C r o w d i n g a n d D w e l l T i m e : A f i n e G r a i n e d A n a l y s i s P a g e | i
T h e E f f e c t s o f F a r e P a y m e n t a n d C r o w d i n g o n D w e l l T i m e : A f i n e G r a i n e d A n a l y s i s
S u p e r v i s e d R e s e a r c h P r o j e c t P r e p a r e d b y : Grant Fletcher S u p e r v i s o r : Ahmed El‐Geneidy I n p a r t i a l f u l f i l l m e n t o f t h e r e q u i r e m e n t s f o r t h e d e g r e e : M a s t e r ’ s o f U r b a n P l a n n i n g M c G i l l S c h o o l o f U r b a n P l a n n i n g J u l y 7 , 2 0 1 2

F a r e P a y m e n t , C r o w d i n g a n d D w e l l T i m e : A f i n e G r a i n e d A n a l y s i s P a g e | ii

F a r e P a y m e n t , C r o w d i n g a n d D w e l l T i m e : A f i n e G r a i n e d A n a l y s i s P a g e | iii
ACKNOWLEDGEMENTS
Prof. Ahmed El‐Geneidy was a great resource, a source of inspiration and a guide through this project. As my supervisor, these traits were appreciated. However, it was the late night phone calls to the lab, his never ending patience, kindness and his enduring sense of humor that made this project and the past two years at McGill especially enjoyable.
Thank you Ahmed.
I would like to express my gratitude to Marianne Hatzopoulou for providing her comments as the second reader. Special thanks go to Geoff Cross, Lorie Srivastava, and Nithya Vijayakumar, all of TransLink, for providing the opportunity, advice and guidance needed to bring this project to fruition. William Hui of TransLink also deserves special recognition for helping to define the research and for providing detailed comments during the writing of this paper. I would like to also show my appreciation to Ehab Diab, Kevin Manaugh, and the Urban Planning students at McGill for their support and feedback throughout this project. Thank you to my dedicated data collection volunteers, motivated by their interested in transit and research, for their tireless hours of bus riding.
Thank you to Mitacs and TransLink for providing the funding that allowed me to carry out this research.

F a r e P a y m e n t , C r o w d i n g a n d D w e l l T i m e : A f i n e G r a i n e d A n a l y s i s P a g e | iv

F a r e P a y m e n t , C r o w d i n g a n d D w e l l T i m e : A f i n e G r a i n e d A n a l y s i s P a g e | v
TABLE OF CONTENTS
ACKNOWLEDGEMENTS ............................................................................................................................ iii
TABLE OF CONTENTS ............................................................................................................................. v
List of Tables ........................................................................................................................................ vi
List of Figures ....................................................................................................................................... vi
List of Appendices ................................................................................................................................ vi
ABSTRACT ................................................................................................................................................ vii
RÉSUMÉ .................................................................................................................................................. viii
INTRODUCTION ......................................................................................................................................... 1
LITeRATURE REVIEW ................................................................................................................................. 2
Dwell Time ............................................................................................................................................ 2
Electronic Data Collection ..................................................................................................................... 5
Crowding ............................................................................................................................................... 7
Fare Payment ........................................................................................................................................ 9
TransLink ............................................................................................................................................. 10
CONTEXT ................................................................................................................................................. 10
Transit Service Guidelines ................................................................................................................... 11
Route Description ............................................................................................................................... 11
Rolling Stock ........................................................................................................................................ 15
METHODOLOGIES ................................................................................................................................... 16
Data Collection Procedure .................................................................................................................. 16
Variable Definition .............................................................................................................................. 18
Data Cleaning ...................................................................................................................................... 19
ANALYSIS ................................................................................................................................................. 20
Dwell Time Model ............................................................................................................................... 21
DISCUSSION ............................................................................................................................................. 25
Traditional & Expanded Dwell Time Models ....................................................................................... 25
Passenger Movements, Fare Payment and their Effects on Dwell Time ............................................ 27
Interaction Between Passenger Movements and Bus Occupancy ..................................................... 30
CONCLUSION ........................................................................................................................................... 32
REFERENCES ............................................................................................................................................ 34
F a r e P a y m e n t , C r o w d i n g a n d D w e l l T i m e : A f i n e G r a i n e d A n a l y s i s P a g e | vi
LIST OF TABLES
TABLE 1: PHYSICAL CHARACTERISTICS OF ROUTES 5, 9 & 99 ............................................................................. 15
TABLE 2: VARIABLE DEFINITION ....................................................................................................................... 19
TABLE 3: SUMMARY STATISTICS AT THE STOP LEVEL .......................................................................................... 21
TABLE 4: DWELL TIME MODEL ........................................................................................................................ 23
TABLE 5: #99 B‐LINE, SENSITIVITY ANALYSIS .................................................................................................... 31
LIST OF FIGURES
FIGURE 1: DOWNTOWN PENINSULA, VANCOUVER, BC, SHOWING THE ROUTE OF THE #5 ROBSON........................ 12
FIGURE 2: BROADWAY CORRIDOR, VANCOUVER, BC STUDIED SECTIONS OF THE #9 BROADWAY & #99 B‐LINE ..... 13
FIGURE 3: COMPARISON OF TWO DWELL TIME MODELS: TRADITIONAL AND EXPANDED AT PAX=11 & PAX=5 ..... 25
FIGURE 4: PERCENT CHANGE IN DWELL TIMES USING 31% OF OCCUPIED CAPACITY AS A BASELINE (#99 B‐LINE) .. 28
LIST OF APPENDICES
APPENDIX 1: EXAMPLE DATA COLLECTION SHEET .............................................................................................. 35
APPENDIX 2: CROWDING AREA DEFINED AROUND REAR DOORS ......................................................................... 36

F a r e P a y m e n t , C r o w d i n g a n d D w e l l T i m e : A f i n e G r a i n e d A n a l y s i s P a g e | vii
ABSTRACT Dwell time, the time a transit vehicle spends stopped to serve passengers, contributes to the total reliability of transit service in several aspects. Dwell time is affected be many factors such as passenger activity, bus crowding, fare collection method, drivers experience, time of day, and others. The type of impacts crowding can have on dwell time is debatable, due to its interaction with passenger activity and the accuracy in calculating it. Also different types of payments have another debatable impact in terms of the power of its impact on dwell time. These debates can be linked to the absence of appropriate data that can actually capture the real impacts of these variables. This research attempts to determine the influence of crowding and fare payment on dwell time, through manual data collection and compares it to findings from automatic data collection methods. The study is conducted along three heavily used bus routes in the TransLink system from Vancouver, BC. Multiple regression models are performed using a traditional model and a new expanded model with the additional details that manually collected data provides. The traditional model overestimated dwell times due to lack of detail in fare payment and crowding. While the expanded model shows that crowding affect dwell time after approximately 60% of bus capacity increasing dwell time. The different fare payments had various positive impacts on dwell time. This research can help public transit planners and operators in developing better guidelines for fare payments methods as well as policies associated with crowding.
F a r e P a y m e n t , C r o w d i n g a n d D w e l l T i m e : A f i n e G r a i n e d A n a l y s i s P a g e | viii
RÉSUMÉ Le temps d'arrêt, est le temps qu’un véhicule de transport passe en arrêt complet pour servir les passagers. Cela contribue à la fiabilité totale du service de transport dans plusieurs aspects. Le temps d'arrêt est affecté par plusieurs facteurs qui sont l'activité des passagers, le surpeuplement de l’autobus, la méthode de collection de tarifs, l'expérience du conducteur, le temps de la journée, et d'autres. Les types d’impacts que l'encombrement peuvent avoir sur le temps d'arrêt sont discutable, en raison de leurs interaction avec l'activité des passagers et la précision dans leurs calcul. Aussi, les differentes types de paiements ont un autre impact discutable en termes de leur puissance d’impact sur le temps d’arrêt. Ces débats peuvent être liés à l'absence de données appropriées qui peuvent réellement saisir les impacts réels de ces variables. Cette recherche tente de déterminer l'influence de l'encombrement et le paiement des tarifs sur le temps d'arrêt, grâce à la collecte des données manuelle et les comparent aux résultats des méthodes de collecte automatique. L'étude est menée selon trois lignes de bus qui sont utilisés fréquemment dans le système de TransLink à Vancouver, en Colombie‐Britannique. Plusieurs modèles de régression sont effectuées à l'aide d'un modèle traditionnel et un nouveau modèle élargi avec les détails supplémentaires que les données qui ont été collectées manuellement ont fournit. Le modèle traditionnel a surestimé le temps d'arrêt, en raison d'un manque de détail dans l'encaissement du tarif et le surpeuplement. Alors que le modèle élargi démontre que le surpeuplement affecte le temps d'arrêt après environ 60% de la capacité croissante de l’autobus. Les différents paiements de tarifs ont eu de divers effets positifs sur la durée de séjour. Cette recherche peut aider les urbanistes qui spécialisent en transport en commun et les opérateurs dans l'élaboration de meilleures directions pour les méthodes de paiements de tarifs ainsi que les politiques liées à l'encombrement.

F a r e P a y m e n t , C r o w d i n g a n d D w e l l T i m e : A f i n e G r a i n e d A n a l y s i s P a g e | 1
INTRODUCTION The doors on an already crowded bus open and as passengers disembark, even more are waiting
to board. The last passenger finally steps off of the curb, throws their arms out and literally falls back
into the already uncomfortably close passengers to clear the doors for closing. When the doors close,
the passengers sigh an uncomfortable relief, not particularly happy to be on such a crowded bus, but
happy to be on one nonetheless1. With ridership increasing and budgets shrinking at public transit
agencies across North America, situations like this on public transit vehicles are likely to increase.
Vancouver, BC is no exception and is experiencing these constraints. Dwell time consumes around 26%
percent of the total trip time and as such, longer and shorter dwell can have significant effects on run
time variation (Rajbhandari, Chien, & Daniel, 2003). Understanding the relationship between fare
payment, in‐vehicle crowding and dwell times will assist agencies in delivering quality public transit by
improving service planning and scheduling. While a full bus may appear to be the epitome of efficiency,
the additional load may cause dwell and run times to increase significantly (Lin & Wilson, 1992). This
research paper attempts to explain the paradoxical situation of how the presence of extra passengers on
a crowded vehicle can both increase and decrease the efficiency of the vehicle. It also tries to
understand the different impacts of a variety of fare payments on dwell times.
Crowding on buses is a challenge that many transit agencies are facing. TransLink, the local
transit provider Vancouver, BC is not an exception. On some routes, vehicles fill to capacity at their
origin, leading to pass‐ups2 and extreme crowding; this is a daily occurrence on many routes. Several of
these crowded bus routes suffer from delays due to the high demand experienced throughout the
route. In order to research this phenomenon, three urban, high frequency and heavily used bus routes
1 This series of events actually occurred during the data collection period of this project. 2 Pass‐ups occur when the bus is at 100% occupancy and unable to board more passengers. Passengers waiting at stops are unable to be picked up and are passed by.
F a r e P a y m e n t , C r o w d i n g a n d D w e l l T i m e : A f i n e G r a i n e d A n a l y s i s P a g e | 2
are studied to determine the effects of crowding and fare payment on dwell time. Manual counts were
performed detailing passenger movements, fare type used, dwell times, and levels of crowding.
This paper begins with a review of current literature on dwell times and the different factors
that can affect them. The following sections explain the methods used to gather, clean and interpret the
data. The final sections analyse the dwell time model, compare a sensitivity analysis, and provide
recommendations and conclusions.
LITERATURE REVIEW
Dwell time is defined as “the amount of time a bus spends while stopped to serve passengers”
(Transportation Research Board, 2000). As dwell time can consume up to 26% of the total travel time of
buses, it is vitally important to understand the factors affecting them. By better understanding these
factors, transit agencies can introduce changes that can help in reducing dwell times (Rajbhandari et al.,
2003). Many researchers have developed dwell time models that help to better predict vehicle travel
times and thereby improve reliability of service (Lin & Wilson, 1992; Rajbhandari et al., 2003). In creating
these models, researchers hope to better understand the complex interactions between the factors that
influence dwell times and recommend strategies to reduce them.
DWELL TIME
To truly understand the factors influencing dwell time, a more refined formulaic definition is
needed. The following formula has been adapted from the Highway Capacity Manual and literature in
the field (Dueker, Kimpel, Strathman, & Callas, 2004; Transportation Research Board, 2000).
td = Pata + Pbtb + toc+tunexp +frl
where td = Average dwell time in seconds Pa = Number of alighting passengers at a stop ta = Average passenger alighting time Pb = Number of boarding passengers at a stop tb = Average passenger boarding time
F a r e P a y m e n t , C r o w d i n g a n d D w e l l T i m e : A f i n e G r a i n e d A n a l y s i s P a g e | 3
toc = Door opening and closing time frl= Friction factor accounting for the additional delay caused by interaction between the
number of passengers on board and the number of passengers boarding and alighting (captures the effect of crowding)
tunexp= Time of unexpected activities e.g. wheelchair lift use
The first five variables in the equation are defined in the Highway Capacity Manual. They quantify how
many passengers board and alight, the time it takes for this exchange per passenger and the time it
takes to open and close the door. The final two variables, frl and tunexp, have been added, based on the
literature, to create a more realistic model (Dueker et al., 2004). The variable frl captures the effect that
the load of the bus has on boarding and alighting passengers. Unexpected delays caused by wheelchair
ramp use, waiting for passengers to board or other delays are captured in the variable tunexp. All are
influenced by, and to an extent determined by, policy, bus design, method fare collection, passenger
behaviour, route and stop design, and many other factors.
Levinson (1983) was one of the first researchers to examine dwell times in detail. Through field
surveys, he estimated that every dwell included 5.0 seconds for the opening and closing of doors and an
additional 2.75 seconds per passenger movement. In comparing delays associated with dwell time and
traffic congestion, Levinson (1983) concluded that reducing dwell time delays on a city wide basis would
have a greater impact on run time than by reducing traffic congestion . Levinson’s seminal research has
inspired others to develop comprehensive and more detailed dwell time models.
In examining the effects of passenger activity on dwell time, Dueker et al. (2004) found that
each boarding and alighting passenger had diminishing marginal effects on dwell time. The first
passenger to board adds 3.5 seconds to dwell time and the first passenger to alight adds 1.7 seconds.
Each additional boarding and alighting passenger was estimated to take between 0.03 ‐ 0.04 seconds
less than the first passenger. Wheelchair ramp events, while rare, add significantly to dwell time and can
affect run time performance. Although wheelchair lift events occurred in less than 1% of dwells in their
dataset, they were able to collect dwell time information on over 2,300 lift events. The researchers were

F a r e P a y m e n t , C r o w d i n g a n d D w e l l T i m e : A f i n e G r a i n e d A n a l y s i s P a g e | 4
then able to develop a dwell time model for lift events and found that dwells with lift events were
approximately one minute longer than a typical dwell.
Other studies have looked at a multitude of vehicle characteristics that affect dwell time.
Analysing the effect of low vs. high floor (with stairs) buses, Tirachini (2011) found that the presence of
stairs added 2.2 seconds to boarding times for adults and seniors. However, high floor buses had no
effect on dwell times when students were boarding and alighting. Fernández, Zegers, Weber, and Tyler
(2010) found that wider doors expedite passenger movements and can significantly reduce dwell time.
Articulated buses, with three doors, are also attributed with a reduction in dwell times (El‐Geneidy &
Vijayakumar, 2011). However, due to the additional time these buses need to accelerate, decelerate and
merge into traffic, the reduction in dwell time was not reflected in the total running time. Articulated
buses, although saving time during dwells, actually took 1.5% longer to complete their routes.
Other off vehicle factors influence dwell times as well. Similar to the presence of steps on the
bus, the difference between curb height and floor of the bus affects dwell times. When compared to a
0mm and 300mm vertical gap from the platform to the floor of the bus, the presence of a 150mm gap
had the smallest associated dwell times (Fernández et al., 2010).
Research shows that one of the more efficient ways to reduce the total dwell time on a route is
to reduce the total number of stops that create dwells in the first place. TriMet, the local transit agency
in Portland Oregon, USA initiated the Streamline project; an initiative to gain travel time efficiencies
throughout the transit system. Bus stop consolidation was a key part of this initiative. This project
provided an opportunity to study the pre‐ and post‐ implementation effects of this program on both
passenger activity and bus operating performance. Bus run times improved while total passenger
activity (total boardings + total alightings) was unaffected (El‐Geneidy, Strathman, Kimpel, & Crout,
2006). Although passenger access time was increased due to the reduction in the number of stops, it is
hypothesized that these increases were offset by reductions in in‐vehicle travel time as passenger
F a r e P a y m e n t , C r o w d i n g a n d D w e l l T i m e : A f i n e G r a i n e d A n a l y s i s P a g e | 5
volumes remained steady through pre and post implementation. It is argued, however cautiously, that
more aggressive consolidation activities could result in more efficient operations with minimal impacts
on ridership (El‐Geneidy et al., 2006).
Rajbhandari et al. (2003) examined dwell times on the New Jersey Department of
Transportation bus system and tested four different models. Similar to Lin and Wilson, they found that a
multivariate, non‐linear model that treated the number of passengers and standees as independent
variables was the best predictor of dwell times. However, it is noted that including the presence of
standees in the model did not improve the predictive value of the dwell time model. There was also no
significant effect caused by time of day or service type. These results are not unexpected as the route
under study was a high frequency intercity service that did not normally experience crowding. Statistical
analysis on crowding was not performed because they did not have a crowded condition sample size
large enough to properly perform this analysis.
ELECTRONIC DATA COLLECTION
Automatic Passenger Counters (APC) have been used to gather data remotely and inexpensively
since their introduction in the mid‐70s (Moore II, Giuliano, & March, 2002). APC use sensors mounted
near the doors on a bus to count boarding and alighting passengers and door open time at all doors.
Automatic Vehicle Locators (AVL) are part of a larger integrated communications system. The Transit
Management and Communication System (TMAC) used by TransLink, provides GPS based location
information, voice and data capabilities for every bus operated by Coast Mountain Bus Company. The
system is in constant contact with central control and provides real time feedback about schedule
adherence, delays and reroutes. The combined use of these systems provides a breadth of data that is
unattainable using standard manual counting techniques. Most research on dwell time uses data
collected by these systems. Building on existing literature, researchers began to analyse dwell time by
using large data sets collected automatically by AVL and APC. While the aggregate of this data is useful
for dwell time analysis, there are concerns of data validity, reliability and loss of detail.

F a r e P a y m e n t , C r o w d i n g a n d D w e l l T i m e : A f i n e G r a i n e d A n a l y s i s P a g e | 6
The first iteration of APCs were found to have several major technical problems. As of 2002,
Moore II et al. (2002) concluded that “there is no fully objective evidence that APCs can provide
adequate data for section 15 reports” (p.145)3. Additionally, Dueker et al. (2004) mention that
wheelchairs, walkers and strollers can confound APCs. Although many of these technical problems have
been resolved, there are continuing questions of how data processing can affect the accuracy of the
data (Kimpel, Strathman, Bertini, Bender, & Callas, 2005; Moore II et al., 2002).
In their study of two different bus routes containing different APC equipment, Kimpel,
Strathman, Griffin, Callas, and Gerhart (2003) found that estimates of boardings were accurate at the
system level. However, one type of equipment over estimated boardings by a statistically significant
margin, while APCs of both types overestimated passenger loads by a statistically significant margin
(Kimpel et al., 2003). These deficiencies are attributed to the load balancing algorithm that prevents a
load value of less than one (Kimpel et al., 2003). This propensity to overestimate passenger loads could
affect the results of previous research that relied upon APC data. Using data where loads were
overestimated would serve to underestimate the effects of crowding on dwell time.
More recently, the Champaign‐Urbana Mass Transit District posted an entry to their blog
describing inaccuracies in their APC data due to a sensor being installed improperly (Snyder, 2011). They
also attribute inaccuracies to passengers at busy stops boarding or alighting in ‘chunks’ where the
sensors of the APCs are unable to differentiate between people. While there can be problems with APC
data, all of the authors caution that manual counts often contain errors and Kimpel et al. (2003) claims
that manual counts often contain more randomized error than those obtained with APCs making these
errors harder to discover and account for(Moore II et al., 2002; Snyder, 2011). Other issues arise
concerning the integration of multiple data collection systems. The potential for errors exist not only in
3 Section 15 in the United States requires transit operators to report passenger counts and other data to receive funding.

F a r e P a y m e n t , C r o w d i n g a n d D w e l l T i m e : A f i n e G r a i n e d A n a l y s i s P a g e | 7
collection, but also in bringing data from multiple sources and combining entries. There is no perfect
method for data collection and a combined approach that reduces errors is ideal.
CROWDING
Passenger crowding in public transit vehicles is difficult to define. Simply, a vehicle is in a
crowded state when people on the vehicle impede the flow of individuals boarding and alighting.
Dueker et al. (2004) define a crowded vehicle as such when its load is greater than 85% of total capacity.
A typical 12 metre bus has a total capacity of 77 passengers (31 seated, 46 standees), meaning that
there would be 35 passengers standing in the aisle and doorway before it was defined as crowded. This
definition appears problematic as the threshold is quite high.
Alternatively, some researchers use a lower threshold for crowding. Milkovits (2008) asserts
that crowding occurs when passengers on the bus begin to interfere with the boarding and alighting
process. He claims that this occurs when the number of passengers on board is greater than the number
of seats and justifies this claim by arguing that people will stand, even though there are seats available.
According to Lin and Wilson (1992), the effects of crowding are the most pronounced at the highest
levels of occupancy. It is therefore doubtful that this threshold of crowding will significantly affect dwell
times.
Regardless of how it is defined, crowding on transit vehicles has affected the quality of service
and passenger comfort for the past century ("Crowding in Street Cars," 1900). Research on crowding and
dwell time has evolved through the years. Preliminary studies on this relationship showed that vehicles
with passenger loads greater than the number of seats experienced an increase in passenger service
time (Zografos & Levinson, 1986). This increase was directly attributed to the occupancy of the vehicle
as the study was performed on a no fare bus system.
Dwell times for the Metro Boston Transportation Authority’s green line light rail system were
examined and it was found that dwell time is affected by the number of passengers boarding and

F a r e P a y m e n t , C r o w d i n g a n d D w e l l T i m e : A f i n e G r a i n e d A n a l y s i s P a g e | 8
alighting, and the number of people on board the vehicle (Lin & Wilson, 1992). However, the number of
passengers on the vehicle only affected dwell times when there were passengers standing in the aisles
or door wells (standees). When examining the effects of crowding on dwell time, they tested linear and
non‐linear models and found that non‐linear models performed better. They concluded that dwell times
increased exponentially as crowding worsened, especially on single car trains. These crowded, single car
trains would run slower than other, less crowded trains. The longer headways associated with these
slower trains cause platforms to become more crowded thereby increasing passenger movements at
each stop. This effect creates a positive feedback cycle that slows crowded trains significantly. With
headways of 1‐2 minutes, service along the entire line can degrade quickly due to bunching. They
concluded that headways must be closely monitored to ensure crowded trains do not affect other less
crowded trains along the line. These system wide delays occur because of extended dwells caused by
crowding.
Corroborating past research, Milkovits (2008) found that a non‐linear model was the best
predictor of dwell times. Unlike the research performed by Rajbhandari, he was able to measure the
effects of crowding on dwell time. Crowding was found to affect dwell time; however, the effect was
only realized on heavily loaded buses. When the effects of crowding were apparent, only a few extra
seconds were added to the dwell time.
Another component of crowding is friction. Friction is a compound variable that attempts to
incorporate the effects of crowding and the number of passengers boarding and alighting. Friction was
included by Dueker et al. (2004) in their dwell time model. They hypothesised that passengers moving to
exit the vehicle are slowed down by the presence of other passengers on board, thereby creating the
friction. To measure friction, they developed a proxy variable for crowding that added total passengers
boarding, alighting and standing. Although included in their regression model, this variable is not
mentioned in the analysis. With a coefficient of 0.069, it appears that friction had a marginally positive
effect on dwell time. Other studies have also looked at fiction with more reliable results. In Sidney,
F a r e P a y m e n t , C r o w d i n g a n d D w e l l T i m e : A f i n e G r a i n e d A n a l y s i s P a g e | 9
Tirachini (2011) found that when people formed two queues at the front door, friction was experienced.
Dwell time per passenger increased by 1.25 seconds for individuals waiting in the left queue when the
right queue was present. Additionally, passengers alighting at the rear doors were affected by standees
in close proximity to the doors which increased dwell time per passenger by over half of a second. These
results express a relationship between crowding, passenger movements and dwell time.
FARE PAYMENT
The method and location of fare payment can have a significant effect on dwell time. Different
fare media types also have different effects. Passengers that pay with cash where change is given have
the largest effect on dwell time, while fare that is merely shown to operators (not swiped or tapped)
had the smallest effect (Milkovits, 2008). A passenger that pays with a magnetic strip ticket adds 4.6
seconds to dwell time and passengers using cash where no change is given add 5.7 seconds (Tirachini,
2011). The newest innovation in fare payment technology is the introduction of electronic smart media
cards. These passes need only be tapped or swiped against a sensor to register payment. These cards
were reported to be 1.5 ‐ 2 seconds faster than magnetic stripe tickets. However, this difference was
negligible with the presence of crowding. This suggests that crowding slows down the boarding process
regardless of the fare type used.
Where the payment takes place also affects dwell time. The placement of the fare collection box
was attributed to the difference in speed at which passengers could board two different types of buses
in Chicago (Milkovits, 2008). The most expedient way to collect fares is to have the process occur prior
to boarding the bus. Off‐board fare collection is common on rapid transit systems and has proven to
reduce dwell times (Fernández et al., 2010). This is especially true when buses have wide doors. When
off‐board fare collection was introduced, dwell times for buses with 800mm doors were reduced by
1‐8% and buses with wider, 1600mm doors saw reductions of 10‐22%.
F a r e P a y m e n t , C r o w d i n g a n d D w e l l T i m e : A f i n e G r a i n e d A n a l y s i s P a g e | 10
TRANSLINK
On June 25th, 2007, TransLink and CMBC implemented a policy change that would allow
customers to board buses on certain routes from all doors. This change was enacted as a response to
heavy demand and crowding on the 99 B‐Line. The City of Vancouver used APC data to study three stops
along this line before and after the policy change (Dobrovolny, 2009). After the implementation of all‐
door boarding, the City of Vancouver discovered that the average dwell time per person was reduced by
17%, a one second reduction. They also found that total trip time in both directions decreased by 3%, a
one minute reduction. Public response to the change was also measured through an onboard survey.
Over all, most service attributes had higher scores after implementation, however, only boarding speed,
ease of existing and personal security at stops were statistically significant. While other routes have
been considered for all‐door boarding, the 99 B‐Line is currently the only bus route in the TransLink
system that permits boarding from the rear doors.
CONTEXT
The South Coast British Columbia Transit Authority (TransLink) was a partner in this research
project. They provided institutional knowledge and experience to guide the research. The research
question was further defined based on their experiences during times of extreme crowding, notably
during system delays and the 2010 Winter Olympics. This research will aid TransLink in reviewing and
refining the Transit Service Guidelines, which were prepared in 2004. The guidelines state that “severe
overcrowding that impedes circulation of passengers can also increase passenger loading and unloading
times” (Greater Vancouver Transportation Authority, 2004, p. 35). This paper is looking to quantify this
statement and develop an optimal level of crowding that can be used to balance the efficiency of the
transportation system with customer comfort and satisfaction. It also looks at the different impacts of
fare payment types on dwell time.
F a r e P a y m e n t , C r o w d i n g a n d D w e l l T i m e : A f i n e G r a i n e d A n a l y s i s P a g e | 11
TRANSIT SERVICE GUIDELINES
TransLink’s Transit Service Guidelines provide objectives on the maximum desired occupancy of
transit vehicles. These objectives informed the development of three different thresholds for acceptable
levels of crowding at different times. The first two thresholds relate to the highest occupancy during the
peak 30 and 15 minute4 periods during the AM and PM peaks5. The busiest 30 and 15 minute thresholds
are approximately 60% and 70% of bus capacity, respectively. The third threshold uses a 60 minute
period during midday, evenings and weekends and is approximately 50% of bus capacity. These
thresholds are referenced while analysing the data throughout this project.
TransLink is currently in the planning stages of implementing a new electronic fare collection
system. The Compass Card is a contactless electronic fare payment system that requires passengers to
tap on to the system when they board and tap off the system when they alight. When active in 2013,
the system will fundamentally change how passenger boarding and alighting will affect dwell time. This
study will provide a baseline from which the effects of this implementation can be measured.
ROUTE DESCRIPTION
#5 Robson/Downtown
The #5 Robson/Downtown bus circulates through Vancouver’s downtown peninsula. It serves
the residential, commercial and tourist area along Denman and Robson Streets before continuing
through the employment sector of downtown Vancouver. It then loops back through the employment
sector and continues in the opposite direction along Robson to Denman terminating where the route
began (see Figure 1). This route is flanked by residences and commercial establishments through the
entire length leading to many boardings and alightings throughout. It also connects with the SkyTrain
4 “The maximum number of passengers is calculated as the average of the maximum numbers of passengers on‐board all bus trips starting within the 15, 30 or 60 minutes period (as applicable) that has the highest average maximum number of passengers. The busiest time period is identified by calculating the 15, 30 or 60 minutes (as applicable) moving average maximum numbers of passengers and finding the highest value.”(South Coast British Columbia Transit Authority, 2008) 5 AM Peak Period is 6‐9 A.M. and PM Peak Period is 3‐6 P.M.” (South Coast British Columbia Transit Authority, 2008)

F a r e P a y m e n t , C r o w d i n g a n d D w e l l T i m e : A f i n e G r a i n e d A n a l y s i s P a g e | 12
rapid transit system. Twelve metre, low‐floor electric trolley buses are operated at headways of 5‐10
minutes throughout the day. A complete loop, from terminus to terminus, takes 35‐40 minutes
traversing 6km and passing 31 stops (Table 1). Due to construction, two stops were temporarily closed
near Robson and Richards Streets. When stopping to service passengers, the driver manually controls
the opening and closing of the front door. The rear doors are unlocked by the driver but require a
passenger to press on the handle to trigger them to be opened. They close automatically after a
predetermined time, unless retriggered by a passenger.
FIGURE 1: DOWNTOWN PENINSULA, VANCOUVER, BC, SHOWING THE ROUTE OF THE #5 ROBSON
Broadway Corridor
The Broadway corridor extends from the Burnaby‐Vancouver boundary to the University of
British Columbia (UBC). Central Broadway, loosely defined as the area between Main Street and Arbutus
F a r e P a y m e n t , C r o w d i n g a n d D w e l l T i m e : A f i n e G r a i n e d A n a l y s i s P a g e | 13
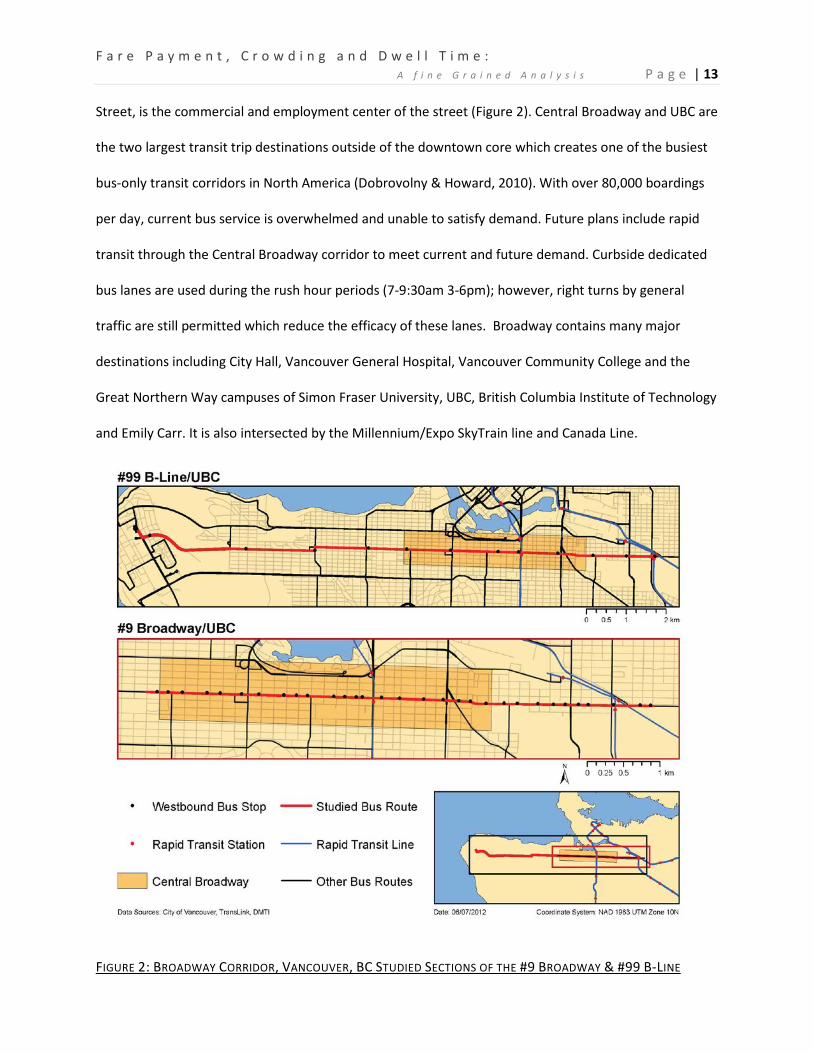
Street, is the commercial and employment center of the street (Figure 2). Central Broadway and UBC are
the two largest transit trip destinations outside of the downtown core which creates one of the busiest
bus‐only transit corridors in North America (Dobrovolny & Howard, 2010). With over 80,000 boardings
per day, current bus service is overwhelmed and unable to satisfy demand. Future plans include rapid
transit through the Central Broadway corridor to meet current and future demand. Curbside dedicated
bus lanes are used during the rush hour periods (7‐9:30am 3‐6pm); however, right turns by general
traffic are still permitted which reduce the efficacy of these lanes. Broadway contains many major
destinations including City Hall, Vancouver General Hospital, Vancouver Community College and the
Great Northern Way campuses of Simon Fraser University, UBC, British Columbia Institute of Technology
and Emily Carr. It is also intersected by the Millennium/Expo SkyTrain line and Canada Line.
FIGURE 2: BROADWAY CORRIDOR, VANCOUVER, BC STUDIED SECTIONS OF THE #9 BROADWAY & #99 B‐LINE

F a r e P a y m e n t , C r o w d i n g a n d D w e l l T i m e : A f i n e G r a i n e d A n a l y s i s P a g e | 14
#9 Broadway/UBC
The #9 travels the entire length of the Broadway corridor, from Boundary Road, through central
Broadway and on to UBC. The frequency on this line averages between 5‐15 minutes throughout the
day. The surveyed section took approximately 30 minutes to complete a 7 km run and passed 31 stops in
the westbound direction, 30 eastbound. As with the #5, twelve metre, low‐floor electric trolley buses
are operated on this route. Door operations are also the same as the #5. The #9 bus route is the
complementary local service to the 99 B‐Line express bus.
#99 Commercial-Broadway/UBC (B-Line)
The #99 B‐Line is a limited stop, express route that begins at Commercial/Broadway Skytrain
station and travels the same corridor as the #9, through central Broadway to its terminus at UBC. With
over 54,000 boardings per day, the 99 B‐Line is cited as the busiest bus line in North America
(Dobrovolny, 2010). This line is serviced by three door, articulated diesel buses running at 2‐3 minute
headways during rush hour periods and 5‐10 minute headways at other times. This 16 km route is
served by thirteen dedicated stops in each direction and was surveyed in its entirety. The #99 is unique
in the TransLink system in that it allows passengers with valid fare to board through any of the three
doors. All‐door boarding requires a different procedure regarding opening, closing and triggering the
rear doors. The drivers open all doors at all stops without needing passengers to trigger them. The driver
also closes the doors; however, the handles remain active allowing passengers to keep them open until
the boarding and alighting procedure is complete.

F a r e P a y m e n t , C r o w d i n g a n d D w e l l T i m e : A f i n e G r a i n e d A n a l y s i s P a g e | 15
TABLE 1: PHYSICAL CHARACTERISTICS OF ROUTES 5, 9 & 99
Route (Westbound) #5 Robson #9 Broadway #99 B‐Line
Length (km) 3.4 6.9* 16.2 Number of stops 15 31* 13 Daily boardings (Mon‐Fri) 9,400 25,300 54,350 Annual boardings 3,167,000 8,298,000 16,642,000 Service type Local Local Express Population (400m Buffer) 42,000 79,000 68,000 Employment (400m Buffer) 105,000 68,000 58,000 Based on 2011 data (Klitz, Nunez, & Hyslop, 2012)
*Section of route under study
ROLLING STOCK
As mentioned, the #5 & #9 use the same New Flyer E40LFR low‐floor trolleybuses. These 12 metre non‐
articulated electric coaches were delivered between 2006 and 2007. The seating layout, door width, and
the method for opening the rear doors were the same through all of these vehicles. The coaches used
on the #99 B‐Line were varied; however, they had many important characteristics in common. All
vehicles used on this route were New Flyer 18 metre articulated low‐floor diesel or diesel hybrid buses.
The oldest of these vehicles were first used in service in 1998 and have minor differences compared
with the newer vehicles built in 2009. Interior layout is similar amongst vehicles with subtle changes in
seating layout, wheelchair storage, hand‐hold locations and the method for triggering the rear doors to
open. Door size was not noticeably different amongst all vehicles. The fare box, fare collection methods
and fare structure were the same on every vehicle. While differences in bus type can affect dwell times,
it is anticipated that the subtle differences between model years will not have an effect on the dwell
times recorded in this study (Fernández et al., 2010; Tirachini, 2011). Although APCs are installed on 15%
of TransLink’s fleet, 20% of surveying occurred on vehicles with APCs installed6.
6 Roughly 30% of runs on the #5 & #9 had APC’s installed. APC’s only occurred on 6% of #99 runs.

F a r e P a y m e n t , C r o w d i n g a n d D w e l l T i m e : A f i n e G r a i n e d A n a l y s i s P a g e | 16
METHODOLOGIES
Vancouver, BC’s public transportation system, with instances of severe crowding, provided an
idea opportunity to study the effects of crowding and fare payment. Data was collected from April 12th –
May 12th, 2012. To best capture the effects of crowding, data was collected on weekdays, predominantly
during the morning (7‐10am) and afternoon (3‐6pm) rush hour periods. After consulting with TransLink,
three routes were chosen to survey, one express and two with local service. Routes were chosen that
experienced regular crowding and had both origins and destinations throughout the route. Choosing
routes with these characteristics ensured large flows of people on and off the bus at many different
stops. Data was collected with permission from TransLink and its subsidiary bus operations company,
Coast Mountain Bus Company (CMBC). Additional APC and GIS data was provided by TransLink for the
routes that were studied.
DATA COLLECTION PROCEDURE
Data was collected with a team of student volunteers onboard CMBC vehicles. Prior to boarding
the bus, the weather, temperature, date and recorder’s name were documented. Terminus stops are
defined as the first and last stops that data collection occurred. As such, dwell times are not accurate
because operators are required to wait for scheduled departure times or, if mid route, passenger counts
will not correspond to the dwell time. On the #5 and #9 the researchers would enter at the front door
and if the bus was occupied with passengers, both researchers would perform a head count. This
number would then be recorded as passengers boarded at the front door (D1_Prepay). As this stop is
considered a terminus, the data entered will not affect the dwell time model as all termini are removed
before analysis. The 99 B‐Line, with all‐door boarding and lines that form at each door, required each
research assistant to approach the front of the line at their respective door to ensure they boarded the
vehicle first to get an accurate count of the number of passengers alighting. Clipboards with the
TransLink logo on them and official permission letters were used to identify volunteers as researchers
working with TransLink. Once on the bus, the time at the beginning of the run, the bus number and
F a r e P a y m e n t , C r o w d i n g a n d D w e l l T i m e : A f i n e G r a i n e d A n a l y s i s P a g e | 17
gender and the number of years of experience of the driver were recorded. The researcher at the front
of the bus spoke with the driver and introduced themselves as a researcher. The permission letter was
presented if requested and the driver, advised that there was no requirement to answer, was asked how
many years of experience they have. The researcher only interacted with the driver before the run
began or after the run competed.
At each subsequent stop, research assistants, equipped with stopwatches, clipboards and data
collection sheets (Appendix A), recorded the number of boarding and alighting passengers, dwell time,
level of crowding, the accuracy of the entry and any relevant notes. Dwell time at the front door was
defined as the time from door opening to door closing. An additional variable, PassServiceTime, was
recorded to capture the difference between the time taken to serve passengers and the non‐passenger
related delays during dwell time (changing operators, waiting at time points, or waiting for red lights, all
with their doors open). To capture the true length of the dwell, including the time needed to reach the
door from elsewhere in the bus, the method of capturing the middle and rear door dwell times was
different. Above each door, a green light signals that the driver has released the door and that they are
available to be triggered for opening. Dwell time at these doors was defined as the time from the
illumination of the green light to door close.
Crowding at the front door was measured as a qualitative feeling of the level of crowding
(proximity of passengers to each other and the ease of movement through vehicle). The crowding
variable for the second and third door was defined as the number of people standing in the area near
the door (Appendix B). This variable was created in response to previous research that claimed
passengers standing near the door inhibited boarding and alighting (Tirachini, 2011). At the end of the
run, if at a terminus, final alightings were recorded. If the vehicle was still in transit, total occupancy was
determined through a head count and recorded as total alightings. Run end time was also recorded after
exiting the transit vehicle. The researchers were always included in the boarding and alighting totals.
Data from the collection sheets were then entered into a spreadsheet for analysis.

F a r e P a y m e n t , C r o w d i n g a n d D w e l l T i m e : A f i n e G r a i n e d A n a l y s i s P a g e | 18
The #5 and #99 were surveyed in their entirety in both the eastbound and westbound
directions. Surveying of the #9 was focused on the Central Broadway section of the route as crowding at
the extremities of the line, near Boundary Road and UBC, was not as pronounced as the central section
(Figure 2). The surveyed section began at Lakewood Dr. and concluded at Vine St. and included stops at
both rapid transit lines and all of the aforementioned major destinations.
VARIABLE DEFINITION
PassServiceTime captured the portion of the dwell that is used by passengers to board or alight.
This variable was only recorded when dwells that were longer than a typical dwell occurred. Extra
seconds taken at the end of a dwell were not recorded as non‐passenger related dwell time.
Dwell_Longest is the longest dwell time recorded at any door during a dwell. The difference between
Dwell_Longest and PassServiceTime is Dwell_Difference. Dwell_Difference represents the extra dwell
time spent at stops that is not due to passenger movements. Total_PAX27 is the is the squared terms of
passenger movements, the sum of total boardings and alightings at all doors, which, when used in the
regression analysis, represents the marginal effects of one additional passenger movement on dwell
time. As buses in this study have different maximum capacities, load (occupied capacity) was translated
to into percent of occupied capacity as represented by the variable Load_%ofbusCapacity. The squared
term of Load_%ofbusCapacity was also used to determine the marginal effects of one additional percent
of occupied capacity on dwell time, represented by Load_%ofbusCapacity2. StandPAXInteract was
created based on prior research and measures the interaction between boarding and alighting
passengers and the number of standees ((Standees^2)*Total_PAX) (Milkovits, 2008). The number of
standees was determined by subtracting the total number of people on board from the number of seats
on the bus. The remaining variables are described in Table 2.
7 PAX = Passenger movements, both boardings and alightings at one stop.
F a r e P a y m e n t , C r o w d i n g a n d D w e l l T i m e : A f i n e G r a i n e d A n a l y s i s P a g e | 19
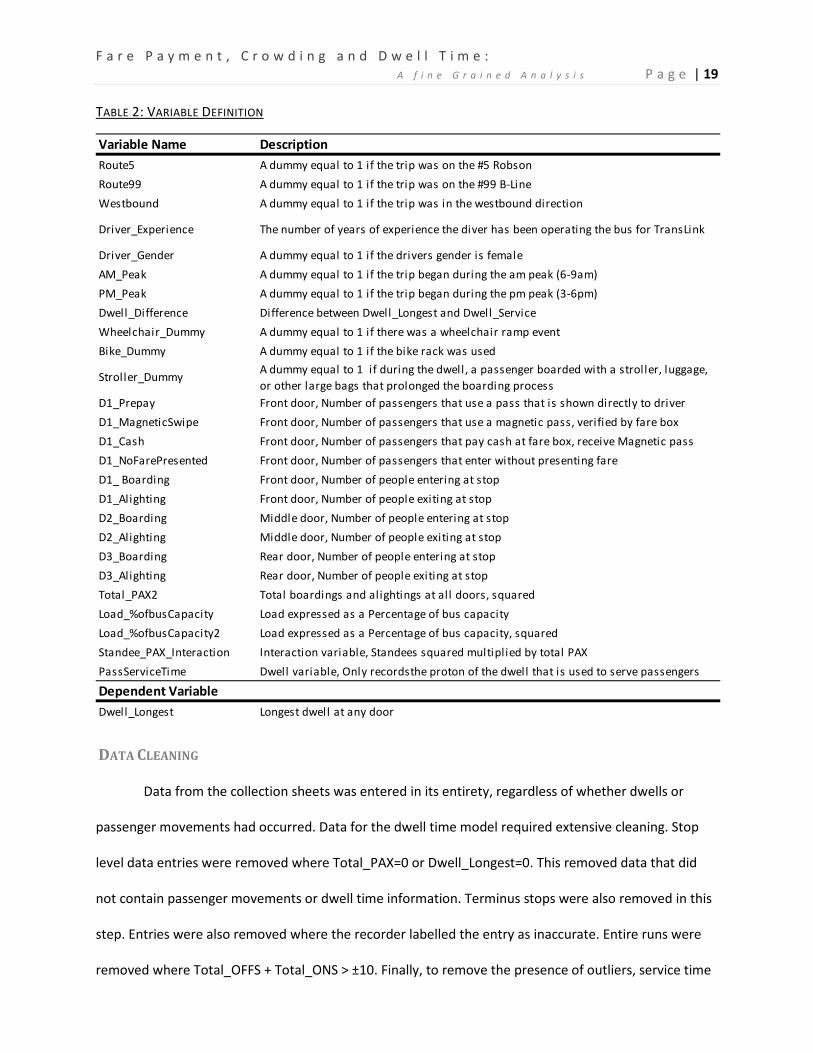
TABLE 2: VARIABLE DEFINITION
DATA CLEANING
Data from the collection sheets was entered in its entirety, regardless of whether dwells or
passenger movements had occurred. Data for the dwell time model required extensive cleaning. Stop
level data entries were removed where Total_PAX=0 or Dwell_Longest=0. This removed data that did
not contain passenger movements or dwell time information. Terminus stops were also removed in this
step. Entries were also removed where the recorder labelled the entry as inaccurate. Entire runs were
removed where Total_OFFS + Total_ONS > ±10. Finally, to remove the presence of outliers, service time
Variable Name DescriptionRoute5 A dummy equal to 1 if the trip was on the #5 RobsonRoute99 A dummy equal to 1 if the trip was on the #99 B‐LineWestbound A dummy equal to 1 if the trip was in the westbound direction
Driver_Experience The number of years of experience the diver has been operating the bus for TransLink
Driver_Gender A dummy equal to 1 if the drivers gender is femaleAM_Peak A dummy equal to 1 if the trip began during the am peak (6‐9am)PM_Peak A dummy equal to 1 if the trip began during the pm peak (3‐6pm)Dwell_Difference Difference between Dwell_Longest and Dwell_ServiceWheelchair_Dummy A dummy equal to 1 if there was a wheelchair ramp eventBike_Dummy A dummy equal to 1 if the bike rack was used
Stroller_Dummy A dummy equal to 1 if during the dwell, a passenger boarded with a stroller, luggage, or other large bags that prolonged the boarding process
D1_Prepay Front door, Number of passengers that use a pass that is shown directly to driver D1_MagneticSwipe Front door, Number of passengers that use a magnetic pass, verified by fare boxD1_Cash Front door, Number of passengers that pay cash at fare box, receive Magnetic passD1_NoFarePresented Front door, Number of passengers that enter without presenting fareD1_ Boarding Front door, Number of people entering at stopD1_Alighting Front door, Number of people exiting at stopD2_Boarding Middle door, Number of people entering at stopD2_Alighting Middle door, Number of people exiting at stopD3_Boarding Rear door, Number of people entering at stopD3_Alighting Rear door, Number of people exiting at stopTotal_PAX2 Total boardings and alightings at all doors, squaredLoad_%ofbusCapacity Load expressed as a Percentage of bus capacityLoad_%ofbusCapacity2 Load expressed as a Percentage of bus capacity, squaredStandee_PAX_Interaction Interaction variable, Standees squared multiplied by total PAXPassServiceTime Dwell variable, Only recordsthe proton of the dwell that is used to serve passengers
Dwell_Longest Longest dwell at any door
Dependent Variable

F a r e P a y m e n t , C r o w d i n g a n d D w e l l T i m e : A f i n e G r a i n e d A n a l y s i s P a g e | 20
per passenger was calculated by dividing PassServiceTime by Total_PAX. The top 5% of dwells with the
largest passenger service time were removed. Through data cleaning, 762 data points were removed
leaving a working dataset of 1,764 dwells for the development of the dwell time model. APC data was
not used in the cleaning procedure as complete data was not available at the time of this research.
ANALYSIS
Assessing dwell times based on the average time required for a passenger to board or alight
shows that there is a distinct difference between crowded and non‐crowded conditions and between
the different routes analyzed. Dwell time per passenger movement (Dwell_Time/PAX) was determined
by dividing PassServiceTime time by the maximum passenger movements, boardings and alightings, at
any door. As can be seen in Table 3, crowded conditions, as defined as loads exceeding 70% of bus
capacity, show a marked increase in passenger service time of 1.7 second on the #5 and 0.48 seconds on
the #9. This result is indicative of a reduction in the efficiency of dwell times during crowded conditions.
Conversely, the #99 actually shows a decrease in passenger service time of 0.41 when buses are
crowded. This gain in efficiency is likely attributed to all‐door boarding where the driver is in control of
the doors and may prolong dwells to ensure all boardings and alightings have occurred. During non‐
crowded times this would leave a few extra second of non‐passenger service time that would not have
been captured in PassServiceTime. As well, passenger movements through the rear doors are faster and
volumes are higher than those at the front. This is likely because boarding and alighting are impeded by
a smaller door, narrower access and passengers making fare payment. The large standard deviations
are reflective of a wide range of values, particularly where passenger volumes are low and boarding and
alighting times are long.

F a r e P a y m e n t , C r o w d i n g a n d D w e l l T i m e : A f i n e G r a i n e d A n a l y s i s P a g e | 21
TABLE 3: SUMMARY STATISTICS AT THE STOP LEVEL
DWELL TIME MODEL
Using the longest dwell at any door (Dwell_Longest) in seconds as the dependent variable, two
linear regression models were developed (traditional and expanded Model). The variables and
associated coefficient, t‐statistic and statistical significance are shown in Table 4.
The traditional model uses the non‐detailed variables to simulate APC collected information.
While the expanded model uses all the collected variables. Comparing these two models will enable us
to show the value of obtaining such detailed information about every dwell and the impact of these
variables on dwell time. The expanded model explains 86% of the variation in Dwell_Longest using a
sample size of 1764 dwells, compared to the traditional model which explains only 58% of the variation.
The coefficients in the traditional model follow the expected signs and direction. In general the model is
comparable to previous research (Dueker et al., 2004; El‐Geneidy & Vijayakumar, 2011). This illustrates
the reliability of the collected data in term of its accuracy in predicting dwell time.
The traditional model shows that dwell times begin to increase at 40% of occupied capacity, or,
at a passenger load of approximately 31 people for a trolley bus. With a seated passenger capacity of 31
people, it is possible, although unlikely, that there would be no standees. Under the expanded model,
Variable Mean Std. Dev. Mean Std. Dev. Mean Std. Dev. Mean Std. Dev. Mean Std. Dev. Mean Std. Dev.
D1_Prepay 1.82 2.84 5.38 9.70 2.43 3.92 5.57 9.53 0.85 1.26 1.53 1.93D1_MagneticSwipe 0.57 1.25 1.23 2.13 0.58 1.22 0.90 1.69 0.36 0.80 0.38 0.74D1_Cash 0.22 0.56 0.38 0.96 0.15 0.46 0.07 0.25 0.17 0.48 0.23 0.52D1_NoFarePresented 0.02 0.16 0.00 0.00 0.02 0.15 0.00 0.00 0.01 0.13 0.02 0.15D1_Alighting 0.57 1.07 0.31 0.63 0.66 1.28 0.90 1.32 0.75 1.33 1.26 1.79D2_Boarding 0.00 0.04 0.00 0.00 0.03 0.50 0.10 0.40 2.00 2.30 5.11 3.21D2_Alighting 2.54 3.25 1.62 2.06 2.86 3.83 2.40 3.64 2.93 3.14 4.79 4.76D3_Boarding - - - - - - - - 2.90 3.08 7.45 4.67D3_Alighting - - - - - - - - 3.72 3.76 5.98 5.60Load_%ofbusCapacity 24.72 16.25 77.31 4.79 37.81 15.20 74.53 2.70 35.71 16.74 79.17 5.81Dwell_Time/PAX 3.69 2.31 5.35 2.65 3.58 2.25 4.06 2.21 2.18 1.78 1.77 1.95Number of Dwells
Crowded#5 Robson #9 Broadway #99 B-Line
Non-Crowded Crowded Non-Crowded Crowded Non-Crowded
47
Crowded Condition = Load > 70% of Capacity
562 13 689 30 423

F a r e P a y m e n t , C r o w d i n g a n d D w e l l T i m e : A f i n e G r a i n e d A n a l y s i s P a g e | 22
the trough occurs sooner at 31%, or 24 people. Both of these models are probable, however, the
expanded model is likely more accurate when considering the entire curve. Through to about 60% of
occupied capacity, dwell times derived with the expanded model are relatively static. From this point
they begin to increase, which is corroborated by previous research (Lin & Wilson, 1992; Milkovits, 2008).
The traditional model is less realistic with dwell times that are exaggerated at both the low and high end
of bus occupancy.
Moving to the expanded model, dwell times on #5 Robson and #99 B‐Line are 0.8 and 3.3
seconds longer, respectively, than those of #9. The doors on the #99 B‐line are controlled by the driver
to facilitate all‐door boarding; operators waiting for passengers to clear the rear doors before closing
them could contribute to the longer dwells on the 99. The direction of travel, years of driver experience
and driver gender all did not show a statistically significant effect on dwell time in our sample. Dwell
times are only marginally faster during the AM and PM peak than during non‐peak times. This effect has
been attributed to more regular riders using prepaid fare and more directional passenger traffic
reducing the mix of boardings and alightings at the same stop (Dueker et al., 2004; El‐Geneidy &
Vijayakumar, 2011). Delay related variables, wheelchair ramp events, bike rack events and passengers
with strollers or other bulky items, show statistically significant increases in dwell time. A wheelchair
event adds 38.4 seconds to dwell time which is 24.0 seconds faster than has been previously found
(Dueker et al., 2004). This reduction in dwell time is likely attributable to the age of CMBC’s fleet of
buses. The majority of the buses in the fleet are less than 10 years old and all have low floors, fast ramp
actuations and efficient tie down systems, which reduce the time needed to service passengers in
wheelchairs.

F a r e P a y m e n t , C r o w d i n g a n d D w e l l T i m e : A f i n e G r a i n e d A n a l y s i s P a g e | 23
TABLE 4: DWELL TIME MODEL
As would be expected, boardings, alightings and fare type used at all doors are associated with
an increase in dwell time. All passenger movement variables are significant except boardings with no
fare at door 1 and boardings at door 2. Passengers boarding with prepaid fare are the fastest to board
as they have no interaction with the fare box and only need to show their pass to the driver (2.2s/per
passenger). Each passenger using a magnetic swipe ticket adds 3.0 seconds to dwell time, while those
using cash add 4.2 seconds while keeping all other variables constant at their mean value. Finally, each
passenger who does not pay the fare, even though they do not interact with the fare box or show a pass
to the driver, adds 1.6 seconds. This is attributed to these passengers offering an explanation to the
Variable Name Coefficient t-stat Stat. Sig. Coefficient t-stat Stat. Sig.(Constant) 9.42 7.61 0.00 6.87 9.10 0.00Route5 ‐0.10 ‐0.15 0.88 0.77 1.89 0.06Route99 0.68 0.69 0.49 3.30 5.60 0.00Westbound ‐0.52 ‐1.00 0.32 0.08 0.24 0.81Driver_Experience 0.00 ‐0.19 0.85Driver_Gender ‐0.34 ‐0.65 0.52AM_Peak ‐0.40 ‐0.53 0.60 ‐0.20 ‐0.45 0.65PM_Peak 0.87 1.52 0.13 ‐0.12 ‐0.34 0.73Dwell_Difference 0.91 55.17 0.00Wheelchair_Dummy 38.48 18.12 0.00Bike_Dummy 3.85 2.82 0.01Stroller_Dummy 5.51 4.92 0.00D1_Prepay 2.23 29.25 0.00D1_MagneticSwipe 3.03 19.33 0.00D1_Cash 4.21 13.50 0.00D1_NoFarePresented 1.57 1.53 0.13D1_Boarding 3.11 32.81 0.00D1_Alighting 1.86 7.78 0.00 1.31 9.18 0.00D2_Boarding 0.60 2.19 0.03 0.24 1.49 0.14D2_Alighting 0.97 9.00 0.00 0.64 9.98 0.00D3_Boarding 1.46 6.72 0.00 0.84 6.51 0.00D3_Alighting 0.97 5.60 0.00 0.52 5.09 0.00Total_PAX2 ‐0.01 ‐6.93 0.00 ‐0.01 ‐4.66 0.00Load_%ofbusCapacity ‐0.18 ‐3.00 0.00 ‐0.06 ‐1.76 0.08Load_%ofbusCapacity2 0.00 2.35 0.02 0.00 2.34 0.02Standee_PAX_Interaction 0.00 2.05 0.04 0.00 3.69 0.00R Squared 0.58 0.86N 1764 1764a Dependent Variable: Dwell_Longest
Traditional Model Expanded Model

F a r e P a y m e n t , C r o w d i n g a n d D w e l l T i m e : A f i n e G r a i n e d A n a l y s i s P a g e | 24
operator as to why they cannot pay. It is important to note that throughout this study, less than 0.5% of
passengers boarded with no fare.
Passengers alighting at the front door take longer than those alighting through rear doors. A
passenger alighting at the front door will extend the dwell by 0.7 seconds more than one alighting
through rear door. Crowding and friction around the front door likely create this difference as
passengers tend to resist moving to the back of the bus. Additionally, this could also be attributed to the
time needed to access the front door. Unlike the rear where passenger can wait directly adjacent to the
doors, passengers alighting at the front door are required to wait behind the driver’s seat to ensure the
driver’s sightlines are not obstructed and till other passengers board the bus. A passenger boarding at
door 2 adds 0.24 and 0.84 seconds at door 3. Boarding events at the second door occurred in less than ½
percent of all dwells on the #5 and #9 as alighting through the rear door is normally not allowed on
either of these routes8. Therefore, the effects of this variable can be attributed almost entirely to the 99
B‐Line. The effects of boarding and alighting through door 3 are entirely attributed the B‐line as it is the
only route that uses articulated buses.
As buses in this study have different maximum capacities, the effect of passenger load was
determined by using the percent of occupied capacity. The squared term of this variable was also used
to determine the marginal effects of one percent greater occupied capacity. A one percent increase in
the passenger load of the bus generated a 0.06 second reduction in the dwell time. Meanwhile square
term of the bus capacity has a statistically significant positive effect. This indicates that the amount of
dwell time will decrease with the increase in passenger load till a certain threshold.
8 Occasionally a CMBC attendant would check fares at door 2 on the #9 Broadway at Commercial‐Broadway Station during the am and pm peak. This only occurred on two runs during the data collection period.
F a r e P a y m e n t , C r o w d i n g a n d D w e l l T i m e : A f i n e G r a i n e d A n a l y s i s P a g e | 25
DISCUSSION
TRADITIONAL & EXPANDED DWELL TIME MODELS
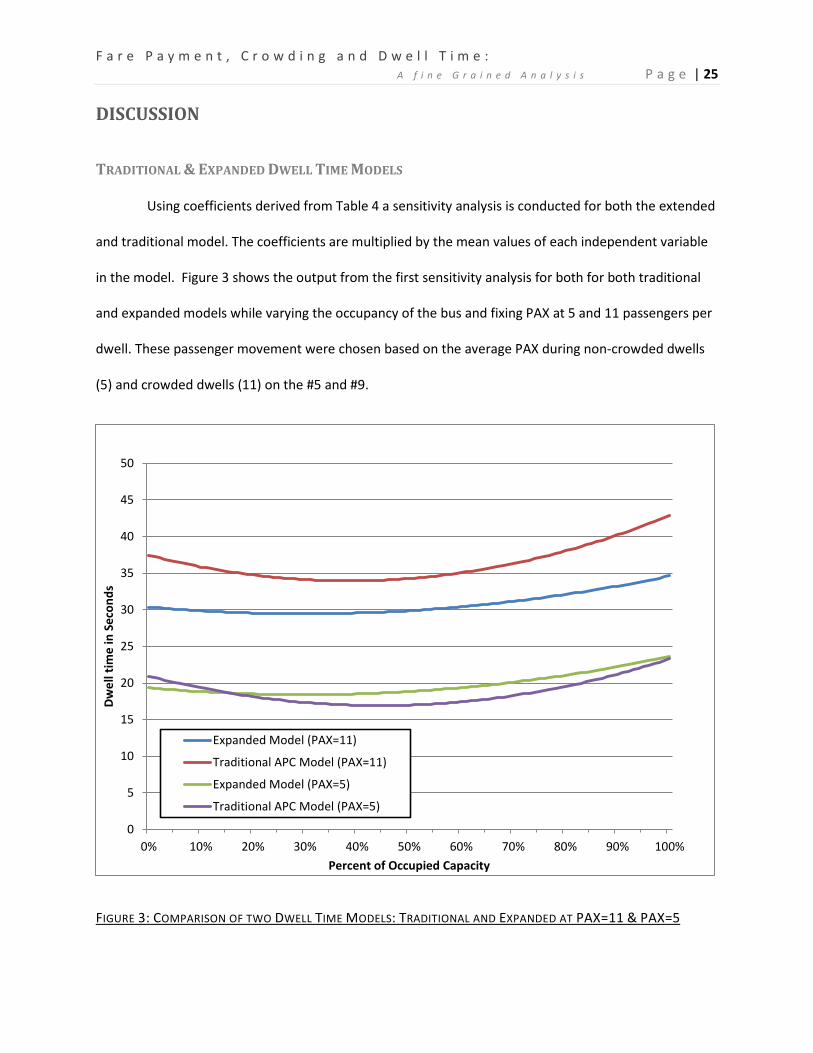
Using coefficients derived from Table 4 a sensitivity analysis is conducted for both the extended
and traditional model. The coefficients are multiplied by the mean values of each independent variable
in the model. Figure 3 shows the output from the first sensitivity analysis for both for both traditional
and expanded models while varying the occupancy of the bus and fixing PAX at 5 and 11 passengers per
dwell. These passenger movement were chosen based on the average PAX during non‐crowded dwells
(5) and crowded dwells (11) on the #5 and #9.
FIGURE 3: COMPARISON OF TWO DWELL TIME MODELS: TRADITIONAL AND EXPANDED AT PAX=11 & PAX=5
0
5
10
15
20
25
30
35
40
45
50
0% 10% 20% 30% 40% 50% 60% 70% 80% 90% 100%
Dwel
l tim
e in
Sec
onds
Percent of Occupied Capacity
Expanded Model (PAX=11)
Traditional APC Model (PAX=11)
Expanded Model (PAX=5)
Traditional APC Model (PAX=5)

F a r e P a y m e n t , C r o w d i n g a n d D w e l l T i m e : A f i n e G r a i n e d A n a l y s i s P a g e | 26
As shown in Figure 3, the effect of PAX and payment method is apparent in the relationship
between the two sets of curves. At both levels of PAX, the traditional model tends to overestimate dwell
times at the lowest levels of bus occupancy. With low PAX, the dwell times predicted by both models are
similar. However, as passenger movements and the diversity of payment methods increase, the
traditional model begins to overestimate dwell times. This effect is due to the additional passenger
boarding detail in the expanded model. The traditional model uses the average boarding time for all fare
types and, regardless of payment method, added 3.1 second to the dwell for a passenger boarding at
the front door while keeping all other variables constant at their mean value. A passenger boarding with
a pass that only needed to be shown to the driver adds only 2.2 seconds to the dwell as seen in the e
model. With the majority of passengers using this type of fare media, as PAX increases, the error in the
traditional model increases as well.
Dwell times produced using the traditional model are similar at both ends of the curve. The
expanded model is different in that the curve is much flatter through to about 50% of capacity. This
difference is expected as the variable Dwell_Difference is not included in the traditional model. This
variable measures the difference between the time required to service passengers and total dwell time
inclusive of non‐passenger related delays. Including this variable changes how the variables
Load_%ofbusCapacity, Load_%ofbusCapacity2, and StandPAXInteract affect the curve. The majority of
these non‐passenger related delays occurred where occupied capacity was less than 30%. This helps to
explain the difference between the two curves at lower bus occupancy. Non‐passenger related service
delays are clearly an important component of dwell time that is very difficult to capture with only APC
data.
As bus occupancy increases above 50%, both models show an increase in dwell time. Prior
research has attempted to define a bus occupancy threshold above which, crowding begins to affect
dwell time (Dueker et al., 2004; Lin & Wilson, 1992; Milkovits, 2008). The results of this research suggest
that crowding, as it relates to dwell time, occurs at approximately 60% of bus capacity. As can be seen in
F a r e P a y m e n t , C r o w d i n g a n d D w e l l T i m e : A f i n e G r a i n e d A n a l y s i s P a g e | 27
Figure 3, dwell time begins to increase dramatically after this point. On a typical Vancouver trolley bus
with all seats occupied, this would leave approximately 15 standees. This corroborates observations
made during data collection.
The thresholds outlined by TransLink in the Transit Service Guidelines are reasonable based on
the data presented here. While all of the thresholds are associated with increases in dwell times, the
most pronounced increases occur above 60% of capacity. While not explored in this paper, other factors
must also be considered in developing crowding thresholds. For instance, the fiscal efficiency of the
route needs to be maintained by ensuring certain metrics are satisfied (total boardings, capacity
utilization, etc.). The personal safety and comfort of customers must also be considered when defining
these guidelines. The context of the route must also be understood. The #5 and #9 are traverse dense
urban areas where crowding may be more tolerable as trips are likely shorter than a suburban route.
Whereas passengers on the 99 B‐line express, with longer stop spacing, are likely spending more time
onboard and are less likely to tolerate crowding.
PASSENGER MOVEMENTS, FARE PAYMENT AND THEIR EFFECTS ON DWELL TIME
Passengers boarding and alighting the bus, particularly those paying fare at the front door, have
the largest impact on dwell times. Passengers with bikes, strollers, other large items and those in
wheelchairs also affect the length of dwells. However, the one regulating force in the efficacy of these
movements is the level of occupancy of the vehicle; as the occupied capacity of the vehicle increases,
the movement of all passengers on, off and through the vehicle slows down.
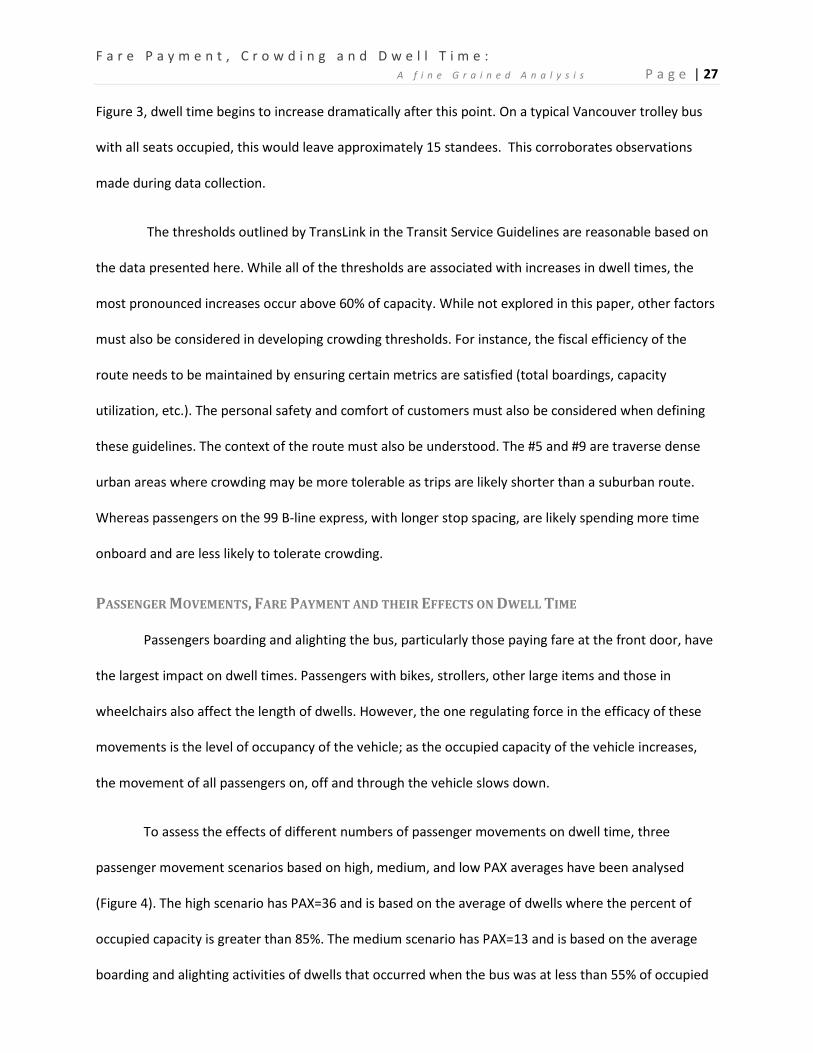
To assess the effects of different numbers of passenger movements on dwell time, three
passenger movement scenarios based on high, medium, and low PAX averages have been analysed
(Figure 4). The high scenario has PAX=36 and is based on the average of dwells where the percent of
occupied capacity is greater than 85%. The medium scenario has PAX=13 and is based on the average
boarding and alighting activities of dwells that occurred when the bus was at less than 55% of occupied
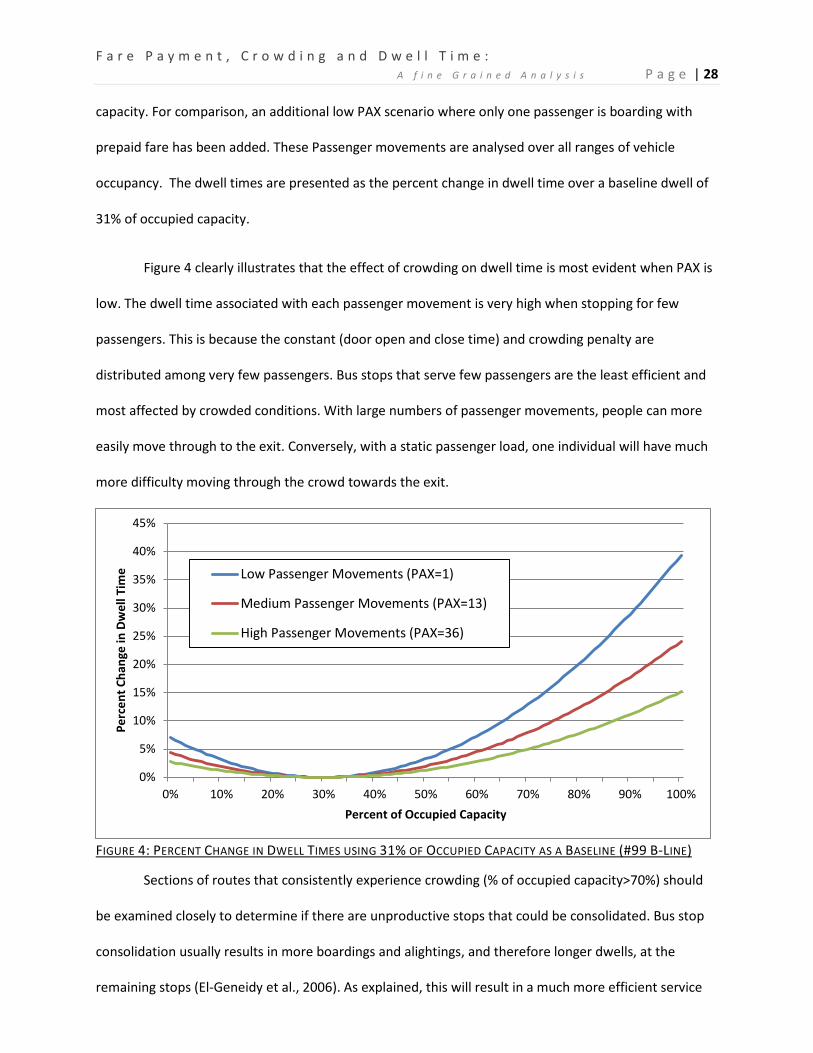
F a r e P a y m e n t , C r o w d i n g a n d D w e l l T i m e : A f i n e G r a i n e d A n a l y s i s P a g e | 28
capacity. For comparison, an additional low PAX scenario where only one passenger is boarding with
prepaid fare has been added. These Passenger movements are analysed over all ranges of vehicle
occupancy. The dwell times are presented as the percent change in dwell time over a baseline dwell of
31% of occupied capacity.
Figure 4 clearly illustrates that the effect of crowding on dwell time is most evident when PAX is
low. The dwell time associated with each passenger movement is very high when stopping for few
passengers. This is because the constant (door open and close time) and crowding penalty are
distributed among very few passengers. Bus stops that serve few passengers are the least efficient and
most affected by crowded conditions. With large numbers of passenger movements, people can more
easily move through to the exit. Conversely, with a static passenger load, one individual will have much
more difficulty moving through the crowd towards the exit.
Sections of routes that consistently experience crowding (% of occupied capacity>70%) should
be examined closely to determine if there are unproductive stops that could be consolidated. Bus stop
consolidation usually results in more boardings and alightings, and therefore longer dwells, at the
remaining stops (El‐Geneidy et al., 2006). As explained, this will result in a much more efficient service
0%
5%
10%
15%
20%
25%
30%
35%
40%
45%
0% 10% 20% 30% 40% 50% 60% 70% 80% 90% 100%
Perc
ent C
hang
e in
Dw
ell T
ime
Percent of Occupied Capacity
Low Passenger Movements (PAX=1)
Medium Passenger Movements (PAX=13)
High Passenger Movements (PAX=36)
FIGURE 4: PERCENT CHANGE IN DWELL TIMES USING 31% OF OCCUPIED CAPACITY AS A BASELINE (#99 B‐LINE)

F a r e P a y m e n t , C r o w d i n g a n d D w e l l T i m e : A f i n e G r a i n e d A n a l y s i s P a g e | 29
over the course of a run. Although stops with high PAX will be most efficient, there is potential to reduce
dwell times even further.
Routes that experience regular crowding in excess of 70% of occupied capacity would be well
served by allowing all‐door boarding at the busiest stops. Boarding and alighting at door 2 and 3 are
much faster than through the front doors and will likely save greater than 1 second per passenger that
shifts from the front door and boards or alights through one of the rear doors (Dobrovolny, 2009). As
experienced during the data collection, this already happens on occasion at Commercial‐Broadway
SkyTrain station. For safety, a TransLink employee is required to monitor passengers alighting at the rear
doors. As such, allowing all‐door boarding would be most feasible only at major transit stations where
multiple lines converge.
Previous research on the influence of fare type on dwell time have used APC, AVL and automatic
fare counting systems to analyse this relationship. Comparing the research presented here to the
literature, the most directly comparable variables are the use of a magnetic ticket and cash by a
boarding passenger. Researchers have found that using magnetic strip tickets are associated with a 4.9
or 4.6 second increase in dwell time per passenger (Milkovits, 2008; Tirachini, 2011). Cash payment are
also comparable and were found to add 5.7 seconds per boarding passenger (Tirachini, 2011). These
findings are 1.5 and 1.9 seconds longer than what was discovered in the research presented here. This
is likely attributable to the inability of remote sensors to capture the difference between passenger
service time and extra dwell time not associated with passenger movements. To deal with this
shortcoming, Milkovits (2008) was forced to group non‐paying passengers, passengers paying with cash
and passengers who’s transactions were completed after the dwell had occurred as one group. This was
because the data collections systems did not record these details. Atypical passengers were defined as
any passenger that took longer than 8 second to board or alight the bus. In the current model, all
atypical passengers, including those in wheelchairs, with bikes, or with strollers are included in the
model without needing to delineate.
F a r e P a y m e n t , C r o w d i n g a n d D w e l l T i m e : A f i n e G r a i n e d A n a l y s i s P a g e | 30
TransLink is currently installing and will be implementing the Compass card, a new fare
collection system that includes turnstiles at SkyTrain and SeaBus and new sensors on all buses. The
introduction of this electronic fare collection system, set to launch in 2013, will dramatically change
dwell times throughout TransLink’s system. This contactless system will require passengers to tap onto
the system when boarding and tap off again when alighting. From previous research, dwell time will
increase by 2.6 seconds for every passenger that uses an electronic fare card while keeping all other
variables constant at their mean value (Milkovits, 2008). As with the other coefficients compared to the
literature, this one is likely reduced by a similar margin. However, it is very likely that the transaction
time will still be higher than simply showing a pass to the driver. Alighting will be greatly affected as the
majority of passengers will be required to tap off, adding a transaction time where there formally was
none. As the system will require card readers at all doors, one potential strategy to mitigate these
longer transaction times would be to allow all‐door boarding throughout the system. Future research
should use the methodologies outlined in this paper to examine how the implementation of this new
fare collection system will affect dwell times.
INTERACTION BETWEEN PASSENGER MOVEMENTS AND BUS OCCUPANCY
TransLink’s Transit service guidelines were used to develop load thresholds to better understand
how dwell times are affected by different levels of crowding. These thresholds are approximately 50, 60
and 70% of occupied capacity and are compared to a baseline of 31%, the fastest dwell time predicted
by the model. Looking at Figure 3, the #5 Robson, with a passenger load of 50% and PAX=11 will see a
dwell time increase of approximately 0.43 seconds. An additional 10% increase in occupied capacity, to
60%, increases dwell time by 1.02 seconds from the base. At the maximum acceptable level of crowding,
70% according to the TSG, dwell time increases by 1.70 seconds. Although loads greater than 70% of
capacity are not desirable, a number of runs in this study experienced loads much greater than the 70%
threshold. The impact of these loads on dwell time is significant. At 80, 90 and 100% of capacity, dwell
times increase by 2.65, 3.81 and 5.18 seconds, respectively. The relationship between dwell time and

F a r e P a y m e n t , C r o w d i n g a n d D w e l l T i m e : A f i n e G r a i n e d A n a l y s i s P a g e | 31
load shown here corroborates past research that demonstrated that the relationship is non‐linear and
most evident at the highest levels of crowding (Lin & Wilson, 1992; Milkovits, 2008).
Using the coefficients derived from Table 4, a sensitivity analysis is conducted to predict dwell
times for the 99 B‐Line traveling westbound with a male driver during the am peak (Table 5). The
coefficients are multiplied by the mean values of each independent variable in the model. These
estimates are based on two different passenger boarding and alighting scenarios, 13 and 36. Using these
two different boarding and alighting scenarios while keeping all other variables constant at their mean,
the effect on dwell time is examined at 30, 60 and 90 % of occupied capacity.
TABLE 5: #99 B‐LINE, SENSITIVITY ANALYSIS
The first increase in occupied capacity, from 30% to 60%, sees an increase in dwell time of 1.1
seconds for the Medium PAX scenario and 1.5 for high PAX. This represents a 5% change in dwell times.
This increase is minor considering the dwell penalty is associated with a doubling of occupancy.
However, adding the next 30% in occupied capacity increases dwell time by 4.4 and 7 seconds. This
represents a 20% increase in dwell times regardless of the number of passengers boarding and alighting.
According to the results presented here, buses running above the 70% capacity threshold
outlined in the Transit Service Guidelines will run much slower than those below this threshold. This is
due to two interrelated factors. Buses with heavier loads experience larger flows of people on and off
Variable NameD1_PrepayD1_MagneticSwipeD1_CashD1_NoFarePresentedD1_AlightingD2_BoardingD2_AlightingD3_BoardingD3_AlightingOccupied Capacity of BusDwell time in SecondsIncrease in dwell time attributed to Crowding% increase
42.690%
21.5 22.6 27.0 34.1 35.6
1 1PAX=13 PAX=36
1 20 10 00 03 82 73 63 11
30% 60% 90% 30% 60%
1.1 4.4 1.5 7.0
5% 19% 4% 20%

F a r e P a y m e n t , C r o w d i n g a n d D w e l l T i m e : A f i n e G r a i n e d A n a l y s i s P a g e | 32
than those with smaller loads. On the #5, dwells with passenger loads greater than 70% saw 40% more
passenger movements than dwells below 70%. This is compounded by the increase in dwell time
associated with crowding. These two factors serve to prolong dwells and slow the bus along its route. As
Lin and Wilson (1992) found, overcrowding turns into a vicious cycle that only exacerbates the crowding
problem. This can quickly lead to bunching and severely degraded service throughout the route. This is
especially true on routes serviced by trolley buses where it is difficult to pass slow vehicles. On busy,
high frequency routes, focus should be in maintaining headways as opposed to adhering to schedules.
While pass‐ups are not desirable, they occur throughout the system and may even be advisable
when vehicles are heavily loaded and a stop request has not been made. This would serve to reduce
bunching, maintain headways and improve reliability. With technological advances and integrated
systems, the route number and destination signage on the front and side of the bus could be used to
advise passengers of when the next bus will be coming and its approximate load. Other forms of social
media could be implemented to alert passengers of crowding and possible pass‐ups. Having certainty
around the length of the delay and the likelihood of boarding the next bus would help reduce passenger
frustration when pass‐ups do occur.
CONCLUSION
The purpose of this research was to examine the effects of crowding and fare payment on dwell
time. Remotely collected data allows for broad analysis, however, much of the detail during the dwell is
lost. The manual data collection methods used in this study allowed for the delineation of dwell times
that were passenger related and those that were caused by other events. The type of fare used was also
recorded allowing for a more detailed and accurate model regarding front door alightings.
A traditional dwell time model and an expanded model were analysed and compared. While
both models showed that as the occupancy of the bus increases, dwell time also increases, the
traditional model overestimated dwells especially at high and low levels of bus occupancy. This
F a r e P a y m e n t , C r o w d i n g a n d D w e l l T i m e : A f i n e G r a i n e d A n a l y s i s P a g e | 33
difference is attributed to the detailed fare payment and dwell time data garnered through manual data
collection.
When examining the sensitivity of dwell times to different levels of passenger movements, a
clear distinction between different levels of crowding is apparent. Dwell times clearly increase with the
number of passenger movements occurring. However, under crowded conditions, the time taken to
service passengers at stops with low Passenger movements is far greater than to service those stops
with at high passenger movements, on a time per passenger basis. Consolidation of bus stops with low
passenger movements on frequently crowded routes is recommended to reduce runtime. Allowing
passengers to alight through the rear doors at the busiest stops would also vastly improve dwell times.
Crowding begins to affect dwell time at approximately 60% of occupied capacity. Based on this
information, TransLink’s Transit Service Guidelines, with their maximum desired occupancy of 70%
averaged over the route, appear to strike a good balance between the efficiency of the service and
passenger comfort especially on urban routes. It is recommended that the type of route (Regular or
express sevice), the context of the route (Urban or Suburban), and the boarding and alighting activities
be considered when addressing crowding. As the level of crowding on the bus increases, so do the
associated passenger movements during dwells. This serves to dramatically increase dwell times on
heavily loaded buses. These crowded buses can affect the headways of vehicles following, especially on
high frequency routes serviced by trolley buses that are unable to easily pass a slow vehicle. During
periods of crowding, focus should be on maintaining headways instead of adhering to a schedule.
With patronage on public transportation systems increasing across North America, continued
investment is needed to accommodate this demand. Planners can find more efficiency through the
system which will reduce costs and encourage more ridership. However, without investment, our
transit systems will continue to be bogged down with crowding, reducing reliability and customer
satisfaction.
F a r e P a y m e n t , C r o w d i n g a n d D w e l l T i m e : A f i n e G r a i n e d A n a l y s i s P a g e | 34
REFERENCES Crowding in Street Cars. (1900, Aug 22). The Lewiston Daily Sun, p. 1. Dobrovolny, J. (2009). All Door Boarding on the 99 B‐Line Progress Report. Vancouver, BC: City of
Vancouver. Dobrovolny, J. (2010). TransLink’s UBC Line Rapid Transit Study Shortlist of Alternatives. Vancouver, BC:
City of Vancouver. Dobrovolny, J., & Howard, R. (2010). Rapid Transit Principles for the Broadway Corridor and the UBC Line
Rapid Transit Study. Vancouver, BC: City of Vancouver. Dueker, K., Kimpel, T., Strathman, J., & Callas, S. (2004). Determinants of bus dwell time. Journal of
Public Transportation, 7(1), 21‐40. El‐Geneidy, A., Strathman, J., Kimpel, T., & Crout, D. (2006). The effects of bus stop consolidation on
passenger activity and transit operations. Transportation Research Record(1971), 32‐41. El‐Geneidy, A., & Vijayakumar, N. (2011). The effects of articulated buses on dwell and running times.
Journal of Public Transportation, 14(3), 63. Fernández, R., Zegers, P., Weber, G., & Tyler, N. (2010). Influence of Platform Height, Door Width, and
Fare Collection on Bus Dwell Time. Transportation Research Record(2143), 59‐66. Greater Vancouver Transportation Authority. (2004). Transit Service Guidelines: Technical Report.
Vancouver, BC: TransLink. Kimpel, T., Strathman, J., Bertini, R., Bender, P., & Callas, S. (2005). Analysis of transit signal priority using
archived TriMet bus dispatch system data. Transportation Research Record(1925), 156‐166. Kimpel, T., Strathman, J., Griffin, D., Callas, S., & Gerhart, R. (2003). Automatic passenger counter
evaluation: Implications for transit database reporting. Transportation Research Record(1835), 93‐100.
Klitz, P., Nunez, A., & Hyslop, A. (2012). 2011 BSPR Route Summaries 1 to 99. Retrieved from http://www.translink.ca/~/media/Documents/bpotp/managing_the_transit_network/2011%20BSPR%20Route%20Summaries%201%20to%2099.ashx
Levinson, H. (1983). Analyzing transit travel time performance. Transportation Research Record(915), 1‐6.
Lin, T., & Wilson, N. (1992). Dwell time relationships for light rail systems. Transportation research record(1361), 287‐295.
Milkovits, M. (2008). Modeling the factors affecting bus stop dwell time: Use of automatic passenger counting, automatic fare counting, and automatic vehicle location data. [10.3141/2072‐13]. Transportation Research Record(2072), 125‐130.
Moore II, J., Giuliano, G., & March, J. (2002). Performance of Automatic Passenger Counters in the Ventura/Lompoc Smart Card Demonstration Project. Journal of Intelligent Transportation Systems, 7(2), 131‐150.
Rajbhandari, R., Chien, S., & Daniel, J. (2003). Estimation of bus dwell times with automatic passenger counter information. Transportation research record(1841), 120‐127.
Snyder. (2011). Sampling Tests Automatic Passenger Counters. The INSIDElane Blog, from http://www.cumtd.com/the‐inside‐lane/2011/09/26/sampling‐tests‐automatic‐passenger‐counters/
South Coast British Columbia Transit Authority. (2008). Maximum Number of Passengers Guidelines. Standards. Policy and Planning. TransLink.
Tirachini, A. (2011). Bus dwell time: the effect of different fare collection systems, bus floor level and age of passengers. Transportmetrica, DOI:10.1080/18128602.2010.520277, 1‐22.
Transportation Research Board. (2000). Highway Capacity Manual. Washington, DC: National Research Council.
Zografos, K., & Levinson, H. (1986). Passenger service time for a no‐fare bus system. Transportation Research Record(1051), 42‐48.

F a r e P a y m e n t , C r o w d i n g a n d D w e l l T i m e : A f i n e G r a i n e d A n a l y s i s P a g e | 35
APPENDIX 1: EXAMPLE DATA COLLECTION SHEET
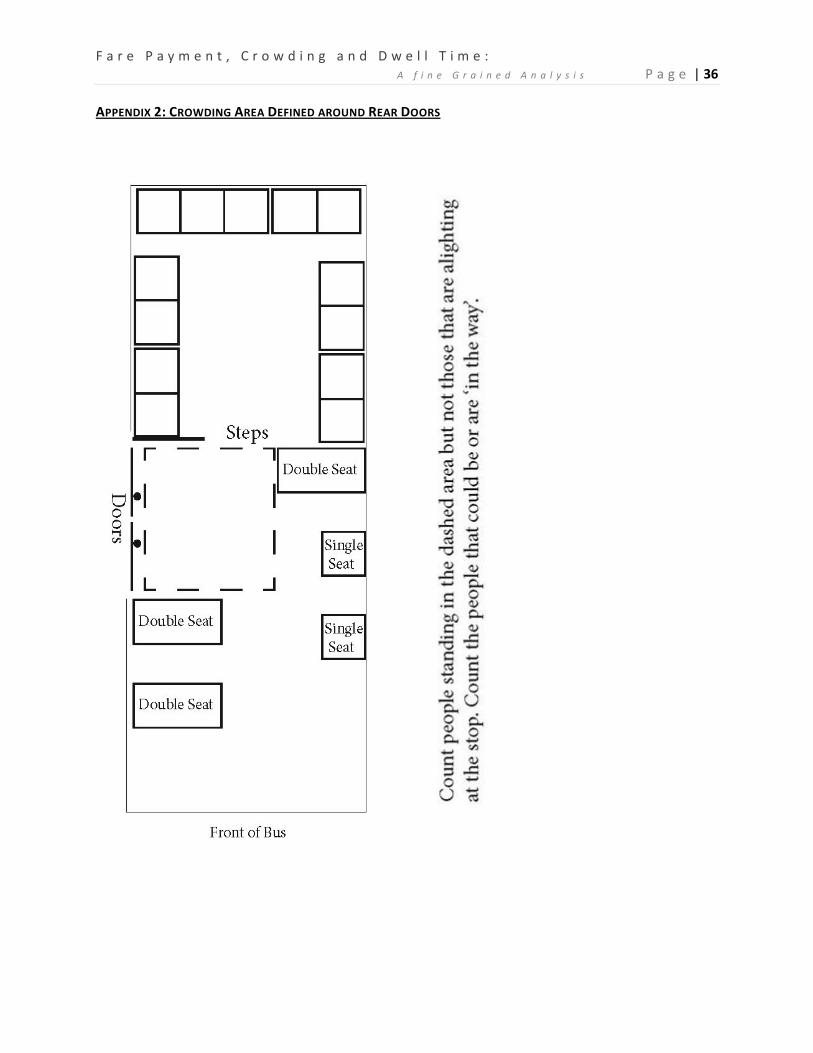
F a r e P a y m e n t , C r o w d i n g a n d D w e l l T i m e : A f i n e G r a i n e d A n a l y s i s P a g e | 36
APPENDIX 2: CROWDING AREA DEFINED AROUND REAR DOORS