THE EFFECTS OF CALCIUM FOR RETENTION CHEMICALS
59
TAMPERE POLYTECHNIC International Pulp and Paper Technology Engineering thesis Ville Henttonen THE EFFECTS OF CALCIUM FOR RETENTION CHEMICALS Thesis supervisor Arto Nikkilä (M.Sc) Commissioning company Kemira Oyj, supervisor Mikko Mäkinen (M.Sc) Tampere 2006
Transcript of THE EFFECTS OF CALCIUM FOR RETENTION CHEMICALS

TAMPERE POLYTECHNIC International Pulp and Paper Technology Engineering thesis Ville Henttonen THE EFFECTS OF CALCIUM FOR RETENTION CHEMICALS Thesis supervisor Arto Nikkilä (M.Sc) Commissioning company Kemira Oyj, supervisor Mikko Mäkinen (M.Sc) Tampere 2006

TAMPERE POLYTECHIC International Pulp and Paper Technology Henttonen, Ville The Effects of Calcium for Retention Chemicals Engineering Thesis 49 pages + 9 appendix pages Thesis Supervisor Arto Nikkilä (MSc) Commissioning Company Kemira Oyj, Supervisor: Mikko Mäkinen (MSc) November 2006 Keywords gypsum, solubility, retention, retention chemical
ABSTRACT
A part of gypsum dissolves, which increases the calcium content of paper machine
wet end. Uncontrolled dissolving can cause a precipitates, runnability problems and
unstable process, which decreases production line profitability and the production
rate.
The idea of doing this work was to study how dissolved calcium in process water
affects to effectiveness of retention chemicals. The aim was to find out how much
dissolved calcium affects to the retention on laboratory circumstances, where
mechanical retention is the dominant retention mechanism.
The work was done by making sheets with laboratory sheet former by using birch
pulp and kaolin. The calcium level was adjusted by means of gypsum. By
measuring the grammage and the ash retention it was possible to study the level of
retention.
Mediocre calcium concentration lowered the retention compared to the zero
calcium level, if cationic retention chemical was used. Anionic retention chemical
did not reacted to changes of calcium concentration. With calcium concentration
close to saturation point, dissolution was incomplete and grammages rose
considerably. By using anionic retention chemical close to saturation point of
calcium, strong electrostatic polymer bridging also increased the grammage.
Higher retention chemical dosage raised the retention in every circumstance.

TAMPEREEN AMMATTIKORKEAKOULU International Pulp and Paper Technology Henttonen, Ville Kalsiumin vaikutus retentiokemikaalin toimivuuteen Insinöörityö 49 sivua + 9 liitesivua Työn valvoja DI Arto Nikkilä Työn teettäjä Kemira Oyj, ohjaaja DI Mikko Mäkinen Marraskuu 2006 Hakusanat kipsi, liukoisuus, retentio, retentiokemikaali
TIIVISTELMÄ
Osa kipsistä liukenee ja liuennut kalsium nostaa paperikoneen märänpään
kalsiumpitoisuutta. Kontrolloimaton liukeneminen voi saada aikaan saostumia,
ajettavuusongelmia ja epävakaan prosessin, jonka seurauksena linjan
tuotannollinen ja taloudellinen kannattavuus kärsii.
Työssä on tutkittu kuinka prosessiveden kalsiumkonsentraatio vaikuttaa
retentiokemikaalin toimivuuteen. Työssä päämääränä oli saada selville, kuinka
paljon prosessiveden kalsiumpitoisuus vaikuttaa laboratorio-olosuhteissa, jossa
mekaaninen retentio on vaikuttavin retentiotyyppi.
Työssä tehtiin laboratoriossa näytearkkeja arkkiformerilla käyttäen koivusellun ja
kaoliinin lisäksi retentiokemikaaleja. Prosessiveden kalsiumpitoisuus säädettiin
liuenneella kipsillä. Retentiotason vaihtelua tutkittiin mittaamalla arkkien
neliömassaa ja tuhkapitoisuutta.
Keskinkertainen prosessiveden kalsiumkonsentraatio alensi retentiota kun
käytettiin kationista retentioainetta. Anioninen retentioaine ei reagoinut
kalsiumkonsentraation vaihteluille. Kalsiumkonsentraation ollessa lähellä
kylläisyyspistettä, liukeneminen oli epätäydellistä ja neliömassat nousivat
huomattavasti. Anionisella retentioaineella polymeerin voimakas elektrostaattinen
siltautuminen nosti retentiota lähellä kalsiumin kylläisyyspistettä. Suurempi
retentioaineannostelu nosti retentiota kaikissa olosuhteissa.

Ville Henttonen ENGINEERING THESIS Paper technology The effects of calcium for retention chemicals
FIRST WORDS
This engineering thesis theoretical part was done during the summer of 2006.
Laboratory measurements were done in Tampere Polytechnic Paper Laboratory
during the fall of 2006.
The thesis supervisor was M.Sc. Arto Nikkilä and the work adviser from Kemira
was M.Sc. Mikko Mäkinen. I would like to thank both of them for the instructions,
opinions and support they gave me.
Also I would like to thank Tampere Polytechic Paper Laboratory`s Laboratory
Master Tiina Kolari-Vuorio for her advises for me. The head of Tampere
Polytechic Paper Technology department Ulla Häggblom-Ahnger deserves all my
respects for making this thesis work possible by creating important contacts for me.
Kemira Oyj I thank for their material they gave for my laboratory tests.
The greatest thank goes for my beloved wife for her support during my studies and
this engineering thesis.
Tampere 13.11.2006
Ville Henttonen

Ville Henttonen ENGINEERING THESIS Paper technology The effects of calcium for retention chemicals
5 (49)
TABLE OF CONTENT
ABSTRACT ....................................................................................................................................2
TIIVISTELMÄ................................................................................................................................3
FIRST WORDS...............................................................................................................................4
TABLE OF CONTENT ..................................................................................................................5
THEORETICAL PART
1 INTRODUCTION...................................................................................................................8
2 SOLUBILITY..........................................................................................................................8
3 ADEQUOUS SOLUTIONS....................................................................................................9
4 IONS......................................................................................................................................10
4.1 Ionic bonds ....................................................................................................................10
4.2 Zeta-potential.................................................................................................................11
5 RETENTION.........................................................................................................................12
5.1 Retention mechanisms...................................................................................................13
5.2 Chemical retention.........................................................................................................13
5.3 Complex flocculation ....................................................................................................14
5.4 Mechanical retention .....................................................................................................16
5.5 Retention chemicals.......................................................................................................16
5.6 Retention types ..............................................................................................................18
5.7 Advantages of a good retention.....................................................................................19
6 GYPSUM ..............................................................................................................................19
6.1 Chemical properties.......................................................................................................20
6.2 Solubility of gypsum .....................................................................................................21
6.3 Utilization for paper industry ........................................................................................23
7 WET END CONDITIONS....................................................................................................24
7.1 Cationic demand ............................................................................................................24
7.2 Cationic demand in the water phase and in the solid material ......................................25
7.3 Calcium concentration...................................................................................................25
7.4 Controlling the paper machine water chemistry............................................................26
7.4.1 On-line parametres and measuring .............................................................................26

Ville Henttonen ENGINEERING THESIS Paper technology The effects of calcium for retention chemicals
6 (49)
EXPERIMENTAL PART
8 GENERAL ............................................................................................................................29
9 USED MATERIALS.............................................................................................................29
9.1 Pulp................................................................................................................................29
9.2 Kaolin and gypsum........................................................................................................30
9.3 Retention chemicals.......................................................................................................30
10 USED METHODS FOR SHEET MAKING.........................................................................31
10.1 Beating...........................................................................................................................31
10.2 Kaolin slurry ..................................................................................................................32
10.3 Calcium containing water..............................................................................................33
10.4 Sheet making .................................................................................................................34
10.5 Pressing and drying .......................................................................................................35
11 USED METHODS FOR PULP AND SHEET MEASURING.............................................36
11.1 Canadian Standard Freeness..........................................................................................36
11.2 Grammage .....................................................................................................................37
11.3 Ash content ....................................................................................................................37
12 THE RESULTS AND ANALYSES .....................................................................................38
12.1 Canadian Standard Freeness..........................................................................................38
12.2 Grammage measuring results ........................................................................................39
12.3 Ash content ....................................................................................................................43
13 CONCLUSIONS ...................................................................................................................45
13.1 General ..........................................................................................................................45
13.2 Possible variations .........................................................................................................46
LIST OF REFERENCES ..............................................................................................................48
LIST OF APPENDICES
1 LABORATORY RESULTS OF GRAMMAGE MEASURING
2 LABORATORY RESULTS OF ASH TESTS
3 CATIONIC RETENTION CHEMICAL INSTRUCTIONS
4 ANIONIC RETENTION CHEMICAL INSTRUCTIONS
5 KAOLIN DESCRIBTION
6 RETENTION CHEMICAL DOSING CALCULATIONS

Ville Henttonen ENGINEERING THESIS Paper technology The effects of calcium for retention chemicals
7 (49)
THEORETICAL PART

Ville Henttonen ENGINEERING THESIS Paper technology The effects of calcium for retention chemicals
8 (49)
1 INTRODUCTION
Stability of paper machine wet end chemistry is usually the priority number one for
achieving high level of quality, runnability and cost efficiency. To prevent
fluctuations of the critical process parameters, the control and automation system
of paper machine has to work flawlessly. The water system has to be clean and raw
material flow must be even for avoiding fluctuations. Constant pH and temperature
keeps the system stable and clean and prevents appearance of problems such as
precipitates, slime and growth of bacteria. Stability of wet end can be defined by
measuring the conductivity of white water. It indicates the peaks in content of
dissolved salts. Growth of solubility is usually the result from variation in pH or
temperature. Growth in solubility changes gradually the cationic demand of wet
end. Cationic demand indicates the content of anionic material in the system.
Negatively charged anionic material comes mainly from fibers, fillers and coated
broke. A part of gypsum dissolves in every conditions and it is the biggest reason
why gypsum is not very popular pigment although gypsum has some advantageous
properties compared to other pigments. Dissolving gypsum creates cationic
calcium ions Ca 2+. The result is lower cationic demand, because free calcium ions
are attracting anionic material in the process water.
Retention chemicals are used to improve the level of retention. Retention chemical
can be cationic or anionic. Also combination system of these two chemical types is
used. Retention chemicals are attracting and bonding the opposite charged material.
Cationic retention chemical has to compete with calcium ions to attach with
anionic material like fibers.
2 SOLUBILITY
Dissolving happens when individual molecules or ions are attracted to water
molecules. Molecules or ions break away and solid dissolves. Solid can dissolve to

Ville Henttonen ENGINEERING THESIS Paper technology The effects of calcium for retention chemicals
9 (49)
a certain limit. When the solvent has dissolved all the solute it can, some amount of
undissolved solute remains. In this point a solution is saturated. Substances molar
concentration in a saturated solution is called molar solubility.
Solid continues dissolving after the saturation point is exceeded, but the
concentration remains the same in spite of dissolving. Exactly the same rate at
which dissolves to the solution returns to the solid form. In this point dissolved and
undissolved solutions are in dynamic equilibrium. /7, s. 439./
Water contains molecules which has a dipole nature. It means that molecules one
end is positively and the other end negatively charged. The water molecules are
able to break down the crystal lattice of ionic compounds. The positively charged
end can attach itself to the anion and pull it away from the substance. Similarly
negatively charged end can attract away a cation. This means that the substance
dissolves. /6, s. 51./ Water is a polar liquid and it is the best solvent for ionic and
polar compounds. Compound, which has hydrophilic groups, dissolve to water.
Large particles (20-100 µm) in solutions are called colloids. /7, s. 442, 443./
3 ADEQUOUS SOLUTIONS
A solute can be present as ions or as molecules. If solution contains ions, it
conducts electricity and it is called electrolyte solution. /6, s.82./ If solute is present
entirely as ions, solute is called a strong electrolyte solution. If some molecules
survive, solute is called a weak electrolyte solution. When ion moves in solution, it
has some amount of water molecules surrounding it. This means that the ions are
hydrated. The coating of water molecules keeps ions in solutions and prevents
reformation to solid. /6, s.83./
When two electrolyte solutions are mixed, a precipitation reaction occurs. It means
that an insoluble solid product is formed during the reaction. /6, s.85./ Precipitate

Ville Henttonen ENGINEERING THESIS Paper technology The effects of calcium for retention chemicals
10 (49)
occurs, when the solubility equilibria of certain salt is exceeded. Variation of
temperature or pH changes solubility equilibria and precipitation happens easily.
When the crystal is once formed, it grows increasingly. /9./
Picture 1 Growth of slime in paper machine /9/
By keeping the water system clean and process as stable as possible, undesired
appearance of precipitations and slime (picture 1) can be avoided. Understanding
the chemistry of paper machine wet end is vital in nowadays complicated water
systems.
4 IONS
Ion is an electrically charged atom or group of atoms. A positively charged ion is
called cation and negatively charged is called anion. /6, s.B13, B5, B2./
4.1 Ionic bonds
The attraction between the opposite charged of anions and cations is called an ionic
bond. /7, s.268./ Molecules which contains more than three electrons in the outer
shell, tends to be non-ionic. /6, s.52./

Ville Henttonen ENGINEERING THESIS Paper technology The effects of calcium for retention chemicals
11 (49)
Cations are smaller, because the atom loses one or more electrons to form the
cation. Reciprocally anions are larger, because they receive electrons to their
valence shell. When atoms and ions have the same number of electrons they are
called isoelectronic. Ions can have the same electron configuration, but their radii
differ because of different nuclear charges. Therefore ions with similar electron
configuration can have different intensity in attraction. Smaller radius means that,
the nuclear has stronger attraction for its electrons. /6, s.251./
4.2 Zeta-potential
In paper making fibers and most of fillers usually receives a negative charge when
they are added to water. The charge creates in to the surface of a solid material so
called electrical double charge (picture 2). The first layer between the particle and
water is called Sterns layer, which is a stable cationic layer. This layer tends to
even the charge difference between the particle and the second layer. The second
layer is called diffusion layer, which is more anionic and it evens the difference of
a charge between the Sterns layer and the water. The potential of this system is
called the zeta-potential. Fibers and fillers containing water have usually potential
between -10 to -30 mV. /9./
Picture 2 Illustration of Zeta-potential of a particle

Ville Henttonen ENGINEERING THESIS Paper technology The effects of calcium for retention chemicals
12 (49)
5 RETENTION
Retention indicates the amount of furnish, which stays in the wire after it is
pumped from headbox. Retention can be calculated from following formula:
Total retention = (headbox consistency – white water consistency / headbox
consistency) x 100% (1)
The same formula (formula 1) can be used when calculating ash retention.
Consistency values must be changed with corresponding ash values. Other
retentions which can be defined are fiber and size retentions. Maximum retention is
not usually the target. More important is to reach a level, where sufficient retention
of fines and fillers is achieved without losing a good level of important things such
as formation, water removal and retention chemical dosage. / 5, s.149./
In laboratory circumstance filler retention is rather low and the filler distribution
differs from paper machine circumstance (picture 3). /8, s.48./
Picture 3 Difference of fines distribution between laboratory sheets and paper
machine /8, s. 46/
Picture 3 shows, that fiber orientation with laboratory sheet former is a minor. With
conventional Fourdrinier machine wire side has more fiber orientation but fines
content on upper side is bigger. Fines content with laboratory sheet former is

Ville Henttonen ENGINEERING THESIS Paper technology The effects of calcium for retention chemicals
13 (49)
opposite compared to Fourdrinier machine. Increasing fines content on the wire
side explains why filler retention with sheet former is low. Fillers pass through
wire more easily and unequal distribution to fiber mat lowers ash retention.
5.1 Retention mechanisms
Retention is divided into two types of retentions: chemical and mechanical
retention. Chemical retention is located on the initial water removal process nearby
headbox. Small particles such as fines and fillers are bonded to bigger particles by
means of retention chemicals. Control of chemical retention is very important,
because retention chemicals are very expensive and the disturbances in retention
can cause very serious problems in production. / 5, s.149, 150./
Existing literature has established terminology for different retention mechanism.
Usual terms are:
- charge neutralization,
- coagulation,
- patching,
- bridging,
- complex flocculation and
- network flocculation.
Flocculation and aggregation are the most important mechanisms. Remarkable part
of furnish components are too small to mechanically retain on the wire. /4, s.43,
45./
5.2 Chemical retention
The basis of chemical retention is that small filler particles are bonded to bigger
aggregates by means of retention chemical dosage. A chemical retention process is

Ville Henttonen ENGINEERING THESIS Paper technology The effects of calcium for retention chemicals
14 (49)
generally described with two basic mechanisms: patching and bridging. In patching
process a short chain polymer is adsorbed to the surface of a particle. Particles the
electrical double layer changes its charge and the particle create an attraction with
the other particle. Bridging is that the long polymer chains are attached to the
surface of the particles. By means of bridging is possible to achieve high level of
retention in spite of high z-potential. /9./
5.3 Complex flocculation
Complex flocculation mechanisms are:
- Dual polymer flocculation
- Nano and micro particle flocculation
- “Network” flocculation
- Site blocking enhanced bridging flocculation.
Dual polymer systems (picture 4) are based to adding an anionic and a cationic
polymers. Cationic polymers can be polyethyleneimine, poly-DADMAC or either
cationic starch. Anionic polymer is a polyacrylamide. To flocculate anionic fibers
and fillers, the cationic polymer is added first. The anionic polymer is added after
shear stage to form new flocs by bridging.
Picture 4 Illustration of a dual polymer system /4/

Ville Henttonen ENGINEERING THESIS Paper technology The effects of calcium for retention chemicals
15 (49)
In the nano- and microparticle systems (picture 5) a cationic polymer is combined
with an anionic particle. In some cases occurs a combination of dual polymer
systems and nanoparticle mechanisms.
Picture 5 The principle of microparticle system /4/
The network flocculation system (complex bridging mechanism) is based on
hydrogen bonding (picture 6). Systems, which are based on phenolic resin and
polyethyleneoxide or montmorillonite and anionic polyacrylamide, are typical for
network flocculation. The latter theory is that the hydrogen bonding combines with
an electrostatic bridging, comprising Ca2+ ions.
Picture 6 The principle of complex bridging mechanism /4/

Ville Henttonen ENGINEERING THESIS Paper technology The effects of calcium for retention chemicals
16 (49)
To improve bridging more favorable polymer conformation, site blocking agent
(SBA) is used in some special cases of complex flocculation. The SBA is usually
low molecular weight and highly cationic polymer. /4, s.52, 53, 54, 55./
5.4 Mechanical retention
The other retention type is a mechanical retention. It is based on particles attaching
to the web. With long fibers mechanical retention is good, but with small fillers it is
much worse. Mechanical retention plays bigger role in the end of wire section,
where the web is already filtered.
5.5 Retention chemicals
In the early days, alum was common retention chemical, which neutralizes the
charges of furnish components. Single polymers like PEI were introduced later
with patching as the dominant mechanism. The major mechanism – bridging – is
attained with single and dual polymer systems. In the early of 1980s micro and
nano particle systems were introduced to the markets. Latest development has been
organic micro particle systems. Systems are based on network flocculation
mechanism with PEO and phenolic resin. /4, s.43./
Retention polymers are positively or negatively charged (polyelectrolytes) and they
act as:
- flocculants,
- anionic trash catchers,
- wet-strength agents and
- dry-strength additives.
Synthetic polymers are covalently bonded monomers, which are synthesized to
homopolymers, block copolymers, or heteropolymers by condensation or free

Ville Henttonen ENGINEERING THESIS Paper technology The effects of calcium for retention chemicals
17 (49)
radical reactions. Polymers can be characterized by the ratio, the weight and
number average of the molecular weights. Polymers in liquids are characterized by
the average radius of gyration and the average end-to-end distance (picture 7).
Under theta conditions can be polymers dissolved in liquids characterized, because
there is exact cancellation between steric repulsion and van der Waals` attraction
between monomers. /4, s.48./
Picture 7 Illustration of the gyration of the polymer, where RG illustrates the
average radius of gyration and RIN the average end-to-end distance /4, s.48/
Polyelectrolyte will adsorb strongly an opposite charged surface under moderate
ionic strengths. Because of extensive contact, polymer can not be removed by
rinsing. Instead too high salt concentration decreases electrostatic interactions and
affects to the adsorption behavior. Nonelectrostatic interactions affects also to the
behavior of polyelectrolyte at a surface. Under electrostatic conditions, there is a
maximum adsorption with increasing electrolyte content. /4, s.49./
Overdosing of retention chemicals can lead to too positive charge of the system.
Too positive charge of the wet end affects problems such as precipitates, holes,
poor filtering and formation. Too low dosing can lead to poor functioning of
retention system. /5, s.152./

Ville Henttonen ENGINEERING THESIS Paper technology The effects of calcium for retention chemicals
18 (49)
5.6 Retention types
There are three types of retention parameters, which are common:
- first-pass retention,
- machine retention and
- system retention. /4, s.69./
First-pass retention (FPR) (picture 8) is a very common retention parameter.
Functionality of chemicals is better if first-pass retention is high. Circulating in the
wet end makes additives less effective. Better FPR means better runnability,
because it prevents deposits and growth of bacteria. Higher FPR means
automatically higher degree of efficiency. High first-pass retention is favorable, but
too extensive flocculation sets limits for it. Too extensive flocculation can cause
inferior formation. /4, s.70./
Picture 8 An illustration of the first-pass retention with the cap former /9/
First-pass retention affects directly to the machine retention. High FPR decreases
work load of internal separation, whereas internal separation such as disc filters and
flotation units determines the efficiency of machine retention. Unretained
chemicals and fines can be detrimental for the system causing problems such as
deposits and unnecessary refining, which are harmful for dewatering. /4, s.71./
System retention means all material leaving the process. Both FPR and machine
retention has an influence to system retention. Good degree of system retention is

Ville Henttonen ENGINEERING THESIS Paper technology The effects of calcium for retention chemicals
19 (49)
necessary for achieving optimum raw material use and cost-efficient manufacture
process. /4, s.71./
5.7 Advantages of a good retention
Higher retention can be achieved for example with higher headbox consistency,
lower freeness, slower machine speed and with bigger retention chemical dosage.
/5, s.150./ The advantages of a good retention are better quality, better productivity
and higher cost-effectiveness. Better retention means better symmetry for fillers in
the paper. Because of smaller consumption of additives and cleaner wet end,
runnability is better. Cleaner wet end means less washing, so consumption of fresh
water and amount of effluent is smaller. Water removal is better and thus the
consistency of headbox can be lower. It means better formation and stronger paper.
Better water removal means also lower steam consumption in drying section. /5,
s.153, 154./
6 GYPSUM
Gypsum consists of calcium sulfate, which is a neutral and environmentally safe
salt. /2, s.2./ Gypsum is a natural product found in sediments and the estimated
resources are approximately 2200 Mt. It is also a by-product of industrial
processes. There are three significant industrial production processes:
- phosphoric acid,
- titanium dioxide,
- citric acid and
- hydrofluoric acid.
These altogether produces gypsum annually 150 Mt as a by-product.

Ville Henttonen ENGINEERING THESIS Paper technology The effects of calcium for retention chemicals
20 (49)
Third source of gypsum is flue gas desulphurization. FGD gypsum is a flue gas
purification process, where sulfur is bound to calcium: /1, s.153./
SO2 + ½ O2 + CaO + 2H2O = Ca SO4 × 2H2O
/2, s.3./
Annual production is approximately 30 Mt and it keeps growing because of stricter
environmental regulations. /1, s.153./
6.1 Chemical properties
Calcium sulfate can appear in three different crystal water forms. Every form has
its unique physical properties. When calcium sulfate is heated, it undergoes a
following conversion process:
- Dihydrate to hemihydrate,
CaSO4 × 2H2O => CaSO4 × ½H2O + 1 ½ H2O
- Hemihydrate to anhydrite,
CaSO4 × ½H2O => CaSO4 + ½ H2O
- Finally, anhydrite decomposes to calcium oxide and sulfur
dioxide,
CaSO4 => CaO + SO4 + ½ O2
Anhydrite is also known as calcinated gypsum. Crystal water in dihydrate is very
easily bounded and it starts to release its crystal water already in 45 °C, if the
humidity of ambient air is low. If the heating is still increasing, hemihydrate will
go trough conversion to anhydrite. The opposite conversion process from
hemihydrate to dihydrate happens also very easily.
The most known utilization of gypsum is based on hardening. First dihydrate is
calcinated to hemihydrate and then slurred into water. Hemihydrate binds crystal
water and crystallizes into dihydrate.

Ville Henttonen ENGINEERING THESIS Paper technology The effects of calcium for retention chemicals
21 (49)
Coating pigments are dihydrate gypsum, because it is stable and it`s properties are
highly suitable for coating. Dihydrate cannot bind any more crystal water and
slurries do not harden. /1, s.154./
6.2 Solubility of gypsum
Gypsum dissolves in water (formula 2) and forms cationic Ca²+ ions.
CaSO4 → Ca²+ + SO4²-
(2)
The solubility of gypsum is basically constant regardless of pH operating area
(figure 1). Gypsum has almost equal calcium load with calcium carbonate in the
area of pseudoneutral pH.
Figure 1 Solubility of gypsum depending on pH /9/
Gypsum does not release gases when decomposed which is great advantage
compared to calcium carbonate. Temperature dependency is also rather low (figure
2). Solution of saturated gypsum contains about 2.1 g/L of CaSO4 and 580 mg/L as
a calcium concentration. Amount of dissolved is larger than with other pigments,
which is the biggest reason why gypsum is not very popular paper pigment. /1,
s.155; 1./

Ville Henttonen ENGINEERING THESIS Paper technology The effects of calcium for retention chemicals
22 (49)
Figure 2 Solubility in different temperatures /9/
Calcium concentration of circulation water rises close to the level of 580 mg/L if
gypsum used as filler. If gypsum is used as coating pigment, calcium ends to water
circulation through broke. In that case concentration is between 200 – 400 mg/L
with printing papers. With cardboard it is much less and gypsum does not
precipitate. /1, s.163./
Nowadays paper machines are running with higher calcium concentration because
of closed circulations. Dissolving gypsum does not influence on pH and the risk of
precipitation is bigger with changes of pH than with saturated gypsum solution
(figure 3). The process is not susceptible to gypsum broke, if the retention level is
good and the flocculating anionic material is bound to paper web. /1, s.164./
Figure 3 The effects of pH and calcium for pitch deposits /1, s. 163/

Ville Henttonen ENGINEERING THESIS Paper technology The effects of calcium for retention chemicals
23 (49)
6.3 Utilization for paper industry
Gypsum has a high brightness, opacity and printability compared to conventional
pigments. A low density makes possible to produce light paper grades and have
high filler content. /14./
Industrially produced gypsum contains harmful impurities and therefore utilization
is often limited. Natural gypsums (picture 9) brightness is often modest, but those
do not contain harmful impurities. Also FGD gypsum is quite gray, but their
brightness can be controlled by choosing the most suitable processes and raw
materials.
Gypsum produced from sedimentary phosphate rock color is gray or brown. It is a
bit radioactive and it contains heavy metals. Instead gypsum produced from
magmatic phosphate rock is pure, white and it is very suitable for raw material of
pigment gypsum. /1, s.153./
Picture 9 Microscope picture of a natural gypsum /9/
The most remarkable manufacture countries of gypsum are Spain, Italy, France,
England, Germany, Finland and Brazil. Spain has the longest tradition of producing
gypsum for paper industry. Spanish gypsum is manufactured from natural gypsum.

Ville Henttonen ENGINEERING THESIS Paper technology The effects of calcium for retention chemicals
24 (49)
By-product gypsum manufacturing countries are for example Italy (titanium
gypsum), Brazil and Finland. Brazil and Finland are producing phosphogypsum. /1,
s.153; 9./
Finland is the only country, which produce gypsum for paper coating. Kemira
production plant in Siilinjärvi has produced phosphogypsum since 1985. Kemira
produce phosphoric acid by using apatite. Pigment is very white and its heavy
metal content is low. Annual production of coating pigment is about 150 000 tons.
/10; 1. s.157./
7 WET END CONDITIONS
7.1 Cationic demand
Cationic demand describes the total amount of available negative charges in furnish
or in specific fraction. It indicates the amount of cationic charge, which is required
to reach zero electro kinetic charge. It is expressed as mg/L liquid or mg/g solid.
The cationic demand is necessary for the adsorption of the cationic additives. If the
polymer fails to compete with the counter-ions of furnish, the cationic demand is
strongly reduced. The cationic demand of fibers comes mainly from dissociated
carboxylic groups. /4, s.47, 48./ The cationic demand increases along with pH,
because carboxylic groups become more dissociated. When the electrokinetic
charge goes down to zero, the adsorption of the cationic polymer is reduced. If the
addition of cationic polymers is continued after zero level, it will lead to charge
reveal and later to imbalances in the wet end. /4, s.47, 48./

Ville Henttonen ENGINEERING THESIS Paper technology The effects of calcium for retention chemicals
25 (49)
7.2 Cationic demand in the water phase and in the solid material
Increased cationic demand of the system is the results of dissolved polymers and
colloidal anionic material. This “anionic trash” comes from wood (pitch,
carbohydrates) and from coating broke. Good knowledge of the cationic demand is
very important for controlling the wet end chemistry.
Cationic demand can be divided to two categories: cationic demand in the water
phase and cationic demand of solid material. Cationic demand in the water phase
has a negative side, because it reduces the adsorption and functionality of cationic
polymers. Instead of that, cationic demand in the water phase has also very
advantageous side since it enables adding a high amount of cationic compounds
such as starch and wet-strength resins. /4, s.56./
7.3 Calcium concentration
Calcium ion is a polyvalent ion and its valency number is 2. It has given two
electrons away from its third shell, which creates a positive charge. It is strongly
attracted by the carboxylic groups of fibers. The cationic polymer has to compete
with calcium ions in order to be adsorbed and therefore it is necessary to add the
cationic polymers successfully. /4, s.47, 48./
Decomposition of calcium containing substances increases the calcium ion
concentration in aqueous phase. Calcium forms precipitates with anions such as
oxalate and sulfate. It also forms very tacky soaps with fatty acids. Foam is build
up when carbon dioxide is formed. /4, s.209./

Ville Henttonen ENGINEERING THESIS Paper technology The effects of calcium for retention chemicals
26 (49)
7.4 Controlling the paper machine water chemistry
Closing the white water system increases the amount of detrimental substances.
Fluctuations of pH and temperature in a closed circulation system lead to web
breaks and quality problems more easily than in open system. Therefore it is
necessary to use high quality controlling and monitoring system to ensure a stable
process conditions. /4, s.213./
For controlling effectively the white water system, continuously operating
measurements techniques are essential. Collected data from the process must be
handled with computer based systems. The process analyzes system converts the
data from process into information for operator. /4, s.215./
7.4.1 On-line parametres and measuring
Following on-line parameters are essential for successful wet end controlling:
- retention
- pH
- conductivity
- charge
- calcium concentration
- chemical oxygen demand and total organic carbon concentration
- temperature
These on-line parameters are very useful for controlling and observing the behavior
of pigment dissolving. Retention control measures white water and head box
consistencies. Consistency does not necessarily correlate with the concentration of
dissolved colloidal substances. Almost all chemical reactions in the water phase are
affected by pH level. The solubility of dissolved and colloidal substances increases

Ville Henttonen ENGINEERING THESIS Paper technology The effects of calcium for retention chemicals
27 (49)
when pH fluctuates. PH is the most important parameter that can be measured
continuously and it is logarithmic value of the molar hydrogen ion concentration.
The conductivity measurement is very sensitive for small variations in
conductivity. Measuring the conductivity gives rough picture of the total
concentration of electrolytes in the aqueous phase. Particle in water has a certain
charge and it has a strong influence on its behavior. The most common way to
measure a charge is a titration. A sample is titrated with the opposite charged
standard polymer. On-line equipments for measuring calcium ion concentration are
X-ray, spectrophotometer or titrator. The most common and convenient is the X-
ray.
The chemical oxygen demand (COD) and the total organic carbon (TOC)
concentration indicate the amount of dissolved organic material in the water phase.
The temperature has an effect to many reactions in the water phase. Solubility,
dewatering speed and precipitation is the most important ones. /4, s.216, 219./

Ville Henttonen ENGINEERING THESIS Paper technology The effects of calcium for retention chemicals
28 (49)
EXPERIMENTAL PART

Ville Henttonen ENGINEERING THESIS Paper technology The effects of calcium for retention chemicals
29 (49)
8 GENERAL
In the experimental part was focused to study in laboratory how the level of
retention varies, when variables are the retention chemical dosage and the calcium
concentration. Tests were done by making test sheets with sheet former and
defining grammages and ash retentions of sheets. The test conditions were studied
and adjusted by measuring the pH and temperature. The pH level was also
confirmed from Tampere water plant and it was approximately 7.5. Temperature of
used water was adjusted to 22 ºC.
Two retention chemicals were used: anionic and cationic. The retention chemical
dosage points were the minimum and the maximum dosage points. These dosage
points were mentioned in the retention chemicals directions (appendices 3, 4). The
calcium concentration points were 0 parts per million (ppm), 200 ppm, 400 ppm
and 580 ppm, which is the level of saturation. Calcium concentrations were
adjusted with dissolved dihydrate gypsum. The number of made sheets was ten in
every calcium concentration level with both anionic and cationic retention
chemical in minimum and maximum dosage points. Also ten test samples were
made without using calcium slurry or any retention chemical.
After pressing and drying sheets grammages were measured and ash retentions
were studied.
9 USED MATERIALS
9.1 Pulp
The used pulp was dried and bleached sulphate birch cellulose. The fiber length of
a birch pulp is between 0.9 – 1.2 mm and the diameter 22 µm. /5, s.31./ Pulp

Ville Henttonen ENGINEERING THESIS Paper technology The effects of calcium for retention chemicals
30 (49)
batches were in refrigerator between the tests to ensure that pulp quality remains
the same and deteriorating does not occur. Bleached cellulose pulps can usually be
storage for significantly longer times than for example mechanically made
unbleached pulps / 8, s.40/. In the tests the maximum storage duration was 3 days.
9.2 Kaolin and gypsum
Kaolin in the tests was Intrafill C manufactured by Imerys. Intrafill C is an English
filler clay and its particle size distribution is following:
← 1 µm 36%
← 2 µm 55%
/appendix 5/
Kaolin was the most suitable filler pigment for the tests, because it is an insoluble
and does not decompose in ash making tests. Used gypsum was Kemiras dihydrate
gypsum manufactured in Siilinjärvi. The dry content of the gypsum slurry was
68%.
9.3 Retention chemicals
The cationic retention chemical was Fennopol K 7400 R and the anionic retention
chemical Fennopol A 3050 R manufactured by Kemira. Both are used to improve
paper machines fiber and ash retention.
The chemical structure of both chemicals is polyacrylamide, which is a copolymer
of acrylamide and natriumacrylate. It is used to separate a solid material from
liquid material. /12; appendix 3, 4./

Ville Henttonen ENGINEERING THESIS Paper technology The effects of calcium for retention chemicals
31 (49)
States of chemicals were solid and before usage both chemicals had to prepare.
First 0.3 % storage solutions were prepared by mixing 3 g of solid chemical to one
liter of water. Then the dosing solution was prepared by diluting the storage
solution with nine liters of water. All these were done with mixer.
The dosage amounts were mentioned in the chemicals instructions. The minimum
dosage is 100 g per ton of paper and the maximum dosage is 500 g per ton. The
dosage for one sheet was calculated by making test sheets and measuring
grammages. The minimum dosage was 0.56 ml per sheet and the maximum dosage
was 2.8 ml. /appendix 6./
10 USED METHODS FOR SHEET MAKING
10.1 Beating
Before making the sheets, 360 g of dried cellulose pulp was ripped to flakes and
wetted over night in 5 liters of water. Before the beating, stock was diluted with 18
liters of water. The beating was done with hollander Valley beating machine
manufactured by Ab Lorentzen & Wettre (picture 10).
Picture 10 Lorentzen & Wettre hollander Valley beater
Ville Henttonen ENGINEERING THESIS Paper technology The effects of calcium for retention chemicals
32 (49)
In the beating process, primary wall of fibers is mainly removed. External and
internal fibrillation occurs and also fiber breakage is remarkable with Valley beater.
/8, s.43./
Valley beater has a bladed cylinder, which rotates against the counter blades and
beats the stock. Pulp was slushed first 20 minutes without any weights and then
refined 15 minutes with weights, which gives the needed pressure for the beating
blades. Short beating duration ensured that the amount of organic material was as
low as possible. Also high Canadian Standard Freeness (CSF) was reasonable to
aim for, because it means quick wire passing and therefore low mechanical
retention. From the beaten stock 2.4 liters was taken with 1.2 liter measure and
every 1.2 liter batch were numbered for the CSF tests. 2.4 liter of beat stock was
diluted with 16.4 liters of water to reach a consistency of 2 g/L for sheet making.
One batch for sheet making consisted 18.8 liter of stock in consistency of 2 g/L.
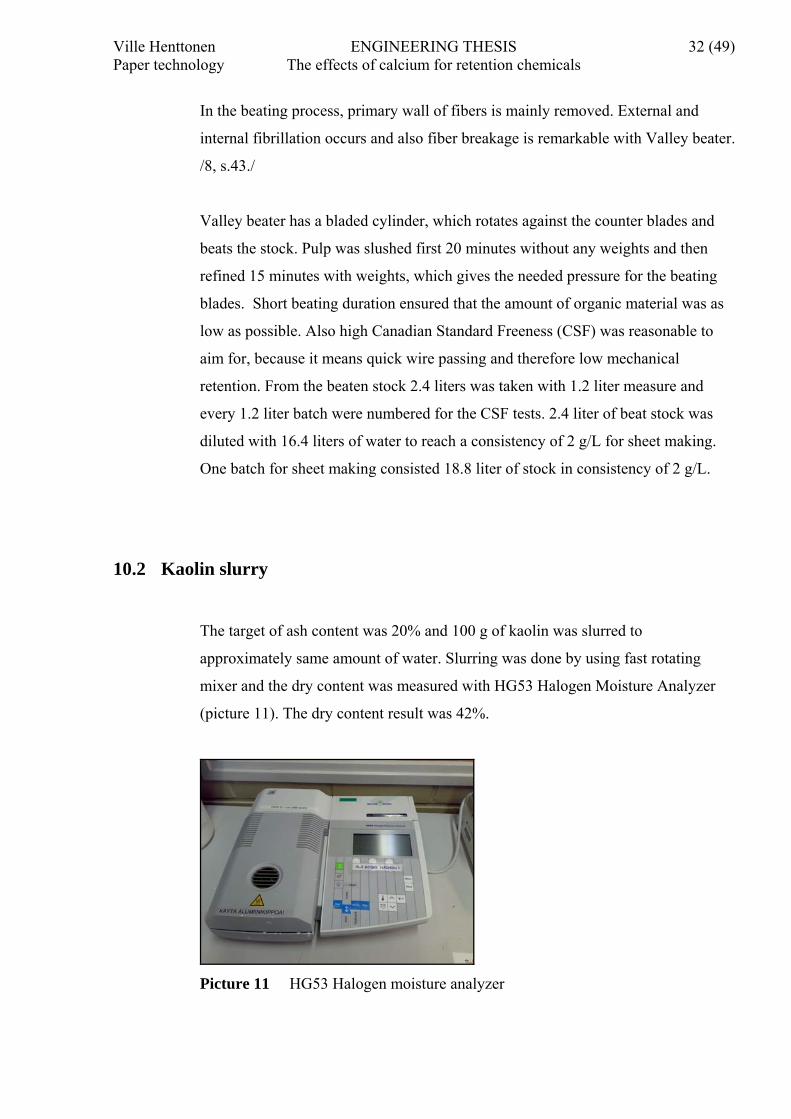
10.2 Kaolin slurry
The target of ash content was 20% and 100 g of kaolin was slurred to
approximately same amount of water. Slurring was done by using fast rotating
mixer and the dry content was measured with HG53 Halogen Moisture Analyzer
(picture 11). The dry content result was 42%.
Picture 11 HG53 Halogen moisture analyzer

Ville Henttonen ENGINEERING THESIS Paper technology The effects of calcium for retention chemicals
33 (49)
For measuring CSF one liter of stock was needed and the amount of the stock was
17.8 liters after measuring CSF. The fiber consistency was 2g/L, so one stock
portion consisted approximately 35.6 g of fiber. The needed amount for 17.8 liters
of stock was 21 g of kaolin slurry to achieve decided 20 % ash content.
10.3 Calcium containing water
Whole capacity of sheet former was 20.48 liters and it was divided from the middle
with wire. Capacity of the upper part of sheet former, which was filled with
calcium containing water, was 9.5 liters. The calcium containing water does not
mix much with the lower part water. Gypsum was slurred to the amount of water,
which is enough to dissolve whole used amount of gypsum (table 1).
Table 1 Amount of used gypsum and water to dissolve the gypsum
Material 200 ppm 400 ppm 580 ppm gypsum, gramme (dc 68%) 10,12 20,24 29,34 water, liters 3,3 6,6 8,7
The needed quantity of slurred gypsum was calculated with 2.1 g/L, which is the
solubility of gypsum mentioned in literature. Table 15 shows that slurred gypsum
for achieving the calcium content of 580 ppm was 29.34 g and water amount was
8.7 liters. This amount of gypsum does not dissolve completely to 8.7 liters water,
but during sheet making 0.8 liter of stock was added to reach 9.5 liters, which is the
capacity of sheet former upper part.
Gypsum was slurred with fast rotating mixer and the dissolving times were
between 3-5 minutes to ensure complete dissolving.

Ville Henttonen ENGINEERING THESIS Paper technology The effects of calcium for retention chemicals
34 (49)
10.4 Sheet making
The sheet former (picture 12) was filled entirely with water when making sheets in
calcium concentration of 0 ppm. With calcium concentration of 200, 400 and 580
ppm the sheet former was filled up to the wire level with water and calcium
containing water solution was decanted on the top. The amount of stock was 0.8
liter and it was decanted before adding retention chemical with the dropper.
Picture 12 Conventional Oy Fermeca AB sheet former
To ensure competition between retention chemical and free calcium ions, it was
reasonable to add the used components in the mentioned order.
Sheet formers yarn number of wire was 3 * 26.0 / 27.0 cm and size of free holes
were 0.15 * 0.21 mm. The mixing of stock is done by putting air pressure on,
which blows air into a stock. After mixing bottom valve is opened and stock filtrate
trough the wire. Removal of water generates approximately 8.0 kPa pressure
difference. The extra water is removed by pressing blotters against fiber mat.
The formation consistency is significantly lower than in paper machine by resulting
very good level of formation. The forming process differs also that

Ville Henttonen ENGINEERING THESIS Paper technology The effects of calcium for retention chemicals
35 (49)
orientation does not occur and laboratory sheets are basically isotropic. /8, s.48/
10.5 Pressing and drying
Sheets pressing was done with AB Lorentzen & Wettre Sheet Press (picture 13).
The machine generates needed pressure with hydraulic cylinder which presses
down the metallic plate against pile of fiber mats and blotters.
Picture 13 L&W Sheet Press machine
Pressing process has two phases. Duration of first pressing phase was 4 minutes
and the pressure was 0.5 Mpa. The second phase takes 2 minutes and pressure is
the same than in the first stage. Wet fiber mats were put to the pressing machine
between blotters.
Final sheet making process was drying with Oy E.Sarlin AB drying drum (picture
14). The drying temperature was 90 °C. Sheets were put against hot drying cylinder
between two blotters and drying duration was 4 hours.
Ville Henttonen ENGINEERING THESIS Paper technology The effects of calcium for retention chemicals
36 (49)
Picture 14 Oy E.Sarlin AB drying cylinder
11 USED METHODS FOR PULP AND SHEET MEASURING
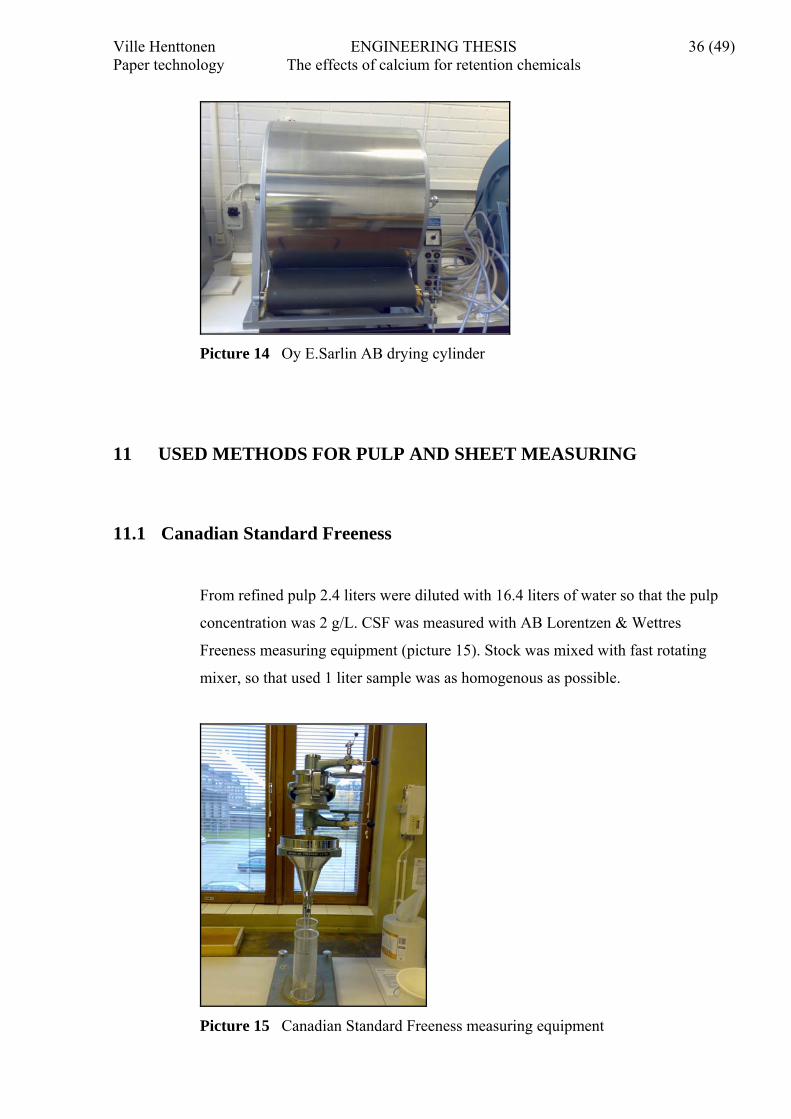
11.1 Canadian Standard Freeness
From refined pulp 2.4 liters were diluted with 16.4 liters of water so that the pulp
concentration was 2 g/L. CSF was measured with AB Lorentzen & Wettres
Freeness measuring equipment (picture 15). Stock was mixed with fast rotating
mixer, so that used 1 liter sample was as homogenous as possible.
Picture 15 Canadian Standard Freeness measuring equipment

Ville Henttonen ENGINEERING THESIS Paper technology The effects of calcium for retention chemicals
37 (49)
Standard CSF measurement consistency for stock is 3 g/L. /12, s. 44/
Measurements for this thesis work was done in consistency of 2 g/L, which was the
consistency of prepared stock for sheet making. More important was to follow that
drainability level remained the same during the tests.
11.2 Grammage
Grammages were measured by cutting from the sheets 100 cm2 samples. Sample
weight was measured and the results were multiplied with 100 to find out
grammages. The precision of the measuring scale was 1 mg.
11.3 Ash content
Ash tests differed from the ash making standard for paper and boards SCAN P5:63
by that preheating of crucible and reheating of sample were passed because of large
number of samples. In the test two average samples from each 10 sample series
were picked up for measuring ash content. If there were remarkable dispersion in
weights between samples, the third sample was tested to ensure reliable result. Ash
making was done with Heraeus GWB ash furnaces (picture 16). The temperature
was close to 1000 ºC and burning duration for one sample was 1.5 hours. That
ensured that all organic material was dispelled.
Picture 16 Heraeus GWB ash furnaces

Ville Henttonen ENGINEERING THESIS Paper technology The effects of calcium for retention chemicals
38 (49)
Before ash making weight of used crucible was measured. Precision of scale was
0.1 mg. Then the crucible weight was measured with sample on it. After ash
making the crucible weight was measured again and the weight difference before
and after burning revealed the amount of inorganic material. Before making
another ash test, the furnaces were cooled down for 15 minutes so that the test
circumstance was similar with every each sample.
12 THE RESULTS AND ANALYSES
12.1 Canadian Standard Freeness
Every batch taken from the beater was numbered for controlling stock properties
(table 2). First ten sheets without kaolin were made from the first batch. In the
other tests two 1.2 litres batches were mixed together, diluted, and before sheet
making, CSF measured. Consistencies of the stocks were 2 g/L.
Table 2 CSF test results
Test batch CSF, ml 1 610
2+3 590 4+5 610 6+7 590 8+9 590
10+11 590 12+13 605 14+15 605 16+17 595 18+19 590
Measuring results were between 590 – 610 ml. The average CSF was 597.5 ml.
Samples standard deviation was 8.9 and it can be calculated with following
formula:

Ville Henttonen ENGINEERING THESIS Paper technology The effects of calcium for retention chemicals
39 (49)
1
)( 2
−
−= ∑
nxx
s i
(3)
where x is an average weight and n is number of the observation value. The
standard deviation (formula 3) describes how close the observation values are from
the average. /13./
The standard deviation reveals that the dispersion between CSF results is
acceptable small to be sure that it does not affect too much to retention.
12.2 Grammage measuring results
Grammage variations
The grammage variation between ten sheets of the same test group was mainly
under 2 g/m². It reveals that measurements are reliable and differences between the
test groups are not a result from random deviation from tests. Figure 4 indicates
how grammages varied between the test groups. Values are from laboratory
measuring results (appendix 1) and results are calculated with the formula of
standard deviation.

Ville Henttonen ENGINEERING THESIS Paper technology The effects of calcium for retention chemicals
40 (49)
Figure 4 Grammage variation between ten test sheets with different calcium
concentration and retention chemical dosage
Figure 4 shows that with low calcium concentrations the dispersion in results is
low. In higher calcium concentrations with anionic retention chemical maximum
dosage dispersion grows dramatically. The standard deviation is over 9 g/m².
Grammages
With anionic retention chemical grammages of paper sheets were in calcium
concentration of 200 ppm almost at the same level compared to zero calcium
concentration. Free calcium ions had no effect with anionic retention chemical.
When calcium concentration was 400 ppm up to saturation level, grammages went
up outstandingly. When using maximum dosage of anionic retention chemical,
grammages increased almost by 50 percent. Figure 5 illustrates how remarkably
grammages went up when using anionic retention chemical.
012
34567
89
10
0 ppm 200 400 580
calcium concentration
g/m2
No retention chemicalCationic minCationic max Anionic minAnionic max

Ville Henttonen ENGINEERING THESIS Paper technology The effects of calcium for retention chemicals
41 (49)
Figure 5 Grammage of sheets on different calcium levels with anionic and
cationic retention chemical minimum and maximum dosage /appendix 1/
Calculated maximum retention level in the test was approximately 75 g/m² which is
marked on the figure 5 with das line. Figure 5 shows that with cationic retention
chemical maximum dosage retention was a top level when the calcium content was
zero. From the figure 5 can be seen how minimum and maximum dosages follows
the same trend when calcium concentration is rising. On calcium concentration 200
ppm the grammage was only approximately 2 g/m² higher with the cationic
retention chemical minimum dosage compared when using retention chemical at all
on the zero calcium level. On zero calcium concentration the increase of grammage
with cationic retention chemical minimum dosage was almost 4 g/m².
The measured grammages of sample sheets had the desired correlations with the
theory from literature (figure 5). With cationic retention chemicals in the calcium
concentration levels of 200 and 400 ppm the retention level lowered.
60
65
70
75
80
85
90
95
100
105
110
0 ppm 200 400 580
calcium concentration
g/m2
No retention chemical
cationic min
cationic max anionic min
anionic max

Ville Henttonen ENGINEERING THESIS Paper technology The effects of calcium for retention chemicals
42 (49)
Table 3 Percentual changes of grammages on different calcium concentrations
compared to the calcium concentration level of 0 ppm.
Grammage change % Used chemical
200 ppm 400 ppm 580 ppm cationic min -3,35 -0,8 4,61 cationic max -4,57 -6,87 1,29 anionic min 0,32 3,65 15,5 anionic max 2,27 15,16 48,48
Table 3 (values calculated from appendix 1) reveal how with cationic retention
chemicals grammages decreased in calcium concentration 200 ppm approximately
4 percent (table 3). Cationic calcium ions attracted free anionic material from the
stock and cationic retention chemical couldn’t attract fillers and fibers as much as
possible. Percentual decreasing was 1.2 percent higher with maximum dosage
compared to minimum dosage.
On calcium concentration of 400 ppm percentual decreasing was only 0.8 percent
with minimum dosage and it can be explained by insoluble gypsum particles which
increased the grammage. With maximum dosage the retention level decreased more
and it was almost 7 percent compared zero calcium concentration. When the
calcium concentration level was 580 ppm, grammages raised with both chemicals
because of incomplete solubility.
Table 3 shows also very well how anionic retention chemical was a numb to
changes of calcium concentration. Grammages did not lowered in any studying
points. On calcium level of 580 ppm grammage increasing was almost 50 percent
compared to zero calcium level.
With both chemical, the level of retention was much higher compared when not
using any retention chemical. Table 4 illustrates how strongly retention chemical
affects in spite of laboratory circumstance, where the mechanical retention is the
dominant retention type.

Ville Henttonen ENGINEERING THESIS Paper technology The effects of calcium for retention chemicals
43 (49)
Table 4 Increase of grammage when using retention chemical in calcium
concentration of 0 ppm
Used chemical The grammage growth g/m² cationic min 6,04 cationic max 18,15 anionic min 6,85 anionic max 12,44
Table 4 (values calculated from appendix 1) results prove that the dosing amount of
retention chemical had strong effect on laboratory circumstance. The increase of
retention level was approximately same with minimum dosages and with maximum
dosage slightly higher with cationic chemical.
12.3 Ash content
Ash retention differences between different calcium concentrations had quite
similar trend with whole stock retention (figure 6). The ash content lowered with
cationic retention chemical on calcium concentration of 200 and 400 ppm. With the
maximum chemical dosage ash retention lowered percentually more than with
minimum chemical dosage.
Figure 6 Ash retentions as percent of the whole sheet weight /appendix 2/
0,00 5,00
10,00 15,00 20,00 25,00 30,00 35,00
0 ppm 200 400 580
calsium content, ppm
%
No retention chemical
cationic min
cationic max anionic min
anionic max

Ville Henttonen ENGINEERING THESIS Paper technology The effects of calcium for retention chemicals
44 (49)
From the figure 6 can also see, that with anionic retention chemical ash retention
was quite similar on calcium concentrations of 0 and 200 ppm. In the figure 6 is
marked theoretical maximum ash retention with das line. On calcium concentration
level of 580 ppm the ash retention was almost 30 %.
Very interesting point of view is also that percentually ash retention decreased
more with maximum dosage of cationic retention chemical than with minimum
dosage. Table 5 shows that with minimum dosage the percentual decreasing of ash
retention compared to zero calcium level was only approximately 1 percent with
calcium levels of 200 and 400 ppm. Instead with maximum dosage an average
decreasing was approximately 4 percent in the same calcium levels.
Table 5 Changes of ash percent on different calcium concentrations compared to
the results on the calcium concentration level of 0 ppm.
Ash % change Used chemical 200 ppm 400 ppm 580 ppm
cationic min -1,17 -0,81 1,61cationic max -3,2 -4,36 0,51anionic min -1,53 1,11 7,5anionic max -0,08 8,61 18,7
Table 5 shows that on calcium level of 580 ppm by using anionic retention
chemical ash retention increased by 18.7 percent compared to 0 ppm with the same
dosage and with the same chemical. On calcium concentration 200 ppm by using
minimum dosage the percentual ash retention change was similar with cationic and
anionic retention chemical.

Ville Henttonen ENGINEERING THESIS Paper technology The effects of calcium for retention chemicals
45 (49)
13 CONCLUSIONS
13.1 General
The main conclusion in this thesis work was that calcium concentrations have a
role with retention chemicals on laboratory circumstance, where the mechanical
retention is the dominant retention type. Decreasing of grammages was
approximately between 3 to 7 percent with cationic retention chemical on calcium
concentrations of 200 and 400 ppm. These are the calcium concentrations when
gypsum is used as filler with printing papers (chapter 6.2).
The exceptional grammage increasing with anionic retention chemical was also one
of the main things. In chapter 5.3 Complex flocculation (page 14) is explained the
basic idea of network flocculation. This complex bridging mechanism seemed to
occur in this case. On the calcium concentration nearby the saturation point, the
content of free calcium ions was so high that it changed the surface charge of
anionic material in the system. Anionic polymer flocculated strongly with
electrostatic bridging.
Also insoluble gypsum particles increased grammage with anionic polymer.
Controlling the solubility nearby the saturation point seems to be very demanding
and when gypsum is used as filler, the process runs in this calcium level and some
amount of precipitation always occurs.
Remarkable increase of grammage came mainly from higher ash retention. It
confirms that the solubility of gypsum was incomplete close to the saturation point.
Free calcium precipitated strongly with anionic retention chemical and colloidal
material increased the retention level. The actual amount of precipitated gypsum
was even higher than the results in ash tests shows because gypsum decomposes to
calcium oxide during the ash making process.

Ville Henttonen ENGINEERING THESIS Paper technology The effects of calcium for retention chemicals
46 (49)
With cationic retention chemical the percentual ash retention compared to zero
level was 3 percent lower by using maximum dosage than with minimum dosage
on calcium concentration of 200 ppm.
Following questions are very interesting to think for and perhaps to further study:
If the aim is to improve the ash retention level, is the increase of
retention chemical dosage the most suitable way, when the process
water has free calcium ions?
How the results differ in modern paper machine conditions where the
retention conditions are quite different?
How the 3 to 7 percent decreasing of the retention affects to the
productivity and cost-efficiency of production line?
How the results differ in paper machine conditions where the
composition of the process water is much more complicated?
How the results differ if dual polymer retention system is used?
13.2 Possible variations
Samples standard deviation was 8.9 in CSF tests. The difference between CSF
results was a consequence of inaccuracy working methods. It is not possible to take
with a 1.2 liter measure so same amount of a beaten pulp, that the standard
deviation would be much smaller than these results.
In the grammage measuring samples results were multiplied by 100 and it increases
the small variations, which would be normally compensated by measuring the
actual 1 m2 of paper.

Ville Henttonen ENGINEERING THESIS Paper technology The effects of calcium for retention chemicals
47 (49)
Used gypsum slurry was measured with precision of 0.1 g. On the calcium
concentration of 580 ppm it is very challenging to stay under saturation point.
Small variation in measured gypsum amount increases the ash content if the
saturation point is exceeded.
In the sheet making the stock was added with a 0.8 liter measure. It is natural that
some sort of variations occurs when sheets are hand made. The standard deviation
was approximately 1.2 g/m² when sheets were made without calcium containing
water and any retention chemical. This kind of deviation is a result from measuring
stock sample by hands and it has no bigger role in results because this deviation
occurs in every circumstances.

Ville Henttonen ENGINEERING THESIS Paper technology The effects of calcium for retention chemicals
48 (49)
LIST OF REFERENCES
1. Lehtinen, Esa, Pigment Coating and Surface Sizing of Paper. Fapet Oy.
Helsinki 2000.
2. Sanchez, Manuel, Scientific & Technical Advantages in Fillers & Pigments for
Papermakers. Pira rewievs. Barcelona 2003. 28 s.
3. Gussinyer, Josep C. – Enric G. Gussinyer, Minerals in papermaking – Scientific
and technological advances in fillers. Pira reviews. Sweden 1999. 11 s.
4. Neimo, Leo, Papermaking Chemistry. Fapet Oy. Helsinki 1999. 329 s.
5. Häggblom-Ahnger, Ulla – Pekka Komulainen, Kemiallinen metsäteollisuus II -
Paperin ja kartongin valmistus. Opetushallitus. Jyväskylä 2001. s. 290.
6. Lewis, Rob – Wynne Evans, Chemistry - second edition. Palgrave. New York
2001. 465 s.
7. Atkins, Peter – Loretta Jones, Chemistry: molecules, matter, and change – 3d ed.
W.H. Freeman and company. New York 1997. 886 s.
8. Levlin, Jan-Erik – Söderhjelm Liva, Pulp and paper testing. Fapet Oy. Helsinki
1999. 287 s.
ELECTRONIC REFERENCES
9. Knowpap
10. Kemira Oy. [www-page]. [read 11.7.2002] Available: http://www.kemira-
growhow.com/FIN/fi/Contact+Us+FI/Contact+Information/siilinjarvi.htm

Ville Henttonen ENGINEERING THESIS Paper technology The effects of calcium for retention chemicals
49 (49)
11. Chemistry International – Newsmagazine for IUPAC. [www-page]. [read
12.9.2006]Available:http://www.iupac.org/publications/ci/2003/2504/ca5_250704
.html
12. University of Oulu, Student WWW server. [www-page]. [read 22.10.2006]
Available: http://www.student.oulu.fi/~mirjak/mol2/akryyliamidi.html
13. Opetushallitus, Edu.fi – Opettajan verkkopalvelu. [www-page]. [read 8.11.2006]
Available: http://www.edu.fi/oppimateriaalit/tilastomatikka/haj_5.html
14. Kemira Oy. [www-page]. [read 9.11.2002] Available:
http://www.kemira.com/Group/Suomeksi/Media/Press+Releases/2001/30102001.
htm

Ville Henttonen ENGINEERING THESIS Paper technology The effects of calcium for retention chemicals
50 (49)

Ville Henttonen ENGINEERING THESIS APPENDIX 1 / 1(3) Paper technology The effects of calcium for retention chemicals 1 LABORATORY RESULTS OF GRAMMAGE MEASURING Whole sheet Sample Gramme Cellulose + kaolin Sample g/m2 1 1,696 1 64,1 2 1,694 2 63,8 3 1,712 3 64,8 4 1,722 4 65,1 5 1,645 5 62,3 6 1,659 6 62,5 7 1,664 7 62,5 8 1,667 8 63,3 9 1,626 9 61,3 10 1,707 10 64,3 Average 1,6792 Average 63,4 Standard deviation 0,032 1,227 Cationic retention chemical K7400R Minimum dosage 0 ppm g/m2 200 ppm g/m2 1 66,2 1 65 2 67 2 63,8 3 66,7 3 65,6 4 66,9 4 64,5 5 66,5 5 65,1 6 68,2 6 64,2 7 67,8 7 66,3 8 66,9 8 67,5 9 69,5 9 64,7 10 66,6 10 63,1 Average 67,23 Average 64,98 Standard deviation 0,998 1,262 400 ppm g/m2 580 ppm g/m2 1 64,3 1 68,4 2 65,4 2 70,1 3 66,1 3 70,7 4 67,3 4 69,7 5 68,2 5 70,1 6 67,1 6 72,8 7 66,4 7 69,3 8 67,5 8 71 9 69,3 9 70,9 10 65,3 10 70,3 Average 66,69 Average 70,33 Standard deviation 1,492 1,169

Ville Henttonen ENGINEERING THESIS APPENDIX 1 / 2(3) Paper technology The effects of calcium for retention chemicals Cationic retention chemical K7400R Maximum dosage 0 ppm g/m2 200 ppm g/m2 1 74,5 1 70,6 2 73,8 2 69,6 3 76 3 70,9 4 73,1 4 71,6 5 75,9 5 72,5 6 74,3 6 70,5 7 75,4 7 72 8 74,7 8 72,4 9 75,6 9 72,5 10 75,8 10 72,3 Average 74,91 Average 71,49 Standard deviation 0,987 1,027 400 ppm g/m2 580 ppm g/m2 1 72,5 1 73,9 2 71,8 2 73,8 3 69,5 3 77,1 4 67,7 4 74,9 5 70,1 5 80,7 6 68 6 77,5 7 71,5 7 77,5 8 69,1 8 75,7 9 70,1 9 73,3 10 67,3 10 74,4 Average 69,76 Average 75,88 Standard deviation 1,790 2,311 Anionic retention chemical A3050R Minimum dosage 0 ppm g/m2 200 ppm g/m2 1 65,1 1 68,5 2 65 2 67,9 3 71 3 67 4 66,6 4 66,8 5 68,8 5 68 6 66,9 6 67,5 7 68,2 7 67,9 8 68,7 8 67,3 9 68,7 9 68,7 10 68,4 10 70 Average 67,74 Average 67,96 Standard deviation 1,848 0,938

Ville Henttonen ENGINEERING THESIS APPENDIX 1 / 3(3) Paper technology The effects of calcium for retention chemicals Anionic retention chemical A3050R Minimum dosage 400 ppm g/m2 580 ppm g/m2 1 69,1 1 76,7 2 69 2 80 3 69,7 3 77,6 4 70 4 75,9 5 71,7 5 80,2 6 68 6 77,8 7 70,7 7 78,9 8 72 8 76,8 9 72,7 9 84,4 10 69,2 10 74,1 Average 70,21 KA 78,24 Standard deviation 1,519 2,702 Anionic retention chemical A3050R Maximum dosage 0 ppm g/m2 200 ppm g/m2 1 71,6 1 71,5 2 70,5 2 72,8 3 71 3 70,4 4 70,9 4 72,6 5 73,3 5 73,4 6 71,5 6 72 7 70,5 7 72,1 8 72,1 8 74 9 71 9 74,4 10 70,5 10 75,9 Average 71,29 Average 72,91 Standard deviation 0,884 1,580 400 ppm g/m2 580 ppm g/m2 1 74,8 1 102 2 83,9 2 121,7 3 86,8 3 113,8 4 80,1 4 111,5 5 87,1 5 101,9 6 85,1 6 100,4 7 80,3 7 114,1 8 80,9 8 89,7 9 82,7 9 105,7 10 79,3 10 97,7 Average 82,1 Average 105,85 Standard deviation 3,793 9,439

Ville Henttonen ENGINEERING THESIS APPENDIX 2 / 1(2) Paper technology The effects of calcium for retention chemicals
2 LABORATORY RESULTS OF ASH TESTS
No retention chemical added sheet crucible crucible+sample sample crucible+ash ash ash% SK 2 29,9411 30,5784 0,6373 29,9566 0,0155 2,43SK 8 29,9714 30,6048 0,6334 29,986 0,0146 2,31 Cationic retention chemical K7400R, minimum dosage K-0 2 30,2918 30,964 0,6722 30,3345 0,0427 6,35K-0 7 30,0856 30,7656 0,68 30,13167 0,0461 6,78K-2 3 30,2925 30,9507 0,6582 30,3281 0,0356 5,41K-2 4 30,0833 30,7284 0,6451 30,118 0,0347 5,38K-4 4 29,9713 30,6448 0,6735 30,0107 0,0394 5,85K-4 7 29,9406 30,6062 0,6656 29,9782 0,0376 5,65K-5 2 30,0759 30,7794 0,7035 30,1331 0,0572 8,13K-5 10 30,7693 31,4746 0,7053 30,8272 0,0579 8,21 Cationic retention chemical K7400R, maximum dosage K+0 1 29,908 30,6556 0,7476 29,9991 0,0911 12,19K+0 8 30,2941 31,045 0,7509 30,3836 0,0895 11,92K+2 3 30,2921 31,0063 0,7142 30,3553 0,0632 8,85K+2 4 30,0836 30,8016 0,718 30,1472 0,0636 8,86K+4 3 29,9718 30,6698 0,698 30,0342 0,0624 8,94K+4 9 29,9408 30,6437 0,7029 29,9886 0,0478 6,80K+4 5 29,9066 30,6034 0,6968 29,9576 0,0510 7,32K+5 4 30,0759 30,8289 0,753 30,1674 0,0915 12,15K+5 8 30,7688 31,5293 0,7605 30,8674 0,0986 12,97 Anionic retention chemical A3050R, minimum dosage A-0 4 29,9071 30,5782 0,6711 29,9526 0,0455 6,78A-0 7 30,2938 30,9806 0,6868 30,3487 0,0549 7,99A-0 6 30,2938 30,961 0,6672 30,3459 0,0521 7,81A-2 6 30,2921 30,9721 0,68 30,3322 0,0401 5,90A-2 7 30,0831 30,7664 0,6833 30,1248 0,0417 6,10A-4 4 29,9715 30,6765 0,705 30,0341 0,0626 8,88A-4 7 29,9406 30,652 0,7114 30,0004 0,0598 8,41A-5 3 30,0759 30,8572 0,7813 30,1873 0,1114 14,26A-5 7 30,7688 31,5608 0,792 30,8954 0,1266 15,98A-5 6 30,2921 31,0681 0,776 30,4072 0,1151 14,83

Ville Henttonen ENGINEERING THESIS APPENDIX 2 / 2(2) Paper technology The effects of calcium for retention chemicals
Anionic retention chemical A3050R, maximum dosage A+0 3 29,9071 30,6216 0,7145 29,9822 0,0751 10,51A+0 6 30,2942 31,0122 0,718 30,3696 0,0754 10,50A+2 2 30,2922 31,0198 0,7276 30,3692 0,0770 10,58A+2 4 30,0825 30,8087 0,7262 30,1571 0,0746 10,27A+4 2 29,9711 30,8114 0,8403 30,1402 0,1691 20,12A+4 9 29,9406 30,7665 0,8259 30,0896 0,1490 18,04A+4 6 30,0825 30,931 0,8485 30,2454 0,1629 19,20A+5 1 30,0754 31,0913 1,0159 30,3803 0,3049 30,01A+5 9 30,7684 31,8185 1,0501 31,0666 0,2982 28,40

Ville Henttonen ENGINEERING THESIS APPENDIX 3 Paper technology The effects of calcium for retention chemicals
3 CATIONIC RETENTION CHEMICAL INSTRUCTIONS

Ville Henttonen ENGINEERING THESIS APPENDIX 4 Paper technology The effects of calcium for retention chemicals
4 ANIONIC RETENTION CHEMICAL INSTRUCTIONS

Ville Henttonen ENGINEERING THESIS APPENDIX 5 Paper technology The effects of calcium for retention chemicals
5 KAOLIN DESCRIBTION

Ville Henttonen ENGINEERING THESIS APPENDIX 6 Paper technology The effects of calcium for retention chemicals
6 RETENTION CHEMICAL DOSING CALCULATIONS Dosing amount 100 – 500 g/t Storage solution 0.3 – 0.5 % Minimum dosage 1 liter of water = 3 g of a retention chemical
Dosing solution = 10 liters / 0.3 g/L
Dosing amount 100 g/t
Weight of sheet 1.68 g
0.3 g / 1000 * 1.68 g = 0.000168 g / sheet
0.000168 g / 0.3 g/L = 0.56 milliliter / sheet
Maximum dosage 1 liter of water = 3 g of a retention chemical
Dosing solution = 10 liters / 0.3 g/L
Dosing amount 500 g/t
0.3 g / 1000 * 1.68 = 0.00084
0.00084 / 0.3 g = 2.8 milliliter / sheet