The Effect of Specimen Size and Test Procedure on the ...
21
crystals Article The Effect of Specimen Size and Test Procedure on the Creep Behavior of ME21 Magnesium Alloy Bettina Camin * and Maximilian Gille Citation: Camin, B.; Gille, M. The Effect of Specimen Size and Test Procedure on the Creep Behavior of ME21 Magnesium Alloy. Crystals 2021, 11, 918. https://doi.org/ 10.3390/cryst11080918 Academic Editors: Umberto Prisco and Bolv Xiao Received: 3 July 2021 Accepted: 5 August 2021 Published: 7 August 2021 Publisher’s Note: MDPI stays neutral with regard to jurisdictional claims in published maps and institutional affil- iations. Copyright: © 2021 by the authors. Licensee MDPI, Basel, Switzerland. This article is an open access article distributed under the terms and conditions of the Creative Commons Attribution (CC BY) license (https:// creativecommons.org/licenses/by/ 4.0/). Faculty III-Process Sciences, Institute of Materials Sciences and Technology, Technische Universität Berlin, Sekr. BH18, Ernst-Reuter-Platz 1, 10587 Berlin, Germany; [email protected] * Correspondence: [email protected]; Tel.: +49-30-314-22096 Abstract: Lightweight constructions and materials offer the opportunity to reduce CO 2 emissions in the transport sector. As components in vehicles are often exposed to higher temperatures above 40% of the melting temperature, there is a risk of creep. The creep behavior usually is investigated based on standard procedures. However, lightweight constructions frequently have dimensions not adequately represented by standardized specimen geometries. Therefore, comparative creep experiments on non-standardized miniature and standardized specimens are performed. Due to a modified test procedure specified by a miniature creep device, only the very first primary creep stage shows a minor influence, but subsequently, no effect on the creep process is detected. The creep behavior of hot extruded and heat treated ME21 magnesium alloy is investigated. It is observed that the creep parameters determined by the miniature and standard creep tests are different. As the deviations are systematic, qualitatively, evidence of the creep behavior is achieved. The creep parameters obtained, and particularly the creep strain and the strain rate, show a higher creep resistance of the miniature specimen. An initial higher number of twinned grains and possible multiaxiality in the gauge volume of the miniature specimen can be responsible. Keywords: creep testing; ME21; magnesium alloy; size effects; miniature specimen 1. Introduction Since the signing of the Kyoto Protocol and a steadily increasing understanding of the effects of CO 2 emissions on the earth’s climate, industry is interested in optimizing its processes and designs regarding CO 2 reduction. In the transport sector, in particular, the goal is to lower the overall weight of vehicles, aircraft, and rail vehicles to decrease fuel consumption and thus environmental pollution. In this context, the terms green technology and life cycle costs focus on product development. Connecting factors are lightweight constructions and materials as well as energy-saving manufacturing processes. In the latter, characterizing the mechanical and thermo-mechanical properties of al- loys is critical in developing novel non- or low-contaminant construction and production technologies as well as during operation. Hence, the investigation of titanium [1,2], alu- minum [3], and magnesium alloys [4] as lightweight materials under extreme conditions is of particular interest. Mainly, it is essential to depict the responses of structural components to external mechanical loadings [5,6]. Although the mechanical loads investigated in this work are relatively moderate nevertheless, small dimensions additionally exposed to high temperature can already be rated as highly loaded during service. In lightweight constructions, modifications of the design by wall thickness reduction are further solutions in this context. As these components are subjected to mechanical loads at room temperature and higher temperatures, their creep resistance is of great im- portance. Typically, creep experiments are performed on standardized samples according to, e.g., DIN EN ISO 204 (European Standard) [7] or ASTM E139 (American Standard) [8]. However, complex or thin-walled lightweight component geometries partially do not Crystals 2021, 11, 918. https://doi.org/10.3390/cryst11080918 https://www.mdpi.com/journal/crystals
Transcript of The Effect of Specimen Size and Test Procedure on the ...

crystals
Article
The Effect of Specimen Size and Test Procedure on the CreepBehavior of ME21 Magnesium Alloy
Bettina Camin * and Maximilian Gille
�����������������
Citation: Camin, B.; Gille, M. The
Effect of Specimen Size and Test
Procedure on the Creep Behavior of
ME21 Magnesium Alloy. Crystals
2021, 11, 918. https://doi.org/
10.3390/cryst11080918
Academic Editors: Umberto Prisco
and Bolv Xiao
Received: 3 July 2021
Accepted: 5 August 2021
Published: 7 August 2021
Publisher’s Note: MDPI stays neutral
with regard to jurisdictional claims in
published maps and institutional affil-
iations.
Copyright: © 2021 by the authors.
Licensee MDPI, Basel, Switzerland.
This article is an open access article
distributed under the terms and
conditions of the Creative Commons
Attribution (CC BY) license (https://
creativecommons.org/licenses/by/
4.0/).
Faculty III-Process Sciences, Institute of Materials Sciences and Technology, Technische Universität Berlin,Sekr. BH18, Ernst-Reuter-Platz 1, 10587 Berlin, Germany; [email protected]* Correspondence: [email protected]; Tel.: +49-30-314-22096
Abstract: Lightweight constructions and materials offer the opportunity to reduce CO2 emissionsin the transport sector. As components in vehicles are often exposed to higher temperatures above40% of the melting temperature, there is a risk of creep. The creep behavior usually is investigatedbased on standard procedures. However, lightweight constructions frequently have dimensionsnot adequately represented by standardized specimen geometries. Therefore, comparative creepexperiments on non-standardized miniature and standardized specimens are performed. Due toa modified test procedure specified by a miniature creep device, only the very first primary creepstage shows a minor influence, but subsequently, no effect on the creep process is detected. The creepbehavior of hot extruded and heat treated ME21 magnesium alloy is investigated. It is observedthat the creep parameters determined by the miniature and standard creep tests are different. Asthe deviations are systematic, qualitatively, evidence of the creep behavior is achieved. The creepparameters obtained, and particularly the creep strain and the strain rate, show a higher creepresistance of the miniature specimen. An initial higher number of twinned grains and possiblemultiaxiality in the gauge volume of the miniature specimen can be responsible.
Keywords: creep testing; ME21; magnesium alloy; size effects; miniature specimen
1. Introduction
Since the signing of the Kyoto Protocol and a steadily increasing understanding ofthe effects of CO2 emissions on the earth’s climate, industry is interested in optimizing itsprocesses and designs regarding CO2 reduction. In the transport sector, in particular, thegoal is to lower the overall weight of vehicles, aircraft, and rail vehicles to decrease fuelconsumption and thus environmental pollution. In this context, the terms green technologyand life cycle costs focus on product development. Connecting factors are lightweightconstructions and materials as well as energy-saving manufacturing processes.
In the latter, characterizing the mechanical and thermo-mechanical properties of al-loys is critical in developing novel non- or low-contaminant construction and productiontechnologies as well as during operation. Hence, the investigation of titanium [1,2], alu-minum [3], and magnesium alloys [4] as lightweight materials under extreme conditions isof particular interest. Mainly, it is essential to depict the responses of structural componentsto external mechanical loadings [5,6]. Although the mechanical loads investigated in thiswork are relatively moderate nevertheless, small dimensions additionally exposed to hightemperature can already be rated as highly loaded during service.
In lightweight constructions, modifications of the design by wall thickness reductionare further solutions in this context. As these components are subjected to mechanicalloads at room temperature and higher temperatures, their creep resistance is of great im-portance. Typically, creep experiments are performed on standardized samples accordingto, e.g., DIN EN ISO 204 (European Standard) [7] or ASTM E139 (American Standard) [8].However, complex or thin-walled lightweight component geometries partially do not
Crystals 2021, 11, 918. https://doi.org/10.3390/cryst11080918 https://www.mdpi.com/journal/crystals

Crystals 2021, 11, 918 2 of 21
allow standardized specimens to be taken. Consequently, there has been a high interest incarrying out investigations on miniaturized specimen geometries. Furthermore, the smallerdimensions of the specimens enable detailed investigations of representative material statesfrom components, whereby the miniature specimens can be taken in different orientationsfrom a small material volume [9–12]. The influence of the creep parameters by the specimensizes is provided, and the test method is known. However, the confidence of these resultscompared to standard sample sizes is of great importance. Miniature specimens, or creepspecimens with non-standard geometry, have been used for some time to investigate steel’screep behavior in power plant construction, e.g., [13–18]. Pipelines and connectors arecomponents subjected to creep stresses, which cannot be investigated reproducibly withthe geometry of standard creep specimens.
However, especially in the transport sector, replacing construction materials such assteel with lightweight materials effectively reduces weight [19,20]. In addition to aluminumand titanium lightweight materials, the magnesium alloys show a high application poten-tial for the mentioned requirements as they have the lowest density (1.74 g/cm−3) andhigh specific strength and stiffness compared to all other metallic construction materials.However, most magnesium alloy’s poor forming properties and creep resistance due totheir hexagonal closed packed (hcp) structure currently severely limit their industrial appli-cation [19,21,22]. The magnesium wrought alloy ME21 containing rare earth (RE) elementcerium and the element manganese is characterized by good formability at higher tempera-tures, corrosion, and creep resistance compared to other Mg alloys [19,23–31]. Ce is addedto increase the high-temperature strength and creep resistance due to its pronounced solidsolution hardening and low diffusion tendency [25]. Furthermore, the intermetallic phaseMg12Ce formed at grain boundaries prevents grain boundary sliding. Its good formabilityenables the production of thin sheets with a thickness of 1 mm. However, studies on thecreep behavior of the magnesium alloy ME21 are rare. The creep properties of the ME21alloy are of interest providing a more cost-effective and resource-saving alternative tothe WE43 and WE54 alloys containing a higher amount of expensive rare earth elementscurrently used for components subjected to creep [20,32]. The compositions of the alloysME21, WE43, and WE54 are given in Table 1 (c.f. Section 2.1).
Additionally, energy-saving manufacturing technologies are selected, enabling thefinal product to be manufactured with as few manufacturing steps as possible. For thispurpose, the manufacturing process by hot extrusion for transport assemblies is establishedand used for many years, e.g., [33–36]. The production of larger components up to thinsheets of various materials is possible with this process.
As many assemblies in the transportation sector—including lightweight structures—are manufactured nowadays by hot extrusion, in this work, comparative creep experimentsof the hot extruded magnesium alloy ME21 are carried out. Miniature and standardspecimen geometries are investigated, the creep behavior itself, as well as the influencedue to downsizing, are validated.
2. Materials and Methods2.1. Material
The aluminum-free magnesium alloy ME21 is alloyed by 2 wt % Mn and 1 wt % Ce.The chemical composition is given in Table 1.
Table 1. Chemical composition of ME21 [37], WE43 [38], WE54 [39].
Mn Ce Al Nd Pr Si Th Y Zn Mg
ME21 2.1 0.7 ≤0.01 ≤ 0.015 ≤0.01 ≤0.015 0.14 0.04 ≤0.015 bal.
Mn Li Ni Nd Zr Si Cu Y Zn Mg
WE43 ≤0.15 ≤0.2 ≤0.005 2.4–4.4 0.4–1.0 ≤0.01 ≤0.03 3.7–4.3 ≤0.2 bal.WE54 ≤0.15 ≤0.2 ≤0.005 2.0–4.0 0.4–1.0 ≤0.01 ≤0.03 4.75–5.5 ≤0.2 bal.

Crystals 2021, 11, 918 3 of 21
The hot extruded cylindrical bars made of ME21 manufactured by an 8 MN horizontalextrusion plant (SMS group GmbH, Düsseldorf, Germany) and provided by the ExtrusionResearch and Development Center of the Technische Universität Berlin (FZS). The detailedfunction of the plant and the extrusion process are described in [40,41]. Parameters of hotextrusion process such as the initial geometry of the billet, the temperatures of the billet ϑb,container ϑa and tool ϑw, the extrusion ratio V, and product speed vp are shown in Table 2.
Table 2. Parameters of the hot extrusion process.
Technique BilletGeometry ϑa, ϑb, ϑw V vp Cooling
indirect ∅ = 123 mml = 150 mm 450 ◦C 71 1.7 m min−1 air
After the hot extrusion process, the extruded product in the as extruded condition (asex) shows a fine-grained microstructure inappropriate for creep resistance. According toBrömmelhoff et al. [42], subsequent heat treatment at T = 550 ◦C for 24 hours followedby quenching in water leads to fine-dispersed Mn, bigger Mg12Ce-precipitates, a coarse-grained and homogeneous microstructure. Optical microscopy (OM) analyses illustratethe microstructure (Figure 1). The grain size varies between 10 and 70 µm by an average of38 µm, and an aspect ratio of 1 is measured. The visible Mg12Ce-precipitates marked by awhite arrow are homogeneously distributed throughout the microstructure (Figure 1a,c)and are mainly found at the grain boundaries (Figure 1b). Small Mn-precipitates arefine-dispersed in the matrix (Figure 1b, light grey arrows).
Crystals 2021, 11, x FOR PEER REVIEW 3 of 21
WE54 ≤ 0.15 ≤ 0.2 ≤ 0.005 2.0–4.0 0.4–1.0 ≤ 0.01 ≤ 0.03 4.75–5.5 ≤ 0.2 bal. The hot extruded cylindrical bars made of ME21 manufactured by an 8 MN horizon-
tal extrusion plant (SMS group GmbH, Düsseldorf, Germany) and provided by the Extru-sion Research and Development Center of the Technische Universität Berlin (FZS). The detailed function of the plant and the extrusion process are described in [40,41]. Parame-ters of hot extrusion process such as the initial geometry of the billet, the temperatures of the billet 𝝑𝒃, container 𝝑𝒂 and tool 𝝑𝒘, the extrusion ratio 𝑽, and product speed 𝒗𝒑 are shown in Table 2.
Table 2. Parameters of the hot extrusion process.
Technique Billet Geometry 𝝑𝒂, 𝝑𝒃, 𝝑𝒘 𝑽 𝒗𝒑 Cooling
indirect ∅ = 123 mm 𝒍 = 150 mm 450 °C 71 1.7 m min−1 air
After the hot extrusion process, the extruded product in the as extruded condition (as ex) shows a fine-grained microstructure inappropriate for creep resistance. According to Brömmelhoff et al. [42], subsequent heat treatment at 𝑻 = 550 °C for 24 hours followed by quenching in water leads to fine-dispersed Mn, bigger Mg12Ce-precipitates, a coarse-grained and homogeneous microstructure. Optical microscopy (OM) analyses illustrate the microstructure (Figure 1). The grain size varies between 10 and 70 µm by an average of 38 µm, and an aspect ratio of 1 is measured. The visible Mg12Ce- precipitates marked by a white arrow are homogeneously distributed throughout the microstructure (Figure 1a,c) and are mainly found at the grain boundaries (Figure 1b). Small Mn-precipitates are fine-dispersed in the matrix (Figure 1b, light grey arrows).
Figure 1. Microstructure of the heat treated ME21 material; (a,b) longitudinal section (=ED), (a) 50×, (b) 500×; (c) cross section, 200×.
2.2. Microscopy The microstructure of the hot extruded and heat-treated initial material and of the
miniaturized and standardized samples after the creep experiments is investigated by an optical microscope UnivaR Met (Reichert-Jung Optische Werke AG, Austria) equipped with a digital camera system Leica DFC 295 (Leica Microsystems GmbH, Germany) and by a scanning electron microscope JEOL JSM 640 (JEOL GmbH, Germany) equipped with a Noran detector (Thermo Fisher Scientific Inc., Germany) for EDS measurements. From the initial material sections in the extrusion direction (ED) and perpendicular to ED, the transverse direction (TD), are taken using a cutting-off machine WOCO 50 (Conrad, Ger-many). The creep-stressed specimens are investigated in ED only.
For metallographic preparation, the specimens are embedded in the two-component epoxy resin Technovit 4071 (Kulzer GmbH, Germany). First, the specimens are manually
Figure 1. Microstructure of the heat treated ME21 material; (a,b) longitudinal section (=ED), (a) 50×, (b) 500×; (c) crosssection, 200×.
2.2. Microscopy
The microstructure of the hot extruded and heat-treated initial material and of theminiaturized and standardized samples after the creep experiments is investigated by anoptical microscope UnivaR Met (Reichert-Jung Optische Werke AG, Austria) equippedwith a digital camera system Leica DFC 295 (Leica Microsystems GmbH, Germany) andby a scanning electron microscope JEOL JSM 640 (JEOL GmbH, Germany) equippedwith a Noran detector (Thermo Fisher Scientific Inc., Germany) for EDS measurements.From the initial material sections in the extrusion direction (ED) and perpendicular to ED,the transverse direction (TD), are taken using a cutting-off machine WOCO 50 (Conrad,Germany). The creep-stressed specimens are investigated in ED only.
For metallographic preparation, the specimens are embedded in the two-componentepoxy resin Technovit 4071 (Kulzer GmbH, Germany). First, the specimens are manuallyground on a polishing and grinding machine, TegraPol-25 (Struers GmbH, Germany),

Crystals 2021, 11, 918 4 of 21
followed by manual polishing of the specimens with diamond suspensions (6 to 1 µm).Subsequently, the samples were additionally chemically polished by immersing them in aCP2 solution for 2 s to remove near-surface deformation layers resulting from polishingand reopen pores closed by the preparation. The CP2 solution is made from 100 ml ethanol,12 ml hydrochloric acid (25 percentage), and 8 ml nitric acid. For the OM examination ofthe microstructure, the sample surfaces are finally etched with a solution of 100 ml ethanol,20 ml water, 6 ml glacial acetic acid, and 5 g picric acid for 3 s.
2.3. Creep Experiments
This work aims the investigation of the creep behavior of miniature specimens incomparison to specimens with standardized geometries—further referred to as standardspecimens—according to DIN EN ISO 204 [7]. The dimensions of both creep specimens areshown in Figure 2.
Crystals 2021, 11, x FOR PEER REVIEW 4 of 21
ground on a polishing and grinding machine, TegraPol-25 (Struers GmbH, Germany), fol-lowed by manual polishing of the specimens with diamond suspensions (6 to 1 µm). Sub-sequently, the samples were additionally chemically polished by immersing them in a CP2 solution for 2 s to remove near-surface deformation layers resulting from polishing and reopen pores closed by the preparation. The CP2 solution is made from 100 ml etha-nol, 12 ml hydrochloric acid (25 percentage), and 8 ml nitric acid. For the OM examination of the microstructure, the sample surfaces are finally etched with a solution of 100 ml eth-anol, 20 ml water, 6 ml glacial acetic acid, and 5 g picric acid for 3 s.
2.3. Creep Experiments This work aims the investigation of the creep behavior of miniature specimens in
comparison to specimens with standardized geometries—further referred to as standard specimens—according to DIN EN ISO 204 [7]. The dimensions of both creep specimens are shown in Figure 2.
(a)
(b)
Figure 2. Geometries of the creep specimens, (a) miniature specimen, (b) standard specimen.
Two different creep devices were used for these studies. The creep tests using stand-ard specimens are performed on a commercial creep testing machine DSM 6102 equipped with a three-stage vertical electric furnace type EO 4090 (Roell Amsler Prüfmaschinen GmbH & Co. KG, Germany), enabling temperatures up to 1100 °C. The force is applied via an electric motor, whereby the maximum test load of the system is 50 kN. The elonga-tion of the sample is determined by an extensometer mechanically adapted directly to the specimen. This ensures only the change in length ∆𝒍 of the specimen’s gauge length 𝒍𝒈 is determined. The creep experiments using miniature specimens are carried out applying a miniature creep device developed by TU Berlin for in situ synchrotron µ-tomography measurements (XCT) at the European Synchrotron Radiation Facility (ESRF) described in
Figure 2. Geometries of the creep specimens, (a) miniature specimen, (b) standard specimen.
Two different creep devices were used for these studies. The creep tests using standardspecimens are performed on a commercial creep testing machine DSM 6102 equipped witha three-stage vertical electric furnace type EO 4090 (Roell Amsler Prüfmaschinen GmbH& Co. KG, Germany), enabling temperatures up to 1100 ◦C. The force is applied via anelectric motor, whereby the maximum test load of the system is 50 kN. The elongation of thesample is determined by an extensometer mechanically adapted directly to the specimen.This ensures only the change in length ∆l of the specimen’s gauge length lg is determined.The creep experiments using miniature specimens are carried out applying a miniaturecreep device developed by TU Berlin for in situ synchrotron µ-tomography measurements(XCT) at the European Synchrotron Radiation Facility (ESRF) described in detail in [43–46].In these works and furthermore, in [47–49], the applicability of this miniature creep device

Crystals 2021, 11, 918 5 of 21
was shown. It should be mentioned here once again that the experimental procedure ofcreep experiments conducted by the miniature creep device (cf. [46]) is different from theprocedure given by DIN EN ISO 204. Regarding the requirements of in situ XCT investi-gations at the beamlines of the ESRF, the following aspects are part of the experimentaldesign of the miniature creep device:
• The mechanical load to the sample is applied before heating.• The ratio of the initial gauge diameter d0 = 1 mm and the initial gauge length
l0 = 1 mm of the sample is d0/l0 = 1 (Figure 2a).• The elongation of the whole sample is measured during creep. As shown in [46],
compared to the much larger diameter of the clamping, significant strain changes occuronly in the small diameter of the gauge volume as soon as the thermal equilibriumis reached.
Comparative preliminary tests on standard samples (Figure 2b) in the DSM 6102 testrig are conducted to investigate the influence of the varied sequence of mechanical andthermal loading on the creep behavior. An uniaxial tensile mechanical load of σ = 20 MPais applied in all preliminary creep tests. The two different test procedures are describedas follows:
• In agreement with the standard creep test procedure specified by [7], the mechanicalload is applied after the sample is heated up to the test temperature (sequence: heating→mechanical loading).
• In agreement with the creep test procedure specified by the miniature creep device,the mechanical load is applied at room temperature, and subsequent, the specimen isheated to the test temperature (sequence: mechanical loading→ heating).
The analyses of the creep curves measured for both test procedures provide informa-tion about the applicability of the different sequences.
Another focus in this work is on comparative investigations of the creep behaviorof standard and miniature creep specimens performed according to the test proceduregiven by the miniature creep device. The miniature specimens are tested in the miniaturecreep device, and the standard specimens are tested in the DSM 6102 test rig. All creeptests are carried out at a test temperature Tcr = 523 K due to the highest temperatureexpected in automobiles. Taking the melting temperature of magnesium Tm = 923 K intoaccount, hence, a homologous temperature Thomolog = Tcr/Tm = 0.58 results. Mechanicalloads σ = 10, 15, 20, 25, and 30 MPa are selected. Due to the work of Stinton et al., phasestability can be expected [50]. For each mechanical load, two experiments are performedwith the miniature specimens and one experiment with the standard specimens. Due tomeasured high strains at fracture (εfr > 0.1), the true creep curve εtrue = f(t) and truestrain rate curve
.εtrue = f(t) are calculated from the elongation of the sample ∆l measured
by extensometer in reference to the initial gauge length l0 [51]:
εtrue = ln(
1 +∆llg
)(1)
.εtrue =
εtrue
dt(2)
3. Results3.1. Creep Tests3.1.1. Preliminary Creep Tests
The comparison of the creep curves εtrue = f(t) calculated from Equation (1) and strainrate curves
.εtrue = f(t) (Equation (2)) obtained in the preliminary creep tests are shown in
Figure 3. It should be noted that the true strain is a dimensionless quantity. Overall, bothcreep curves basically show similar behavior. However, the strain develops differentlywithin approximately first two hours of the creep experiments. While the creep curve of theexperiment due to the standard sequence (heating→mechanical load) exhibits a typical

Crystals 2021, 11, 918 6 of 21
behavior, the behavior of the varied creep test sequence (mechanical load→ heating) isunusual in the early primary creep stage. After a minor positive initial strain, a negativestrain seems to occur here, subsequently increasing again. During heating from roomto test temperature under mechanical load competitive processes, time-independent andtime-dependent plastic deformation occurs. The mechanisms behind, are not investigatedin this work. Afterward, at the latest in the transition from the primary to the secondarystage, the creep curves of both test procedures more or less run parallel to each other.Finally, the creep time until fracture tfr and the creep strain at fracture εfr are different(Figure 3a). The strain rate curves illustrate the different behavior in the early primarycreep stage (Figure 3b). Apparently, even negative strain rates occur right at the beginningfor the miniature specimen. After approximately 4 hours, the curves of both test proceduresfit together, while the minimum creep rates
.εmin are quite similar. The difference of the
two measured values for the minimum creep rate is less than 4%, which is within typicalexperimental error limits. The changed sequence of the test procedure has no significantinfluence on the minimum creep rate determined for the given test parameters.
Crystals 2021, 11, x FOR PEER REVIEW 6 of 21
differently within approximately first two hours of the creep experiments. While the creep curve of the experiment due to the standard sequence (heating → mechanical load) exhib-its a typical behavior, the behavior of the varied creep test sequence (mechanical load → heating) is unusual in the early primary creep stage. After a minor positive initial strain, a negative strain seems to occur here, subsequently increasing again. During heating from room to test temperature under mechanical load competitive processes, time-independent and time-dependent plastic deformation occurs. The mechanisms behind, are not investi-gated in this work. Afterward, at the latest in the transition from the primary to the sec-ondary stage, the creep curves of both test procedures more or less run parallel to each other. Finally, the creep time until fracture 𝒕𝒇𝒓 and the creep strain at fracture 𝜺𝒇𝒓 are different (Figure 3a). The strain rate curves illustrate the different behavior in the early primary creep stage (Figure 3b). Apparently, even negative strain rates occur right at the beginning for the miniature specimen. After approximately 4 hours, the curves of both test procedures fit together, while the minimum creep rates 𝜺𝒎𝒊𝒏 are quite similar. The difference of the two measured values for the minimum creep rate is less than 4%, which is within typical experimental error limits. The changed sequence of the test procedure has no significant influence on the minimum creep rate determined for the given test pa-rameters.
(a)
(b)
Figure 3. Comparison of different creep test procedures; (a) entire creep curves and detail of the veryearly primary creep stage, (b) entire curves of strain rate and detail of the region around minimumcreep strain until fracture.

Crystals 2021, 11, 918 7 of 21
The obtained creep parameters of the preliminary experiments are shown in Table 3.Based on the procedure described in [46], the error limits are estimated at about approxi-mately 45%.
Table 3. Creep parameters of preliminary creep tests.
Test Procedure.εmin(s−1)
εfr(−)
tfr(h)
Standard(Heating→mechanical loading) 7.46 × 10⁻⁶ ± 3.36 × 10⁻⁷ 0.395 ± 0.178 13.5 ± 6.075
Variation due to miniature device(Mechanical loading→ heating) 7.18 × 10⁻⁶ ± 3.23 × 10⁻⁷ 0.537 ± 0.242 14.9 ± 6.705
In comparison from Table 3, it can be derived a slightly faster minimum creep strainrate
.εmin leads to a shorter time to fracture tfr as well as a smaller creep strain at fracture
εfr, whereas the slower minimum creep rate.εmin in contrast lead to a while longer creep
lifetime tfr and higher creep strain at fracture εfr. Regarding the effect of a faster.εmin
on εfr, this finding is not compliant to the literature, e.g., [51–53]: based on experience, ahigher
.εmin should lead to higher εfr. However, the minimum creep rate of the standard
test procedure is reached at a later point in time compared to the varied test proceduredue to miniature creep device. Regarding to a lower εfr this in turn is in accordance withthe literature. It is known, the exact time to fracture tfr and elongation at creep ruptureεfr is strongly dependent on the local defect characteristics of the material, e.g., pores orcracks [53]. As these tests are performed only once without repetitions and the resultsagree pretty well, thus, a negligible influence of the test procedure on εfr and tfr is assumedhere. The varied creep test procedure of the miniature creep device is found to be suitableto standard specimen investigated in the DSM 6102 test rig.
3.1.2. Comparative Creep Tests
Comparative creep measurements (miniature and standard) are conducted applyingthe varied creep test procedure (mechanical load→ heating). Due to the high values of theminiature specimens, the initial instantaneous strain in the very early primary creep stageis subtracted, so only the time-dependent true creep strain is plotted. Both the miniaturecreep specimens and the standard creep specimens show typical creep behavior, with aprimary, secondary, and tertiary creep stage of the true creep curves εtrue = f(t) (Figure 4).At σ = 10 MPa the creep experiments with miniature specimen are prematurely stoppedat tcr = 255 and 995 h due to expected very long tfr (Figure 4a). Although the creepcurves and consequently the respective creep parameters of the miniature specimens atσ = 25 MPa are very different the average values are calculated.
In general, with increasing stress on the specimens, an increasing slope of the sec-ondary creep stage and a decreasing total creep time can be observed. Furthermore, for thesame test parameters, longer times to fracture tfr and a lower creep rate
.εmin of the minia-
ture specimens compared to the standard specimens are determined. The creep parametersderived from the creep curves are shown in Table 4. The ductility of the material expressedby the necking at fracture Z is determined by:
Z =A0 − (π·r1·r2)
A0·100% (3)
where A0 is the initial cross-section area and r1, r2 are the semi-axes of elliptical fracture sur-faces. The average value of the necking at fracture of the standard specimens Zstand = 51%is twice that of the miniature specimens Zmini = 25%. The error limits of the standardspecimens are estimated by ± 45% based on the procedure described in [46], whereasthe error limits of the miniature specimens are calculated from the results of repeatedcreep experiments.

Crystals 2021, 11, 918 8 of 21Crystals 2021, 11, x FOR PEER REVIEW 8 of 21
(a) (b)
(c) (d)
(e)
Figure 4. Creep curves, (a) 10 MPa, (b) 15 MPa, (c) 20 MPa, (d) 25 MPa, (e) 30 MPa.
In general, with increasing stress on the specimens, an increasing slope of the sec-ondary creep stage and a decreasing total creep time can be observed. Furthermore, for the same test parameters, longer times to fracture 𝒕𝒇𝒓 and a lower creep rate 𝜺𝒎𝒊𝒏 of the miniature specimens compared to the standard specimens are determined. The creep pa-rameters derived from the creep curves are shown in Table 4. The ductility of the material expressed by the necking at fracture 𝒁 is determined by: 𝐙 = 𝐀𝟎 − (𝛑 ∙ 𝐫𝟏 ∙ 𝐫𝟐)𝐀𝟎 ∙ 𝟏𝟎𝟎% (3)
where 𝑨𝟎 is the initial cross-section area and 𝒓𝟏, 𝒓𝟐 are the semi-axes of elliptical fracture surfaces. The average value of the necking at fracture of the standard specimens 𝒁𝒔𝒕𝒂𝒏𝒅 = 51% is twice that of the miniature specimens 𝒁𝒎𝒊𝒏𝒊 = 25%. The error limits of the standard specimens are estimated by ± 45% based on the procedure described in [46], whereas the error limits of the miniature specimens are calculated from the results of repeated creep experiments.
Figure 4. Creep curves, (a) 10 MPa, (b) 15 MPa, (c) 20 MPa, (d) 25 MPa, (e) 30 MPa.
3.2. Microscopy
OM of the standard and miniature specimen in the hot extruded and heat-treatedcondition after manufacturing is conducted in the region of the gauge length near thesurface. Figure 5 shows the longitudinal sections of standard and miniature specimens notsubjected to creep loading. Hence, the influence of the manufacturing process is shown.The region near the surface of the specimens manufactured by turning exhibits twinningdue to deformation. As shown in Figure 5a, twinning of grains from the surface to a depthof 100 µm is detectable in the standard samples with a diameter of 6 mm. The grains ofthe miniature samples, on the other hand, are found to be twinned over the entire gaugevolume diameter of 1 mm. The twinning density gradually decreases from the surface to thecenter of the sample (Figure 5b). Moreover, a lower twinning density is observed outsidethe gauge volume (Figure 5c). It should be noted that a strong scatter is observed within aminiature specimen batch regarding the degree of twinning. Some samples indicate a lowtwinning density, whereas other samples indicate a high twinning density.

Crystals 2021, 11, 918 9 of 21
Table 4. Creep parameters of all investigated samples.
Standard
σ(MPa)
.εmin(s−1)
εfr(−)
tfr(h)
Z(%)
10 1.89·10−7 ± 8.505·10−8 0.507 ± 0.228 464.16 ± 208.87 54 ± 215 1.41·10-6 ± 6.345·10−7 0.378 ± 0.17 50.03 ± 22.51 50 ± 120 5.99·10−6 ± 2.7·10−6 0.535 ± 0.241 15.14 ± 6.81 50 ± 225 1.49·10−5 ± 6.705·10−6 0.411 ± 0.185 5.47 ± 2.46 -30 5.90·10−5 ± 2.655·10−5 0.507 ± 0.228 2.31 ± 1.04 51 ± 2
Miniature
σ(MPa)
.εmin(s−1)
εfr(−)
tfr(h)
Z(%)
10 5.59·10−8 ± 1.3·10−8 - - -15 5.09·10−7 ± 9.0·10−9 0.487 ± 0.048 94.17 ± 7.35 27 ± 320 1.47·10−6 ± 6.0·10−8 0.558 ± 0.29 41.84 ± 29.47 26 ± 425 4.56·10−6 ± 3.4·10−7 0.457 ± 0.177 12.16 ± 5.77 -30 1.09·10−5 ± 8.5·10−7 0.472 ± 0.019 5.86 ± 0.50 26 ± 535 3.49·10−5 ± 1.57·10−5 0.402 ± 0.181 1.38 ± 0.80 4 ± 0.5
Crystals 2021, 11, x FOR PEER REVIEW 9 of 21
Table 4. Creep parameters of all investigated samples.
Standard σ
(MPa) 𝜺𝒎𝒊𝒏 (s–1)
𝜺𝒇𝒓 (–)
𝒕𝒇𝒓 (h)
𝒁 (%)
10 1.89∙10−7 ± 8.505∙10−8 0.507 ± 0.228 464.16 ± 208.87 54 ± 2 15 1.41∙10-6 ± 6.345∙10−7 0.378 ± 0.17 50.03 ± 22.51 50 ± 1 20 5.99∙10−6 ± 2.7∙10−6 0.535 ± 0.241 15.14 ± 6.81 50 ± 2 25 1.49∙10−5 ± 6.705∙10−6 0.411 ± 0.185 5.47 ± 2.46 - 30 5.90∙10−5 ± 2.655∙10−5 0.507 ± 0.228 2.31 ± 1.04 51 ± 2 Miniature σ
(MPa) 𝜺𝒎𝒊𝒏 (s–1)
𝜺𝒇𝒓 (–)
𝒕𝒇𝒓 (h)
𝒁 (%)
10 5.59∙10−8 ± 1.3∙10−8 - - - 15 5.09∙10−7 ± 9.0∙10−9 0.487 ± 0.048 94.17 ± 7.35 27 ± 3 20 1.47∙10−6 ± 6.0∙10−8 0.558 ± 0.29 41.84 ± 29.47 26 ± 4 25 4.56∙10−6 ± 3.4∙10−7 0.457 ± 0.177 12.16 ± 5.77 - 30 1.09∙10−5 ± 8.5∙10−7 0.472 ± 0.019 5.86 ± 0.50 26 ± 5 35 3.49∙10−5 ± 1.57∙10−5 0.402 ± 0.181 1.38 ± 0.80 4 ± 0.5
3.2. Microscopy OM of the standard and miniature specimen in the hot extruded and heat-treated
condition after manufacturing is conducted in the region of the gauge length near the sur-face. Figure 5 shows the longitudinal sections of standard and miniature specimens not subjected to creep loading. Hence, the influence of the manufacturing process is shown. The region near the surface of the specimens manufactured by turning exhibits twinning due to deformation. As shown in Figure 5a, twinning of grains from the surface to a depth of 100 µm is detectable in the standard samples with a diameter of 6 mm. The grains of the miniature samples, on the other hand, are found to be twinned over the entire gauge volume diameter of 1 mm. The twinning density gradually decreases from the surface to the center of the sample (Figure 5b). Moreover, a lower twinning density is observed out-side the gauge volume (Figure 5c). It should be noted that a strong scatter is observed within a miniature specimen batch regarding the degree of twinning. Some samples indi-cate a low twinning density, whereas other samples indicate a high twinning density.
Figure 5. OM of the microstructure, longitudinal section, near-surface region, (a) standard speci-men, (b) miniature specimen in the gauge length, (c) miniature specimen beyond the gauge length.
Figure 5. OM of the microstructure, longitudinal section, near-surface region, (a) standard specimen,(b) miniature specimen in the gauge length, (c) miniature specimen beyond the gauge length.
The microstructure of the standard and miniature samples after the creep experimentsare also investigated. The observations described below occur in both the standard and theminiature specimens, although with different dimensions. First, the focus is on changesof the grain morphology: increasing mechanical stress is observed to be accompanied byincreasing elongation of the grains. Starting from nearly globular grains (ratio = 1.0) atσ = 10 MPa, several of which at this load have twins, the aspect ratio is developing to1.5 (σ = 15 MPa), 1.8 (σ = 20 MPa) to a maximum of 1.9 (σ = 30 MPa) illustratedexemplary on the standard specimen (Figure 6). The values of the aspect ratios are shownin Table 5.

Crystals 2021, 11, 918 10 of 21
Crystals 2021, 11, x FOR PEER REVIEW 10 of 21
The microstructure of the standard and miniature samples after the creep experi-ments are also investigated. The observations described below occur in both the standard and the miniature specimens, although with different dimensions. First, the focus is on changes of the grain morphology: increasing mechanical stress is observed to be accom-panied by increasing elongation of the grains. Starting from nearly globular grains (ratio = 1.0) at 𝝈 = 10 MPa, several of which at this load have twins, the aspect ratio is develop-ing to 1.5 (𝝈 = 15 MPa), 1.8 (𝝈 = 20 MPa) to a maximum of 1.9 (𝝈 = 30 MPa) illustrated exemplary on the standard specimen (Figure 6). The values of the aspect ratios are shown in Table 5.
Table 5. Aspect ratios of elongated grains.
10 MPa 15 MPa 20 MPa 25 MPa 30 MPa Standard 1 1.5 1.8 1.8 1.9 Miniature 1 1.1 1.2 1.3 1.4
In addition, denuded zones—known from creep experiments on, for example, Zr containing Mg-alloys, e.g., [54–57]—are detected at the grain boundaries oriented perpen-dicular to the loading direction, the size of which is dependent on load and thus from the creep time. As higher the load, as smaller the denuded zones. While in the standard spec-imens at 𝝈 = 10 MPa, the width of the denuded zones 𝒘𝒅𝒛,𝟏𝟎𝑴𝑷𝑨 is approx. 8 to 10 µm (Figure 6a), at 𝝈 = 20 MPa the width 𝒘𝒅𝒛,𝟐𝟎𝑴𝑷𝑨 is approximately 1 to 2 µm (Figure 6c), whereas at 𝝈 = 30 MPa denuded zones are not observed (Figure 6d). In the miniature specimens denuded zones at 𝝈 = 10 MPa the width of the 𝒘𝒅𝒛,𝟏𝟎𝑴𝑷𝑨 is approximately 6 µm. Here, the zones are detectable up to 𝝈 = 20 MPa .
(a) (b)
(c) (d)
Figure 6. Longitudinal sections of crept standard samples, microstructure at different mechanical loads, (a) 10 MPa, (b) 15 MPa, (c) 20 MPa, (d) 30 MPa.
Figure 6. Longitudinal sections of crept standard samples, microstructure at different mechanical loads, (a) 10 MPa,(b) 15 MPa, (c) 20 MPa, (d) 30 MPa.
Table 5. Aspect ratios of elongated grains.
10 MPa 15 MPa 20 MPa 25 MPa 30 MPa
Standard 1 1.5 1.8 1.8 1.9Miniature 1 1.1 1.2 1.3 1.4
In addition, denuded zones—known from creep experiments on, for example, Zrcontaining Mg-alloys, e.g., [54–57]—are detected at the grain boundaries oriented perpen-dicular to the loading direction, the size of which is dependent on load and thus from thecreep time. As higher the load, as smaller the denuded zones. While in the standard speci-mens at σ = 10 MPa, the width of the denuded zones wdZ, 10MPA is approx. 8 to 10 µm(Figure 6a), at σ = 20 MPa the width wdZ, 20MPA is approximately 1 to 2 µm (Figure 6c),whereas at σ = 30 MPa denuded zones are not observed (Figure 6d). In the miniaturespecimens denuded zones at σ = 10 MPa the width of the wdZ, 10MPA is approximately6 µm. Here, the zones are detectable up to σ = 20 MPa.
Further investigations on the denuded zones are carried out by SE imaging and EDSmeasurements analyzing the structure and chemical composition. Due to large, denudedzones, the measurements were performed on a standard specimen loaded at σ = 10 MPa.Different grey values in the SE image already indicate an inhomogeneous distribution of theelements (Figure 7a). A pile-up of Mn-particles at grain boundaries parallel to the loadingaxis is detected (red arrow). An EDS mapping illustrates a depletion of the alloying elementmanganese in the denuded zone (Figure 7b) qualitatively. Quantitatively EDS single pointmeasurements verify that the Mn concentration in the denuded zone is about 0.1 at%, whereasin the grains 0.8 at% to 0.9 at% are measured. Therefore, EDS line scans parallel to loadingdirection are conducted, showing in the adjacent grains (left and right) to the denuded zonesthat the Mn concentration and distribution are different. According to the line scan shown in

Crystals 2021, 11, 918 11 of 21
Figure 7c in the grain on the left from point (1), the Mn concentration is constant at an averageof approx. 0.8 at%. Between the points (1) and (2)—the denuded zone—the Mn concentrationdrops to zero. To the right of point (2), there is a continuous increase in the Mn concentration,which initially fluctuates around an average of 2.5 at%, abruptly dropping back to the alreadyknown approx. 0.8 at%. The area around point (3) is enriched by Mn-precipitates markedwith arrows in the SE image (Figure 7c, left side), explaining the concentration fluctuationsaround a mean value. The different Mn concentrations in the respective areas are assumed tobe due to a directional diffusion of Mn.
Crystals 2021, 11, x FOR PEER REVIEW 11 of 21
Further investigations on the denuded zones are carried out by SE imaging and EDS measurements analyzing the structure and chemical composition. Due to large, denuded zones, the measurements were performed on a standard specimen loaded at 𝜎 = 10 MPa. Different grey values in the SE image already indicate an inhomogeneous distribution of the elements (Figure 7a). A pile-up of Mn-particles at grain boundaries parallel to the loading axis is detected (red arrow). An EDS mapping illustrates a depletion of the alloy-ing element manganese in the denuded zone (Figure 7b) qualitatively. Quantitatively EDS single point measurements verify that the Mn concentration in the denuded zone is about 0.1 at%, whereas in the grains 0.8 at% to 0.9 at% are measured. Therefore, EDS line scans parallel to loading direction are conducted, showing in the adjacent grains (left and right) to the denuded zones that the Mn concentration and distribution are different. According to the line scan shown in Figure 7c in the grain on the left from point (1), the Mn concen-tration is constant at an average of approx. 0.8 at%. Between the points (1) and (2)—the denuded zone—the Mn concentration drops to zero. To the right of point (2), there is a continuous increase in the Mn concentration, which initially fluctuates around an average of 2.5 at%, abruptly dropping back to the already known approx. 0.8 at%. The area around point (3) is enriched by Mn-precipitates marked with arrows in the SE image (Figure 7c, left side), explaining the concentration fluctuations around a mean value. The different Mn concentrations in the respective areas are assumed to be due to a directional diffusion of Mn.
(a) (b)
(c)
Figure 7. SEM, denuded zone, (a) SE image, (b) EDX-mapping of Mn + Mg, (c) EDS-line scan.
Additionally to the grain morphology and the denuded zones, the creep voids are characterized by shape and distribution. It has to be noticed, detailed analysis of the po-rosity fraction is not the subject of this work. The creep voids form preferentially at grain boundaries oriented perpendicular to the loading direction (Figure 6). Figures 8a–c show the longitudinal sections of a standard creep specimen at 𝜎 = 20 MPa. Next to the fracture surface a higher porosity is observed (Figure 8a). As already visually is apparent, with
Figure 7. SEM, denuded zone, (a) SE image, (b) EDX-mapping of Mn + Mg, (c) EDS-line scan.
Additionally to the grain morphology and the denuded zones, the creep voids arecharacterized by shape and distribution. It has to be noticed, detailed analysis of theporosity fraction is not the subject of this work. The creep voids form preferentially at grainboundaries oriented perpendicular to the loading direction (Figure 6). Figure 8a–c showthe longitudinal sections of a standard creep specimen at σ = 20 MPa. Next to the fracturesurface a higher porosity is observed (Figure 8a). As already visually is apparent, withincreasing distance from the fracture surface, a gradual decrease in void number and sizeoccurs (Figure 8a–c). This behavior is detected in all measured specimens and thus appearsto be independent of load. The shape of individual voids is predominantly elliptical, withthe longitudinal axis oriented perpendicular to the loading direction. The same behavior isobserved in the miniature creep samples, too (Figure 8d).

Crystals 2021, 11, 918 12 of 21
Crystals 2021, 11, x FOR PEER REVIEW 12 of 21
increasing distance from the fracture surface, a gradual decrease in void number and size occurs (Figure 8a–c). This behavior is detected in all measured specimens and thus ap-pears to be independent of load. The shape of individual voids is predominantly elliptical, with the longitudinal axis oriented perpendicular to the loading direction. The same be-havior is observed in the miniature creep samples, too (Figure 8d).
Figure 8. Creep damage, 20 MPa, longitudinal section; (a–c) standard specimen, (a) near fracture surface, (b) 5 mm distance to fracture surface, (c) 10 mm distance to fracture surface; (d) miniature specimen.
4. Discussion 4.1. Validation of Creep Experiments
As only a few experiments, the creep test using standard geometries merely once and with miniature specimens only one repetition test each, are performed the plausibility of the individual creep experiments is verified using the modified Monkman–Grant relation-ship [58]: 𝐭𝐟𝐫 = 𝐂′ ∙ 𝛆𝐟𝐫𝛆𝐦𝐢𝐧𝐦 (4)
The ratio 𝜺𝒇𝒓 𝒕𝒇𝒓⁄ is plotted against 𝜺𝒎𝒊𝒏 in double logarithmic scale (Figure 9). Here, according to [58] the exponent 𝒎′ is proven and found to be 1. The error limits of
(d)
Figure 8. Creep damage, 20 MPa, longitudinal section; (a–c) standard specimen, (a) near frac-ture surface, (b) 5 mm distance to fracture surface, (c) 10 mm distance to fracture surface;(d) miniature specimen.
4. Discussion4.1. Validation of Creep Experiments
As only a few experiments, the creep test using standard geometries merely onceand with miniature specimens only one repetition test each, are performed the plausibil-ity of the individual creep experiments is verified using the modified Monkman–Grantrelationship [58]:
tfr =C′·εfr
.ε
m′min
(4)
The ratio εfr/tfr is plotted against.εmin in double logarithmic scale (Figure 9). Here,
according to [58] the exponent m′ is proven and found to be 1. The error limits of thestandard specimen tests are estimated from the error limits calculated by the test repetitionsof the miniature creep experiments.

Crystals 2021, 11, 918 13 of 21
Crystals 2021, 11, x FOR PEER REVIEW 13 of 21
the standard specimen tests are estimated from the error limits calculated by the test rep-etitions of the miniature creep experiments.
Figure 9. Illustration of the modified Monkman–Grant equation.
For both the standard and the miniature creep tests, a linear relationship can be de-termined for the individual measuring points using a regression coefficient 𝑹². The coef-ficients 𝑹𝟐 = 0.995 for the standard specimens and 𝑹𝟐 = 0.998 for the miniature speci-mens are observed. Thus, the validity of the individual tests is demonstrated, although, for the standard experiments, no repetitions are carried out. This is particularly relevant for validating the result of the creep test with standard geometry at 𝝈 = 30 MPa, marked by an arrow in Figure 9. As the value of 𝜺𝒎𝒊𝒏 = 5.9 × 10⁻⁵ s−1 is slightly above the theoret-ical limit of creep tests of 𝜺𝒎𝒊𝒏 = 5.0 × 10⁻⁵ s−1, according to Maier identifying the transition to the power-law-breakdown [53]. However, due to the sufficiently accurate position on the regression line, the test can be used to characterize the creep behavior and determine the Norton stress exponent (cf. Section 4.3).
4.2. Test Procedure As the sequence of the creep test procedure of the miniature creep device due to its
design is not variable, the applicability to the standard specimen in a commercial test rig is validated. The force application is different in both test rigs, in the miniature device by spring and in the DSM 6102 test rig by an electric motor. The latter ensures constant force application to the specimen throughout the test. However, in the miniature creep device, the spring expands according to the elongation of the specimen. As a result, the loading force decreases proportionally to the specimen strain, while at the same time, the cross-section of the specimen is reduced. For low creep strains 𝜺 < 0.4, a change in mechanical loading of 5% is calculated. Consequently, the expansion of the spring can be neglected so that the assumption of force constancy can be justified (cf. [46]).
The change in the sequence of mechanical and thermal load application compared to the standard test procedure compliant to DIN EN ISO 204 in the varied test procedure according to the miniature device in the primary stage of the creep curve an untypical behavior occurs (cf. Figure 3). Plotting the curves of the creep strain and the creep rate in comparison to the specimen temperature, the atypical behavior in the primary creep stage is illustrated (Figure 10). It is found that the behavior of the strain and strain rate curve within the first quarter of an hour in all tested specimens independent from the mechani-cal load is the same. However, the characteristic of the curves depends on the amount of
Figure 9. Illustration of the modified Monkman–Grant equation.
For both the standard and the miniature creep tests, a linear relationship can bedetermined for the individual measuring points using a regression coefficient R2. Thecoefficients R2 = 0.995 for the standard specimens and R2 = 0.998 for the miniaturespecimens are observed. Thus, the validity of the individual tests is demonstrated, although,for the standard experiments, no repetitions are carried out. This is particularly relevant forvalidating the result of the creep test with standard geometry at σ = 30 MPa, marked byan arrow in Figure 9. As the value of
.εmin = 5.9 × 10⁻⁵ s−1 is slightly above the theoretical
limit of creep tests of.εmin = 5.0 × 10⁻⁵ s−1, according to Maier identifying the transition
to the power-law-breakdown [53]. However, due to the sufficiently accurate position onthe regression line, the test can be used to characterize the creep behavior and determinethe Norton stress exponent (cf. Section 4.3).
4.2. Test Procedure
As the sequence of the creep test procedure of the miniature creep device due to itsdesign is not variable, the applicability to the standard specimen in a commercial test rigis validated. The force application is different in both test rigs, in the miniature deviceby spring and in the DSM 6102 test rig by an electric motor. The latter ensures constantforce application to the specimen throughout the test. However, in the miniature creepdevice, the spring expands according to the elongation of the specimen. As a result, theloading force decreases proportionally to the specimen strain, while at the same time,the cross-section of the specimen is reduced. For low creep strains ε < 0.4, a change inmechanical loading of 5% is calculated. Consequently, the expansion of the spring can beneglected so that the assumption of force constancy can be justified (cf. [46]).
The change in the sequence of mechanical and thermal load application comparedto the standard test procedure compliant to DIN EN ISO 204 in the varied test procedureaccording to the miniature device in the primary stage of the creep curve an untypicalbehavior occurs (cf. Figure 3). Plotting the curves of the creep strain and the creep ratein comparison to the specimen temperature, the atypical behavior in the primary creepstage is illustrated (Figure 10). It is found that the behavior of the strain and strain ratecurve within the first quarter of an hour in all tested specimens independent from themechanical load is the same. However, the characteristic of the curves depends on theamount of the mechanical load. It is assumed that in the very early primary creep stage,the strain and strain rate is essentially determined by the heating-up process than bytime-dependent plastic deformation as described by Weertman [59,60], Cottrell [61], andthe literature [53,62]. The investigation of the detailed microstructural processes at this

Crystals 2021, 11, 918 14 of 21
stage is not the subject of this work. At the latest, when the test temperature and thermalequilibrium are reached, the strain and strain rate curves follow the typical creep curveshapes (cf. Figure 3), which is in good agreement with [10,12,46]. From this, it can beconcluded, in the varied creep test procedure already in the later primary creep stage, theknown hardening and softening mechanisms of the creep process correspond to those inthe standard test procedure according to DIN EN ISO 204.
Crystals 2021, 11, x FOR PEER REVIEW 14 of 21
the mechanical load. It is assumed that in the very early primary creep stage, the strain and strain rate is essentially determined by the heating-up process than by time-depend-ent plastic deformation as described by Weertman [59,60], Cottrell [61], and the literature [53,62]. The investigation of the detailed microstructural processes at this stage is not the subject of this work. At the latest, when the test temperature and thermal equilibrium are reached, the strain and strain rate curves follow the typical creep curve shapes (cf. Figure 3), which is in good agreement with [10,12,46]. From this, it can be concluded, in the varied creep test procedure already in the later primary creep stage, the known hardening and softening mechanisms of the creep process correspond to those in the standard test pro-cedure according to DIN EN ISO 204.
Figure 10. Comparison of the curves of true strain, true strain rate, and specimen temperature in the early primary creep stage.
4.3. Creep Behavior The creep parameters (cf. Table 4) of the miniature and standard geometry experi-
ments taken from the true strain and true strain rate curves show differences: for the min-iature specimens 𝜺𝒇𝒓 and 𝜺𝒎𝒊𝒏 are shifted to lower values, 𝒕𝒇𝒓 is higher by a factor of about 2 to 2.5, the proportion of the secondary creep stage of the total creep curve is per-centual higher, and 𝒁 only half compared to the creep experiments with the standard specimen (Figure 11). Analyzing the creep parameters in detail, the true strain at fracture 𝜺𝒇𝒓 for the standard specimens indicate no dependency from the mechanical stress. In contrast 𝜺𝒇𝒓 of the miniature specimen within the error limits decreases with increasing stress (Figure 11a). The latter behavior is also known from the literature [52,53,62]. How-ever, due to the small number of experiments—the standard experiments are carried out once, and the miniature experiments twice for each stress loading—the error limits are taken as an average from all miniature creep experiments are high. However, as it can be derived from Figure 4d in a single case, the difference can be much higher. As repeating measurements of standard specimens are missing here, qualitatively, the tendency to lower values of 𝜺𝒇𝒓 as a function of 𝝈 for the miniature compared to the standard speci-mens can be determined, but a quantification is not possible. Furthermore, lower strain rate values 𝜺𝒎𝒊𝒏 for the miniature compared to the standard specimens are obtained. From the minimum strain rate values the Norton-exponent is determined verifying the creep mechanisms taking place (Figure 11b). A parallel shift of the Norton line to lower creep rates for the miniature specimens occurs. However, within the error limits, the value of the Norton-exponent is the same for both the miniature creep experiments 𝒏𝒎𝒊𝒏𝒊 = 4.9 ± 0.2 and the standard creep experiments 𝒏𝒔𝒕𝒂𝒏𝒅𝒂𝒓𝒅 = 5.1 ± 0.2. Hence, a value of the Nor-ton-exponents of approximately 5 indicates the creep mechanism of dislocation creep for both specimen geometries. The creep diagram in the double-logarithmic scale reveals a linear relationship of 𝝈 and 𝒕𝒇𝒓 holding the same power (–0.21) independent from the
Figure 10. Comparison of the curves of true strain, true strain rate, and specimen temperature in theearly primary creep stage.
4.3. Creep Behavior
The creep parameters (cf. Table 4) of the miniature and standard geometry experimentstaken from the true strain and true strain rate curves show differences: for the miniaturespecimens εfr and
.εmin are shifted to lower values, tfr is higher by a factor of about 2 to
2.5, the proportion of the secondary creep stage of the total creep curve is percentualhigher, and Z only half compared to the creep experiments with the standard specimen(Figure 11). Analyzing the creep parameters in detail, the true strain at fracture εfr for thestandard specimens indicate no dependency from the mechanical stress. In contrast εfr ofthe miniature specimen within the error limits decreases with increasing stress (Figure 11a).The latter behavior is also known from the literature [52,53,62]. However, due to the smallnumber of experiments—the standard experiments are carried out once, and the miniatureexperiments twice for each stress loading—the error limits are taken as an average from allminiature creep experiments are high. However, as it can be derived from Figure 4d in asingle case, the difference can be much higher. As repeating measurements of standardspecimens are missing here, qualitatively, the tendency to lower values of εfr as a functionof σ for the miniature compared to the standard specimens can be determined, but aquantification is not possible. Furthermore, lower strain rate values
.εmin for the miniature
compared to the standard specimens are obtained. From the minimum strain rate values theNorton-exponent is determined verifying the creep mechanisms taking place (Figure 11b).A parallel shift of the Norton line to lower creep rates for the miniature specimens occurs.However, within the error limits, the value of the Norton-exponent is the same for boththe miniature creep experiments nmini =4.9 ± 0.2 and the standard creep experimentsnstandard =5.1 ± 0.2. Hence, a value of the Norton-exponents of approximately 5 indicatesthe creep mechanism of dislocation creep for both specimen geometries. The creep diagramin the double-logarithmic scale reveals a linear relationship of σ and tfr holding the samepower (−0.21) independent from the specimen geometry (Figure 11c). A parallel shift ofthe correlation line to higher values of the miniature specimens is observed here.

Crystals 2021, 11, 918 15 of 21
Crystals 2021, 11, x FOR PEER REVIEW 15 of 21
specimen geometry (Figure 11c). A parallel shift of the correlation line to higher values of the miniature specimens is observed here.
(a) (b)
(c)
Figure 11. Creep parameter, (a) strain at fracture, (b) Norton-exponent, (c) creep diagram.
Lower 𝜺𝒇𝒓 and 𝜺𝒎𝒊𝒏, higher 𝒕𝒇𝒓, shifting of the Norton line and curve of creep rup-ture strength to higher values and lower 𝒁 indicate a higher creep resistance of the min-iature specimens than standard specimens. The mechanisms behind, are discussed in the following section.
4.4. Creep Mechanisms As shown in Section 4.3, the creep parameters determined by miniature experiments
are not arbitrarily different from the determined creep parameters of the standard speci-mens but have systematic differences. This is taken from parallel shifts of the Norton line to lower creep rates and the creep rupture strength to higher values for the miniature specimens. While in the work of Kurumlu et al. [10,11] and Mälzer et al. [12], no size de-pendence of creep parameter of miniature and standard specimens is found, on the other hand nevertheless this is described by Olbricht et al. [9], Krompholz et al. [63], Schmieder [64], Camin [46], and Dymácek et al. [65]. Altogether, the results are inconsistent. In [46], the same miniature creep device as in this work was used. Consequently, the specimen dimensions and test procedure are the same; however, the heating in [46] was faster. As well as here, in [46], systematic deviation of the miniature creep experiments compared to standard experiments is determined from the values from the literature [66]. Neverthe-less, different from here, the minimum creep rates of the miniature experiments show higher values. In [46], the creep behavior of metal matrix composites (MMC) materials was investigated in situ during creep by µ-tomography at the ESRF. An influence of the material can be excluded since [10,11] investigated the same class of material, obtaining contrary results. However, certainly miniaturized flat tensile specimens exhibiting a ratio of 𝒍𝟎 𝒅𝟎 ≈⁄ 6 were used by [10,11], whereas [46] used miniaturized cylindrical specimens with a ratio of 𝒍𝟎 𝒅𝟎⁄ = 1. Cao et al. compared flat and mild notched cylindrical specimens under uniaxial load [67]. The notched cylindrical specimens with dimensions very similar
Figure 11. Creep parameter, (a) strain at fracture, (b) Norton-exponent, (c) creep diagram.
Lower εfr and.εmin, higher tfr, shifting of the Norton line and curve of creep rupture
strength to higher values and lower Z indicate a higher creep resistance of the minia-ture specimens than standard specimens. The mechanisms behind, are discussed in thefollowing section.
4.4. Creep Mechanisms
As shown in Section 4.3, the creep parameters determined by miniature experimentsare not arbitrarily different from the determined creep parameters of the standard spec-imens but have systematic differences. This is taken from parallel shifts of the Nortonline to lower creep rates and the creep rupture strength to higher values for the miniaturespecimens. While in the work of Kurumlu et al. [10,11] and Mälzer et al. [12], no size depen-dence of creep parameter of miniature and standard specimens is found, on the other handnevertheless this is described by Olbricht et al. [9], Krompholz et al. [63], Schmieder [64],Camin [46], and Dymácek et al. [65]. Altogether, the results are inconsistent. In [46],the same miniature creep device as in this work was used. Consequently, the specimendimensions and test procedure are the same; however, the heating in [46] was faster. Aswell as here, in [46], systematic deviation of the miniature creep experiments comparedto standard experiments is determined from the values from the literature [66]. Never-theless, different from here, the minimum creep rates of the miniature experiments showhigher values. In [46], the creep behavior of metal matrix composites (MMC) materialswas investigated in situ during creep by µ-tomography at the ESRF. An influence of thematerial can be excluded since [10,11] investigated the same class of material, obtainingcontrary results. However, certainly miniaturized flat tensile specimens exhibiting a ratio ofl0/d0 ≈ 6 were used by [10,11], whereas [46] used miniaturized cylindrical specimens witha ratio of l0/d0 = 1. Cao et al. compared flat and mild notched cylindrical specimens underuniaxial load [67]. The notched cylindrical specimens with dimensions very similar to thespecimens used in this work and [46] exhibited less strain than the flat samples [67], asobserved here also. Cao et al. attributed this behavior to multiaxial stress states occurring

Crystals 2021, 11, 918 16 of 21
in the notch. A multiaxial stress state in the miniature specimens used here may be oneexplanation for the higher creep resistance measured here. Furthermore, based on FEMresults, Cao et al. concluded that unavoidable inaccuracies in manufacturing the miniatureround notch specimens could be tolerated because only a minor influence (≈5%) on thestress parameters characterizing the multiaxial stress states was found. This may apply tomanufacturing tolerances, but not to changes in microstructure due to manufacturing, e.g.,twins, as detected in this work and discussed below. Twinned grains and dislocations in-duced by cold working during manufacturing are beneficial for creep resistance interferingwith dislocation movement.
The microstructural aspect has already been studied in other works. In ASTM E139 [8],it is assumed that specimen size effects expected to specimen miniaturization can beexplained by the small number of grains in the specimen volume resulting in a higherimpact of each individual grain orientation. This was investigated by Krompholz et al.using cylindrical specimens of different sizes. The creep parameters achieved, additionallyto size effects, show unsystematic dependencies due to the test temperature and stress [63].Krompholz et al. suggest that the diffusion processes, decisive for creep, are higherweighting in miniaturized specimens than in standard specimens, leading to differences inthe creep parameters. Olbricht et al. in [9] criticized the latter interpretation of Krompholzet al. As it is elusive which diffusion process could be responsible for this.
Consequently, by combining the results from [9–11,46,63,67] and this work as interimresults, it can be noted that not only the geometry of the miniature samples influences thesystematic shift of the creep parameters measured here. As the effect of faster heating wasnot investigated in this work, the possible effect cannot be evaluated. Thus, comparativeminiature creep experiments to standard geometries allow a qualitative characterization ofthe creep behavior due to the systematic deviations. In contrast, a direct comparison ofquantitative parameters is not possible without knowledge and explanation of the reasonsfor the systematic deviation.
Hence, within this work’s scope, comparative microstructural investigations of non-creep-stressed and creep-stressed miniature and standard specimens are carried out. Aftersample manufacturing, a significantly higher number of twins are detected in the miniaturecreep specimens (Ø 1 mm) than in the specimens with standard geometry (Ø 6 mm) dueto higher stress by the centering mandrel and the machining, since the forces affectinga smaller cross-sectional area (cf. Figure 5). The observation of an increased number oftwinned grains in the miniature specimens is therefore relevant, because in the work ofRandle [68] and Alexandreanu et al. [69] in the context of “grain-boundary-engineering”an indirect influence of twins on material properties such as corrosion, ductility and creepstrength are assumed. While Randle mentioned an influence by Σ3 oriented CoincidenceSite Lattice (CSL) grain boundaries (twins) on creep properties in cubic materials, thestudies of Alexandreanu et al. validating the Thaveeprungsriporn model [70] indicatethat a reduced creep rate can be observed at increased Coincidence Site Lattice Boundary(CSLB) fractions in cubic crystal systems. These findings support the results of this work.
Furthermore, the microstructural investigations reveal a systematically increasednecking at fracture Z by a factor of 2 for the creep-stressed standard compared to miniaturespecimens. The fracture necking attributed to the ductility of the material is stronglydependent on creep damage. Elliptical pores are formed at grain boundaries orientedperpendicular to the loading axis (cf. Figures 6 and 8). According to Cocks and Ashby [71],this is evidence of void growth by surface diffusion. As these voids act as small cracks, thedamage in the miniature specimens due to their small size must be weighted more than inthe standard specimen. This can explain the low fracture necking.
The stress-dependent Norton-exponent n = 5 indicating plastic deformation is typ-ically associated with dislocation creep (cf. Section 4.3). Additionally, grain elongationoriented parallel to the load can be seen in the optical micrographs. This grain elongationcan be explained by both plastic deformations due to dislocation movements and diffusionprocesses. According to Rösler et al. [52] and Kassner [72], increased concentration of
Crystals 2021, 11, 918 17 of 21
vacancies can be expected at grain boundaries oriented perpendicular to the load. As aresult, a mass flow occurs in the direction of the tensile load, causing a grain shape change,which is also detected here.
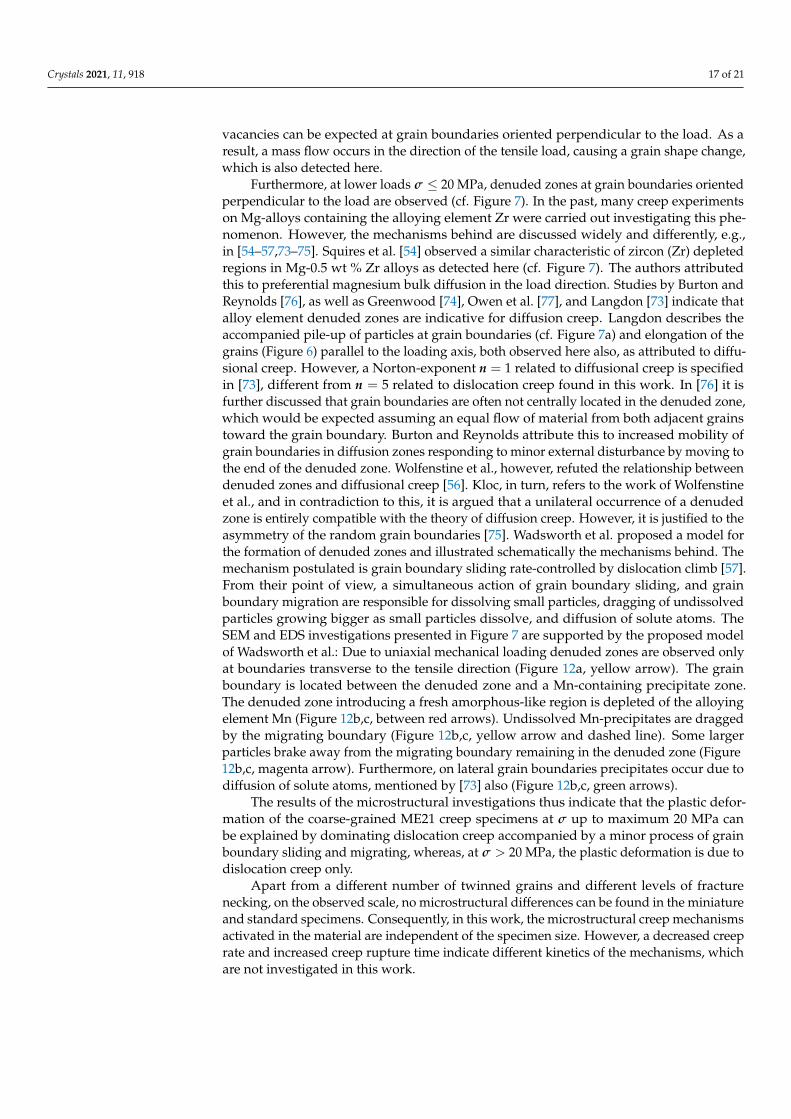
Furthermore, at lower loads σ ≤ 20 MPa, denuded zones at grain boundaries orientedperpendicular to the load are observed (cf. Figure 7). In the past, many creep experimentson Mg-alloys containing the alloying element Zr were carried out investigating this phe-nomenon. However, the mechanisms behind are discussed widely and differently, e.g.,in [54–57,73–75]. Squires et al. [54] observed a similar characteristic of zircon (Zr) depletedregions in Mg-0.5 wt % Zr alloys as detected here (cf. Figure 7). The authors attributedthis to preferential magnesium bulk diffusion in the load direction. Studies by Burton andReynolds [76], as well as Greenwood [74], Owen et al. [77], and Langdon [73] indicate thatalloy element denuded zones are indicative for diffusion creep. Langdon describes theaccompanied pile-up of particles at grain boundaries (cf. Figure 7a) and elongation of thegrains (Figure 6) parallel to the loading axis, both observed here also, as attributed to diffu-sional creep. However, a Norton-exponent n = 1 related to diffusional creep is specifiedin [73], different from n = 5 related to dislocation creep found in this work. In [76] it isfurther discussed that grain boundaries are often not centrally located in the denuded zone,which would be expected assuming an equal flow of material from both adjacent grainstoward the grain boundary. Burton and Reynolds attribute this to increased mobility ofgrain boundaries in diffusion zones responding to minor external disturbance by moving tothe end of the denuded zone. Wolfenstine et al., however, refuted the relationship betweendenuded zones and diffusional creep [56]. Kloc, in turn, refers to the work of Wolfenstineet al., and in contradiction to this, it is argued that a unilateral occurrence of a denudedzone is entirely compatible with the theory of diffusion creep. However, it is justified to theasymmetry of the random grain boundaries [75]. Wadsworth et al. proposed a model forthe formation of denuded zones and illustrated schematically the mechanisms behind. Themechanism postulated is grain boundary sliding rate-controlled by dislocation climb [57].From their point of view, a simultaneous action of grain boundary sliding, and grainboundary migration are responsible for dissolving small particles, dragging of undissolvedparticles growing bigger as small particles dissolve, and diffusion of solute atoms. TheSEM and EDS investigations presented in Figure 7 are supported by the proposed modelof Wadsworth et al.: Due to uniaxial mechanical loading denuded zones are observed onlyat boundaries transverse to the tensile direction (Figure 12a, yellow arrow). The grainboundary is located between the denuded zone and a Mn-containing precipitate zone.The denuded zone introducing a fresh amorphous-like region is depleted of the alloyingelement Mn (Figure 12b,c, between red arrows). Undissolved Mn-precipitates are draggedby the migrating boundary (Figure 12b,c, yellow arrow and dashed line). Some largerparticles brake away from the migrating boundary remaining in the denuded zone (Figure12b,c, magenta arrow). Furthermore, on lateral grain boundaries precipitates occur due todiffusion of solute atoms, mentioned by [73] also (Figure 12b,c, green arrows).
The results of the microstructural investigations thus indicate that the plastic defor-mation of the coarse-grained ME21 creep specimens at σ up to maximum 20 MPa canbe explained by dominating dislocation creep accompanied by a minor process of grainboundary sliding and migrating, whereas, at σ > 20 MPa, the plastic deformation is due todislocation creep only.
Apart from a different number of twinned grains and different levels of fracturenecking, on the observed scale, no microstructural differences can be found in the miniatureand standard specimens. Consequently, in this work, the microstructural creep mechanismsactivated in the material are independent of the specimen size. However, a decreased creeprate and increased creep rupture time indicate different kinetics of the mechanisms, whichare not investigated in this work.

Crystals 2021, 11, 918 18 of 21
Crystals 2021, 11, x FOR PEER REVIEW 18 of 22
diffusion processes. According to Rösler et al. [52] and Kassner [72], increased concentration of vacancies can be expected at grain boundaries oriented perpendicular to the load. As a result, a mass flow occurs in the direction of the tensile load, causing a grain shape change, which is also detected here.
Furthermore, at lower loads 𝝈 ≤ 20 MPa, denuded zones at grain boundaries oriented perpendicular to the load are observed (cf. Figure 7). In the past, many creep experiments on Mg-alloys containing the alloying element Zr were carried out investigating this phenomenon. However, the mechanisms behind are discussed widely and differently, e.g., in [54–57,73–75]. Squires et al. [54] observed a similar characteristic of zircon (Zr) depleted regions in Mg-0.5 wt % Zr alloys as detected here (cf. Figure 7). The authors attributed this to preferential magnesium bulk diffusion in the load direction. Studies by Burton and Reynolds [76], as well as Greenwood [74], Owen et al. [77], and Langdon [73] indicate that alloy element denuded zones are indicative for diffusion creep. Langdon describes the accompanied pile-up of particles at grain boundaries (cf. Figure 7a) and elongation of the grains (Figure 6) parallel to the loading axis, both observed here also, as attributed to diffusional creep. However, a Norton-exponent 𝒏 = 1 related to diffusional creep is specified in [73], different from 𝒏 = 5 related to dislocation creep found in this work. In [76] it is further discussed that grain boundaries are often not centrally located in the denuded zone, which would be expected assuming an equal flow of material from both adjacent grains toward the grain boundary. Burton and Reynolds attribute this to increased mobility of grain boundaries in diffusion zones responding to minor external disturbance by moving to the end of the denuded zone. Wolfenstine et al., however, refuted the relationship between denuded zones and diffusional creep [56]. Kloc, in turn, refers to the work of Wolfenstine et al., and in contradiction to this, it is argued that a unilateral occurrence of a denuded zone is entirely compatible with the theory of diffusion creep. However, it is justified to the asymmetry of the random grain boundaries [75]. Wadsworth et al. proposed a model for the formation of denuded zones and illustrated schematically the mechanisms behind. The mechanism postulated is grain boundary sliding rate-controlled by dislocation climb [57]. From their point of view, a simultaneous action of grain boundary sliding, and grain boundary migration are responsible for dissolving small particles, dragging of undissolved particles growing bigger as small particles dissolve, and diffusion of solute atoms. The SEM and EDS investigations presented in Figure 7 are supported by the proposed model of Wadsworth et al.: Due to uniaxial mechanical loading denuded zones are observed only at boundaries transverse to the tensile direction (Figure 12a, yellow arrow). The grain boundary is located between the denuded zone and a Mn-containing precipitate zone. The denuded zone introducing a fresh amorphous-like region is depleted of the alloying element Mn (Figure 12b,c, between red arrows). Undissolved Mn-precipitates are dragged by the migrating boundary (Figure 12b,c, yellow arrow and dashed line). Some larger particles brake away from the migrating boundary remaining in the denuded zone (Figure 12b,c, magenta arrow). Furthermore, on lateral grain boundaries precipitates occur due to diffusion of solute atoms, mentioned by [73] also (Figure 12b,c, green arrows).
(a)
Crystals 2021, 11, x FOR PEER REVIEW 19 of 22
(b) (c)
Figure 12. Microstructure after creep, 𝜎 = 10 MPa: (a) OM, yellow arrows: denuded zones; (b,c) EDS measurements, blue arrow indicates the line scan, Mn depleted zones between red arrows, yellow dashed line: migration grain boundary, yellow arrow: undissolved Mn-precipitates, magenta arrow: large Mn-particles, green arrows: Mn-precipitates on grain boundaries
The results of the microstructural investigations thus indicate that the plastic deformation of the coarse-grained ME21 creep specimens at 𝝈 up to maximum 20 MPa can be explained by dominating dislocation creep accompanied by a minor process of grain boundary sliding and migrating, whereas, at 𝝈 > 20 MPa, the plastic deformation is due to dislocation creep only.
Apart from a different number of twinned grains and different levels of fracture necking, on the observed scale, no microstructural differences can be found in the miniature and standard specimens. Consequently, in this work, the microstructural creep mechanisms activated in the material are independent of the specimen size. However, a decreased creep rate and increased creep rupture time indicate different kinetics of the mechanisms, which are not investigated in this work.
5. Conclusion Comparative uniaxial creep measurements on miniature and standard specimens of
different geometries on hot extruded and heat treated ME21 magnesium alloy are performed according to the test procedure of a miniature creep device initially developed for in situ XCT experiments. The sequence of loading of the test procedure (mechanical load → heating) different from the standard creep test (heating → mechanical loading) lead to a different creep behavior in the very early primary creep stage. However, the higher initial creep strain of the miniature samples is associated with the miniature creep device and does not affect the entire creep behavior. Overall, in all experiments—miniature and standard—a typical primary, secondary, and tertiary creep behavior are observed. Hence, the applicated test procedure provides reliable results.
The main creep mechanism is identified as dislocation creep, at lower stresses accompanied by grain boundary sliding and migrating of minor influence, occurring identically in both specimen geometries and, thus, is independent of specimen size.
However, the analyses of the creep parameters detect a higher creep resistance for the miniature creep specimens. A higher number of twinned grains originated by the manufacturing process indicates a higher work hardening interfering with the dislocation movement, being beneficial for creep resistance. Therefore, it can be assumed, a higher fraction of twinned grains within the gauge volume gains more importance in small specimens. In addition, in a notch-like gauge volume of the miniature specimens, an emerging multiaxial stress state is possible. Therefore, the higher creep resistance of the miniature specimens measured here is probably dependent on both the twinned grains and geometry in the gauge volume. In a good approximation, the creep behavior of a material can be determined by miniature creep specimens; however, a direct comparison
Figure 12. Microstructure after creep, σ = 10 MPa: (a) OM, yellow arrows: denuded zones; (b,c) EDS measurements,blue arrow indicates the line scan, Mn depleted zones between red arrows, yellow dashed line: migration grain boundary,yellow arrow: undissolved Mn-precipitates, magenta arrow: large Mn-particles, green arrows: Mn-precipitates on grainboundaries.
5. Conclusion
Comparative uniaxial creep measurements on miniature and standard specimensof different geometries on hot extruded and heat treated ME21 magnesium alloy areperformed according to the test procedure of a miniature creep device initially developedfor in situ XCT experiments. The sequence of loading of the test procedure (mechanicalload→ heating) different from the standard creep test (heating→mechanical loading) leadto a different creep behavior in the very early primary creep stage. However, the higherinitial creep strain of the miniature samples is associated with the miniature creep deviceand does not affect the entire creep behavior. Overall, in all experiments—miniature andstandard—a typical primary, secondary, and tertiary creep behavior are observed. Hence,the applicated test procedure provides reliable results.
The main creep mechanism is identified as dislocation creep, at lower stresses accom-panied by grain boundary sliding and migrating of minor influence, occurring identicallyin both specimen geometries and, thus, is independent of specimen size.
However, the analyses of the creep parameters detect a higher creep resistance forthe miniature creep specimens. A higher number of twinned grains originated by themanufacturing process indicates a higher work hardening interfering with the dislocationmovement, being beneficial for creep resistance. Therefore, it can be assumed, a higherfraction of twinned grains within the gauge volume gains more importance in smallspecimens. In addition, in a notch-like gauge volume of the miniature specimens, anemerging multiaxial stress state is possible. Therefore, the higher creep resistance of theminiature specimens measured here is probably dependent on both the twinned grainsand geometry in the gauge volume. In a good approximation, the creep behavior of amaterial can be determined by miniature creep specimens; however, a direct comparisonof quantitative creep parameters is not possible without the knowledge and explanation ofthe reasons for systematic deviations.

Crystals 2021, 11, 918 19 of 21
Author Contributions: Conceptualization, B.C.; methodology, B.C.; validation, M.G.; formal analysis,B.C. and M.G.; investigation, B.C.; writing—original draft preparation, B.C. and M.G.; writing—review and editing, B.C. and M.G.; visualization, B.C. and M.G. All authors have read and agreed tothe published version of the manuscript.
Funding: The publication of this article was funded by the Open Access publication fund of theTechnische Universität Berlin.
Acknowledgments: We acknowledge support from the Open Access publication fund of the Tech-nische Universität Berlin and the Extrusion Research and Development Center of the TechnischeUniversität Berlin (FZS) for providing the material.
Conflicts of Interest: The authors declare no conflict of interest.
References1. MacLeod, S.; Errandonea, D.; Cox, G.A.; Cynn, H.; Daisenberger, D.; Finnegan, S.; McMahon, M.; Munro, K.; Popescu, C.;
Storm, C. The phase diagram of Ti-6Al-4V at high-pressures and high-temperatures. J. Phys. Condens. Matter 2021. [CrossRef]2. Smith, D.; Joris, O.P.J.; Sankaran, A.; Weekes, H.E.; Bull, D.J.; Prior, T.J.; Dye, D.; Errandonea, D.; Proctor, J.E. On the high-pressure
phase stability and elastic properties of β-titanium alloys. J. Phys. Condens. Matter 2017, 29, 155401. [CrossRef]3. Dorward, R.C.; Pritchett, T.R. Advanced aluminium alloys for aircraft and aerospace applications. Mater. Des. 1988, 9, 63–69.
[CrossRef]4. Wang, G.G.; Bos, J. A study on joining magnesium alloy high pressure die casting components with thread forming fasteners.
J. Magnes. Alloy. 2018, 6, 114–120. [CrossRef]5. Straumal, B.B.; Korneva, A.; Kilmametov, A.R.; Litynska-Dobrzynska, L.; Gornakova, A.S.; Chulist, R.; Karpov, M.I.; Zieba, P.
Structural and Mechanical Properties of Ti−Co Alloys Treated by High Pressure Torsion. Materials 2019, 12, 426. [CrossRef][PubMed]
6. Errandonea, D.; Burakovsky, L.; Preston, D.L.; MacLeod, S.G.; Santamaría-Perez, D.; Chen, S.; Cynn, H.; Simak, S.I.;McMahon, M.I.; Proctor, J.E.; et al. Experimental and theoretical confirmation of an orthorhombic phase transition in niobium athigh pressure and temperature. Commun. Mater. 2020, 1. [CrossRef]
7. DIN EN ISO 204-2019-04—Beuth.de. Available online: https://www.beuth.de/de/norm/din-en-iso-204/289976402 (accessed on8 June 2021).
8. E28 Committee. Test Methods for Conducting Creep, Creep-Rupture, and Stress-Rupture Tests of Metallic Materials; ASTM International:West Conshohocken, PA, USA, 2011.
9. Olbricht, J.; Bismarck, M.; Skrotzki, B. Characterization of the creep properties of heat resistant 9–12% chromium steels byminiature specimen testing. Mater. Sci. Eng. A 2013, 585, 335–342. [CrossRef]
10. Kurumlu, D. Mechanische und Mikrostrukturelle Untersuchungen an Einer Kurzfaserverstärkten Aluminiumlegierung. Ph.D.Thesis, Ruhr-Universität Bochum, Universitätsbibliothek, Bochum, Germany, 2010.
11. Kurumlu, D.; Payton, E.J.; Young, M.L.; Schöbel, M.; Requena, G.; Eggeler, G. High-temperature strength and damage evolutionin short fiber reinforced aluminum alloys studied by miniature creep testing and synchrotron microtomography. Acta Mater. 2012,60, 67–78. [CrossRef]
12. Mälzer, G.; Hayes, R.W.; Mack, T.; Eggeler, G. Miniature Specimen Assessment of Creep of the Single-Crystal Superalloy LEK 94in the 1000 ◦C Temperature Range. Met. Mat. Trans. A 2007, 38, 314–327. [CrossRef]
13. Hiyoshi, N.; Itoh, T.; Sakane, M.; Tsurui, T.; Tsurui, M.; Hisaka, C. Development of miniature cruciform specimen and testingmachine for multiaxial creep investigation. Theor. Appl. Fract. Mech. 2020, 108, 102582. [CrossRef]
14. Hyde, T.H.; Hyde, C.J.; Sun, W. Theoretical basis and practical aspects of small specimen creep testing. J. Strain Anal. Eng. Des.2013, 48, 112–125. [CrossRef]
15. Morris, A.; Cacciapuoti, B.; Sun, W. The role of small specimen creep testing within a life assessment framework for hightemperature power plant. Int. Mater. Rev. 2018, 63, 102–137. [CrossRef]
16. Yu, B.; Han, W.; Tong, Z.; Geng, D.; Wang, C.; Zhao, Y.; Yang, W. Application of Small Specimen Test Technique to Evaluate CreepBehavior of Austenitic Stainless Steel. Materials 2019, 12, 2541. [CrossRef] [PubMed]
17. Chvostová, E.; Džugan, J. Creep test with use of miniaturized specimens. IOP Conf. Ser. Mater. Sci. Eng. 2017, 179, 12032.[CrossRef]
18. Luan, L.; Riesch-Oppermann, H.; Heilmaier, M. Tensile creep of miniaturized specimens. J. Mater. Res. 2017, 32, 4563–4572.[CrossRef]
19. Kammer, C.; Aluminium-Zentrale, D. Düsseldorf Aluminium-Zentrale; Aluminium: Düsseldorf, Germany, 2000; ISBN 3870172649.20. Kielbus, A. The influence of ageing on structure and mechanical properties of WE54 alloy. J. Achiev. Mater. Manuf. Eng. 2007, 1,
27–30.

Crystals 2021, 11, 918 20 of 21
21. von Buch, F. Magnesium-Eigenschaften, Anwendungen, Potentiale: Vortragstexte eines Fortbildungsseminars der DeutschenGesellschaft für Materialkunde e.V. in Zusammenarbeit mit dem Institut für Werkstofforschung des GKSS-ForschungszentrumGeesthacht GmbH. In Eigenschaften von Magnesiumlegierungen und deren Beeinflussung; Kainer, K.U., Ed.; Wiley-VCH: Weinheim,Germany, 2000; ISBN 3527299793.
22. Pekguleryuz, M.O.; Kaya, A.A. Creep Resistant Magnesium Alloys for Powertrain Applications. Adv. Eng. Mater. 2003, 5, 866–878.[CrossRef]
23. Leontis, T.E. The properties of sand cast magnesium-rare earth alloys. JOM 1949, 1, 968–983. [CrossRef]24. Neite, G.; Kubota, K.; Higashi, K.; Hehmann, F. Magnesium-Based Alloys. In Materials Science and Technology; Cahn, R.W.,
Haasen, P., Kramer, E.J., Eds.; Wiley-VCH Verlag GmbH & Co. KGaA: Weinheim, Germany, 2006; ISBN 9783527603978.25. Polmear, I.J. Light Alloys: Metallurgy of the Light Metals, 2nd ed.; Arnold: London, UK, 1989; ISBN 0340491752.26. Kennedy, A.J. The Physical Metallurgy of Magnesium and Its Alloys. J. R. Aeronaut. Soc. 1959, 63, 737–738. [CrossRef]27. Schemme, K. Magnesiumwerkstoffe fur die Neunziger Jahre. Aluminium 1991, 67, 167–178.28. Kurz, G.; Petersen, T.; Bohlen, J.; Letzig, D. Variation of Rare Earth Elements in the Magnesium Alloy ME21 for the Sheet
Production. In Magnesium Technology 2017; Solanki, K.N., Orlov, D., Singh, A., Neelameggham, N.R., Eds.; Springer InternationalPublishing: Berlin/Heidelberg, Germany, 2017; pp. 353–363. ISBN 978-3-319-52391-0.
29. Mo, N.; Tan, Q.; Bermingham, M.; Huang, Y.; Dieringa, H.; Hort, N.; Zhang, M.-X. Current development of creep-resistantmagnesium cast alloys: A review. Mater. Des. 2018, 155, 422–442. [CrossRef]
30. Neh, K.; Ullmann, M.; Oswald, M.; Berge, F.; Kawalla, R. Twin Roll Casting and Strip Rolling of Several Magnesium Alloys. Mater.Today Proc. 2015, 2, S45–S52. [CrossRef]
31. Wang, J.G.; Hsiung, L.M.; Nieh, T.G.; Mabuchi, M. Creep of a heat treated Mg–4Y–3RE alloy. Mater. Sci. Eng. A 2001, 315, 81–88.[CrossRef]
32. Kang, Y.H.; Wang, X.X.; Zhang, N.; Yan, H.; Chen, R.S. Effect of initial temper on the creep behavior of precipitation–hardenedWE43 alloy. Mater. Sci. Eng. A 2017, 689, 419–426. [CrossRef]
33. Automotive. Available online: https://www.hydro.com/en/aluminium/industries/automotive/ (accessed on 22 June 2021).34. How is Aluminum Extrusion used in Auto Industry?|AEC. Available online: https://www.aec.org/page/extrusion-applications-
auto-industry (accessed on 22 June 2021).35. Aluminium Insider. Auto Industry Looks to Aluminum Extrusions for Increased Performance and Cost-Effective Solutions—
Aluminium Insider. Available online: https://aluminiuminsider.com/auto-industry-looks-to-aluminum-extrusions-for-increased-performance-and-cost-effective-solutions/ (accessed on 22 June 2021).
36. Isogai, M.; Murakami, S. Development and application of aluminum extrusion for automotive parts, mainly bumper reinforcement.J. Mater. Process. Technol. 1993, 38, 635–654. [CrossRef]
37. Huppmann, M.; Gall, S.; Müller, S.; Reimers, W. Changes of the texture and the mechanical properties of the extruded Mg alloyME21 as a function of the process parameters. Mater. Sci. Eng. A 2010, 528, 342–354. [CrossRef]
38. Magnesium WE43-T6, Cast. Available online: http://www.matweb.com/search/datasheet.aspx?matguid=4b8a8c13cf354fc5893a40cf8eca022c&ckck=1 (accessed on 23 July 2021).
39. Magnesium WE54-T6, Cast. Available online: http://www.matweb.com/search/datasheet.aspx?matguid=f41ac8bc1ddd4c1d85247e646b3ec2be (accessed on 23 July 2021).
40. Gall, S. Grundlegende Untersuchungen zum Strangpressen von Magnesiumblechen und deren Weiterverarbeitung: Mikrostrukturund mechanische Eigenschaften. DepositOnce 2013. [CrossRef]
41. Müller, S. Weiterentwicklung des Strangpressens von AZ Magnesiumlegierungen im Hinblick auf eine Optimierung der Mikrostruktur, desGefüges und der Mechanischen Eigenschaften, 1st ed.; Cuvillier Verlag: Göttingen, Germany, 2007; ISBN 9783736923706.
42. Brömmelhoff, K.; Huppmann, M.; Reimers, W. The effect of heat treatments on the microstructure, texture and mechanicalproperties of the extruded magnesium alloy ME21. Int. J. Mater. Res. 2011, 102, 1133–1141. [CrossRef]
43. Pyzalla, A.; Camin, B.; Buslaps, T.; Di Michiel, M.; Kaminski, H.; Kottar, A.; Pernack, A.; Reimers, W. Simultaneous tomographyand diffraction analysis of creep damage. Science 2005, 308, 92–95. [CrossRef]
44. Huppmann, M.; Camin, B.; Pyzalla, A.R.; Reimers, W. In-situ observation of creep damage evolution in Al–Al2O3 MMCs bysynchrotron X-ray microtomography. Int. J. Mater. Res. 2010, 101, 372–379. [CrossRef]
45. Camin, B.; Hansen, L. In Situ 3D-µ-Tomography on Particle-Reinforced Light Metal Matrix Composite Materials under CreepConditions. Metals 2020, 10, 1034. [CrossRef]
46. Camin, B. In-situ Untersuchung des Schädigungsverhaltens mehrphasiger Werkstoffe unter thermischer und mechanischerBeanspruchung. DepositOnce 2015. [CrossRef]
47. Borbély, A.; Dzieciol, K.; Sket, F.; Isaac, A.; Di Michiel, M.; Buslaps, T.; Kaysser-Pyzalla, A.R. Characterization of creep and creepdamage by in-situ microtomography. JOM 2011, 63, 78–84. [CrossRef]
48. Isaac, A.; Sket, F.; Reimers, W.; Camin, B.; Sauthoff, G.; Pyzalla, A.R. In situ 3D quantification of the evolution of creep cavity size,shape, and spatial orientation using synchrotron X-ray tomography. Mater. Sci. Eng. A 2008, 478, 108–118. [CrossRef]
49. Isaac, A.; Sket, F.; Borbély, A.; Sauthoff, G.; Pyzalla, A.R. Study of Cavity Evolution During Creep by Synchrotron Microtomogra-phy Using a Volume Correlation Method. Pract. Metallogr. 2008, 45, 242–245. [CrossRef]
50. Stinton, G.W.; MacLeod, S.G.; Cynn, H.; Errandonea, D.; Evans, W.J.; Proctor, J.E.; Meng, Y.; McMahon, M.I. Equation of state andhigh-pressure/high-temperature phase diagram of magnesium. Phys. Rev. B 2014, 90. [CrossRef]

Crystals 2021, 11, 918 21 of 21
51. Abe, F. Development of creep-resistant steels and alloys for use in power plants. Struct. Alloy. Power Plants 2014, 250–293.[CrossRef]
52. Rösler, J.; Harders, H.; Bäker, M. Mechanisches Verhalten der Werkstoffe, 6th ed.; Springer Vieweg: Wiesbaden, Germany, 2019;ISBN 9783658268015.
53. Maier, H.J.; Niendorf, T.; Bürgel, R. Handbuch Hochtemperatur-Werkstofftechnik: Grundlagen, Werkstoffbeanspruchungen, Hochtemper-aturlegierungen und -beschichtungen, 6th ed.; Springer Vieweg: Wiesbaden, Germany, 2019; ISBN 3658253134.
54. Squires, R.L.; Weiner, R.T.; Phillips, M. Grain-boundary denuded zones in a magnesium-wt% zirconium alloy. J. Nucl. Mater.1963, 8, 77–80. [CrossRef]
55. Poirier, J.-P. Creep of Crystals; Cambridge University Press (CUP): London, UK, 1985.56. Wolfenstine, J.; Ruano, O.A.; Wadsworth, J.; Sherby, O.D. Refutation of the relationship between denuded zones and diffusional
creep. Scr. Metall. Mater. 1993, 29, 515–520. [CrossRef]57. Wadsworth, J.; Ruano, O.A.; Sherby, O.D. Denuded zones, diffusional creep, and grain boundary sliding. Metall. Mat. Trans. A
2002, 33, 219–229. [CrossRef]58. Dunand, D.C.; Han, B.Q.; Jansen, A.M. Monkman-grant analysis of creep fracture in dispersion-strengthened and particulate-
reinforced aluminum. Metall. Mat. Trans. A 1999, 30, 829–838. [CrossRef]59. Weertman, J. Theory of Steady-State Creep Based on Dislocation Climb. J. Appl. Phys. 1955, 26, 1213–1217. [CrossRef]60. Weertman, J. Dislocation Climb Theory of Steady-State Creep. Trans. ASM 1968, 161, 681–694. [CrossRef]61. Cottrell, A.H. The time laws of creep. J. Mech. Phys. Solids 1952, 1, 53–63. [CrossRef]62. Gottstein, G. Materialwissenschaft und Werkstofftechnik: Physikalische Grundlagen, 4th ed.; Springer Vieweg: Berlin, Germany, 2014;
ISBN 9783642366031.63. Krompholz, K.; Kalkhof, D. Size effect studies of the creep behaviour of a pressure vessel steel at temperatures from 700 to 900 ◦C.
J. Nucl. Mater. 2002, 305, 112–123. [CrossRef]64. Meeting on current work on behavior of materials at elevated temperatures. In Size Effect in Creep and Rupture Tests on Unnotched
and Notched Specimens of Cr–Mo–V Steel: Reports of Current Work on Behavior of Materials at Elevated Temperatures; Schmieder, A.K.(Ed.) American Society of Mechanical Engineers: New York, NY, USA, 1974.
65. Dymácek, P.; Jarý, M.; Dobeš, F.; Kloc, L. Tensile and Creep Testing of Sanicro 25 Using Miniature Specimens. Materials 2018, 11,142. [CrossRef]
66. Requena, G.; Telfser, D.; Hörist, C.; Degischer, H.P. Creep behaviour of AA 6061 metal matrix composite alloy and AA 6061. Mater.Sci. Technol. 2002, 18, 515–521. [CrossRef]
67. Cao, L.; Bürger, D.; Wollgramm, P.; Neuking, K.; Eggeler, G. Testing of Ni-base superalloy single crystals with circular notchedminiature tensile creep (CNMTC) specimens. Mater. Sci. Eng. A 2018, 712, 223–231. [CrossRef]
68. Randle, V. Twinning-related grain boundary engineering. Acta Mater. 2004, 52, 4067–4081. [CrossRef]69. Alexandreanu, B.; Sencer, B.H.; Thaveeprungsriporn, V.; Was, G.S. The effect of grain boundary character distribution on the high
temperature deformation behavior of Ni–16Cr–9Fe alloys. Acta Mater. 2003, 51, 3831–3848. [CrossRef]70. Thaveeprungsriporn, V.; Was, G.S. The role of coincidence-site-lattice boundaries in creep of Ni-16Cr-9Fe at 360 ◦C. Met. Mat.
Trans. A 1997, 28, 2101–2112. [CrossRef]71. Cocks, A.; Ashby, M.F. On creep fracture by void growth. Prog. Mater. Sci. 1982, 27, 189–244. [CrossRef]72. Kassner, M.E. Fundamentals of Creep in Metals and Alloys, 3rd ed.; Elsevier Science: Amsterdam, The Netherlands, 2015; ISBN
9780080994277.73. Langdon, T.G. Identifiying creep mechanisms at low stresses. Mater. Sci. Eng. A 2000, 283, 266–273. [CrossRef]74. Greenwood, G.W. Denuded zones and diffusional creep. Scr. Metall. Mater. 1994, 30, 1527–1530. [CrossRef]75. Kloc, L. On the symmetry of denuded zones in diffusional creep. Scr. Mater. 1996, 35, 539–541. [CrossRef]76. Burton, B.; Reynolds, G.L. In defense of diffusional creep. Mater. Sci. Eng. A 1995, 191, 135–141. [CrossRef]77. Owen, D.M.; Langdon, T.G. Low stress creep behavior: An examination of Nabarro—Herring and Harper—Dorn creep. Mater.
Sci. Eng. A 1996, 216, 20–29. [CrossRef]