The economic impact of innovation patents - IP Australia · Matthew Johnson Benjamin Mitra-Kahn...
35
Report commissioned by IP Australia and authored by: Matthew Johnson Benjamin Mitra-Kahn Adam Bialowas Bradley Man Peta Nicholson Sasan Bakhtiari The economic impact of innovation patents IP Australia Economic Research Paper 05
Transcript of The economic impact of innovation patents - IP Australia · Matthew Johnson Benjamin Mitra-Kahn...

Report commissioned by IP Australia and authored by:
Matthew Johnson Benjamin Mitra-Kahn Adam Bialowas Bradley Man Peta Nicholson Sasan Bakhtiari
The economic impact
of innovation patents
IP Australia Economic Research
Paper 05
Suggested Reference:
Johnson et al. 2015. The economic impact of innovation patents. IP Australia Economic Research Paper 05.
http://www.ipaustralia.gov.au/about-us/what-we-do/economics/
Acknowledgments:
With thanks to prof. Adam Jaffe and prof. Paul Jensen for their independent peer-review and comments which
improved the exposition and research.
ISBN 978-1-925245-09-7 (Online)
ISSN 2203-661X (Online)
Copyright
All content in this publication is provided under a Creative Commons Attribution
4.0 International (CC BY 4.0) licence.
http://creativecommons.org/licenses/by/4.0/ with the exception of:
the Commonwealth Coat of Arms,
IP Australia’s corporate logo
photographs of our staff and premises
content provided by third parties – including photographs, logos, drawings
and written descriptions of patents and designs
Third party copyright
IP Australia has made all reasonable efforts to:
clearly label material where the copyright is owned by a third party
ensure that the third party has consented to this material being presented
in this publication.
Permission may need to be obtained from third parties to re-use their material.
© Commonwealth of Australia 2015
Attribution
The CC BY licence is a standard form licence agreement that allows you to
copy and redistribute the material in any medium or format, as well as remix,
transform, and build upon the material, on the condition that you provide a link
to the licence, you indicate if changes were made, and you attribute the
material as follows:
Licensed from the Commonwealth of Australia under
a Creative Commons Attribution 4.0 International Licence.
Contact us (www.ipaustralia.gov.au) if you have any enquiries about
IP Australia’s copyright licence or the use of material in this publication.

Executive Summary
This research paper examines the economic impact of the innovation patent system.
The innovation patent is a second-tier patent with a lower inventive threshold, lower
cost and shorter term than a standard patent. The policy objective of the innovation
patent is to encourage innovation among Australian Small and Medium sized
Enterprises (SMEs) by offering protection for lesser inventions.
The evidence shows that firms who file innovation patents are less likely to
participate in the standard patent system afterwards. The great majority of Australian
SMEs and private inventors appear to gain little benefit from the system. Three
quarters of these applicants file one innovation patent and then never file another
innovation or standard patent again.
Only 23 SMEs have become moderate users of the innovation patent system, filing at
least 5 innovation patents, with at least one enforceable right, and entering the patent
system via an application for an innovation patent. The average SME or private
inventor files once and never again (74%) does not receive any enforceable right
(83%), and lets their patent expire early because they see its value at less than the
$110-$220 cost of renewal (78%).
The evidence shows that innovation patents have some positive effects, but in the
one area of impact, firm survival, standard patents are found to have a bigger
positive effect, and there is no effect from certifying innovation patents. Firms in the
manufacturing sector, who file innovation patents, invested more in R&D than other
manufacturing firms, but the same holds for standard patent applicants, both in
manufacturing and across broader set of industries. The innovation patent by itself
has no correlation with firm sales growth and no impact on market entry rates across
industries.
Innovation patents impose a regulatory cost on Australian SMEs and private
inventors of over $10 million per year, equating to nearly 95% of the regulatory cost
of the system. The maximum private value of the innovation patent system as a
whole was calculated to be in the low tens of millions per annum. This private value
is expected to be offset by third party uncertainty costs to consumers and other
producers, as the majority of innovation patents are not enforceable rights, but this
offset could not be quantified. Large firms tend to obtain the majority of this value
from their innovation patents, followed by SMEs and private inventors. This highlights
that the costs and benefits are not accruing evenly across firms.
The low levels of repeated use by SMEs suggest that the innovation patent is not
fulfilling its policy goal of providing an incentive for Australian SMEs to innovate, and
the evidence shows a reduced likelihood of patenting after participating in the
innovation patent system. Given the low private value of the system, it is likely that
the system is a net cost to most of the SMEs that use it, and the system has imposed
a regulatory burden of more than $100m since its introduction.

Contents
Executive Summary .................................................................................................. 3
Contents .................................................................................................................... 4
1. Introduction ........................................................................................................ 5
1.1 The available evidence on second-tier patent systems .................................... 5
1.2 Background and objectives of the Innovation Patent System ........................... 7
2. The innovation patent ......................................................................................... 8
2.1 Second-tier patent applications rose after the introduction of the innovation
patent .................................................................................................................... 8
2.2 Patent system attracts manufacturers undertaking R&D .................................. 9
2.3 Innovation patents aid firm survival ................................................................ 11
2.4 Innovation patents have no discernible macroeconomic effect ....................... 13
3. Volume of applications is low ........................................................................... 14
3.1 Australian SMEs and private inventors are the biggest filers .......................... 15
3.2 SMEs are not repeat users of the system ...................................................... 18
3.3 Large firms certify and renew innovation patents ........................................... 21
3.4 Most SMEs and private inventors get little value from innovation patents ...... 23
4. Private value accrues to a small minority.......................................................... 24
4.1 International and domestic comparison of patent value ................................. 25
4.2 An estimate of the private value-add of innovation patents ............................ 27
4.3 The regulatory burden falls on SMEs and private inventors ........................... 28
4.4 Third party costs off-set private value ............................................................ 30
5. The economic impact ....................................................................................... 30
References .............................................................................................................. 32

Page 5 of 35
1. Introduction
In 2011 Australia’s Advisory Council on Intellectual Property (ACIP) commenced a
review of the innovation patent system to determine whether it was meeting its
objectives. ACIP focused “on the effectiveness of the innovation patent system in
stimulating innovation by Australian small to medium businesses” (ACIP 2013: 7,
2014: 5). In their concluding letter to the Minister ACIP summarized their initial
findings as follows:
ACIP tried to fairly assess the value of the innovation patent system to
Australian innovators during the course of this review, but the evidence
discovered was insufficient to make such an assessment. Consequently,
ACIP is unable to make a recommendation supporting the retention or
abolition of the current system.
-Review of the Innovation Patent System (ACIP 2014: preamble)
ACIP did not provide a recommendation to retain or abolish the Innovation Patent
system but did note that, if it were to be retained, a number of changes should be
adopted to address concern around the innovation patent, including its scope, name
and examination procedure (ACIP 2014: 6-15).
The intention of this research paper is to examine the economic impact of the
innovation patent system in Australia.
1.1 The available evidence on second-tier patent systems
Second-tier patents, or utility models as they are often called, provide a lesser but
more accessible form of patent protection for innovating firms or individuals.
According to the World Intellectual Property Organization (WIPO), second-tier
patents are currently used in 59 countries around the world (listed in Appendix 1.1).
Australia’s former version of second-tier patents was the petty patent, which was
abandoned in 2001 to give way to the innovation patent as it exists today.
Part of the difficulty in assessing second-tier patent systems is that they are used
very differently on a country by country basis. The length of a second-tier patent can
vary considerably, for instance they can last up to 20 years in Malaysia, and up to 6
years in France. Differences across patentable subject matter, the name of the right,
the patentability threshold and the requirement for examination differs country to
country as well (see Appendix 5 in ACIP’s 2014 report for details).
Determining the economic impact of the innovation patent system in Australia is not a
trivial exercise. Conceptually we would like to measure the effects on inventors of
innovation patents being available – the existence of the system - rather than the
effect of obtaining an innovation patent. The former requires knowledge of firm
behaviours in the counterfactual scenario where innovation patents do not exist,
which is unobtainable. Therefore the latter approach, looking at the effect of taking

Page 6 of 35
out innovation patents, is taken in this report. Even this is difficult as the empirical
evidence on second-tier patent systems is very scarce and generally does not focus
on the Australian context, as evidenced by ACIP being unable to obtain such
evidence during their two year review (ACIP 2014: 6). The paucity of evidence has
also been noted by the European Commission (2014), which recently awarded a
multi-year research contract to help it establish the economic evidence on second-
tier patents.
We were confident that we could overcome this issue by using our recently published
IP Government Open Data (IPGOD) which includes the complete IP registry with
each applicant from 1990 to 2013 linked to Australian Business Numbers, allowing us
to link innovation patent applicants with firm characteristics. In addition, IP Australia’s
Office of the Chief Economist worked with data from the Australian Bureau of
Statistics, the Department of Industry and Science, the Australian Securities and
Investment Commission and the Australian Business Register to build a
comprehensive micro-dataset to allow detailed analysis of innovation patent
applicants.
After developing this large dataset, which is detailed throughout the appendices, our
strategy was to review the existing empirical literature on second-tier patent systems
and replicate modelling done for other countries to estimate comparable effects in
Australia.
In particular, we are interested in the relationship between the innovation patent
system and Research & Development (R&D) expenditure, firm performance, market
competition, regulatory cost, private value, firm survival and the usage by small and
medium enterprises (SMEs) as well as individual inventors.
Looking at the literature, we found little empirical modelling: there is empirical
evidence to suggest that in some developing countries a second-tier patent system
can be useful in the technological catch-up phase (Suthersanen 2006), as in the case
of Korea in the 1980s (Kim et al 2012) and Japan in the post-war period (Maskus &
McDaniel 1999). When comparing countries, Kim et al (2012) finds a positive impact
for some developing and developed countries, although Bielig’s (2012) simple
regression for the impact of second-tier patents in Germany shows a negative impact
on Gross Domestic Product there.
There is a much larger body of literature comparing the legal framework in different
countries, the most recent of which compared several European and the Chinese
second-tier patent systems (Prud’Homme 2014). A body of literature also exists with
the theoretical arguments for and against a second-tier patent system (see Boztosun
2010 or Cummings 2010 for the positive and Janis 1999 on the negative).
A few evaluations of second-tier patent systems have been undertaken, but their
evidence gathering exercises have mainly focused on surveying attorneys (Kumar
2002, Kardam 2007) or patent holders (Verve Economics 2013) to ask if participants
valued the system. A more detailed review of the Australian innovation patent was
undertaken by Christie and Moritz (2004, 2007), but much like the ACIP Review, the

Page 7 of 35
data available for analysis was limited mainly to the number of filings, who filed
innovation patents and who certified innovation patents.
The aim of this research paper is to incorporate these parts of the evidence base,
and go beyond that to investigate what impact the innovation patent has on
Australian firms and the economy. Specifically, we want to provide evidence to inform
decision makers as to whether the system has fulfilled its main objective: Has it
worked as an incentive for SMEs and private inventors to innovate.
Being an economic review, we are interested in whether the system provides a net
benefit to the Australian economy, although the policy focus of the innovation patent
– being aimed at small and medium enterprises – suggests that we should also pay
attention to the distribution of costs and benefits.
1.2 Background and objectives of the Innovation Patent System
The Innovation Patent system was born out of the Review of the Petty Patent System
that was completed in 1995. The 1995 review was conducted by ACIP and had to
consider (ACIP 1995: 4):
the role of petty patents in Australia's industrial property system and their
contribution to economic and technological development in Australia; and
the effectiveness and efficiency of a petty patent system in meeting its
objectives with particular regard to small and medium business enterprises.
In its conclusion, the review found that there was a role for a second-tier patent in the
Australian innovation system, and noted that:
there is a clear need for a new and alternate form of industrial right protection
for incremental innovations and recommend that such a system should be
introduced. This new protection right, which we have called the Innovation
Patent, will provide a net benefit to the Australian economy by encouraging
Australian business to develop and market their incremental innovations in
the domestic market.
-Review of the Petty Patent System (ACIP 1995: preamble)
The transition from the Petty Patent system to the Innovation Patent system came
with a number of changes, which aimed to achieve a range of objectives the review
panel had identified (ACIP 1995: 27). These objectives included:
the need to fill the 'gap' between designs and standard patents;
quick to obtain;
cheap to obtain and enforce;
reasonably simple;
helps small / medium business enterprises;
has a measure of certainty; and
Page 8 of 35
lasts for a sufficient time to encourage investment in the developing and
marketing of the innovation.
The report also noted that many of these objectives are in mutual conflict, so the
recommendations aimed to design a system which is flexible enough to provide the
opportunity for applicants to select those characteristics that best suit their needs.
To achieve these objectives, the system encapsulated the following features:
a new name - Innovation Patent
a lower inventive step requirement (the ‘innovative step’)
the then current scope and breadth of the protection to remain
a term of eight years (up from six years)
a limit of five claims (up from three), with no restriction on type of claim
same prior art base as a standard patent
option to defer examination with substantive examination only on request
to apply to the same subject matter permissible for a standard patent
publication three months after filing and at grant
no pre-grant opposition
revocation by IP Australia
priority deriving from provisional applications possible
divisional practice to be retained
convertibility - standard application to an innovation application, and vice
versa
concurrent protection for a standard and innovation patent
2. The innovation patent
Innovation patents provide a second-tier patent protection system at a lower cost and
with easier access than standard patents. The length of the monopoly provided by an
innovation patent is less than a standard patent. Innovation patents that pass
formality requirements are automatically ‘granted’, but are not legally enforceable
until certified after an examination process.
There have been approximately three court oppositions per year over 12 years.
Innovation patents have also met their objective of being convertible to and from
standard patents, with approximately 700 conversions from standard patents to
innovation patents and around 30 conversions from innovation patents to standard.
This has provided a fall-back option for applicants who fall short of the inventive
threshold required for a standard patent.
2.1 Second-tier patent applications rose after the introduction of the innovation patent
Christie and Moritz (2004, 2007) as well as ACIP (2014: 25) observe that second-tier
patent applications increased after the petty patent was replaced by the innovation
patent. This was a specific aim of the 2001 reform and we undertook regression

Page 9 of 35
analysis to test whether there had been a break in the series. The results confirm that
the change in 2001 was statistically significant and more innovation patent
applications were filed on average after the introduction of the innovation patent
system (see appendix 2.0 for details). Figure 1 shows the growth in applications to
2012 with the drop off in applications since then.
Figure 1: Second-tier patent applications, 1979-2014
IP Australia has received 18,272 innovation patent applications as of 31 December
2014. Over the last two years, applications have been falling, mainly driven by a drop
in filings by Australian entities. In relative terms, innovation patents account for nearly
5% of all (non-provisional) patent applications in Australia, making up a relatively
small part of Australia’s patent system.
The innovation patent is aimed at Australian firms and the majority of applicants for
innovation patents (79%) have Australian addresses, compared to only 10% of
standard patent applications (IP Australia 2014: 8). The proportion of Australian
applicants has been on a downward trend since the system was introduced in 2001
when 88% of applicants were Australian entities, against 68% in 2013. So the system
is mainly accessed by Australians.
2.2 Patent system attracts manufacturers undertaking R&D
A key purpose of the patent system is to incentivise R&D. Ideally we would have
liked to replicate the work of Arora et al (2008) which modelled the incentive effect of
R&D in the US economy and found a positive relationship between standard patents
and R&D in the manufacturing industries. This would however require long R&D data
series at the firm level, and estimates of propensities to undertake R&D and patent
which is not available for Australia.
1,856
1,523
0
200
400
600
800
1000
1200
1400
1600
1800
2000
19
79
19
80
19
81
19
82
19
83
19
84
19
85
19
86
19
87
19
88
19
89
19
90
19
91
19
92
19
93
19
94
19
95
19
96
19
97
19
98
19
99
20
00
20
01
20
02
20
03
20
04
20
05
20
06
20
07
20
08
20
09
20
10
20
11
20
12
20
13
20
14
Cross-Over Petty Patents Innovation Patents

Page 10 of 35
Our second best option is to investigate whether firms that filed innovation patents
have undertaken more R&D than firms that did not file patents. To test this we first
link the Department of Industry and Science database of firms claiming the R&D tax
concession, or incentive, to IPGOD and look at all firms in the period 2001-2011
where matches between the two datasets exist. Where there is no match, we assign
zero patents. The resulting dataset has 620 observations that have filed at least one
innovation patent and 3,367 observations that have filed only standard patents and
made use of the R&D tax concession since 2001. Moreover, 69,734 observations in
the dataset are assigned zero patents, providing a large control group against which
to compare our sample. See appendix 2.2 for details on the data.
We then compare the R&D expenditure and R&D staff levels of firms with newly
generated standard or innovation patents against a comparable firm that filed no
patent applications. To find the comparable firm, we conduct a Mahalanobis-type
matching which finds a firm that has the minimum distance to our treated firm on
characteristics that are likely to impact patenting (Rosenbaum & Rubin, 1985). The
characteristics that we use are log of the number of employees, whether the firm is a
foreign subsidiary, and geography in terms of longitude and latitude. We do the
matching strictly within the top level Australian and New Zealand Standard Industry
Classification (ANZSIC) to link major industry groups for more conformity between
the firm and its match.
The matching provides us with a control group of similar or comparable firms to see if
firms with patents have more R&D expenditure on average than firms without. Tests
were also undertaken to determine if there is an average difference in R&D staff or
R&D expenditure two years before filing patents, for similar firms that file no patents,
those that file at least one innovation patent, and those that only file standard
patents. The two-year lag that we implement here is standard in economic research
to allow for the time delay from research to innovation.
The results suggest that firms that apply for patents spend more on R&D than firms
that file no patent applications. These results are statistically significant at the 5%
level for standard patent applicants in the mining, manufacturing, professional,
scientific & technical services, education & training, healthcare & social assistance
and arts & recreation services.
It was not possible to estimate the effect on firms that only file innovation patents as
the sample size was too small for making proper conclusions, so we instead look at
firms that have filed at least one innovation patent and may have standard patent
applications as well. In this case only the manufacturing sector sees a statistically
significant positive relationship at the 5% level between innovation patents and R&D
expenditure. Table 1 reports all results that are statistically significant at the 10%, 5%
and 1% level.

Page 11 of 35
Table 1: Firms that patent tend to do more R&D
ANZSIC Division
Innovation patents with or without
standard patents
Standard patents only
B Mining 6.242 **
C Manufacturing 2.584 *** 1.269 ***
E Construction -12.309 *
I Transport, post, warehousing 47.069 *
M Professional, Scientific & Technical Services 1.020 ***
P Education & Training -0.089 **
Q Health care & Social assistance 0.313 **
R Arts & Recreation Services 1.759 ***
Statistical significance indicated by asterisks at the 10% level * | 5% level ** | 1% level ***
These results show that firms that file patent applications undertook more R&D on
average than similar firms – indicating that the patent system, and for the
manufacturing industry, the innovation patent system, is used as a way to protect
successful R&D expenditure.
The figures in the table can be interpreted as the average difference between treated
and un-treated firms, so for example: firms filing innovation patents in the
manufacturing industry claimed to spend an average of $2.584m more on R&D than
firms that filed no innovation patents. The results for the innovation patent in ANZSIC
division E (Construction) and I (Warehousing) are only significant at the 10% level,
and are based on very few matched observations so should be treated with some
caution.
Appendix 2.2 reports the full results, including a comparison between firms that take
out at least one innovation patent against those with only standard patents, as well
as the results for R&D staffing. We cannot, on the available evidence, say whether
the innovation patent system incentivised R&D expenditure, but we can say that in
only one industry do we see the expected use of the system. Those that do some
R&D in manufacturing use the innovation system along with the standard patent
system, while other industries tend to use the standard patent system alone.
2.3 Innovation patents aid firm survival
IP rights allow applicants the exclusive rights to commercially exploit an invention,
and that should provide some monopoly power. This in turn should help firms remain
in business for longer and, using survival regression techniques, we can investigate
the extent to which firms that apply for innovation patents have a lower risk of failing
at a given time, and whether applications that are successfully examined are any
different in this regard than applications that have not undergone examination.

Page 12 of 35
Survival analysis is a technique that has been widely used in the finance and
actuarial literature to examine the factors that influence a firm’s survival. In this
instance we use it to determine the effect of holding a range of IP stock, including
innovation patents, on the probability that a participant deregisters from the
Australian Business Register or cancels its Goods and Services Tax (GST) status.
Either of these events we take to mean the firm is no longer trading (Department of
Industry and Science 2014: 76). Given that firm failure is generally considered an
undesirable outcome, any market factors that can be linked to extending the life of a
firm could be interpreted in a positive light.
We adapt the empirical model published by Jensen et al (2008) which found that IP
rights did extend the life of firms in Australia, but the analysis did not include
innovation patents explicitly. We adapt the model to look at whether innovation
patents have a similar effect to other IP rights.
Following Jensen et al (2008), the probability of firm death is modelled as a function
of firm, industry and macroeconomic variables. Firm-level variables included in the
model are the current stock of applications and granted IP rights for innovation
patents, standard patents, designs and plant breeder’s rights. Dummy variables are
included to account for firm size, subsidiary status and private or public companies.
Industry specific effects are accommodated by a variable measuring the gross entry
rates of firms into a particular ANZSIC division. Macroeconomic variables include an
index of the Australian stock market and the change in gross domestic product.
Our dataset is an unbalanced panel of 14,033 companies observed from 2000 to
2013. The data on IP rights was drawn from the Intellectual Property Government
Open Data (IPGOD). A key feature of the IPGOD is that it employs a unique set of
identifiers which allows IP rights to be linked to individual firms, firm level
characteristics and geospatial data. ABN and GST registration and de-registration
dates were acquired from the Australian Business Register, where supplementary
data was obtained from the ABS and the OECD databases (see appendix 2.3 for
details).
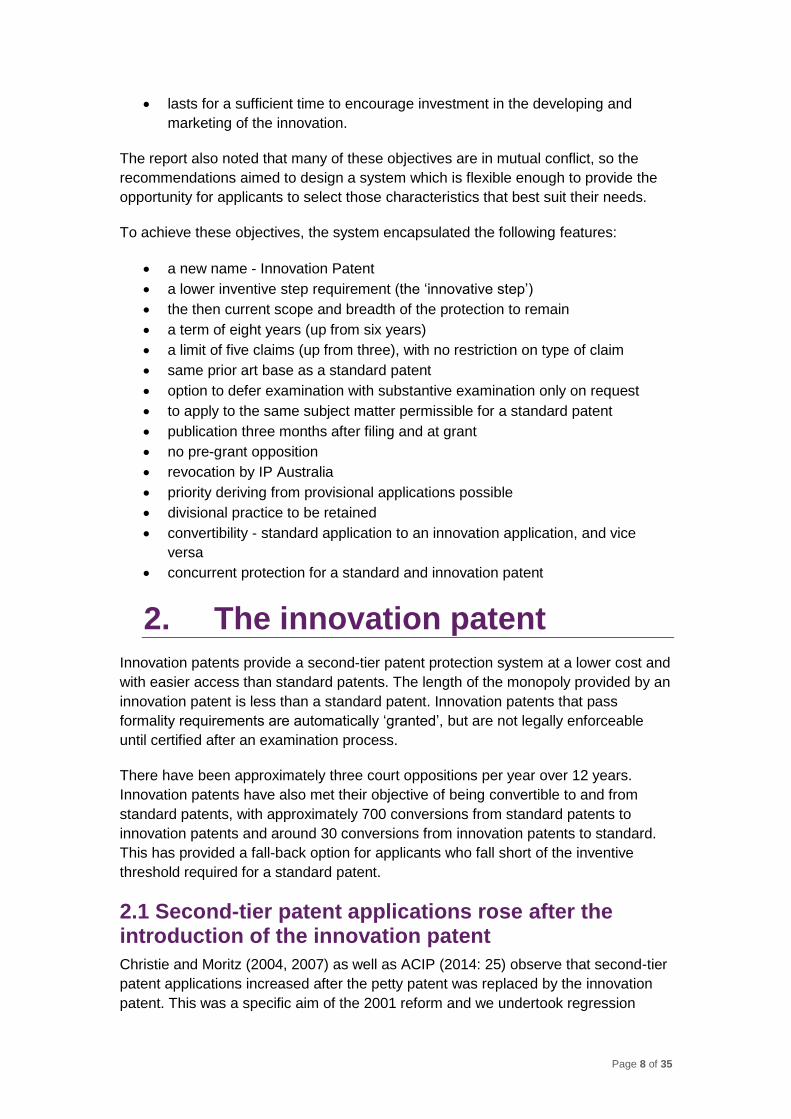
Table 2 provides a summary of the survival regression results for the population of
Australian firms with IP rights. The focus of our analysis is on the role that innovation
patents may play in influencing firm survival. In this context the key variables of
interest are the numbers of innovation patents that have not passed an examination
(Applications) and the current stock of innovation patents that have passed
examination (Certified). Of these two variables, only the number of innovation patent
applications is statistically significant, and has a negative coefficient. This result
means that firms with pending innovation patents are less likely to exit at a given
time.
Page 13 of 35
Table 2: Firm survival affected by patenting
Explanatory variables Coef. Std. Err. z P>|z|
Innovation Patent Applications -0.2243 ** 0.0909 -2.47 -0.014
Innovation Patents Certified 0.0599 0.1515 0.40 -0.693
Standard Patents Filed -0.3631 *** 0.0495 -7.33 0.000
Standard Patents Granted -0.4589 *** 0.0531 -8.63 0.000
… full list of explanatory variables in Appendix 2.3
A negative coefficient implies a lower propensity to exit
Statistical significance indicated by asterisks at the 10% level * | 5% level ** | 1% level ***
A firm’s stock of certified innovation patents does not appear to affect the survival of
the firm compared to other forms of IP rights, and this is not the expected result.
Other patent rights, innovation and standard, lower the probability of firm exit. On the
basis of this it appears that firms that file innovation patents tend to survive longer
than those that do not, but certification has an unclear effect. There could be a range
of reasons why firms filing, but not certifying, innovation patents have a lower
probability of exit, which are unconnected with the patent system. The results do
indicate that the certified right itself does not provide the benefit, whereas standard
patents, whether filed or granted, have a larger and positive impact on firm survival
than innovation patents. This nuance is important as we look at the effect that
innovation patents have on firm and market outcomes.
2.4 Innovation patents have no discernible macroeconomic effect
In aggregate terms we do not observe any correlation or association between
innovation patents and macroeconomic variables such as firms’ sales growth or
market entry rates. No evidence exists to show a break in R&D expenditure across
Australia, or in certain industry sectors, with the introduction of the innovation patent.
Kim et al (2012) find that filing innovation patents had a positive effect on firm sales
growth in Korea. When we replicate the model in a fixed effect regression, we find
that for Australian data there is no statistically significant relationship between
innovation patent filings and firm performance as recorded by annual growth in sales
(see appendix 2.4 for details). That said, our analysis relies on a more limited
dataset than what is available for Korea and is weighted heavily toward large firms,
so at most we can conclude that there appears to be no noticeable relationship
between sales growth and innovation patents for large firms in Australia.
The lack of an impact on aggregate sales growth does not exclude the possibility that
innovation patents have some industry impact. In particular we are interested in
whether the system impacts competition or market entry. To this end, we have
sought to explore the relationship between innovation patents and the rate of market
entry of new firms. The classic reference on competition and innovation, as
measured by patent applications, is the work by Aghion et al (2005) which found an

Page 14 of 35
inverted-U shape relationship between innovation and competition. In a follow-up
paper Greenhalgh & Rogers (2010) test this relationship for patent and trade marks
across UK industries with several measures of competition, and find that patents and
trade marks are significant in a sub-set of industries.
The closest proxy to market contestability we can construct with Australian data is
the rate of firm entry using the Australian Business Register. We use this to estimate
what variables affect firm entry (as discussed by Cincero & Galgao 2005).
Following the literature (e.g. Dunne et al 1988, Herck 1984, Geroski 1995, Carree &
Thurik 1996) we set up regression analysis with the quarterly rate of market entry as
the dependent variable regressed on: the exit rate, population, gross value add, lags
of gross value add, plant breeder’s rights, design rights, standard patents and
innovation patents held in industries as defined by the ANZSIC classification.
We find that population and exit rates have an impact on entry, which is consistent
with the literature. The relationship between market entry and innovation patents
across all Australian industries was explored via a variety of regression techniques;
fixed effects, random effects and ordinary least squares. In none of the regressions
were there any statistically significant (at 95% confidence) relationships between the
rate of firm entry and the stock of pending innovation patents or certified innovation
patents. Full results are available in appendix 2.4.
3. Volume of applications is low
These macro results, and limited associations between R&D and innovation
patenting, are in large part explained by the low number of applications. There are
not a lot of firms that file innovation patents, and they make up less than 5% of total
patent applications filed at IP Australia. Figure 2 provides a breakdown of the number
of innovation patent applications by domestic and international origin, with large,
SME and private inventors highlighted in the domestic applications.

Page 15 of 35
Figure 2: Innovation patent applications by applicant type
2014 data not included as firm matched data is not yet available
Since 2009 international applications have been on the rise, while Australian
applications have fallen since 2012. The profile of the international applicants is also
quite different from standard patents as the top foreign origins are China and Taiwan
(see appendix 3.0 for details). In an economy worth more than $1.5 trillion with more
than two million actively trading firms in 2013, only 623 Australian businesses filed for
an innovation patent. This goes a long way to explaining why the innovation patent
system does not appear in the macroeconomic effects. The question then is whether
those few applications are filed by the SMEs and private inventors the system is
intended for.
3.1 Australian SMEs and private inventors are the biggest filers
Innovation patent applications filed between 2001 and 2013 were mainly filed by
Australians, and the majority of applicants were SMEs or private inventors – i.e.
individual inventors who have no Australian Business Number (ABN). This
observation conforms with Christie and Moritz’s (2004, 2007) finding for the first few
years of the innovation patent, and stands in some contrast to the standard patent
system as illustrated in Figure 3.

Page 16 of 35
Figure 3: SMEs and Private inventors file most innovation patents, 2001-2013
As Figure 3 shows, private inventors proportionately use innovation patents more
than standard patents. Both patent systems are used by SMEs to a similar degree
(31% for innovation and 39% for standard), while large firms are responsible for
proportionally more standard patent filings. Of the Australian innovation patent
applications, 63% are filed by private inventors, followed by 31% from SMEs and 6%
from large firms.
SMEs and private inventors file more innovation patents, and more second-tier
patents applications were filed after the innovation patent was introduced, but any
net-positive effect of the innovation patent system is most likely to revolve around the
enforceable rights. Figure 4 illustrates the difference between applications and
enforceable rights, showing total applications as a bar, with the shaded area
indicating the enforceable rights under the petty patent system (1979-2001) and the
innovation patent system (2001-2013).

Page 17 of 35
Figure 4: Second-tier patents and enforceable rights, 1979-2013
While applications increased after the introduction of the innovation patent system,
structural break tests confirm that the number of legally enforceable rights decreased
after 2001 (see appendix 3.1). Of the 663 second-tier patent applications received in
the year 2000, 357 were granted legally enforceable rights. The greatest number of
legally enforceable innovation patents was 329 in 2012. In other words, after 13
years of application growth we have still not seen the same number of rights granted
under the innovation patent system as we saw under the preceding system.
Non-enforceable rights still provide applicants with an option to obtain enforceable
rights through patent examination. On average around 40% of petty patents filed over
the years 1986 to 2000 did not pass examination and attain enforceable rights. The
lack of legally enforceable rights could create uncertainty for other firms making
commercial decisions where unclear rights may or may not be granted to their
competitors.
In this sense most innovation patents could be considered placeholders for the
applicant, providing an option to attempt to obtain a legally enforceable right.
However, this option comes with an information asymmetry, where the applicant is
better placed to know if the patent would pass examination than third parties at the
point of application. Third parties can read patent applications that may impact their
business to make their own determination of whether the patent would pass
examination, but this comes at an additional cost to the third party. This creates
additional costs in the marketplace, where uncertified applications may be filed to
deter competitors. Prud’homme (2014: 11-12) notes that this type of uncertainty was
a major factor in the decision of the Dutch and Belgian governments when they
abolished their second-tier patent systems in 2008 and 2009.
Page 18 of 35
The private value derived from uncertified innovation patents in this instance comes
through the application being a deterrent to competitors rather than a clear signal of a
new invention. These private benefits are likely offset by costs to competitors and
consumers.
3.2 SMEs are not repeat users of the system
If applicants felt the uncertainty value of patents were valuable to them, one might
expect that firms that file uncertified innovation patents would be repeat users of the
system. The data however suggests that the majority of uncertified applications
belong to SMEs and private inventors that only file one innovation patent and do not
file additional innovation or standard patents.
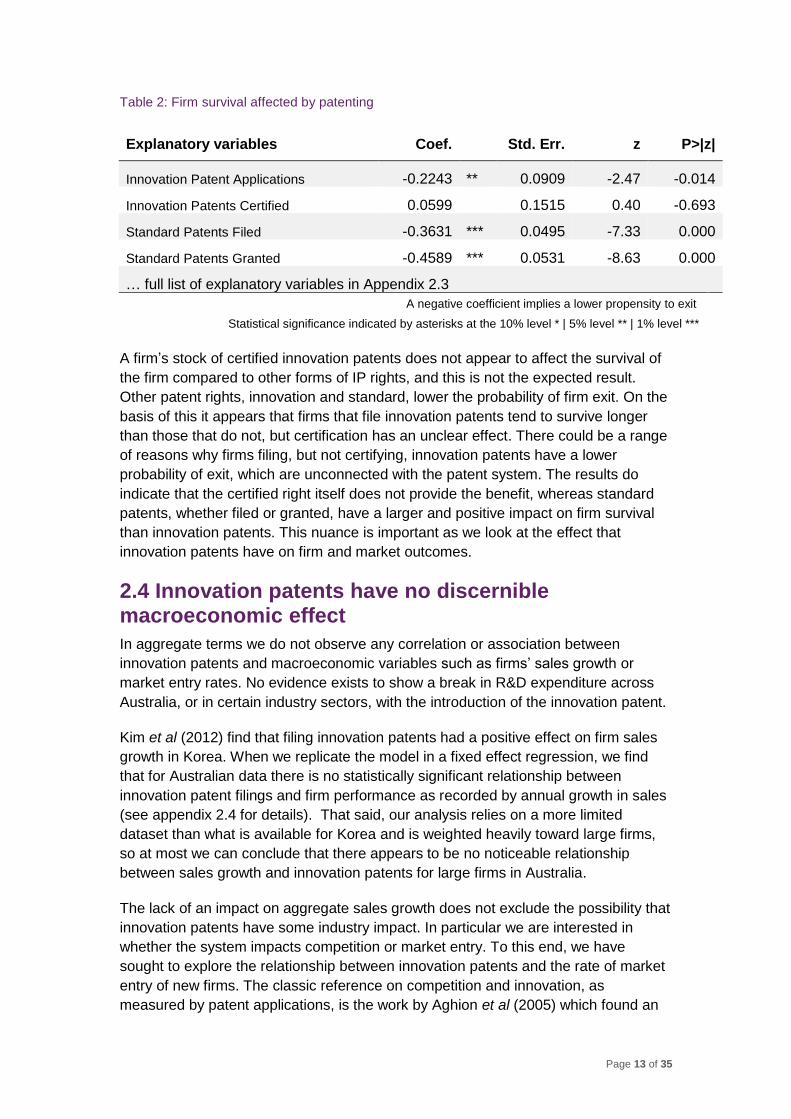
Figure 5 shows the number of applicants by firm size, categorised by the number of
applications the applicant has filed in total and the order in which they filed them
(standard or innovation patents first and those filing only innovation patents). Note
that the vast majority of SME and private inventor filers did use the innovation patent
system before the standard patent system (the top half of Figure 5) but mainly just
filed one innovation patent.
Figure 5: Most SMEs get one innovation patent only
Large firms and international firms are mainly found at the bottom half of figure 5 and
are responsible for 55% of applications in that space, indicating that they were
already filing standard patents before they used the innovation patent system, and
they tend to be repeat users. The issue here is that the innovation patent system was
intended to be a way to encourage SMEs to innovate, and by proxy, participate in the
IP system. Beyond this, one would expect that if innovation patents were found to be

Page 19 of 35
useful by the firms that file, they would file repeatedly. The majority of SMEs however
file a single application and decide not to come back for a second time.
To test this, we adapt part of the model constructed by Kim et al (2012) to estimate
the likelihood that an innovation patent filer pursues follow-on innovation in the form
of additional patent filings. While patent filings are often used as a proxy for
innovation in the literature (e.g. Aghion 2005) we are interested not just in ‘innovation’
as such, but in the specific instances where the innovation patent encourages firms
to participate more actively in the IP system.
Using the complete set of IP applications between 2000 and 2013 for all Australian
firms, with a firm size dummy to see if there are different effects by firm-size, we run
a fixed effect regression to estimate the effects of standard patent filings. We find a
statistically significant, but negative effect, on standard patent filing from the filing of
innovation patents (see appendix 3.2 for details), indicating that firms that file
innovation patents tend to file less standard patents. Table 3 sets out the results from
the model, and while Kim et al (2012) found that second-tier patents encouraged
future patent filings in Korea, we find the opposite in Australia.
Table 3: Filing an innovation patent does not encourage future standard patent applications
Explanatory Variables Coef.
Std. Err. t P>|t|
(log of standard patent applications)t-1 0.2905 *** 0.0198 14.70 0.00
(log of standard patent applications)t-2 -0.0760 *** 0.0190 -4.01 0.00
(log of innovation patent applications)t-5 -0.1305 *** 0.0370 -3.53 0.00
(log of innovation patent applications)t-6 -0.1790 *** 0.0443 -4.04 0.00
(log of R&D expenditure)t-1 -0.0029 0.0020 -1.46 0.14
(log of R&D expenditure)t-2 0.0012 0.0018 0.64 0.52
Firm size dummy (51-300 employees) 0.0067 0.0108 0.62 0.53
Firm size dummy (301-1000 employees) 0.0048 0.0097 0.50 0.62
Firm size dummy (more than 1000 employees) 0.0107 0.0108 0.99 0.32
constant 0.0757 *** 0.0062 12.27 0.00
sigma_u 0.3399
sigma_e 0.1205
rho 0.8883 Dependent variable is the log of standard patent applications; lags replicate Kim et al (2012) exactly.
Statistical significance indicated by asterisks at the 10% level * | 5% level ** | 1% level ***
Some caution is warranted around these results as the Korean data used by Kim et
al (2012) were much richer in both depth and breadth, but using the full set of data
for the Australian second-tier system, the results do coincide with the behaviour
observed from applicants. SMEs and private inventors, that make up the majority of
applicants, file one innovation patent and do not return to file additional patents.

Page 20 of 35
Looking deeper at the data we can see that of the 9,448 SMEs and private inventors
that applied for an innovation patent, fully 74% (or 6,952) only ever filed one
innovation patent. For those filing more than one innovation patent application, nearly
half, even among SMEs and private inventors, are those that had already filed a
standard patent and then filed an innovation application afterwards, as summarized
in Table 4.
Table 4: Filing behaviour of SMEs and Private inventors
SMEs
Private inventors
Total
Applicants filing one innovation patent only 1786 5166 6952
Applicants filing 2+ innovation patents only 304 620 924
Applicants filing innovation patents before a standard patent 221 240 461
Applicants filing standard patents before an innovation patent 633 478 1111
Total 2944 6504 9448*
*Note, this figure excludes 175 applicants that applied for their first standard and innovation patent at the same time. Due to the marginal impact these applications have on results, these applicants are not included in
subsequent analysis and separate findings are available at appendix 3.2
This suggests that only 1,385 applicants, or 15% of the SMEs and private inventors
that file, started with the innovation patent system before going on to file at least one
more patent right.
There are very few Australian applicants among the heavier users of innovation
patents that filed five or more innovation patents where the first was an innovation.
90 SME and private inventors fall into this category, or less than 1% of all SME and
private inventor applicants. If we further narrow the group to only include applicants
that have at least one of their applications pass examination, we are left with 36 SME
and private inventor applicants over a 12 year period (0.4% of all SME and private
inventor applicants). Finally if we look at those that have filed 10 or more innovation
patents we are left with just 3 SMEs and 4 private inventor applicants (0.07%). In
other terms, there are 7 Australian SMEs and individuals who:
used innovation patents as an introduction to the patent system,
used the system extensively (with 10 or more applications), and
valued the net benefits of certainty of enforceability more than the cost of
examination for at least one application.
For comparison, consider that only 0.4% of SMEs and private inventors are moderate
users of the innovation patent system, but roughly seven times as many, or 2.9% of
SMEs and private inventors, are moderate users of the standard patent system. By
moderate users we mean that applicants filed five applications between 2001 and
2013, and had at least one successfully examined. Table 5 indicates the small
number of SMEs and private inventors that are repeat users of the innovation patent
system, which is multiples smaller than the SME use of the standard patent system.

Page 21 of 35
Table 5: There are almost no serial SME users of the innovation patent system
Innovation patents Standard patents
SME Private
Inventor % of total
SME Private
Inventor % of total
Moderate users: Number of applicants filing 5 or more
23 14 0.4% 389 74 2.9%
Heavy users: Number of applicants filing 10 or more
3 4 0.1% 125 11 0.9%
Rounded to nearest decimal point, percentage of total applicants shown in table
This shows that the innovation patent system has attracted significantly less SME
and private inventor applicants than the standard patent system and further supports
the evidence that the system has not been successful in encouraging SMEs and
private inventors to increase their participation in the patent system for follow-up
innovation.
3.3 Large firms certify and renew innovation patents
Very few SMEs and private inventors file multiple applications, and the follow-on
issue is whether applicants see value in certifying and renewing their innovation
patent. If applicants value the enforceable patent over the uncertainty provided by an
uncertified patent, then applicants would be expected to certify their applications.
Looking at the data, we see that larger firms have a far greater propensity to certify
their patents than SMEs and private inventors. Large firms, SMEs and private
inventors certify their patents for 44%, 24% and 11% of applications (see appendix
3.3 for details). SMEs and private inventors together certify 17% of their applications
(or inversely, 83% of their applications are never certified). From this we could
deduce that either large firms place greater value on the knowledge that their patent
is enforceable, or smaller firms and private inventors place greater value on creating
uncertainty costs for their competitors, or some combination of the two. The first is
considered most likely, as larger firms tend to place greater value on risk mitigation
strategies.
A decision is made annually by applicants to renew or lapse their patent. From an
economic viewpoint, the decision to renew is rational if the value of the patent to the
applicant is greater than the cost of renewal, with the cost of renewal ranging
between $110 and $220 in 97% of cases (detail on renewal cost structure available
at appendix 4.3). The decision to let the patent lapse is rational if the value of the
patent is less than the cost of renewal at the time of decision. Effectively, when
applicants do not renew they demonstrate that the patent protection itself holds little
additional value to them.
When we compare who renews their innovation patents we find that large firms have
a much greater propensity to take innovation patents to their full 8 year term.
Moreover, large firms are also more likely to certify their innovation patent, which in
turn is linked to patent longevity as demonstrated in Figure 6. Figure 6 shows the rate

Page 22 of 35
at which innovation patents are allowed to lapse depending on the firm size of the
applicant and the choice to certify.
Figure 6: Innovation patent renewal by firm size and certification
Details on how active patent life is calculated is available in appendix 3.3
This shows that fully 57% of innovation patents filed between 2001 and 2006 by large
firms went to term, noting that we can only look at this cohort as later applications
have not yet had the chance to reach their 8 year term. The drop in the third year
indicates that SMEs and private inventors in particular choose not to pay the first
renewal fee (of $110), and simply lapse their application. Being aware that small
firms have a higher risk of closing down, we looked to see if the decision to lapse
innovation patents were affected by the de-registration of an SME from either the
Australian Business Register or from paying GST. We found less than 100 instances
where the choice to lapse occurred within a year of de-registration, and conclude that
SMEs are actively choosing to lapse their innovation patent.
The implication is that large firms have a revealed preference for maintaining
innovation patents, implying that they value the patents more than small firms, which
in turn value them more than private inventors.
Looking at patents that go to full term, Figure 7 shows the percentage of applications
that are certified and taken to their full term. The top half of Figure 7 shows that the
applicants that use the innovation patent system as their first point of entry, or only
file innovation patents are less likely to certify and less likely to take the patent to its
full term. This category is dominated by SME and private inventor applicants.
57%
34%
14%
0%
25%
50%
75%
100%
0.5 1.5 2.5 3.5 4.5 5.5 6.5 7.5Years of active innovation patent
Large firm SME Private inventor
55%
17%
0%
25%
50%
75%
100%
0.5 1.5 2.5 3.5 4.5 5.5 6.5 7.5Years of active innovation patent
Certified Not Certified

Page 23 of 35
Figure 7: Repeat patent users certify more and hold rights longer
The full-term renewal rates are highest among those firms that already use standard
patents, indicating that those that were already innovating (and unlikely to have been
incentivised by the innovation patent system) are receiving the most value from the
system.
Even in the case where applicants file 10 or more innovation patents, and used the
innovation patent first or exclusively, the certification rate is only 15%. This is
because applications in this category are dominated by international applicants that
filed 323 of the 633 patents – only 16 of which have been certified (see appendix 2.0
for more information on international applicant filing behaviour)
3.4 Most SMEs and private inventors get little value from innovation patents
Following the logic that the decision to certify, and the decision to pay the renewal
fee to maintain patents is a proxy for the value of the patent to the applicant
(Schankerman 1998), the factors associated with renewals are important. A number
of things impact on the expected lifespan of an innovation patent, the most notable of
which include:
Firm size of applicant (larger firms’ applications live longer)
Certification status of the patent (certified applications live longer)
Whether the applicant used an agent or represented themselves (those that
use agents live longer)
Whether the application was a divisional child of a standard patent (far more
likely to live longer), and
50%
50%
53%
43%
41%
37%
22%
18%
45%
42%
39%
32%
15%
19%
15%
11%
0% 20% 40% 60% 80% 100%
10+ innovation patents, after standard patent(s)
5-9 innovation patents, after standard patent(s)
2-4 innovation patents, after standard patent(s)
1 innovation patent, after standard patent(s)
10+ innovation patents first/only
5-9 innovation patents first/only
2-4 innovation patents first/only
1 innovation patent first/only
Certification rate Full-term rate

Page 24 of 35
The prior patenting experience of the applicant (applications by more
experienced applicants, particularly those who use standard patents, live
longer).
Innovation patents that were filed by large firms that used agents, have used
standard patents before, were the divisional child of a standard patent and were
certified have an early mortality rate of just 12%, meaning 88% go to term (off an
extremely low base of 26 patents). On the other hand, innovation patents that are
filed by self-represented private inventors, that are non-divisional, not certified and
where applicants have never filed a standard patent have an early mortality rate of
94%, leaving only 6% to go to term (off a significant base of 1,521 applications).
These variables are multicollinear in that they are highly correlated with each other.
For instance, innovation patents filed by large firms have better survival rates than
private inventors. The implication being that SMEs and private inventors on average
hold lower value innovation patents than large firms.
4. Private value accrues to a small minority
In considering the value of the innovation patents system, what we really want to
know is the value that innovation patents add to inventions. As outlined by Mark
Schankerman (1998: 77) in his work on patent valuation “the private value of patent
rights represents the incremental returns generated by holding a patent on the
inventions, above and beyond the returns that could be earned by using the second
best means”.
The value of a patent comes from having a legally enforceable monopoly over an
invention for the term of the patent. Regardless of whether a patent is taken out, the
inventor can still use their invention; the added value of a patent is that the applicant
can enforce the right provided by the patent to stop others from using the patented
invention. This enforcement is not automatic, and requires the patent holder to have
sufficient resources to oppose those in breach of the patent. Nonetheless, the
disincentive to competitors and the patent holders’ option to enforce has an added
value that provides additional financial incentive to inventors.
For policy makers trying to figure out the value added by patent rights, seeking the
total value of an existing invention will over-state the value added by patent rights for
two reasons. Firstly, it will include the value of the invention itself, which would still be
valuable even if it was never patented, and secondly, legally enforceable monopoly
rights over the invention may become more valuable once public disclosure of the
invention is made under the patent system. To assess the private value generated by
the innovation patents system, we’re interested in the prospective value-add of
patents (see appendix 4.0 for details).

Page 25 of 35
There are three main methods of valuing patents in the literature, including: 1. patent
renewal methods (e.g. Schankerman & Pakes 1986) 2. stock market value through
Tobin's Q (e.g. Hall et al 2007), and 3. inventor surveys.
For this report we did not pursue estimates through the renewal method, as it
requires us to assume perfect information and perfect foresight on behalf of the
patent owner, and is very sensitive to the assumed form of distribution of patent
values (see appendix 4.0 for details). Method 2, using Tobin’s Q to see the impact
that innovation patents have on stock market prices was not deemed appropriate for
the policy intent, as this would mainly show the implied value to large firms, and not
SMEs that tend not to be listed on the Stock Exchange. Below we have used method
3, inventor surveys, as we expect this to give the highest average valuations, and we
are interested in the upper boundary of value. Usefully, a survey exists for the
innovation patent system in Australia and we can compare this to surveys from other
countries.
4.1 International and domestic comparison of patent value
We have found four surveys of patent value in the literature, of which one looks at the
innovation patent system. Figure 8 shows the value distributions for standard and
innovation patents granted in Australia, Germany and by the European Patent Office.
These values represent the value that inventors judged their patents to be worth at
the time of the survey. The x-axis is a log scale of 2014 Australian dollars and the y-
axis indicates the proportion of patents that fall within a certain value estimate range.

Page 26 of 35
Figure 8: Patent value distributions in 2014 Dollars
Source: Verve Economics (2013), Harhoff et al (2003), European Commission (2005), Jensen et al
(2009), IP Australia data transformation (see appendix 4.1). These value distributions are the
percentage of patents to fall within a value range plotted against the mid-point of that value range.
Best estimates of normalised data are shown in solid lines. Because the surveys
were run across different periods in different countries and currencies there is some
variability around the estimated 2014 dollar values, as indicated by a shaded area
around the best estimate. This occurs as we have converted the currency to
Australian dollars and applied an inflator as detailed in appendix 4.1. Briefly, the
variation in value estimates for European Patent Office data is + 10%, Australian
innovation patents data - 15% to + 15%, and Australian standard patents data -
13.5% to +78%.
Since Figure 8 is on a logarithmic scale the visual difference of shifting any of the
value distributions to the upper or lower bound does not significantly alter the overall
impression of the distributions in relation to one another. No upper or lower bound
line is shown for German standard patents, as the data was consistently denoted in
1980 German marks.
The valuations presented in Figure 8 are a mixture of the value-add of the patent and
the invention, since the figure shows inventor valuations of standard and innovation
patents subsequent to a patent being taken out. The results, therefore, reflect the
value of the invention plus the premium gained from having patent protection.
Page 27 of 35
For all surveys, data was sourced as interval data, that is, the number of patents that
fell within given valuation intervals. Note that in all four surveys the upper most
valuation interval is unbounded, and a mid-point has not been calculated.
For the Australian innovation patent data (Verve Economics 2003) this causes a
problem as 25% of data lies in its unbounded upper interval and therefore 25% of
data are not explicitly reflected in Figure 8. While for the other surveys the quantity of
observations in the unbounded area was much lower, at 0.3%, 0.77% and 1.23% for
German, European and Australian standard patents, respectively. Hence, the
appearance that the innovation patents value distribution stops well before the others
is at least in part an artefact of the interval boundaries chosen in the surveys.
4.2 An estimate of the private value-add of innovation patents
The fundamental question here becomes one of how much of an innovation patent’s
value is attributable to patenting, rather than to the value of the invention itself. An
invention itself holds an implicit value to inventors which could then be added to by a
patent through restricting competitors from using that invention. There is no direct
way to calculate this for Australian innovation patents with the available empirical
evidence, but the innovation patent value distribution combined with patent premium
estimates for the US allow us to get an estimate of the magnitude of their value-add.
Given the greater inventive step required and the higher maximum patenting period
for standard patents relative to innovation patents, it seems plausible that there is a
difference in the value distributions of the inventions. This follows from the
combination of two observations: 1. the idea that monopoly over the use of an
invention is likely to be positively related to the value of the invention itself, since the
more valuable an invention, the more valuable it may be to exclude others, and 2.
where a monopoly over an invention is more valuable and the inventive step
requirement is met, a prospective patent owner has an incentive to seek out the
longer maximum patenting period. These observations lead to the conjecture that the
standard patent system attracts more valuable inventions.
It seems reasonable to assume that the more valuable an invention is, the greater
the value of excluding others from it. But there is no reason to believe that the value
of the patent premium is different between innovation patents and standard patents.
i.e. it could be the case that both types of patent add a 10% premium to the
invention. Because the innovation patent attracts lower value inventions the total
value-add of the patent and invention is on average lower than inventions protected
with standard patents. The data is not inconsistent with this proposition although we
have no way of verifying that this is the case. On the other hand, it could be the case
that inventions filed in both systems have the same value, and the innovation patent
provides a lower premium – and this would be consistent with the observed values as
well.
We can try to get at the magnitude of the value of the patent premium by applying
findings from the related literature. Arora et al (2008) estimate the patent premium for
standard patents in the US, using data on patenting from the early 1990s. A number

Page 28 of 35
of simplifying assumptions have to be made, as detailed in appendix 4.2, which
include the assumption that innovation patents have patent premia comparable to
standard US patents. We take the highest and the lowest patent premium estimates
and apply them to the innovation patents survey data gathered by Verve Economics
(2013), treating the $1m+ patents as being worth just $1m. To get an upper value
bound we assume that Verve Economics survey respondents are representative of
the active population of innovation patents at the time of the survey, plus those that
had expired at full term. This leads to an expected upper bound value-add of the
innovation patent being $40m per annum, while the expected lower bound, where we
treat the survey respondents as un-representative, gives a value of $10m in private
value-add per annum. These estimates are the expected bounds of the average
annual present value of innovation patents’ value-add.
Using the patent valuation method of surveying inventors, which we expect would
provide the highest patent value estimates, and a set of assumptions to get the upper
and lower bounds of the expected average annual present value, we conclude that
the private value-add of the innovation patent system is in the low tens of millions.
Our assumption would be that applicants who hold innovation patents that have a
very high patent value-add would renew the innovation patent for longer to preserve
this value. We know that the majority of firms that behave in this manner are large
firms and international firms, which consequently presumably gain the largest private
benefit from innovation patents.
4.3 The regulatory burden falls on SMEs and private inventors
While the private monetary benefits are quite uncertain, the private regulatory cost is
relatively easy to estimate. We know that applicants fulfil a number of administrative
requirements to participate in the innovation patent system and these requirements
carry regulatory compliance costs. We calculate the regulatory costs according to the
Office of Best Practice Regulation guidelines (with a detailed breakdown in appendix
4.3) and include:
cost of time spent filing patents,
cost of time spent renewing patents,
cost of time spent requesting examination and subsequent amendments for
examination,
cost of time spent in disputes, both for applicants and defendants of the
dispute.
Without the innovation patent system these regulatory costs would not be incurred.
The costs amount to approximately $11.6m per annum, based on consultations
conducted by KPMG on behalf of IP Australia in preparing IP Australia’s 2014
regulatory audit. The lower and upper bound of these annual costs are a minimum of
$5.8m and a maximum of $17.3m.
The regulatory costs include the time spent by both Australian applicants and their
representatives. Consistent with OBPR guidelines, time spent by Australian agents
Page 29 of 35
working for international applicants is also included, but the time spent by
international applicants themselves is not.
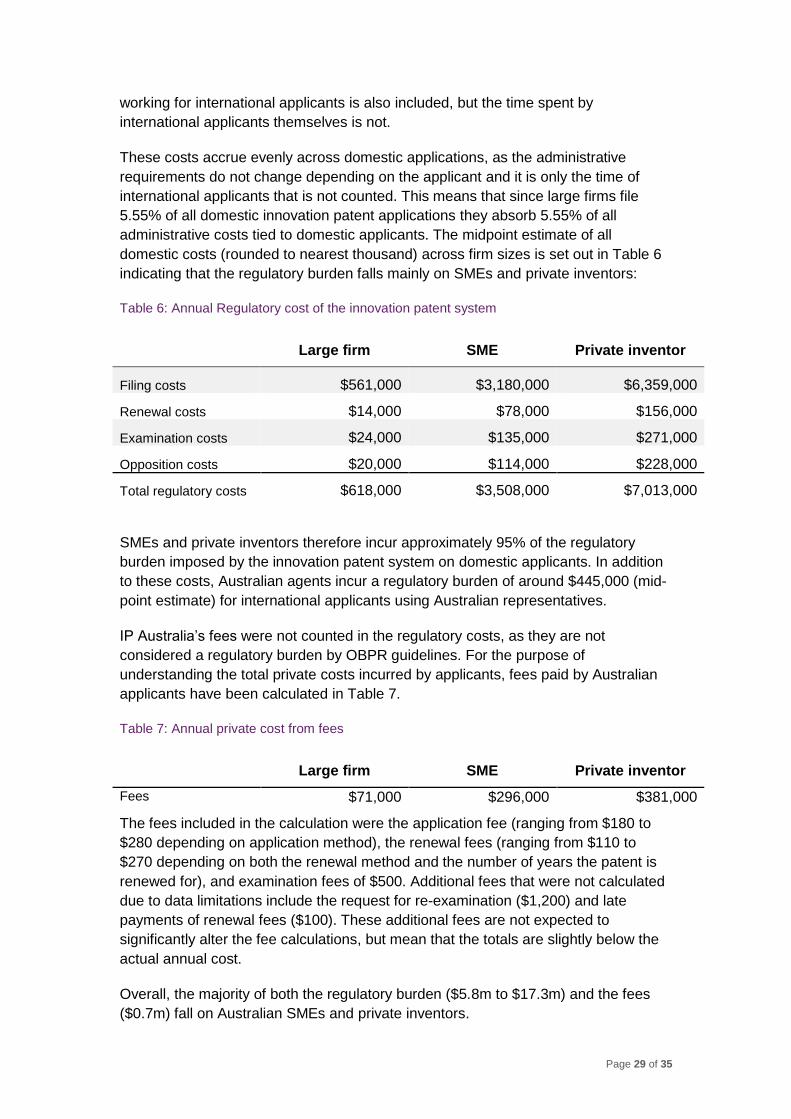
These costs accrue evenly across domestic applications, as the administrative
requirements do not change depending on the applicant and it is only the time of
international applicants that is not counted. This means that since large firms file
5.55% of all domestic innovation patent applications they absorb 5.55% of all
administrative costs tied to domestic applicants. The midpoint estimate of all
domestic costs (rounded to nearest thousand) across firm sizes is set out in Table 6
indicating that the regulatory burden falls mainly on SMEs and private inventors:
Table 6: Annual Regulatory cost of the innovation patent system
Large firm SME Private inventor
Filing costs $561,000 $3,180,000 $6,359,000
Renewal costs $14,000 $78,000 $156,000
Examination costs $24,000 $135,000 $271,000
Opposition costs $20,000 $114,000 $228,000
Total regulatory costs $618,000 $3,508,000 $7,013,000
SMEs and private inventors therefore incur approximately 95% of the regulatory
burden imposed by the innovation patent system on domestic applicants. In addition
to these costs, Australian agents incur a regulatory burden of around $445,000 (mid-
point estimate) for international applicants using Australian representatives.
IP Australia’s fees were not counted in the regulatory costs, as they are not
considered a regulatory burden by OBPR guidelines. For the purpose of
understanding the total private costs incurred by applicants, fees paid by Australian
applicants have been calculated in Table 7.
Table 7: Annual private cost from fees
Large firm SME Private inventor
Fees $71,000 $296,000 $381,000
The fees included in the calculation were the application fee (ranging from $180 to
$280 depending on application method), the renewal fees (ranging from $110 to
$270 depending on both the renewal method and the number of years the patent is
renewed for), and examination fees of $500. Additional fees that were not calculated
due to data limitations include the request for re-examination ($1,200) and late
payments of renewal fees ($100). These additional fees are not expected to
significantly alter the fee calculations, but mean that the totals are slightly below the
actual annual cost.
Overall, the majority of both the regulatory burden ($5.8m to $17.3m) and the fees
($0.7m) fall on Australian SMEs and private inventors.

Page 30 of 35
4.4 Third party costs off-set private value
The literature discusses third party costs imposed by intellectual property rights as
the additional costs to consumers and opportunity costs of other firms that are unable
to act, given the short-term exclusivity of the patenting firm. Where IP rights are
effective in establishing exclusive rights, there can even be a decrease in innovation
activities due to increasing transaction costs of subsequent innovators, limited
imitation causing a natural inhibition to technological change, or delays to the
commercial exploitation of future innovation (see for example Kanwar & Evenson
2003 or Hall & Harhoff 2012).
While there are a range of third party costs that undoubtedly exist to some degree, it
is unclear how they can be measured for the innovation patent. The theoretical costs
can be shown to exist under certain circumstances, such as when innovation is
sequential and complementary, or when innovations are small, but knowledge of the
proliferation of these circumstances across the economy, and assigning an actual
monetary cost to them is not a simple task. The literature traditionally shows that the
positive incentive effects of the IP right system will off-set these third party costs, but
in the case of the innovation patent we have not seen any evidence of such off-
setting effects or additional incentives to innovate. Given that foreign applications are
unlikely to disclose any ‘new to world’ inventions to the Australian market, it is likely
that third party costs have a net negative impact. Quantifying these costs has not
however been possible.
Where applicants value their own certainty to be able to enforce less than the
uncertainty cost to competitors – as appears to be the case for innovation patents
that are not certified – it is likely that third party costs would directly off-set the private
value.
5. The economic impact
We investigated whether having innovation patents would encourage R&D and
traditional patent applications that would not otherwise have occurred, particularly by
SMEs. The evidence suggests that this does not happen;
Private inventors and SMEs do participate in the innovation patent system, but the
vast majority, 74% of all applicants between 2001 and 2013, only ever file one
innovation patent, and tended to allow their innovation patents to lapse early, rather
than pay the renewal fee. This suggests that the vast majority of SMEs found little
value in the system, or at least not enough value to use either the innovation or
standard patent system again, or indeed pay the renewal fee of $110 to $220. We
found evidence that the system discouraged follow-on patenting or innovation if we
consider additional patenting a proxy for innovation. If we broaden that group of
SMEs and private inventors out, to define a set of light users of the innovation patent
system, we find that 86% of SMEs and private inventors only ever file 1-4 innovation
patents and never file any standard patents.

Page 31 of 35
Only 1% of the SME and private inventors in the innovation patent system are
moderate to heavy users of the system: They entered the patent system by first filing
an innovation patent and filed at least 5 applications over the 12 year period, having
at least one examined. This is the type of repeat use which would indicate a
perception of additional value from each innovation patent. Of the 9,644 SMEs and
private inventors that filed innovation patents, only 37 entities fall into this category.
With that in mind, it is not surprising that we see no macroeconomic effect from the
innovation patent system.
The innovation patent system may or may not have a net benefit in aggregate terms.
The private value generated by innovation patents appears to be in low tens of
millions of dollars, and this should theoretically accrue mainly to firms that maintain
and certify their patents, of which large firms hold the greatest proportion. The
regulatory and private cost of the system is equally in the low tens of millions of
dollars, but fall mainly on private inventors and SMEs. It is not possible to quantify
the third-party costs, but even if they were relatively low costs, the system would not
be expected to yield an aggregate net benefit. The distribution of costs and benefits
are however skewed against SMEs. We estimate the range of regulatory burden to
be between $5.8m and $17.3m per annum. The majority of domestic costs, around
95%, falls on SMEs and private inventors, suggesting that since its introduction, the
innovation patent system has imposed a regulatory cost on SMEs and private
inventors exceeding $100m.
Contrary to evidence in developing countries, the innovation patent system does not
appear to have resulted in higher sales growth or more innovation as proxied by
patenting in Australia. The innovation patent system does attract R&D spenders, but
only in the manufacturing industries, while the standard patent system also attracts
firms in the manufacturing industry and it is also is used by a broader range of
industries.
We find evidence that innovation patents have some positive effects, but in the one
area of impact, firm survival, standard patents are found to have a bigger positive
effect, and there is no effect from certifying innovation patents.
ACIP (2014: 38-39) noted that while large international companies may obtain private
value from the system, it is unlikely that the innovation they are protecting would not
have occurred if not for the innovation patent system - i.e. that the innovation patent
system did not incentivise the innovation as such, and is therefore imposing a
deadweight cost on third parties. The majority of innovation patents are not certified,
and so the value of these patents are likely to exist in the uncertainty they create in
the marketplace, a key factor in abolishing the system in the Netherlands and
Belgium.

Page 32 of 35
References
ACIP (1995) Review of the Petty Patents System. Canberra: ACIP
http://www.acip.gov.au/pdfs/ACIP_Final_Report_Review_of_Petty_Patent_Syst
em_Archived.pdf
ACIP (2013) Review of the Innovation Patent system: Options Paper. Canberra:
ACIP.
http://www.acip.gov.au/pdfs/Options_Paper_Innovation_Patent_Review.pdf
ACIP (2014) Review of the Innovation Patent System: Final Report. Canberra: ACIP.
http://www.acip.gov.au/pdfs/ACIP_Final_Report_-
_Review_of_the_Innovation_Patent_System.pdf
Aghion, P., Bloom, N., Blundell, R., Griffith, R., & Howitt, P. (2005). Competition,
Innovation: An Inverted-U Relationship. The Quarterly Journal of Economics
120(2): 701-728
Aghion, P., Harris, C., Howitt, P., & Vickers, J. (2001). Competition, Imitation and
Growth with Step-by-Step Innovation. Review of Economic Studies, 68(3):
467–492
Aghion, P., and Howitt, P. (1992). A Model of Growth through Creative Destruction.
Econometrica 60(2): 323–351
Arora A, Ceccagagnoli, M & Cohen, W.S. (2008) R&D and the patent premium.
International Journal of Industrial Organisation 26(5): 1153-1179
Arora, A. & Athreye, S. (2012). Patent Incentives: returns to patenting and the
inducement for research & development. UK Intellectual Property Office (IPO)
economic research paper 2012/20: http://www.ipo.gov.uk/ipresearch-
patincentive.pdf
Audretsch, D. (1991). New-firm survival and the technological regime. Review of
Economics and Statistics, 60(3), 441–450
Audretsch, D., & Mahmood, T. (1995). New firm survival: New results using a hazard
function. The Review of Economics and Statistics, 77(1), 97–103
Blundell, R., Griffith, R., & Van Reenen, J. (1999). Market Share, Market Value and
Innovation in a Panel of British Manufacturing Firms. Review of Economic
Studies 66(3): 529–554
Bielig, A. (2012) Intellectual property and economic development in Germany:
empirical evidence for 1999-2009. European journal of Law and Economics.
http://rd.springer.com/article/10.1007/s10657-012-9324-5/fulltext.html
Buddelmeyer, H., Jensen ,P. H. & Webster, E. (2010). Innovation and the
determinants of company survival. Oxford Economic Papers 62(2): 261-285
Carree, M. & Thurik, R. 1996. Entry and exit in retailing: Incentives, barriers,
displacement and replacement. Review of Industrial Organization 11(2): 155-
172

Page 33 of 35
Cefis, E., & Marsili, O. (2006). Survivor: The role of innovation in firms’ survival.
Research Policy 35(5): 626–641.
Christie, A.F. & Moritz, S.L. (2004). Australia’s Second-Tier Patent System: A
Preliminary Review. IPRIA Report No. 02/04, November 2004 (Revised April
2005); Available at: http://www.ipria.org/publications/reports/AU_2nd-
tier_Report-revised.pdf
Christie, A. F. & Moritz, S.L., (2007) Harnessing minor innovation: Australia. p. 119-
141 in: Suthersanen, U., Dutfield, G & Chow, K.B. eds. (2007). Innovation
without patents: harnessing the creative spirit in a diverse world. Cheltenham,
Edward Elgar.
http://search.ebscohost.com/login.aspx?direct=true&db=cat00542a&AN=ipalc.u
36063&site=eds-live&scope=site
Cincera, M., & Galgau, O. (2005). Impact of Market Entry and Exit on EU Productivity
and Growth Performance. European Commission, Directorate-General for
Economic and Financial Affairs, Economic Papers, No. 222
Department of Industry and Science (2014) Australian Innovation System Report
2014. Canberra: Department of Industry and Science;
http://www.industry.gov.au/industry/Office-of-the-Chief-
Economist/Publications/Pages/Australian-Innovation-System.aspx
Disney, R., Haskel, J., & Heden, Y. (2003). Entry, exit and establishment survival in
UK manufacturing. Journal of Industrial Economics, 51(1): 91–112
Dixit, A., & Stiglitz, J. (1977). Monopolistic Competition and Optimum Product
Diversity. American Economic Review 67(3): 297–308
Dunne, M.R., & Samuelson, L. 1988. “Patterns of Entry and Exit in the U.S.
Manufacturing Industries.” Rand Journal of Economics 19(4): 495-515
European Commission. (2005). The Value of European Patents: Evidence from a
Survey of European Inventors. European Commission, Brussels.
http://ec.europa.eu/invest-in-
research/pdf/download_en/patval_mainreportandannexes.pdf
European Commission. (2014). Belgium-Brussels: Study on the economic impact of
the utility model legislation in selected Member States; 2014/S 017-025220;
Contract award notice: http://ted.europa.eu/udl?uri=TED:NOTICE:25220-
2014:TEXT:EN:HTML
Gilbert, R. & Newbery, D. (1982). Preemptive Patenting and the Persistence of
Monopoly. American Economic Review 72(3): 514–526.
Geroski, P.A. (1995). What Do We Know about Entry? International Journal of
Industrial Organization 13(4): 321-440
Greenhalgh C & Longland, M. (2005). Running to stand still? - the value of R&D, patents and trade marks in innovating manufacturing firms. International journal of the Economics of Business 12(3): 307-28

Page 34 of 35
Greenhalgh, C., Rogers, M., Helmers, C. & Senia, V. (2011) Trade mark incentives.
UK-IPO economic research paper 2011/1: http://www.ipo.gov.uk/ipresearch-
tmincentives-full-201107.pdf
Griliches, Z. (1990). Patent statistics as economic indicators: A survey. Journal of
Economic Literature, 28(4): 1661–1707
Hall, B., & Harhoff, D. (2012) Recent research on the economics of patents. Annual
Review of Economics 4: 541-565
Hall, B., Jaffe, A., & Trajtenberg, M., (2000). Market Value and Patent Citations: A
First Look. NBER working paper No. 7741, http://www.nber.org/papers/w7741
Hall, B., Thoma, G., & Torrisi, S. (2007) The market value of patents & R&D:
Evidence from European firms. NBER Working Paper 13426,
http://www.nber.org/papers/w13426.pdf
Harhoff, D., Scherer, F. & Vopel, K. (2003). Citations, family size, opposition and the
value of patent rights. Research Policy 32(8): 1343-1363
Hausman, J., Hall, B., & Griliches, Z. (1984). Econometric Models for Count Data and
an Application to the Patents-R&D Relationship. Econometrica 52(4): 909–938
Helmers, C., & Rogers, M. (2010). Innovation and the Survival of New Firms in the
UK. Review of Industrial Organisation 36(3): 227-248.
Herck, G. van. (1984). Entry, Exit and Profitability. Managerial and Decision
Economics 5(1): 25-31
IP Australia. 2014. Australian Intellectual Property Report 2014. Canberra: IP
Australia, available at http://www.ipaustralia.gov.au/uploaded-
files/reports/intellectual-property-report-2014-low-res.pdf
Jensen, P.H., Webster, E. & Buddelmeyer, H. (2007). Innovation and Industrial
Evolution. The Australian Economics Review 40(1): 82-89
Jensen, P.H., Webster, E. & Buddelmeyer, H. (2008). Innovation, Technological
Conditions and New Firm Survival. The Economic Record 84(267): 434-448
Jensen, P.H., Thomson, R.K., & Yong, J.S. (2011). Estimating the patent premium:
Evidence from the Australian Inventor Survey. Strategic Management Journal
32(10): 1128–38.
http://www.ipria.org/publications/wp/2009/IPRIAWP11.2009.pdf
Kanwar S & Evenson R. (2003). Does Intellectual Property Protection Spur Technical
Change? Oxford Economic Papers 55(2): 235‐264
Kardam, K.S. (2007). Patenting in the Emerging Fields of Technology. Journal of
Intellectual Property Rights 12(1): 15-29
Kim, Y. K., Lee, L., Park, W.K., & Choo, K. (2012). Appropriate intellectual property
protection and economic growth in countries at different levels of development.
Research Policy 41(2): 358-375

Page 35 of 35
Kumar, N. (2003). Intellectual property rights, technology and economic development: experiences of Asian countries. Economic and Political Weekly 38(3): 209-226
Maskus, K., & McDaniel C. (1999). Impacts of the Japanese Patent System on
Productivity Growth. Japan and the World Economy 11(4): 557-74
http://www.sciencedirect.com/science/article/pii/S0922142599000122
Moreau E.B. & Tether, B.S. (2011). Registered designs & business performance-
exploring the link. Chapter 2 in: UK Intellectual Property Office. (2011). The
Economics of Design Rights. Newport: UK-IPO:
http://www.ipo.gov.uk/ipresearch-designsreport2-201109.pdf
Prud'homme, D. (2014). Creating a 'model' utility model patent system: A
comparative analysis of the utility model patent systems in Europe and China.
IP Key Project Working Paper Series, for the European Commission, Office for
Harmonisation in the Internal Market and China's State Intellectual Property
Office by the Center for Global R&D Management and Innovation.
http://papers.ssrn.com/sol3/papers.cfm?abstract_id=2541900
Qian, Y. (2007). Do additional National Patent Laws Stimulate Domestic Innovation in
a Global Patenting Environment? Review of economics and Statistics 89(3):
436-453
Rosenbaum, P. R., & Rubin, D. B. (1985). Constructing a control group using
multivariate matched sampling methods that incorporate the propensity score.
The American Statistician, 39(1): 33–38
Schankerman, M. (1998). How valuable is patent protection: estimates by technology
fields. RAND journal of Economics 29(1): 77-107
Storey, D.J. & Wynarczyk, P. (1996). The survival and non survival of micro firms in
the UK. Review of Industrial Organization 11(2): 211–229
Suthersanen, U. (2006). Utility models and innovation in developing countries.
International Centre for Trade and Sustainable Development, issue paper no.
13 http://unctad.org/en/Docs/iteipc20066_en.pdf
Verve Economics (2013) The economic value of the Australian innovation patent:
The Australian innovation patent survey. Report for ACIP
http://www.acip.gov.au/pdfs/Economic_Value_of_the_Innovation_Patent_-
_Final_Report_-_Verve_Economics_-_24_Mar_2013.pdf