LSHTM Research Onlineresearchonline.lshtm.ac.uk/4650950/1/Macleod-etal-2018-Optimising-age... ·...
9
LSHTM Research Online Macleod, Colin K; Porco, Travis C; Dejene, Michael; Shafi, Oumer; Kebede, Biruck; Negussu, Nebiyu; Bero, Berhanu; Taju, Sadik; Adamu, Yilikal; Negash, Kassahun; +7 more... Haileselassie, Tesfaye; Riang, John; Badei, Ahmed; Bakhtiari, Ana; Willis, Rebecca; Bailey, Robin L; Solomon, Anthony W; (2018) Optimising age adjustment of trichiasis prevalence estimates using data from 162 standardised surveys from seven regions of Ethiopia. Ophthalmic Epidemiology. pp. 1-8. ISSN 0928-6586 DOI: https://doi.org/10.1080/09286586.2018.1555262 Downloaded from: http://researchonline.lshtm.ac.uk/4650950/ DOI: https://doi.org/10.1080/09286586.2018.1555262 Usage Guidelines: Please refer to usage guidelines at https://researchonline.lshtm.ac.uk/policies.html or alternatively contact [email protected]. Available under license: http://creativecommons.org/licenses/by/2.5/ https://researchonline.lshtm.ac.uk
Transcript of LSHTM Research Onlineresearchonline.lshtm.ac.uk/4650950/1/Macleod-etal-2018-Optimising-age... ·...

LSHTM Research Online
Macleod, Colin K; Porco, Travis C; Dejene, Michael; Shafi, Oumer; Kebede, Biruck; Negussu, Nebiyu;Bero, Berhanu; Taju, Sadik; Adamu, Yilikal; Negash, Kassahun; +7 more... Haileselassie, Tesfaye;Riang, John; Badei, Ahmed; Bakhtiari, Ana; Willis, Rebecca; Bailey, Robin L; Solomon, Anthony W;(2018) Optimising age adjustment of trichiasis prevalence estimates using data from 162 standardisedsurveys from seven regions of Ethiopia. Ophthalmic Epidemiology. pp. 1-8. ISSN 0928-6586 DOI:https://doi.org/10.1080/09286586.2018.1555262
Downloaded from: http://researchonline.lshtm.ac.uk/4650950/
DOI: https://doi.org/10.1080/09286586.2018.1555262
Usage Guidelines:
Please refer to usage guidelines at https://researchonline.lshtm.ac.uk/policies.html or alternativelycontact [email protected].
Available under license: http://creativecommons.org/licenses/by/2.5/
https://researchonline.lshtm.ac.uk
Optimising age adjustment of trichiasis prevalence estimates using data from162 standardised surveys from seven regions of EthiopiaColin K. Macleoda, Travis C. Porcob,c, Michael Dejened, Oumer Shafie, Biruck Kebedee, Nebiyu Negussue,Berhanu Berof, Sadik Tajug, Yilikal Adamug, Kassahun Negashh, Tesfaye Haileselassiei, John Riangj, Ahmed Badeik,Ana Bakhtiaril, Rebecca Willisl, Robin L. Baileya, and Anthony W. Solomona,m
aClinical Research Department, London School of Hygiene & Tropical Medicine, London, UK; bFrancis I. Proctor Foundation, Department ofOphthalmology, University of California, San Francisco, San Francisco, USA; cDepartment of Epidemiology and Biostatistics, University ofCalifornia, San Francisco, San Francisco, USA; dMichael Dejene Public Health Consultancy Services, Addis Ababa, Ethiopia; eFederal Ministry ofHealth, Addis Ababa, Ethiopia; fThe Fred Hollows Foundation Ethiopia, Addis Ababa, Ethiopia; gDepartment of Ophthalmology, Addis AbabaUniversity, Addis Ababa, Ethiopia; hAMREF Health Africa Ethiopia, Addis Ababa, Ethiopia; iORBIS International, Addis Ababa, Ethiopia;jGambella Regional Health Bureau, Gambella, Ethiopia; kDepartment of Disease Prevention, Somali Regional State Health Bureau, Jigjiga,Ethiopia; lTask Force for Global Health, Decatur, Georgia, USA; mDepartment of Control of Neglected Tropical Diseases, World HealthOrganization, Geneva, Switzerland
ABSTRACTPurpose: The prevalence of trichiasis is higher in females and increases markedly with age.Surveys carried out in the daytime, particularly in developing countries, are prone to find olderindividuals and females at home at the time of the survey. Population-level trichiasis estimatesshould adjust sample proportions to reflect the demographic breakdown of the population,although the most accurate method of doing this is unclear.Methods: Having obtained data from 162 surveys carried out in Ethiopia as part of the GlobalTrachoma Mapping Project from 2012 to 2015, we used internal validation with both Brier andLogarithmic forecast scoring to test stratification models to identify those models with the highestpredictive accuracy. Selection of partitions was undertaken by both simple random sampling (SRS)and cluster sampling (CS) over 8192 selections.Results: A total of 4529 (1.9%) cases of trichiasis were identified from 241,139 individuals aged≥15 years from a total of 4210 kebeles and 122,090 households visited. Overall, the binningmethod using 5-year bands from age 15 to 69 years, with coarser binning in 20-year age-bandsabove this age, provided the best predictive accuracy, in both SRS and CS methodologies and forboth the Brier and Logarithmic scoring rules.Conclusion: The greatest predictive accuracy for trichiasis estimates was found by adjusting forsex and in 5-year age-bands from the age of 15 to 69 years and in 20-year age-bands in thoseaged 70 years and greater. Trichiasis surveys attempting to make population-level inferencesshould use this method to optimise surgery backlog estimates.
ARTICLE HISTORYReceived 31 January 2018Revised 24 October 2018Accepted 27 November 2018
KEYWORDSTrachoma; trichiasis;population-basedprevalence survey; GlobalTrachoma Mapping Project
Introduction
Trachoma is an eye disease caused by infection with thebacterium Chlamydia trachomatis. It is thought to accountfor the blindness or visual impairment of 1.9million peopleworldwide.1 Repeated conjunctival infections2 contributeto trichiasis,3 associated with chronic, painful irritation ofthe cornea leading to permanent opacification, visualimpairment, and blindness.4 Surgery to correct trichiasisis the recommendedmeans bywhich further vision loss canbe minimised, and in many countries, ophthalmic nursesare trained to carry out these corrective surgeries. However,training trichiasis surgeons is costly, and the numbersrequired are largely informed by the estimated number of
eyes requiring surgery in a given area. Accurate population-level estimates of the trichiasis prevalence help guide plan-ning for recruitment and training and enable confidentassessment of whether or not districts have reached theWorld Health Organization (WHO) elimination preva-lence threshold.
In population-based surveys, the distribution of ageand gender in sampled individuals only imperfectlyrepresents the true demographics of the underlyingpopulation. This may be due to random variations inthe demographics of those sampled or a bias related tothe sampling methodology. In trachoma, both femalegender and increasing age are strongly associated withtrichiasis,5–10 and therefore, sample-based estimates of
CONTACT Colin K. Macleod [email protected] Clinical Research Department, London School of Hygiene & Tropical Medicine, London, UKColor versions of one or more of the figures in the article can be found online at www.tandfonline.com/iope.
OPHTHALMIC EPIDEMIOLOGYhttps://doi.org/10.1080/09286586.2018.1555262
© 2018 Author(s). Published with license by Taylor & Francis Group, LLCThis is an Open Access article distributed under the terms of the Creative Commons Attribution License (http://creativecommons.org/licenses/by/4.0/), which permits unrestricteduse, distribution, and reproduction in any medium, provided the original work is properly cited.

population-level outcomes risk being biased if particu-lar age and gender groups are disproportionately repre-sented in the sample without estimates being weightedaccordingly. Disproportionate representation in sam-ples collected via house-to-house surveys is likelybecause of age- and gender-determined patterns inabsence from the home for work and education.
The optimal method for weighting prevalence esti-mates is unclear. Although gender is generally dichot-omised (feminine/female, masculine/male), the idealway to subdivide the range of ages in a sample is lessobvious. At one extreme, we could subdivide indivi-duals by their age in years, but this might lose theunderlying variation in age-dependent risk by introdu-cing imprecision in each age-specific estimate. At theother extreme, all individuals could be encompassed bya division that covers the entire range of ages in thesample, but this ignores changes in risk with age. Thewidth of divisions used can be considered as the band-width of the underlying function. Cross-validation hasbeen used in cases where bandwidth of a density func-tion needs to be optimised to obtain a smoothed esti-mate of the underlying function.11–14
In this study, we apply a method of cross-validationto examine data from 162 standardised population-basedtrachoma prevalence surveys carried out in Ethiopiafrom 2012 to 2015, as part of the Global TrachomaMapping Project (GTMP).15 The accuracy of each age-binning strategy was evaluated using both a Brier score16
and a Logarithmic scoring rule.17 In addition, we exam-ine potential effects of terminal digit preference in agereporting.
Methods
All GTMP surveys followed a standardised methodology,the full details of which are described elsewhere.18,19
Briefly, in each survey, a two-stage cluster samplingmeth-odology was used, with kebeles, the lowest administrativeunit with available population estimates, sampled at thefirst stage, using a probability proportional to populationsize approach. At the second stage, a subsection of thekebele known variously as a got, gere, developmental unit,or developmental team was randomly selected on the dayof survey, and all residents aged 1 year and over in house-holds within this selected second-stage cluster were eligi-ble for inclusion in the survey.
Local health-care workers were trained to grade tra-choma using the WHO simplified trachoma gradingsystem3,4 and were required to pass a standardised train-ing course and field-based examination against a certifiedgrader trainer in order to qualify as a grader for the survey.
Candidates were assessed on their ability to grade theocular clinical sign trachomatous inflammation—follicu-lar (TF). Examination results were called to data recordersand recorded in a smartphone application developed forthe project. Data were uploaded directly from the smart-phones to a secure cloud-based server.
Models
ResolutionCensus populations are most commonly presented bygender and age, with a minimum resolution of 5 years.For this reason, credible methods of aggregating ageinto bins could only have bandwidths in multiples of5 years. However, we used a 1-year age bin as a controlfor the finest possible resolution, estimating the popu-lations in these bins as the population of the respective5-year bin divided by 5.
Transition pointsIn contrast to developed countries, the population ofdeveloping countries typically decreases sharply abovethe age of average life expectancy. This means that atages greater than the average life expectancy, the num-ber of survey-sampled individuals in any bin decreases,and the data become more sparse. Bin proportion esti-mates can, therefore, lack precision. With this in mind,it is reasonable to consider larger bin sizes at higherages to produce more accurate estimate of the trueproportion of individuals with trichiasis in these bins.We included a transition from fine to coarse resolutionin this analysis, varying the age at which coarser-resolution binning was introduced between 40, 60, 65,and 70 years.
A total of 17 binning models were evaluated thatcould credibly be used for age adjustment in popula-tion-based surveys (Table 1).
Sampling strategiesThe accuracy of models was evaluated by internalcross-validation, partitioning the data into training(95%) and test (5%) data-sets. Two methods of parti-tioning were compared: simple random sampling (SRS)with partitioning at individual level and cluster randomsampling (CRS), respecting the clustered design of thesurvey. In the SRS methodology, individuals wereselected by random number generation in the range[0, 1]. In the CRS methodology, all surveys were stra-tified, and one cluster from each survey was selectedrandomly. All inhabitants in the selected cluster foreach survey were chosen to be the test group, and allparticipants living in the other clusters in the survey
2 C. K. MACLEOD ET AL.

were selected as the training set, with bin-specific pro-portions derived from a given survey applied to thetraining set from that survey.
At each iteration, and for each binning type, age- andgender-specific proportions were calculated using thetraining data-set. These probabilities were then assignedto individuals in the test data-set based on their respec-tive age and gender. In this way, the accuracy of prob-abilities derived from each strategy could be evaluated bytheir ability to predict outcomes in the test data-set. Thegoodness of fit was evaluated by two metrics: a Brierscore and a Logarithmic score. The algorithm for parti-tioning and scoring is shown in Table 2.
In the training data-set, zero-count bins wereassigned an artificial probability using a Laplace esti-mator, with the bin probability assigned as 1= 1þ Nð Þ,where N is the total number of individuals examined inthe bin. Similarly, full (100% prevalence) bins wereassigned a probability of 1� 1= 1þ Nð Þ.
Test set scores
Brier scoreFor each model, the squared difference between thepredicted probability of trichiasis in the jth individual,pj, and the proportion of trichiasis in the actual surveyfindings, Tj (0 or 1: the absence or presence of trichia-sis), was calculated for all individuals. The mean score
for all individuals was calculated for each iteration,expressed as the equation:
B r; qð Þ ¼ 1N
XN
j¼1
Tj � pj� �2
with the highest predictive accuracy achieved by mini-mising this score.
Logarithmic scoreThe Logarithmic score was similarly calculated byassigning a score to each individual. If trichiasis was
Table 1. The predictive accuracy of cross-validated age-binning methods in estimating the true prevalence of trichiasis in those aged≥15 years. Division by gender was included a priori, with variations in the method of age binning considered which could be used intrachoma prevalence surveys. For each sampling method (simple random sampling [SRS] and cluster random sampling [CRS]) and foroutcome score (Brier and Logarithmic), the ordered rank of accuracy for each binning method is shown (rank 1 – most accurate, rank17 – least accurate).
Binning type Simple random samplinga Cluster random samplingb
Model 1st increment Transition age 2nd increment Brier score Rankc Log score Rankc Brier score Rankc Log score Rankc
A 5 70 20 0.0178 1 −0.0816 1 0.0178 1 −0.0813 1B 5 70 10 0.0178 2 −0.0816 2 0.0178 2 −0.0813 2C 5 60 10 0.0179 3 −0.0816 5 0.0178 3 −0.0813 4D 5 65 20 0.0179 4 −0.0816 4 0.0178 4 −0.0813 5E 5 65 10 0.0179 5 −0.0816 3 0.0178 5 −0.0813 3F 5 – – 0.0179 6 −0.0817 6 0.0178 6 −0.0813 6G 5 40 10 0.0179 7 −0.0817 8 0.0178 7 −0.0814 7H 5 60 20 0.0179 8 −0.0817 9 0.0178 8 −0.0814 8I 10 65 20 0.0179 9 −0.0819 13 0.0178 9 −0.0816 11J 10 – – 0.0179 10 −0.0819 12 0.0178 10 −0.0816 10K 5 70 – 0.0179 11 −0.0817 7 0.0179 14 −0.0816 12L 5 75 – 0.0179 12 −0.0817 10 0.0179 15 −0.0816 13M 1 – – 0.0179 13 −0.0819 11 0.0178 11 −0.0815 9N 5 40 20 0.0179 14 −0.082 14 0.0178 12 −0.0817 14O 20 – – 0.0179 15 −0.0828 15 0.0178 13 −0.0825 15P 50 – – 0.0181 16 −0.088 16 0.0181 16 −0.0877 16Base rated – – – 0.0184 17 −0.0915 17 0.0184 17 −0.0914 17
aSimple random sampling – data partitioned into 95% training/5% test data by randomly sampling individuals.bCluster random sampling – data partitioned by stratifying the data-set by survey and then selecting one cluster in each. All individuals in this clustercomprised the test data, with individuals in all other clusters comprising the training data.
cRanked accuracy (1 most accurate, 17 least accurate) of binning method by Brier score (lowest score most accurate) and Logarithmic score (lowest absolutevalue score most accurate). Scores presented have been truncated to four decimal places for brevity; full precision was used for ranks.
dEquivalent to probability of trichiasis being constant for all individuals aged ≥15 years of a given gender, with the probability equal to the overall proportionof the ≥15-year-old population of that gender that had trichiasis: (total trichiasis cases [male or female]/total individuals [male or female] examined).
Table 2. Algorithm for evaluating alternative age bandwidthsto optimise the predictive accuracy of trichiasis estimates.1. For each iteration:i Partition the data into a training (95%) and test (5%) set using
either SRS or CRS.ii Apply each binning method to individuals in the training set and
calculate the proportion of individuals with trichiasis in each bin foreach method.
iii Apply the bin proportions to the equivalent bins applied to the testdata-set and compute the Brier score, B, and Logarithmic score, L, via
B r; qð Þ ¼ 1N
PN
j¼1Tj � pj� �2
L r; qð Þ ¼ 1N
PN
j¼1Tj log10pj þ 1� Tj
� �log 1� pj
� �� �
where r is the training set, q is the binning method, Tj is the vector ofthe trichiasis results of the individuals in the training data-set, and pj isthe probability of trichiasis for a given individual and binning method.
2. Calculate the mean B qð Þ and L qð Þ over all 8192 iterations.
SRS: simple random sampling; CRS: cluster random sampling.
OPHTHALMIC EPIDEMIOLOGY 3
present, the score was assigned as the logarithm (base10) of the probability of trichiasis. If trichiasis wasabsent, the score was assigned as the logarithm (base10) of 1 − (probability of trichiasis). The Logarithmicscore for each model was assigned as the mean of allsuch values for each individual at each iteration,expressed as the equation:
L r; qð Þ ¼ 1N
XN
j¼1
Tjlog10Pj þ 1� Tj� �
log 1� Pj� �� �
with the highest predictive accuracy achieved by max-imising this score.
The 95% confidence interval for each score wasestimated directly by calculating the 2.5th and 97.5thcentiles from the ordered list of all score results over alliterations.
Errors in age reporting
When self-reporting age, it is common for individualsto have biases towards particular figures, known asterminal digit preference.20 This usually means thatthere is an excess of terminal digit 0s and/or 5s in thereported ages of the sampled population. To investigateany effect of errors in self-reporting of age from surveyparticipants, we applied a normal distribution N σ; pð Þaround the reported age, considering positively biased(tendency to over-estimate), negatively biased (ten-dency to under-estimate), and neutral (unbiased uncer-tainty in an individual’s reported age) distributions. Inthe positively biased case, the mean was +2 years; in thenegatively biased case, the mean was −2 years; and inthe neutral case, the mean was 0 year. In each case,a standard deviation, σ, of 2 years was used. Modelswere applied to data sampled over 8192 iterations.
As a case example, we apply this age distribution tothe census data from the largest region in Ethiopia,Oromia, to estimate the error in the backlog of trichiasisthat would be associated with each error (neutral bias,positive bias, and negative bias) and report the results asthe percentage change in the estimate of the backlogwhen applying the optimal binning method to this popu-lation. As a control, we included the trichiasis backlogestimate that would arise from a constant trichiasis baserate applied to all individuals, irrespective of age.
Ethical clearance
The overall GTMP protocol and the subsequent proto-col to carry out this secondary analysis was approvedby the ethics committee of the London School of
Hygiene & Tropical Medicine (LSHTM; Ref 6319 and8355 and 14519). The survey protocol was approved bythe ethics committee of each participating regional statein Ethiopia. The World Health Organization EthicsReview Committee exempted this secondary analysisof anonymised data from full review (0002998).
Results
A total of 241,139 individuals aged ≥15 years wereexamined in seven regions in Ethiopia in 162 surveyscarried out from December 2012 to May 2015. All sur-veys followed the same two-stage sampling methodol-ogy, with a total of 4210 kebeles and 122,090 householdsvisited. Primary analyses are presented elsewhere.5,6,21–24
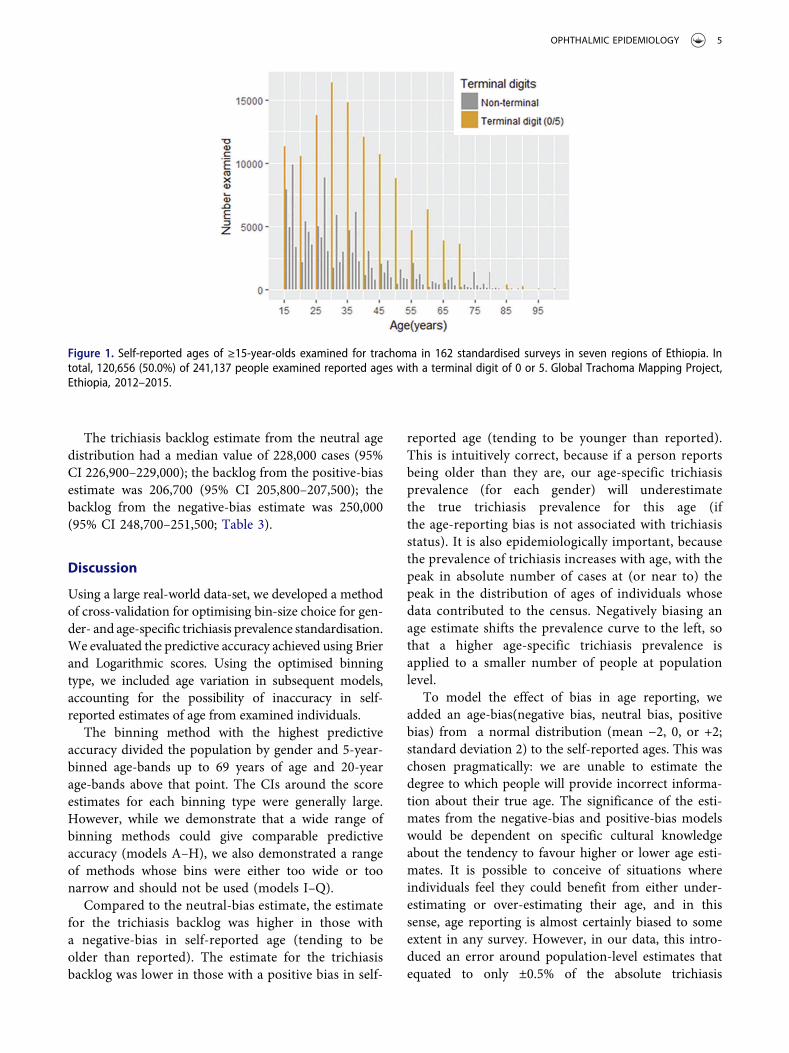
In total, 140,115 (58.1%) of ≥15-year-olds examinedwere female. Half of all those examined aged ≥15 yearsreported their age with a terminal digit of 0 or 5 (Figure1). The median reported age of ≥15-year-olds examinedwas 32 years (interquartile range [IQR] 24–45; minimum15, maximum 100). A total of 4529 cases of trichiasis(1.9% of ≥15-year-olds examined) were identified, with3568 (78.8%) of cases found in females. The median ageof those found to have trichiasis was 50 years (IQR40–64, minimum 15, maximum 100).
The Brier and Logarithmic scores for each binningmethod, considering SRS and CRS methodologies, aswell as the ranked outcomes for each method, are shownin Table 1. Overall, model A, the binning method using5-year bands with a transition to coarser binning at age70 years, with 20-year band size above this age, providedthe best predictive accuracy in both the SRS and CRSmethodologies, and for both the Brier and Logarithmicscore outcomes, over 8192 iterations. However, there wasnear-complete overlap of the 95% confidence intervals(CIs) for models A–H.
Figure 2 shows the result of the cross-validationmethod used to optimise the binning choice selection,using model A, the optimal binning method.
Application of age-reporting bias to trichiasisestimates
We examined the effect of applying the optimised bin-ning method to real-world data, when age variation isallowed in the model. Using the optimised binningmethod, model A, the adjusted mean trichiasis preva-lence in those aged 15 years or greater in Oromia was1.54%. The mean estimate of the number of trichiasiscases requiring surgery was estimated by applying thisfigure to the age and gender-specific population esti-mates from the latest available census data.25
4 C. K. MACLEOD ET AL.
The trichiasis backlog estimate from the neutral agedistribution had a median value of 228,000 cases (95%CI 226,900–229,000); the backlog from the positive-biasestimate was 206,700 (95% CI 205,800–207,500); thebacklog from the negative-bias estimate was 250,000(95% CI 248,700–251,500; Table 3).
Discussion
Using a large real-world data-set, we developed a methodof cross-validation for optimising bin-size choice for gen-der- and age-specific trichiasis prevalence standardisation.We evaluated the predictive accuracy achieved using Brierand Logarithmic scores. Using the optimised binningtype, we included age variation in subsequent models,accounting for the possibility of inaccuracy in self-reported estimates of age from examined individuals.
The binning method with the highest predictiveaccuracy divided the population by gender and 5-year-binned age-bands up to 69 years of age and 20-yearage-bands above that point. The CIs around the scoreestimates for each binning type were generally large.However, while we demonstrate that a wide range ofbinning methods could give comparable predictiveaccuracy (models A–H), we also demonstrated a rangeof methods whose bins were either too wide or toonarrow and should not be used (models I–Q).
Compared to the neutral-bias estimate, the estimatefor the trichiasis backlog was higher in those witha negative-bias in self-reported age (tending to beolder than reported). The estimate for the trichiasisbacklog was lower in those with a positive bias in self-
reported age (tending to be younger than reported).This is intuitively correct, because if a person reportsbeing older than they are, our age-specific trichiasisprevalence (for each gender) will underestimatethe true trichiasis prevalence for this age (ifthe age-reporting bias is not associated with trichiasisstatus). It is also epidemiologically important, becausethe prevalence of trichiasis increases with age, with thepeak in absolute number of cases at (or near to) thepeak in the distribution of ages of individuals whosedata contributed to the census. Negatively biasing anage estimate shifts the prevalence curve to the left, sothat a higher age-specific trichiasis prevalence isapplied to a smaller number of people at populationlevel.
To model the effect of bias in age reporting, weadded an age-bias(negative bias, neutral bias, positivebias) from a normal distribution (mean −2, 0, or +2;standard deviation 2) to the self-reported ages. This waschosen pragmatically: we are unable to estimate thedegree to which people will provide incorrect informa-tion about their true age. The significance of the esti-mates from the negative-bias and positive-bias modelswould be dependent on specific cultural knowledgeabout the tendency to favour higher or lower age esti-mates. It is possible to conceive of situations whereindividuals feel they could benefit from either under-estimating or over-estimating their age, and in thissense, age reporting is almost certainly biased to someextent in any survey. However, in our data, this intro-duced an error around population-level estimates thatequated to only ±0.5% of the absolute trichiasis
Figure 1. Self-reported ages of ≥15-year-olds examined for trachoma in 162 standardised surveys in seven regions of Ethiopia. Intotal, 120,656 (50.0%) of 241,137 people examined reported ages with a terminal digit of 0 or 5. Global Trachoma Mapping Project,Ethiopia, 2012–2015.
OPHTHALMIC EPIDEMIOLOGY 5

Table 3. Estimates of the backlog of cases of trichiasis when applying age distributions to self-reported ages, Global TrachomaMapping Project, Oromia, Ethiopia.Age distribution Negative bias Neutral Positive bias
Trichiasis estimate (1000s; 95% CI)b 250.0 (248.7–251.5) 228.0 (226.9–229.0) 206.7 (205.8–207.5)aNormal distribution added to reported age with mean 0 (neutral bias), mean +2 (positive bias), and mean −2 (negative bias), and standard deviation 2 years.bOromia-region estimate of cases of trichiasis; 95% confidence intervals (CIs) from 2.5th and 97.5th centiles of 8192 iterations of model varying age only.
Figure 2. Optimised bin width estimation for maximising predictive accuracy in the age-specific prevalence to trichiasis in thoseaged ≥15 years using data from 162 standardised surveys carried out in seven regions of Ethiopia. Top: resolution too coarse –30-year bin widths. Middle: optimised bin width – 5-year binning to age 69 years and then 20-year bins above this age.Bottom: resolution too fine – 1-year bin widths (raw data). Further division by gender not illustrated for simplicity. GlobalTrachoma Mapping Project, Ethiopia, 2012–2015.
6 C. K. MACLEOD ET AL.
backlog, and this is unlikely to significantly alter plan-ning for surgical services.
It is possible that estimates could be significantlyaffected if sociocultural factors bias age reporting toa much greater extent than has been considered here,and public health professionals should be aware of thisissue. Where this phenomenon is neglected, there isa potential to provide estimates to local planners thatmay not reflect the reality on the ground, which mayresult in misallocation of limited resources for tra-choma elimination.
Conflicts of interest
The authors report no conflicts of interest. The authors aloneare responsible for the views expressed in this article and theydo not necessarily represent the views, decisions, or policiesof the institutions with which they are affiliated, or of thefunding agencies.
Funding
Surveys providing data for this study were principally fundedby the Global Trachoma Mapping Project (GTMP) grantfrom the United Kingdom’s Department for InternationalDevelopment [ARIES: 203145] to Sightsavers, which leda consortium of non-governmental organisations and aca-demic institutions to support ministries of health to completebaseline trachoma mapping worldwide. The GTMP was alsofunded by the United States Agency for InternationalDevelopment (USAID), through the ENVISION projectimplemented by RTI International under cooperative agree-ment number [AID-OAA-A-11-00048], and the END in Asiaproject implemented by FHI360 under cooperative agree-ment number [OAA-A-10-00051]. A committee establishedin March 2012 to examine issues surrounding completion ofglobal trachoma mapping was initially funded by a grantfrom Pfizer to the International Trachoma Initiative. AWSwas a Wellcome Trust Intermediate Clinical Fellow [098521]at the London School of Hygiene & Tropical Medicine and isnow a staff member of the World Health Organization. Noneof the funders had any role in project design; in projectimplementation or analysis or interpretation of data; in thedecisions on where, how, or when to publish in the peerreviewed press; or in the preparation of this manuscript.
References
1. Bourne RRA, Stevens GA, White RA, et al. Causes ofvision loss worldwide, 1990–2010: a systematic analysis.Lancet Global Health. 2013;1(6):e339–49. doi:10.1016/S2214-109X(13)70113-X.
2. Gambhir M, Basáñez M-G, Burton MJ, et al. The devel-opment of an age-structured model for trachoma trans-mission dynamics, pathogenesis and control. PLoS NeglTrop Dis. 2009;3(6). doi:10.1371/journal.pntd.0000462.
3. Thylefors B, Dawson CR, Jones BR, West SK,Taylor HR. A simple system for the assessment oftrachoma and its complications. Bull World HealthOrgan. 1987;65:477–483.
4. Mabey DCW, Solomon AW, Foster A. Trachoma.Lancet. 2003;362(9379):223–229. doi:10.1016/S0140-6736(03)13914-1.
5. Bero B, Macleod C, Alemayehu W, et al. Prevalence ofand risk factors for Trachoma in Oromia regional stateof Ethiopia: results of 79 population-based prevalencesurveys conducted with the global trachoma mappingproject. Ophthalmic Epidemiol. 2016;23(6):392–405.doi:10.1080/09286586.2016.1243717.
6. Adera TH, Macleod C, Endriyas M, et al. Prevalence ofand risk factors for Trachoma in Southern Nations,Nationalities, and peoples’ region, Ethiopia: results of40 population-based prevalence surveys carried outwith the global trachoma mapping project. OphthalmicEpidemiol. 2016;23(Suppl. 1):84–93. doi:10.1080/09286586.2016.1247876.
7. Smith JL, Sivasubramaniam S, Rabiu MM, Kyari F,Solomon AW, Gilbert C. Multilevel analysis of tracho-matous trichiasis and corneal opacity in Nigeria: therole of environmental and climatic risk factors on thedistribution of disease. PLoS Negl Trop Dis. 2015;9(7).doi:10.1371/journal.pntd.0003826.
8. Cromwell EA, Courtright P, King JD, Rotondo LA,Ngondi J, Emerson PM. The excess burden of tracho-matous trichiasis in women: a systematic review andmeta-analysis. Trans R Soc Trop Med Hyg. 2009;103(10):985–992. doi:10.1016/j.trstmh.2009.03.012.
9. Hu VH, Harding-Esch EM, Burton MJ, Bailey RL,Kadimpeul J, Mabey DCW. Epidemiology and con-trol of trachoma: systematic review. Trop MedInt Health. 2010;15(6):673–691. doi:10.1111/j.1365-3156.2010.02521.x.
10. Elshafie BE, Osman KH, Macleod C, et al. The epide-miology of Trachoma in Darfur States and KhartoumState, Sudan: results of 32 population-based prevalencesurveys. Ophthalmic Epidemiol. 2016;23(6):381–391.doi:10.1080/09286586.2016.1243718.
11. Rudemo M. Empirical choice of histograms and kerneldensity estimators. Scand J Stat. 1982;9(2):65–78.http://www.jstor.org/stable/4615859.
12. Bowman AW. An alternative method of cross-validationfor the smoothing of density estimates. Biometrika.1984;71(2):353–360. doi:10.2307/2336252.
13. Loader CR. Bandwidth selection: classical or plug-in?Lucent technologies. Ann Stat. 1999;27(2):415–438.http://citeseerx.ist.psu.edu/viewdoc/download?doi=10.1.1.462.951&rep=rep1&type=pdf. Accessed April 12, 2017
14. Jones MC, Marron JS, Sheather SJ. A brief survey ofbandwidth selection for density estimation. J Am StatAssoc. 1996;91(433):401–407. doi:10.2307/2291420.
15. Solomon AW, Kurylo E. The global trachoma mappingproject. Community Eye Health. 2014;27:18.
16. Brier G. Verification of forecasts expressed in terms ofprobability.Mon Weather Rev. 1950;78:1–3. doi:10.1175/1520-0493(1950)078<0001:VOFEIT>2.0.CO;2.
17. Good IJ. Rational decisions. J R Stat Soc Ser B. 1952;14(1):107–114. http://www.jstor.org/stable/2984087.
OPHTHALMIC EPIDEMIOLOGY 7
18. Solomon AW, Pavluck A, Courtright P, et al. The globaltrachoma mapping project: methodology of a 34-countrypopulation-based study. Ophthalmic Epidemiol. 2015;22(3):214–225. doi:10.3109/09286586.2015.1037401.
19. Solomon AW, Willis R, Pavluck AL, et al. Qualityassurance and quality control in the global trachomamapping project. Am J Trop Med Hyg. 2018;99(4):858–863. doi:10.4269/ajtmh.18-0082.
20. Denic S, Saadi H, Khatib F. Quality of age data in patientsfrom developing countries. J Public Health (Bangkok).2004;26(2):168–171. doi:10.1093/pubmed/fdh131.
21. Adamu Y, Macleod C, Adamu L, et al. Prevalence ofTrachoma in BenishangulGumuzRegion, Ethiopia: resultsof seven population-based surveys from the global tra-choma mapping project. Ophthalmic Epidemiol. 2016;23(sup1):70–76. doi:10.1080/09286586.2016.1247877.
22. Sherief ST, Macleod C, Gigar G, et al. The prevalenceof Trachoma in Tigray Region, Northern Ethiopia:
results of 11 population-based prevalence surveyscompleted as part of the global trachoma mappingproject. Ophthalmic Epidemiol. 2016;23(sup1):94–99.doi:10.1080/09286586.2016.1250917.
23. Duale AB, Ayele NN, Macleod CK, et al. Epidemiologyof trachoma and its implications for implementing the“SAFE” strategy in Somali Region, Ethiopia: results of14 population-based prevalence surveys. OphthalmicEpidemiol. 2018. doi: 10.1080/09286586.2017.1409358.
24. Negash K, Macleod C, Adamu A, et al. Prevalence oftrachoma in the Afar Region of Ethiopia: results ofseven population-based surveys from the global tra-choma mapping project. Ophthalmic Epidemiol.2018. DOI: 10.1080/09286586.2017.1362008.
25. Central Statistical Agency of Ethiopia. Population andHousing Census Report 2007. Addis Ababa: FederalDemocratic Republic of Ethiopia Population CensusCommission; 2008.
8 C. K. MACLEOD ET AL.


![Bakhtiari v Commonwealth of Australia (DIBP)...Bakhtiari v Commonwealth of Australia (DIBP) • [2016] AusHRC 109 • 1 October 2016 Senator the Hon. George Brandis QC Attorney-General](https://static.fdocuments.net/doc/165x107/60ab1b80004a9018a70a4176/bakhtiari-v-commonwealth-of-australia-dibp-bakhtiari-v-commonwealth-of-australia.jpg)