The development of hazard perception...
28
The development of hazard perception testing Prepared for Road Safety Division, Department for Transport G B Grayson and B F Sexton TRL Report TRL558
Transcript of The development of hazard perception...

The development of hazard perceptiontesting
Prepared for Road Safety Division, Department for Transport
G B Grayson and B F Sexton
TRL Report TRL558

First Published 2002ISSN 0968-4107Copyright TRL Limited 2002.
This report has been produced by TRL Limited, under/as part ofa contract placed by the Department for Transport. Any viewsexpressed in it are not necessarily those of the Department.
TRL is committed to optimising energy efficiency, reducingwaste and promoting recycling and re-use. In support of theseenvironmental goals, this report has been printed on recycledpaper, comprising 100% post-consumer waste, manufacturedusing a TCF (totally chlorine free) process.
CONTENTS
Page
Executive Summary 1
1 Introduction 3
2 Hazard perception as a research tool 4
2.1 Developments 4
2.2 Accident liability studies 4
2.3 HP training studies 4
3 From research to policy 5
3.1 Procedures 5
3.2 The issue of measurement 5
4 The NFER test 6
4.1 Objectives 6
4.2 Procedure 6
4.3 Results 7
4.4 Validation 10
5 The TRL project 11
5.1 Objectives 11
5.2 Use of existing test material 11
5.3 Test development 12
5.4 Training material 15
5.5 Training trial 16
6 Implementation 20
7 Summary and Conclusions 20
8 References 21
Abstract 23
Related publications 23
iii

iv

1
Executive Summary
lead to a reduction in accident liability in the early years ofdriving. Further, the most effective way of ensuring thathazard perception training is undertaken on a voluntarybasis is to include a hazard perception test in the procedurefor acquiring a licence to drive.
Research
Although a number of research procedures for measuringhazard perception existed, none was suitable for use as alicensing tool, and further development work wasnecessary. The first stage was a contract with the NationalFoundation for Educational Research (NFER).
The NFER study set out to demonstrate that it waspossible to produce tests that were sufficiently reliable inpsychometric terms to be used in the licensing process. Inthis they were successful; following extensive testing, fourtests were produced with high levels of reliability, three ofwhich distinguished between inexperienced andexperienced drivers. However, a number of subsequentstudies found that the tests were not able to demonstrate anassociation with accident liability.
A further programme of work was undertaken by TRL toassess the likely effectiveness of introducing hazardperception testing, and one of its first tasks was to evaluatethe hazard perception items in the NFER tests thatdiscriminated better on a driver experience scale than others.The ‘best’ items were found to be those that required goodscanning practices and an ability to anticipate potentiallyhazardous situations. The sub-set of NFER items selectedwith these characteristics was able to discriminate on thedriver experience scale, and appeared to have someassociation with retrospective accident liability.
To take this further, a broad-based ‘blueprint’ wasdeveloped to define the type of hazard perception itemsrequired. Further items were filmed using staged situations aswell as opportunistic filming, and produced enough usableitems to evaluate in a trial on different driver experiencegroups. The results of the trial demonstrated that there wereenough items that had the necessary psychometriccharacteristics to allow for the construction of new tests.
While this test development was being undertaken, aspecification for suitable hazard perception trainingmaterial was being developed. This involved reviewingexisting driver training material as well as discussions withthe driver training industry. The resultant specification wasgiven to DSA who then created a training package. Thistraining package contained three modules – basic, plus twomore advanced levels of training. Each module took aboutan hour to administer and was group-based training usingvideo material with a structured schedule, which could bedelivered by non-driver training professionals.
The final task in this research was to run a trial oflearners who were ready for their theory test, and to testtheir hazard perception before and after hazard perceptiontraining. Using the bespoke package developedspecifically for this project showed that three hours of
The decision to add a hazard perception test to the TheoryTest that must be passed before learner drivers can taketheir practical driving test was preceded by an extensiveprogramme of research and development. This reportdescribes this work and its background.
Introduction
It has long been recognised that young drivers are over-represented in accidents. There has been an equally longdebate about whether the ‘young driver problem’ arisesbecause young drivers are immature, or because they areinexperienced. A basic problem is that age and experienceare usually highly correlated, in that the majority ofinexperienced drivers are also young drivers. The ageversus experience issue is not just of academic interest, forthere are clear implications for safety countermeasures. Ata practical level, maturity cannot be accelerated, while thelessons of experience can - in principle - be taught. Anumber of TRL studies using multivariate modelling ofaccidents have established that it is experience that is themain contributor to the higher accident rates of youngdrivers, with one study (Forsyth et al., 1995) showing thatfor young drivers the effect of experience alone over thefirst three years of driving was some four times that of age.
Background
In the first few years, a new driver is learning not just newskills, but formulating new rules, developing a newrepertoire of strategies, and learning new patterns ofinteraction. However, much of this process takes place inan unstructured and informal way, with no guarantee thatwhat is learned is the most appropriate for the safety of thetraffic system. Given the importance of experience inreducing accident liability, it would clearly be desirable ifthe lessons of experience could be imparted by someformal intervention, rather than being acquired in anuncontrolled learning situation. A candidate forintervention of this sort needs to be a variable that is:
� capable of being measured objectively and reliably;
� related to driving experience;
� amenable to improvement through training; and
� related to accident involvement.
A review of the literature provides strong support for theuse of hazard perception. The theoretical basis is sound, andthere is good evidence that it is a skill that improves withexperience and expertise. Research has shown that hazardperception is capable of being improved through training,and a number of studies have indicated that poor hazardperception skills are associated with elevated accident risk.Hazard perception thus became a candidate for inclusion inthe licensing system. The justification for this is that ifhazard perception ability is related to accident involvement,and if the ability is amenable to improvement, thenintroducing hazard perception training on a wide scale could
2
training resulted in learner drivers obtaining similar hazardperception scores to those of experienced drivers. Theconclusion, therefore, is that hazard perception skills canbe trained in learner drivers. Improving the hazardperception skills of new drivers should have a beneficialeffect on their accident liability, particularly in the first 2or 3 years of driving which is when they would normallybe gaining these skills.
Summary
Research has shown that lack of experience is a majorcontributor to the high levels of accident liability amongnew and young drivers, and that hazard perception skillsimprove with experience. There are strong grounds forthinking that if the lessons of experience could be impartedby formal instruction, rather than in an uncontrolledlearning situation, then there could be benefits for roadsafety.
Research that has been carried out in recent times showsthat hazard perception training could contribute to this.Hazard perception tests have been developed that arereliable in a statistical sense, and trials have shown thattraining can improve the performance of novices to matchthat of experienced drivers. These findings were key to thedecision to incorporate a hazard perception componentwithin the Theory Test at the end of 2002.
Further tests have been developed and calibrated for use ina licensing context, and pass marks for different groups of testcandidates have been identified. Details of this implementationwork will be available in a report from DSA.
Reference
Forsyth E, Maycock G and Sexton B (1995). Cohortstudy of learner novice drivers. Part 3: Accidents, offencesand driving experience in the first three years of driving.Project Report PR111. Crowthorne: TRL Limited.

3
1 Introduction
Young drivers are an old problem. For example, thirtyyears ago Goldstein (1972) was able to state ‘that youthfuldrivers are over-represented in accidents ... has been wellknown for several decades’, and a major review a fewyears later concluded that ‘young drivers are over-represented at all time periods and at all levels of severityof accidents’ (OECD, 1975). Young drivers have been amajor focus of research and policy in traffic safety in thedeveloped countries of the world for many years.
There has also long been a debate about whether the‘young driver problem’ arises because young drivers areimmature, or because they are inexperienced. A basicproblem is that age and experience are usually highlycorrelated, in that the majority of inexperienced drivers arealso young drivers. The age versus experience issue is notjust of academic interest, for there are clear implications forsafety countermeasures. At a practical level, maturity cannotbe accelerated, while the lessons of experience can - inprinciple - be taught. Attempts to disentangle the separateeffects of age and experience have often encounteredproblems in the past, largely because of the methodologicalissues involved.
In the late 1980s, a programme of research was startedat TRL with the aim of making more explicit the separateeffects of age and experience on accident liability. Theapproach adopted was a statistical one using GeneralisedLinear Modelling techniques. The first study in theprogramme was a cross-sectional survey of 13,500 drivers,in which older and younger drivers, and drivers withlimited experience were over-sampled (Maycock et al.,1991). In a later study, information was obtained fromsome 7,000 novice drivers, in which cohorts of driversreported accidents year by year for the first three years oftheir driving experience (Forsyth et al., 1995).
Although earlier investigators (e.g. Mayhew andSimpson, 1990) had concluded that age had more effect onaccident risk than did experience, the results of themodelling exercise in the cohort study showed that foryoung drivers the effect of experience alone over the firstthree years of driving was some four times that of age.There was a 40% reduction in accident liability betweenthe first and second years of driving for 17 - 18 year oldsattributable to experience.
The reduction in accident liability in the first years ofdriving was most marked in the youngest age groups, butwas evident at all ages, raising the question of just whathappens in the first two or three years of driving to turn ahigh risk novice into a low risk driver.
Analyses of the driving task (e.g. Grayson, 1991)suggest that in the first few years a new driver is learningnot just new skills, but formulating new rules, developing anew repertoire of strategies, and learning new patterns ofinteraction. However, much of this process takes place inan unstructured and informal way, with no guarantee thatwhat is learned is the most appropriate for the safety of thetraffic system. Given the importance of experience inreducing accident liability, it would clearly be desirable if
the lessons of experience could be imparted by someformal intervention, rather than being acquired in anuncontrolled learning situation.
There have been two main strands in research on youngand new drivers that could offer candidates forintervention. The first is concerned with motivation, thesecond with cognition. Both are active and important fieldsof research, but the possibilities for intervention aredifferent. The modification of motivational and attitudinalfactors at a societal level is a long-term process. This is notto deny that marked changes in social norms can take place(drink-driving being the obvious example), but suchchanges do not come about quickly or easily. By contrast,cognitive variables offer - in principle - more scope forintervention at an individual level. A candidate for thisneeds to be able to meet four criteria. It should be:
� capable of being measured objectively and reliably;
� related to driving experience;
� amenable to improvement through training; and
� related to accident involvement.
Several cognitive measures that have been considered inthe past, such as selective attention and field dependence,have high face validity but have not shown consistentrelationships with accident involvement in well-designedstudies. Their lack of success may perhaps be attributed tothe fact that the manner in which they were assessed wasfar removed from the ‘real world’ of driving - by listeningto digits through earphones in one case, and examiningcomplex geometric patterns in the other. However, there isone further candidate that is much more closely based ondriving, that has high face validity, and has a soundresearch background. This is hazard perception.
Hazard perception is a surprisingly old concept, datingback nearly 30 years to the work of Currie (1969), whoused model cars to assess a subject’s speed of response inidentifying potential collisions. He found that accident-involved subjects responded to these more slowly than didthe accident-free, although the groups did not differ insimple reaction time. This finding set the scene for furtherresearch on the topic in two ways: first, by suggesting thatthere was some ability over and above simple reaction timethat was related to accident involvement, and second byshowing that it could be measured using simulation in alaboratory setting.
Pelz and Krupat (1974) developed this line of researchfurther, using cine-film of ‘real road’ situations in a non-interactive driving simulator. They found that students with‘good’ driving records detected danger more promptly thandid students with records of violations or accidents.
Quimby and Watts (1981) made an importantcontribution by comparing the performance of subjectsboth on the roads and in a simulator. A variety of measureswere taken in the simulator, both continuous and inresponse to discrete events. Of these two, it was found thatonly response time to hazard was related - albeit weakly -to accident history.

4
2 Hazard perception as a research tool
2.1 Developments
In the 1980s and 90s there was growing interest in higherorder cognitive skills and their influence on driver safety.The process of perceiving and responding to hazards wasregarded as being of particular importance from atheoretical point of view, and this led to a search for testsand measures that could be used for driver assessment.
The early studies of Pelz and Krupat (1964) and Quimbyand Watts (1981) had used cine-film in driving simulators.Cine was rapidly being replaced by video, and interest wasgrowing in more portable laboratory-based, as opposed tosimulator-based environments. Hazard perception testsusing video material were developed for research purposesat Reading University by McKenna and Crick, and inparallel at TRL, where they were used in studies of bothdriver impairment (Irving and Jones, 1992) and accidentliability. At the same time, in the Australian state ofVictoria, tests of hazard perception were being developedas part of the licensing procedure for new drivers (Hull andChristie, 1993).
It is of interest to note that many of the early workers inthis field seem to have been more concerned withmeasurement than with definition. Pelz and Krupat (1964) didnot use the term ‘hazard perception’, preferring the phrase‘caution profile’ instead. Quimby and Watts (1981) referredto ‘reaction to hazardous events’, while Quimby et al. (1986)introduced more than a hint of circularity in defininghazard perception as ‘the ability to perceive and respond tohazards’. McKenna and Crick (1991) broadened theconcept by referring to ‘ability to respond to potentiallydangerous traffic situations’ - but without defining whatthese might be. Despite the somewhat limited contributionof researchers to the definition of hazard perception, at apractical level the concept seems to be easily recognisedby trainers and instructors in their use of terms such as‘appreciation’, ‘anticipation’, and ‘reading the road’.
2.2 Accident liability studies
The Pelz and Krupat and Quimby and Watts studies hadshown relationships between hazard perception scoresand accident involvement, but were based on relativelysmall samples and used relatively unsophisticatedstatistical techniques.
Stronger evidence was provided by the study byQuimby et al. (1986) in which hazard perception wasincluded in a large test battery. This study employedmultivariate statistical techniques that could deal with thehigh degree of inter-correlation among variables that hadmade interpretation of results difficult in the past. Onceage and mileage had been accounted for, none of the low-level sensory or psychomotor variables made anycontribution to explaining the variability in accidentinvolvement. One of the few factors that did contributewas response time to hazards.
Hull and Christie (1993) reported on the ‘GeelongTrial’, in which the test developed in Victoria was tried outbefore being introduced into the licensing system. The trial
involved more than 3000 participants, and the resultsindicated a significant difference in hazard perceptionscores in the expected direction between accident-involvedand accident-free subjects over a wide age range.
McKenna and Crick (1991) initially used experience asa surrogate for accident liability, and developed a video-based test that showed a monotonic improvement in hazardperception scores from novice, through experienced, toexpert drivers, albeit with relatively modest sample sizes.However, a later paper by McKenna and Horswill (1999)reported that HP scores on the test developed at ReadingUniversity significantly discriminated between largesamples of accident-involved and accident-free drivers.
2.3 HP training studies
The ‘trainability’ of hazard perception was firstdemonstrated in an experiment by McKenna and Crick(1994), which was a before-and-after study of driversparticipating in a RoSPA advanced driving course. Driverstaking the course showed significant improvements inhazard perception following the course compered with agroup of matched controls, even though the course did notdeal specifically with hazard perception. A later experiment(McKenna and Crick, 1997) suggested ways in which thecontent of training could be made more efficient, and foundthat 2 - 3 hours of classroom training using video materialcould improve the hazard perception performance of novicedrivers to the level of experienced ones.
A study of over 200 newly qualified young drivers(Mills et al., 1998) also showed that scores on HP testscould be improved by training. The authors reported thaton-road plus classroom training was the most effective inimproving test performance (though the duration oftraining was greater for those receiving both forms), butclassroom training alone was capable of achievingsignificant improvements.
These findings were important in that there was nowevidence that hazard perception was related to experience,it was associated with accident involvement, and it wascapable of improvement through training. It thus became acandidate for inclusion in the licensing system.
It should be noted that the primary aim was not simplyto restrict entry into the driving population by selectingonly those candidates with good hazard perceptionabilities, but rather to encourage novice drivers toundertake appropriate training. The argument is that ifhazard perception ability is related to accidentinvolvement, and if the ability is amenable toimprovement, then introducing training on a wide scalecould lead to a reduction in accident liability in the earlyyears of driving. Further, the most effective way ofensuring that hazard perception training is undertaken on avoluntary basis is to include a hazard perception test in theprocedure for acquiring a licence to drive.
5
3 From research to policy
3.1 Procedures
The transition from research tool to ‘institutionalised’ testinstrument is a difficult one. The most obvious issue is thatof psychometric reliability; highly desirable in a researchtool, but essential in a test instrument. An associated topicis face validity, which again is essential if a public testprocedure is to be deemed acceptable. Subjects inlaboratory experiments will happily submit toincomprehensible test protocols if they are being paid fordoing so. By contrast, if they have to do the paying, thenthe same subjects will expect the benefits of taking andpassing the test to be clear to them (as should be thebenefits of less competent subjects failing the test).
There is also the question of the experimental setting.Research is carried out in laboratories, with procedures forsubject handling that are designed to encourage co-operation. Test instruments are employed in public testcentres, where keen experimenters are largely replaced byimpersonal machines. In laboratories, instructions can bedetailed and comprehensive (and subjects incapable ofunderstanding them can easily be dropped from thesample). By contrast, instructions on official testinstruments have to be capable of being understood by aswide a range of the population as possible if the tests arenot to be open to the criticism that they are testingintellectual ability rather than the ability to drive in a safemanner. To illustrate this point, the original TRL test,although a complex task, had written instructions that ranto over 800 words. This would clearly be unacceptable inthe context of an official test conducted as part of thelicensing process.
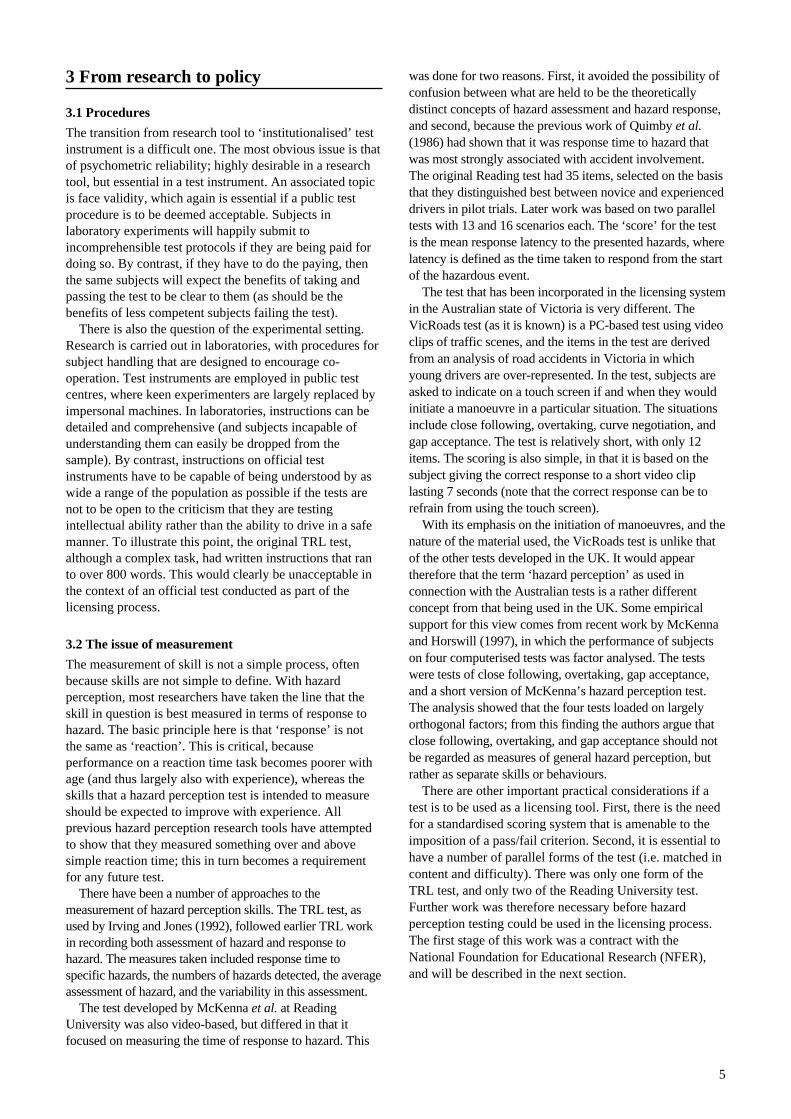
3.2 The issue of measurement
The measurement of skill is not a simple process, oftenbecause skills are not simple to define. With hazardperception, most researchers have taken the line that theskill in question is best measured in terms of response tohazard. The basic principle here is that ‘response’ is notthe same as ‘reaction’. This is critical, becauseperformance on a reaction time task becomes poorer withage (and thus largely also with experience), whereas theskills that a hazard perception test is intended to measureshould be expected to improve with experience. Allprevious hazard perception research tools have attemptedto show that they measured something over and abovesimple reaction time; this in turn becomes a requirementfor any future test.
There have been a number of approaches to themeasurement of hazard perception skills. The TRL test, asused by Irving and Jones (1992), followed earlier TRL workin recording both assessment of hazard and response tohazard. The measures taken included response time tospecific hazards, the numbers of hazards detected, the averageassessment of hazard, and the variability in this assessment.
The test developed by McKenna et al. at ReadingUniversity was also video-based, but differed in that itfocused on measuring the time of response to hazard. This
was done for two reasons. First, it avoided the possibility ofconfusion between what are held to be the theoreticallydistinct concepts of hazard assessment and hazard response,and second, because the previous work of Quimby et al.(1986) had shown that it was response time to hazard thatwas most strongly associated with accident involvement.The original Reading test had 35 items, selected on the basisthat they distinguished best between novice and experienceddrivers in pilot trials. Later work was based on two paralleltests with 13 and 16 scenarios each. The ‘score’ for the testis the mean response latency to the presented hazards, wherelatency is defined as the time taken to respond from the startof the hazardous event.
The test that has been incorporated in the licensing systemin the Australian state of Victoria is very different. TheVicRoads test (as it is known) is a PC-based test using videoclips of traffic scenes, and the items in the test are derivedfrom an analysis of road accidents in Victoria in whichyoung drivers are over-represented. In the test, subjects areasked to indicate on a touch screen if and when they wouldinitiate a manoeuvre in a particular situation. The situationsinclude close following, overtaking, curve negotiation, andgap acceptance. The test is relatively short, with only 12items. The scoring is also simple, in that it is based on thesubject giving the correct response to a short video cliplasting 7 seconds (note that the correct response can be torefrain from using the touch screen).
With its emphasis on the initiation of manoeuvres, and thenature of the material used, the VicRoads test is unlike thatof the other tests developed in the UK. It would appeartherefore that the term ‘hazard perception’ as used inconnection with the Australian tests is a rather differentconcept from that being used in the UK. Some empiricalsupport for this view comes from recent work by McKennaand Horswill (1997), in which the performance of subjectson four computerised tests was factor analysed. The testswere tests of close following, overtaking, gap acceptance,and a short version of McKenna’s hazard perception test.The analysis showed that the four tests loaded on largelyorthogonal factors; from this finding the authors argue thatclose following, overtaking, and gap acceptance should notbe regarded as measures of general hazard perception, butrather as separate skills or behaviours.
There are other important practical considerations if atest is to be used as a licensing tool. First, there is the needfor a standardised scoring system that is amenable to theimposition of a pass/fail criterion. Second, it is essential tohave a number of parallel forms of the test (i.e. matched incontent and difficulty). There was only one form of theTRL test, and only two of the Reading University test.Further work was therefore necessary before hazardperception testing could be used in the licensing process.The first stage of this work was a contract with theNational Foundation for Educational Research (NFER),and will be described in the next section.

6
4 The NFER test
4.1 Objectives
The original objective of this work was the developmentof hazard perception tests that were intended to form oneelement of the new theory test for drivers and riders to beintroduced in the United Kingdom in July 1996. Thespecification for this work was derived from thestatements of required knowledge and understandinggiven in The 2nd European Council Directive on DrivingLicences (Council Directive 91/439/EEC; Amendmentsmade in Council Directives 96/47/EC and 97/26/EC). Adecision was taken to give the topic of perception,judgement and decision-making a weighting of 20% ofthe total test marks. The test as a whole was to beadministered by computer, allowing the hazardperception elements to have the possibility of usingdigitised video to present realistic moving images.
The initial goal was therefore to develop a series ofhazard perception sub-tests which could be integrated intothe longer theory test. However, in the early stages of theproject the then Department of Transport found itnecessary for technical reasons to alter the originalspecification for the theory test. The requirement becamefor a test which was paper-based and could beadministered in around 30 minutes. Moving-image hazardperception items would not be part of the test that was tobe introduced, but work would continue on thedevelopment of computer-based hazard perception teststhat could be used for research purposes.
After discussion, the specification provided to NFERwas for the production of four tests of hazard perception.The tests were to take about 15 minutes each to administer,and were to have 13 scenarios and 20 or 22 scored eventsin each.
4.2 Procedure
The first issue was that of the definition of hazardperception. McKenna and Crick (1994) had proposed‘ability to identify potentially dangerous trafficsituations,’ but without defining those situations. Thisworking definition needed supplementing for individualsituations with an empirical demonstration that therewas general agreement on the event(s) forming thehazard. It was therefore decided to define and film arange of scenarios. These were then trialled andcomparisons made between novices and experts.Situations that gave rise to differences in hazardperception latency between these groups, and also gavea range of times for participants, were determined to beappropriate for testing purposes.
The NFER project drew heavily on the work that hadbeen carried out by McKenna and Crick (1994) at ReadingUniversity, in that the principles used by them wereincorporated in the selection of scenarios for the NFERtest. Using these principles as a guide, a set of 96 scenarioswere written. These scenarios were specified to include sixtypes of road covering a range of types of drivingcircumstances, as follows:
Rural lanes.
Suburban roads - housing, etc.
Urban roads - through shops, etc.
Residential areas.
Single carriageway main routes.
Dual carriageway main routes.
In addition, three categories of hazard were included,sometimes occurring in combination:
� entry of another object into the path of the vehicle;
� unexpected actions of the vehicle in front;
� hazardous actions of oncoming traffic.
These scenarios were then filmed from the bonnet of acar by a professional film company. The most suitablewere selected for trialling and digitised so that they couldbe played through a computer.
Participants in the trials were sampled from peoplewho had booked a practical driving test in the precedingsix weeks, and thus were a mix of learner and earlynovice drivers.
The instructions for participants were shown on-screen.They were as follows:
Screen 1
You will now be shown some video clips.
Imagine you are the driver of the car.
You should look out for hazards ahead.
A hazard is something that a driver should keep an eyeon because it could lead to an accident situation.
1
Screen 2
Press the OK button ON THE KEYPAD as quicklyas possible when you see a hazard ahead.
There may be more than one hazard in a clip.
You should press the OK button for each hazard.
A ‘stop’ sign will appear every time you pressthe OK button.
Press the OK button now.
2
This was then followed by a practice clip.The most critical issue to be resolved once empirical
data were available was the scoring system for the hazardperception items. This was not based on the sum ofresponse times, as in the experimental laboratory workcarried out at Reading. Instead, a preliminary scoringscheme was devised which awarded marks for each hazardevent successfully detected in a specified time window.
The adoption of this procedure was important inpsychometric terms, since it allowed in effect for the

7
standardisation of the individual test items. Differenthazards are likely to have different response times, becauseof variation in the length of time they take to develop;adding times together would give greater weight to longertimes at the expense of shorter times. It also avoided the‘cross-contamination’ that was possible from an overallmean latency score by using instead an empirically derivedscore for each item.
To obtain this score, a set procedure was adopted. Whenthe participants took the hazard perception test, all their keypresses (i.e. each time they indicated a hazard) wererecorded and timed, based on the frame of the video beingshown at the time. Since there are 25 frames per second, thishas an accuracy of 40 milliseconds. All the participants’responses throughout the clip were then grouped into one-second time intervals and the number in each interval found.An analysis was then performed on the data and clusters ofone-second intervals in which over half the participantsresponded were identified and examined further.
It was decided to devise a differentiated scoring schemefor each event with scores from 0 to 5. In all cases, thesewere based on the cluster of times, and attempted to coverall genuine responses. Different scoring intervals wereused for different items and were split into 5 equal timeintervals. Only the first response to an event by aparticipant within a time window was scored.
The same procedure was followed for all the scenariostested. In each case, clusters of one-second intervals inwhich over half the participants responded were identified,a start point specified using the distribution of times andthe timings from the video and finally a set of fiveintervals defined corresponding to scores 5 to 1. All otherresponses scored zero. Depending on the event, the scoringwindow could be as narrow as 1000ms (i.e. five bands of200ms) or as wide as 7000ms (five bands of 1400ms).Each event had the most appropriate interval for itself,rather than a single length interval being adopted for all.
In the initial set of trials, the moving image hazardperception element had been embedded in thecomputerised theory test. For this reason, only sevenscenarios were included in each test. However, as pointedout above, in 1995 a decision was taken to change thespecification for the theory test for drivers. The test was tobecome paper-based and, as a consequence, the moving-image hazard perception element could not be included.However, the project was asked to continue to developstand-alone hazard perception tests that could be used forresearch purposes, and to explore the feasibility of theirbeing used in the theory test at a later date. Because thetests could be longer, a further set of trials was carried outusing tests that included 12 or 14 scenarios.
Based on the results of the two sets of trials, fourproposed tests were specified. In order to maximisereliability and to cover a large number of the availablesituations, these each included 13 scenarios, giving riseto 20 or 22 marked events. The tests would thereforehave a maximum of 100 or 110 marks available. Thescenarios were chosen in order to give four parallel testsas far as possible, in terms of location, type of eventsand road users involved. There was no attempt to ensure
that the parallel events had exactly the samepsychometric characteristics. It was envisaged that, foreach test, a set of norms would be produced whichwould place the participants onto a common scalewhichever test they had taken. Each test would takearound 10 to 12 minutes to administer.
The items were selected for inclusion on the basis of anumber of criteria. These were:
� the mean score of the event, ideally between 2 and 3 forparticipants;
� a high positive discrimination between participants;
� a significant difference in scores between experiencedand inexperienced drivers (favouring the experienced).
Not all of these criteria could be met for each item;rather, the tests were constructed to utilise the bestavailable items while balancing the differing roadconditions and events within them. The structures of theproposed tests are shown in Table 1, which gives a briefaccount of each scenario and its events.
The four ‘final’ tests were used with participants incentres around Britain in 1995, when they were asked toattempt one of the hazard perception tests, administered bycomputer. The venues were London, Birmingham,Liverpool, Newcastle and Bristol. In total, 1057participants took one of the hazard perception tests. Allfour tests were used at each venue, except London whereonly three tests were used; participants were allocated totests randomly.
Prior to taking the test, participants were asked tocomplete a brief questionnaire asking for information on:
� gender;
� ethnicity;
� whether their first language was English;
� whether they had problems reading English;
� education and qualifications;
� disabilities.
In addition, participants were asked if they had recentlytaken their practical driving test, and whether they hadpassed or failed.
Some data had been collected on experienced driversin the initial trials. However, the need, for researchpurposes use of the test, with drivers gainingexperience meant that the tests themselves should becapable of discriminating more broadly. Hence it wasnecessary to obtain further data on experienceddrivers. A sample was gathered from two sources.First, TRL used its database of volunteers to recruitparticipants to attempt the tests in sessions arranged atTRL. Other experienced drivers were recruited fromthe staff of NFER and took the tests at NFER. In all172 experienced drivers attempted one or two of thefour hazard perception tests.
4.3 Results
Of the 1057 participants who took one of the ‘final’ tests,the 16-19 years age group accounted for 41% of thesample, which is similar to the proportion for candidates

8
Table 1 Proposed scenarios in each test
Test 1 Test 2 Test 3 Test 4
A1 A4 A3 A1Horse ahead Horse ahead Jogger ahead Horse ahead Also in Test 1
A7 A11 A9 A11Parked van Oncoming van Oncoming car Oncoming vanCyclist Jogger Jogger Also in Test 2
B11 B5 B4 B14Car reverses Pedestrian on zebra crossing Pedestrian on zebra crossing Car enters on left
B6 B8 B10 B7Parked lorry Parked cars Parked lorry Vans parked both sidesOncoming car Oncoming car Oncoming car Oncoming car enters gap
C15 C9 C10 C15Motorcycle from left Cyclist from left Car from left Motorcyclist from left
Also in Test 1
C12 C13 C5 C1Parked car Parked cars Pelican crossing Pedestrian steps onto Pedestrian enters Pedestrian enters Pedestrian crosses zebra crossing
D7 D5 D6 D12Car from left Car reverses from drive Cyclist from left Cyclist rides into road
from pavement
D15 D14 D10 D15Ball from children Car ahead stops Parked cars Ball from children
Pedestrian crosses Pedestrian enters Also in Test 1
D11 D8 D4 D14Parked cars Following car brakes suddenly Parked vans Car ahead stopsPedestrian enters Oncoming car Pedestrian crosses
Also in Test 2
E7 E3 E6 E5Parked van Parked van Parked lorry Lorry obscures junctionCar enters Bus crosses in front Car enters Car enters from junction
E16 E9 E11 E9 Lorry parked Car from left Car from right Car from left Also in Test 2
E12 E13 E14 E13Traffic lights Traffic lights Traffic lights - following car Traffic lightsCar crosses ahead Motorcycle crosses ahead Car crosses ahead Motorcycle ahead
Also in Test 2
F7 F11 F10 F11Car enters DC Lorry parked Car moves to right Lorry parked.
Door opens Door opens Also in Test 2
for the practical driving test. Sixty per cent of participantswere female, which also matches the pattern for drivingtest candidates.
There was a divergence from the population as a wholein terms of the ethnic grouping of the sample. Theproportions of ethnic minorities were greater than in thegeneral population, although it was not been establishedhow these percentages compared with the characteristics ofdriving test candidates. The over-representation of ethnicminority groups was probably a consequence of locatingthe test centres in areas of high population in order toobtain greater numbers. The number of participants whospoke a first language other than English was also high.
Forty per cent of participants were still in full-timeeducation which reflects the high number of young peoplein the sample. Fifteen per cent of those participating in thetrial test sessions had a motorcycle licence, and 61% hadtaken their practical driving test within the previous coupleof months. Of this number, 38% had passed their test.
Table 2 shows the mean score, percentage of maximum,standard deviation of scores, internal consistency (reliability),and the standard error of measurement for the four tests.
As the table shows, the four tests had similar scoreslying between 43 and 48% of the maximum. Test HP4 hadthe highest score; further examination of the data indicatedthat the difference may have arisen as a result of the

9
sample for this test having had participants of a slightlyhigher ability. The analyses of scores against backgroundinformation have taken account of this.
The internal consistency reliabilities of the tests arehigh for tests of this type, which rely on a performancemeasure rather than being knowledge-based. In eachcase, it led to a standard error of measurement of aroundsix points of raw score.
One issue that had to be addressed was the possibilitythat candidates could gain high scores by repeated rapidpressing or by random responses. This was investigated byestablishing the distribution of numbers of presses for eachscenario and cross-tabulating this with the score attainedon the events. This showed that the incidence of largenumbers of presses was small but that they did occuroccasionally. As a result of this investigation, the scoringsystem was altered slightly such that a maximum numberof presses were allowed. If participants exceeded thisnumber then their score was set to zero, even if they hadresponded to the events within the designated times. Forsingle event scenarios the maximum number of presseswas set to 8. For multiple-event scenarios the maximumwas set to 15.
In order to examine the test performance of the varioussubgroups, the results for the four tests were standardisedonto a common scale. This was done by calculating themean score and standard deviation for the four tests for thevenues where all had been used. Since the allocation ofparticipants was essentially random, these could beregarded as equivalent. The mean standardised score forthese venues was then set at 50 and the standard deviationto 10.
The results for various groups indicate that, as in theearlier trials, scores on the hazard perception test wererelated to several background variables. These were:
� Age - the youngest age group scored significantly betterthan older participants.
� English as a first language - participants who werenative English speakers obtained higher scores.
� Problems reading English - participants who hadproblems with English had lower scores.
� Ethnic group - white participants tended to have higherscores than black or Asian groups.
� Practical test - those who had passed the practical testhad higher scores.
However for gender, there were no statisticallysignificant differences between men and women.
These background variables are complex andthemselves inter-related. Hence, they should not beregarded as indicating causation. There is a possibility thatthe differences in hazard perception scores which relate toliteracy may indicate difficulty in understanding theinstructions, but there is no corroborative evidence for this.
Table 3 shows the test results for the experienced driverstaking the four hazard perception tests. The mean scoreswere around half the marks available, somewhat higher fortest HP1 and a little lower for HP4. For three of the tests theinternal consistency reliability levels were high - over 0.8.However, for test HP1, the reliability coefficient wassomewhat lower, probably because the spread of scores, asmeasured by the standard deviation, was not as great.
Table 2 Participants’ results on hazard perception tests
StandardPercen- error of
Mean tage of Standard measure- Number ofTest score maximum deviation Reliability ment candidates
HP1 44.5 45 16.2 0.85 6.35 299HP2 43.2 43 14.7 0.82 6.30 285HP3 48.9 44 17.2 0.86 6.37 257HP4 53.2 48 17.0 0.86 6.40 216
Table 3 Experienced drivers’ results on hazardperception tests
StandardPercen- error of
Mean tage of Standard measure- Number ofTest score maximum deviation Reliability ment candidates
HP1 54.9 55 12.0 .69 6.7 53HP2 49.3 50 14.8 .81 6.5 57HP3 55.2 50 16.8 .85 6.5 63HP4 51.8 47 17.2 .83 7.1 61
Table 4 Results for inexperienced and experienceddrivers on hazard perception tests
Inexperienced Experienced
Mean sd Mean sd Difference Significance
HP1 44.5 16.2 54.9 12.0 10.4 p<.001HP2 43.2 14.7 49.3 14.8 6.1 p = .005HP3 48.9 17.2 55.2 16.8 6.3 p = .009HP4 53.2 17.0 51.8 17.2 -1.4 ns
An important consideration for these tests is theextent to which they discriminated betweeninexperienced (i.e. trial participants) and experienceddrivers. This comparison is shown in Table 4.
As Table 4 shows, Tests HP1-3 showed large andsignificant differences. However, Test HP4 had ananomalous result in that the inexperienced drivers gainedhigher scores than the experienced drivers. This differencewas not significant, but was nevertheless disturbing. Theseresults were explored further in two ways. First, since thesamples were not equivalent in terms of the age and sex ofthe drivers, an analysis of covariance was performed forthe results of each test with the covariates being age andsex. This had little effect on the results, and it remained thecase that the difference for Test HP1 was significant, forTest HP2 and Test HP3 approached significance and forTest HP4 was in the wrong direction, but non-significant.
The second investigation examined individual items inthe tests. The results indicated that, within Tests HP1 toHP3, the majority of items had significantly higher scoresfor experienced drivers than for the inexperienced, andthere were very few instances where the inexperienced

10
gained higher scores than experienced drivers. In contrast,for Test HP4, for half of the items, the inexperienced hadhigher average scores than experienced drivers. In somecases, items which performed appropriately in Tests HP1 orHP2 did not do so for test HP4.
There is no obvious explanation for the anomalousresults of Test HP4. It was the last test to be constructedand may have utilised some of the less preferred items.However, all of these had been regarded as acceptablefrom the results of the earlier trials. This would not explainwhy items which produced good results in Test HP1 orHP2 did not do so in Test HP4.
Despite the anomalous (if non-significant) results forHP4, the other three NFER tests were successful in thatthey demonstrated high levels of psychometric reliability,and they were able to discriminate between inexperiencedand experienced drivers. Further, since they were based onthe McKenna and Crick (1994) work, there is the strongprobability that performance on the NFER tests could beimproved through training
Thus the NFER tests met two, and by inference, couldhave met the third of the criteria set out earlier foracceptance as a component in the licensing entry system.However, there remains the fourth, and most importantcriterion, that of showing that scores on the tests arerelated to accident involvement.
4.4 Validation
The ‘basic’ NFER tests (i.e. HP1 - 3) were able todiscriminate reliably between inexperienced andexperienced drivers. While this provides face validity,there is also the need to demonstrate that the scores thata person achieves on a hazard perception test can beregarded as being in some way predictive of thatperson’s subsequent accident history. A number ofinvestigations were carried out to establish whether thiswas the case for the NFER tests.
The first was conducted by NFER as part of the analysisof a follow-up survey of 1092 drivers who had taken atheory test. Half of the drivers had also taken a hazardperception test during the trials reported in the previoussection. Generalised linear modelling was used to assessthe contribution of a number of variables, including scoreson the hazard perception test, to the prediction of bothaccidents and self-reported near misses during the firstyear of driving.
The results of the modelling exercise showed that, whilehazard perception score was a significant predictor of self-reported near misses, it did not reach significance as apredictor in the model for accidents. To pursue this further,some detailed analysis of the data was carried out at TRL,again using generalised linear modelling. This analysisexamined each test in turn, both as a whole and at anindividual event level. It also investigated whether therewas any effect of using hazard latencies as opposed tohazard scores.
Of the 24 models at the whole test level, none showedthat the hazard variable made a significant contribution.The results of the analysis at event level were equallydiscouraging, in that there seemed to be no clear
correspondence between events that discriminated betweeninexperienced and experienced drivers, and those thatdiscriminated between accident involved and non-accidentinvolved drivers. Worse, there was some indication of acontrary effect, in that it was found that the correlationbetween the differences in mean scores betweeninexperienced and experienced groups of drivers and betweenaccident involved and non-involved was a negative one.
These analyses indicated that the NFER tests wouldneed further development before they could be used in alicensing context, and that one possible line of approachwould be to examine the range and nature of the hazarditems that were being presented, and to aim for a morefocused test based on the more promising items. The needfor further work was supported by evidence from otherresearch groups who had used the tests. At Nottingham,Underwood and Chapman (1998) failed to find differencesin hazard scores between novice and experienced drivers(though their sample sizes were only modest), andsuggested that differences in hazard types were moreinfluential than differences in the experience ofindividuals.
The NFER test was also used as part of a large testbattery in a study of driver response to risk carried outjointly by TRL and the University of Surrey. The sampleof drivers covered a wide range of ages and experience.Preliminary results presented by Field et al. (1997) showedno correlation between hazard scores and any measure ofaccident involvement. A later analysis of the whole samplereported by Grayson and Maycock (1997) also found noassociation between NFER scores and accidentinvolvement, as shown in Figure 1.
<0.750.75-3
3-1010-25
>25
No accidents
Accident involved
42
44
46
48
50
52
54
Haz
ard
Sco
re
Driving experience (years)
Figure 1 Hazard score, experience, and accidents
The pattern of results shown in the figure is interesting, asit shows that accident-involved drivers have higher testscores than the accident-free at the lower experience levels,with a difference of almost two score points. One possibleexplanation could be that the experience of an accident insome way sensitises the new driver to the hazards on theroad, thereby improving test performance. If this is the case,it is both a confounding factor for evaluation studies, andalso an incentive to produce materials so that learning cancome through training rather than accidents.

11
In the full report by Grayson et al. (2002) it was confirmedthat test scores did not discriminate between accident-involved and accident-free drivers, but it was also found thatthey were reliable indicators of observed speeds in on-roadtests, and also of expert judgements of driver ability.
It was the inability to demonstrate a clear relationshipwith accident liability that raised serious questions about theNFER test. It is a well-designed test that is reliablymeasuring something, but the ‘something’ would not appearto be predictive of accident liability. The evidence indicatesthat the test may be related to broad-based behaviourmeasures, but that it failed on the ultimate criterion forinclusion in the licensing process. Given the encouragingresults from earlier work in the field, and the persuasivetheoretical arguments for focusing on skills such as hazardperception, it was recognised that further work was needed.This is reported in detail in the next section.
5 The TRL project
5.1 Objectives
Road Safety Division of the then DETR (Department forEnvironment, Transport and the Regions) let a contractwith TRL in February 1997 to assess the likely effect onroad safety of including a hazard perception test in thelicensing process.
One early part of the research was to follow up thesample of inexperienced drivers who had taken the NFERhazard perception test, as described in Section 4.2. Theanalysis of the accident liabilities of those candidates whotook the test in October/November 1995 providedevidence for a relationship between hazard perception andexperience but did not confirm a relationship with accidentliability. This, together with the feeling from other studiesmentioned earlier that the NFER test was ‘not working’,led to the following programme of work:
� To review the NFER hazard perception test material tosee which items discriminate best between novice andexperienced drivers.
� To conduct a small evaluation trial comparing responsemode.
� To draw up a ‘blueprint’ which describes the type of itemrequired for hazard perception testing of learner drivers.
� To film more material and to construct some new hazardperception tests using the ‘blueprint’ as a guide for filming.
� To design and develop hazard perception trainingmaterial.
� To evaluate the trainability of hazard perception skills inlearner drivers.
� To make recommendations on the introduction ofhazard perception testing into the licensing system andon the likely amount of training required.
5.2 Use of existing test material
The four hazard perception tests developed by NFERunder contract to TRL were broad-based by design, in thatthey covered a range of driving situations and potentially
hazardous scenarios. The importance of these four testswas that they provided a pool of hazard perception itemsand that some of these items discriminated betweeninexperienced and experienced drivers. However, it wasalso suspected that the hazard perception items within theNFER tests were too broad-based which resulted in theirnot distinguishing between accident-involved andaccident-free drivers. That is, they covered acomprehensive range of road and road user scenarios butdid not always require the scanning and anticipation skillsthat make up a ‘good’ hazard perception clip.
As described in section 4.2, the NFER instructions tosubjects and definition of what constitutes a hazard were:
You will now be shown some video clips.
Imagine you are the driver of the car.
You should look out for hazards ahead.
A hazard is something that a driver should keep an eyeon because it could lead to an accident situation.
Press the OK button ON THE KEYPAD as quickly aspossible when you see a hazard ahead.
There may be more than one hazard in a clip.
The definition and instructions used in the TRL projectused a slightly modified version:
A hazard is a situation where a driver may have tobrake or take avoiding action. A safe driver will beanticipating such situations and will modify his drivingsuch that the potential hazard is avoided.
Press the enter key when you become aware of asituation which might lead to a hazard.
Most important from the perspective of the TRL projectwas the need to define what is understood to be theimportant element(s) that low risk experienced drivershave and high risk novice drivers do not. We also knowthat even within a group of experienced drivers who coversimilar mileage in similar conditions, that some will be‘more aware’ than others, and we need to measure this‘awareness skill’ in a reliable way. It is necessary to try toidentify what types of hazards are spotted more quickly bythe experienced driver than the novice driver. This iscomplicated by the fact that novice drivers are oftenyounger than experienced drivers and will have quickerbasic reactions.
Hazard perception is a skill that drivers start to acquireduring their early driving career - or even before. It is askill that is difficult to define, but it is not about reactingquickly to a sudden event, and is more about anticipation.Anticipation depends upon good scanning skills and anawareness of developing scenarios. Defining the type ofdriving situation that typifies such developing scenarios isnecessary in order to develop hazard perception tests thatmeasure the underlying skill of interest. The criteria fordefining such scenarios have been called the ‘blueprint’.
The view taken was that those drivers with ‘good’hazard perception would have good scanning skills andgood anticipation. ‘Good’ video clips were thus defined asthose that would test these characteristics. It also seemed
12
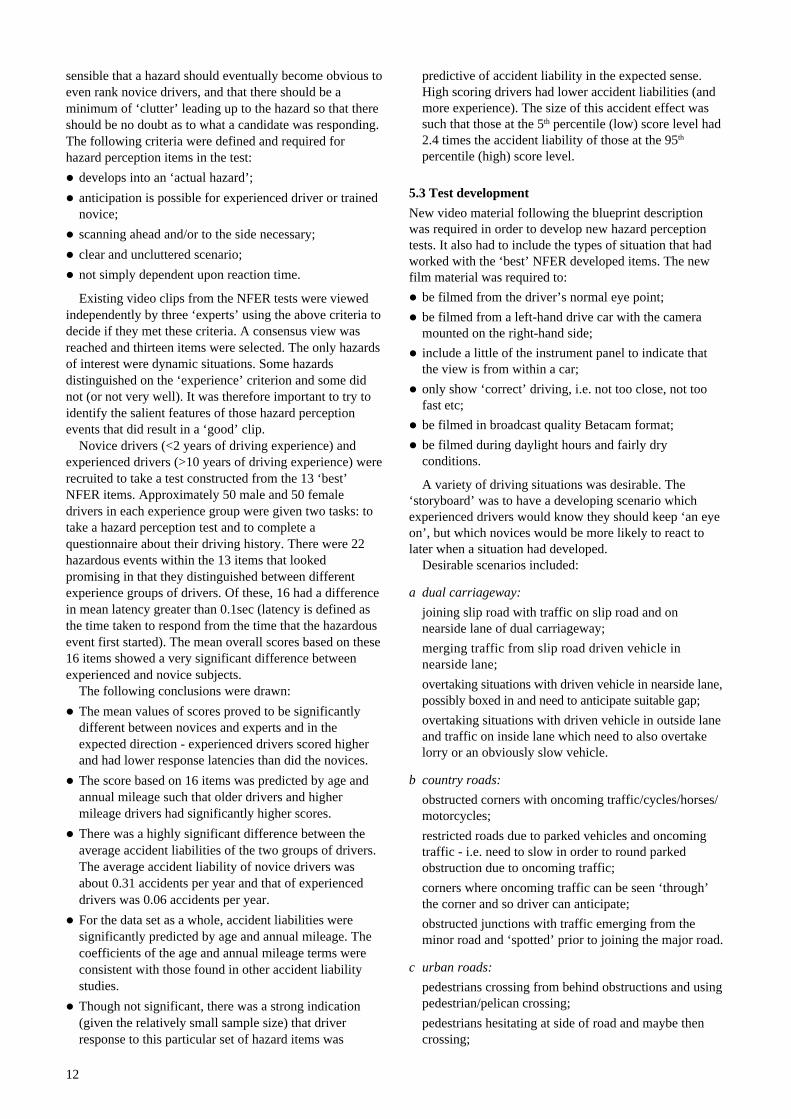
sensible that a hazard should eventually become obvious toeven rank novice drivers, and that there should be aminimum of ‘clutter’ leading up to the hazard so that thereshould be no doubt as to what a candidate was responding.The following criteria were defined and required forhazard perception items in the test:
� develops into an ‘actual hazard’;
� anticipation is possible for experienced driver or trainednovice;
� scanning ahead and/or to the side necessary;
� clear and uncluttered scenario;
� not simply dependent upon reaction time.
Existing video clips from the NFER tests were viewedindependently by three ‘experts’ using the above criteria todecide if they met these criteria. A consensus view wasreached and thirteen items were selected. The only hazardsof interest were dynamic situations. Some hazardsdistinguished on the ‘experience’ criterion and some didnot (or not very well). It was therefore important to try toidentify the salient features of those hazard perceptionevents that did result in a ‘good’ clip.
Novice drivers (<2 years of driving experience) andexperienced drivers (>10 years of driving experience) wererecruited to take a test constructed from the 13 ‘best’NFER items. Approximately 50 male and 50 femaledrivers in each experience group were given two tasks: totake a hazard perception test and to complete aquestionnaire about their driving history. There were 22hazardous events within the 13 items that lookedpromising in that they distinguished between differentexperience groups of drivers. Of these, 16 had a differencein mean latency greater than 0.1sec (latency is defined asthe time taken to respond from the time that the hazardousevent first started). The mean overall scores based on these16 items showed a very significant difference betweenexperienced and novice subjects.
The following conclusions were drawn:
� The mean values of scores proved to be significantlydifferent between novices and experts and in theexpected direction - experienced drivers scored higherand had lower response latencies than did the novices.
� The score based on 16 items was predicted by age andannual mileage such that older drivers and highermileage drivers had significantly higher scores.
� There was a highly significant difference between theaverage accident liabilities of the two groups of drivers.The average accident liability of novice drivers wasabout 0.31 accidents per year and that of experienceddrivers was 0.06 accidents per year.
� For the data set as a whole, accident liabilities weresignificantly predicted by age and annual mileage. Thecoefficients of the age and annual mileage terms wereconsistent with those found in other accident liabilitystudies.
� Though not significant, there was a strong indication(given the relatively small sample size) that driverresponse to this particular set of hazard items was
predictive of accident liability in the expected sense.High scoring drivers had lower accident liabilities (andmore experience). The size of this accident effect wassuch that those at the 5th percentile (low) score level had2.4 times the accident liability of those at the 95th
percentile (high) score level.
5.3 Test development
New video material following the blueprint descriptionwas required in order to develop new hazard perceptiontests. It also had to include the types of situation that hadworked with the ‘best’ NFER developed items. The newfilm material was required to:
� be filmed from the driver’s normal eye point;
� be filmed from a left-hand drive car with the cameramounted on the right-hand side;
� include a little of the instrument panel to indicate thatthe view is from within a car;
� only show ‘correct’ driving, i.e. not too close, not toofast etc;
� be filmed in broadcast quality Betacam format;
� be filmed during daylight hours and fairly dryconditions.
A variety of driving situations was desirable. The‘storyboard’ was to have a developing scenario whichexperienced drivers would know they should keep ‘an eyeon’, but which novices would be more likely to react tolater when a situation had developed.
Desirable scenarios included:
a dual carriageway:
joining slip road with traffic on slip road and onnearside lane of dual carriageway;
merging traffic from slip road driven vehicle innearside lane;
overtaking situations with driven vehicle in nearside lane,possibly boxed in and need to anticipate suitable gap;
overtaking situations with driven vehicle in outside laneand traffic on inside lane which need to also overtakelorry or an obviously slow vehicle.
b country roads:
obstructed corners with oncoming traffic/cycles/horses/motorcycles;
restricted roads due to parked vehicles and oncomingtraffic - i.e. need to slow in order to round parkedobstruction due to oncoming traffic;
corners where oncoming traffic can be seen ‘through’the corner and so driver can anticipate;
obstructed junctions with traffic emerging from theminor road and ‘spotted’ prior to joining the major road.
c urban roads:
pedestrians crossing from behind obstructions and usingpedestrian/pelican crossing;
pedestrians hesitating at side of road and maybe thencrossing;

13
parked vehicles moving off - showing indicators;
parked vehicles backing out and rear lights showing;
merging traffic from side roads;
traffic slowing for junction ahead, anticipate because;rear lights showing on vehicles ahead.
d suburban roads:
cyclists having to overtake parked vehicles;
cyclists on pavements and then joining road;
children playing (ball games, skate boarding, streetroller hockey, etc.);
parked vehicles and on-coming traffic requiringanticipation and slowing down to avoid meetingadjacent to parked vehicle;
ice cream vans and pedestrians/children moving into road.
Filming of new hazard situations was undertaken by theTRL film unit using a left-hand drive car and filming fromthe driver’s viewpoint. The field of view was chosen togive good definition for the image in the centre of thepicture but with a reasonable view of the whole drivingscene. Some panning of the camera was used on cornersand at roundabouts.
Two main types of filming were undertaken. The firstwas opportunistic on a variety of road types, and yieldedsome useful video footage that was included in thesubsequent trials. However, it was not very effective as aprocess, especially since the film car was driven in a safeway which reduced the likelihood of hazard involvement.The second type of filming used staged events, and thiswas generally more efficient. The staged events werebased on items in the re-visited NFER test that haddiscriminated on the experience criterion. However, it wasdecided not to include events with children because of therisks associated. The DSA training unit provided intensiveand helpful assistance in staging a number of events over athree-day filming period. The use of highly-trained driversin this way was particularly beneficial.
TRL experts and the project steering group selectedsuitable items for trialling. They applied the blueprintcriteria together with their own experience and knowledgeof the type of hazard that may be appropriate. As a resultof the selection process some 54 suitable video clips wereselected. These were mainly about 60 seconds in duration.The 54 items were split into two sets, referred to as tests Aand B for the purposes of the trial. One item was selectedas an example item in order to give subjects an indicationof what was expected.
During filming of staged events, several ‘takes’ weremade of the same scenario. The timing of the event iscritical to how well it works, and so it was desirable to filmseveral versions of the same hazard event. In practice,there were several equally good examples of somescenarios and more than one was tried. In order todetermine the psychometric properties of the newly filmedhazard perception material, a trial was organized withdrivers of different experience levels, including a group oflearners. This was essential in order to determine if itemscould distinguish between drivers of differing experience.
The trial required volunteers to take two hazardperception tests, each with about 27 video clips. Subjectstook either test A or test B first, then completed aquestionnaire, and then took either test B or A. The orderof the first test taken was counter-balanced. Subjects werevolunteers and were either learners, novice drivers withless than 2 years experience or experienced drivers whohad been driving for at least 10 years. The total targetsample was 450 subjects, with 150 from each group. Thetrial was held at TRL.
Subjects were first given on-screen instructions to read(there was also a paper copy by the computer), and then sawan example video clip. After the example they were toldwhat the hazard was and told that they were expected torespond as soon as they had realised the potentiallyhazardous situation was developing. They then saw the trialclips in a pre-determined order, shown as a continuousseries of clips without a pause between them. Subjectsresponded by pressing a keyboard key marked with a redtriangle. Every response was stored for subsequent analysis.
The scoring method was the same as that developedpreviously by NFER. The distribution of response times isfirst generated; this shows where subjects are respondingand therefore indicates the time of a potential hazard (orhazards) in the video clip. Looking at the video clip wheresubjects were responding identified the hazardous eventthat led to a reaction. This will usually correspond to thestaged hazard within the video clip, and confirms thatcandidates are responding as expected. The scoringwindow is determined from the earliest point where thehazardous event started to a point where is becomesobvious. Scoring windows can be determined without theempirical data, but if no candidates were responding to thehazard then this would suggest it was a very poorhazardous event that was unlikely to result in a useful itemfor scoring. Using empirical data and expert judgement toset the scoring window ensures that a useful item isidentified that also has good face validity.
The score given to each hazardous event depends uponthe first response within a ‘time-window’. The earlierwithin the window that the candidate responds, the higherthe score. In practice a 5, 4, 3, 2, 1 score was allocated bydividing the window equally in five sub-time-windows.Candidates who failed to respond in the time-window weregiven a zero score.
An example of the procedure is shown below. Thisparticular hazard item is in a suburban setting with trafficcalming. A cyclist emerges from a right turn and isobscured behind a van, but could have been spotted priorto being obscured by the van. The driver’s view of thecyclist just before he disappears behind the van and justafter emerging are shown in Figures 2 and 3.
Figure 4 shows the response distribution for this item.The response pattern indicates a cluster of responsesaround 26 seconds into the clip which was the cyclist. Thiswas confirmed from examining the video. The setting ofthe scoring window was empirical, in that it dependedupon the response distribution. The event of the emergingcyclist was identified on the video, and the time when thisevent could first be responded to noted, i.e. the point when

14
the cyclist could first be seen. The length of the scoringwindow depended on the observed response distributionand the particular developing hazard.
Sixty-five possible events were identified and scoredusing the methodology described above using empiricallyderived time-windows. The mean scores for each group ofdrivers were then compared for every event. A one-wayanalysis of variance was used to check the statisticalsignificance of group mean score differences. A multiplerange test (Student-Newman-Keuls) was applied if therewere any overall group differences.
The results for the item above are presented in Table 5.
741
300
200
100
0
Item - Frequency by time
Time (nearest second)
Fre
quen
cy
10 13 16 19 22 25 28 31 34 37 40
Figure 2 Cyclist emerging from side road, about to gobehind van
Figure 3 Cyclist emerges from behind the van, into pathof oncoming vehicle
Table 5 Results of statistical analysis for the item inFigure 4
Standard SignificantGroup Sample Mean error differences
Learner 149 1.85 0.09 The experiencedNovice 147 2.06 0.10 group is differentExperienced 148 2.50 0.09 from the other
two groups
Figure 4 Response distribution for sample item
It can be seen from the results in Table 5 that the meanscore values in this item monotonically increased withlevel of experience. This is essential if an item is workingin the way required. However, the mean values betweengroups were not always statistically significantly different.‘Perfect’ items would be those that distinguish betweenhigh and low accident risk drivers. However, in thiscontext ‘perfect’ items are described as those thatdistinguish between experienced drivers and novicedrivers, between experienced drivers and learners andbetween novices and learners. Driver experience is thusbeing used as a proxy for accident liability.
There were 16 ‘perfect’ events, (within 13 video clips)which could distinguish between all three groups of drivers
15
and 22 events which distinguished between experienceddrivers and the others, but not between learners and novices(albeit the scores were monotonically increasing). These 38events provided a sufficient number from which to constructtwo new tests. The following criteria were applied:
� the item should, at least, distinguish between theexperienced drivers and other drivers;
� the test should take about 15 minutes to complete;
� the test should be internally consistent – as measured byCronbach’s Alpha;
� the two tests should be parallel (i.e. should look similarin terms of the item mix, and be equivalent in difficulty,the number of items, internal consistency, etc.);
� replicates of the same staged events should not be in thesame test.
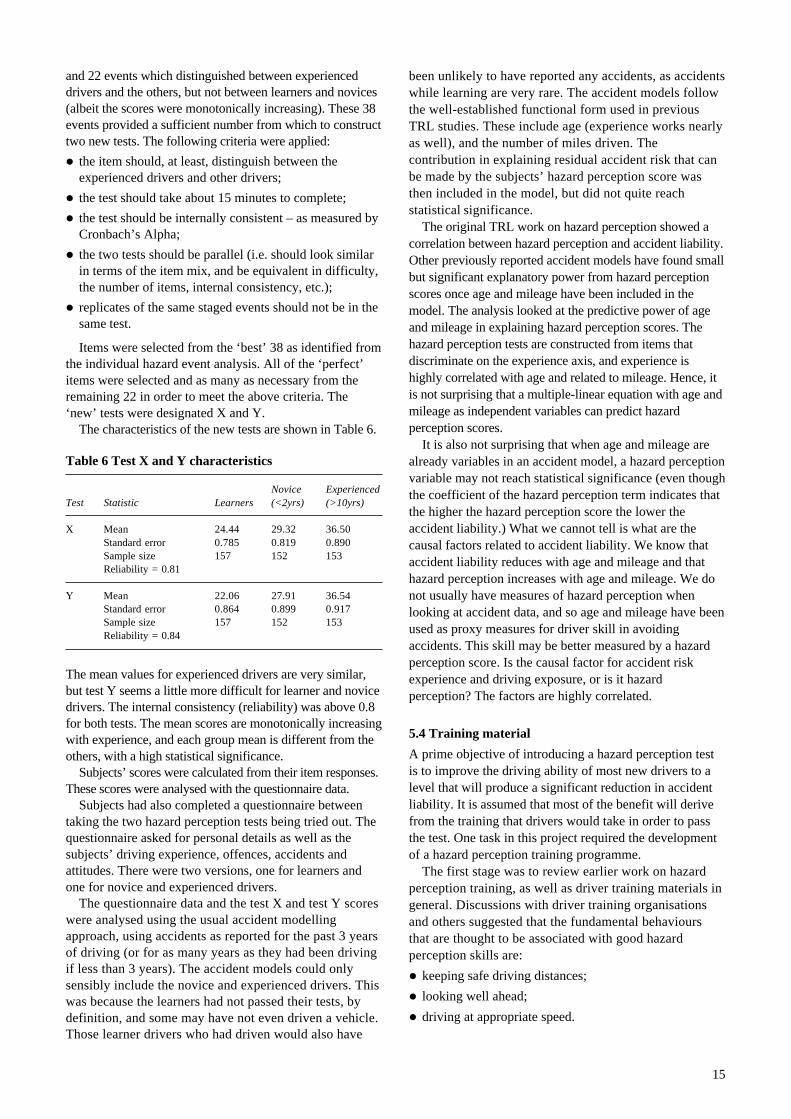
Items were selected from the ‘best’ 38 as identified fromthe individual hazard event analysis. All of the ‘perfect’items were selected and as many as necessary from theremaining 22 in order to meet the above criteria. The‘new’ tests were designated X and Y.
The characteristics of the new tests are shown in Table 6.
been unlikely to have reported any accidents, as accidentswhile learning are very rare. The accident models followthe well-established functional form used in previousTRL studies. These include age (experience works nearlyas well), and the number of miles driven. Thecontribution in explaining residual accident risk that canbe made by the subjects’ hazard perception score wasthen included in the model, but did not quite reachstatistical significance.
The original TRL work on hazard perception showed acorrelation between hazard perception and accident liability.Other previously reported accident models have found smallbut significant explanatory power from hazard perceptionscores once age and mileage have been included in themodel. The analysis looked at the predictive power of ageand mileage in explaining hazard perception scores. Thehazard perception tests are constructed from items thatdiscriminate on the experience axis, and experience ishighly correlated with age and related to mileage. Hence, itis not surprising that a multiple-linear equation with age andmileage as independent variables can predict hazardperception scores.
It is also not surprising that when age and mileage arealready variables in an accident model, a hazard perceptionvariable may not reach statistical significance (even thoughthe coefficient of the hazard perception term indicates thatthe higher the hazard perception score the lower theaccident liability.) What we cannot tell is what are thecausal factors related to accident liability. We know thataccident liability reduces with age and mileage and thathazard perception increases with age and mileage. We donot usually have measures of hazard perception whenlooking at accident data, and so age and mileage have beenused as proxy measures for driver skill in avoidingaccidents. This skill may be better measured by a hazardperception score. Is the causal factor for accident riskexperience and driving exposure, or is it hazardperception? The factors are highly correlated.
5.4 Training material
A prime objective of introducing a hazard perception testis to improve the driving ability of most new drivers to alevel that will produce a significant reduction in accidentliability. It is assumed that most of the benefit will derivefrom the training that drivers would take in order to passthe test. One task in this project required the developmentof a hazard perception training programme.
The first stage was to review earlier work on hazardperception training, as well as driver training materials ingeneral. Discussions with driver training organisationsand others suggested that the fundamental behavioursthat are thought to be associated with good hazardperception skills are:
� keeping safe driving distances;
� looking well ahead;
� driving at appropriate speed.
Table 6 Test X and Y characteristics
Novice ExperiencedTest Statistic Learners (<2yrs) (>10yrs)
X Mean 24.44 29.32 36.50Standard error 0.785 0.819 0.890Sample size 157 152 153Reliability = 0.81
Y Mean 22.06 27.91 36.54Standard error 0.864 0.899 0.917Sample size 157 152 153Reliability = 0.84
The mean values for experienced drivers are very similar,but test Y seems a little more difficult for learner and novicedrivers. The internal consistency (reliability) was above 0.8for both tests. The mean scores are monotonically increasingwith experience, and each group mean is different from theothers, with a high statistical significance.
Subjects’ scores were calculated from their item responses.These scores were analysed with the questionnaire data.
Subjects had also completed a questionnaire betweentaking the two hazard perception tests being tried out. Thequestionnaire asked for personal details as well as thesubjects’ driving experience, offences, accidents andattitudes. There were two versions, one for learners andone for novice and experienced drivers.
The questionnaire data and the test X and test Y scoreswere analysed using the usual accident modellingapproach, using accidents as reported for the past 3 yearsof driving (or for as many years as they had been drivingif less than 3 years). The accident models could onlysensibly include the novice and experienced drivers. Thiswas because the learners had not passed their tests, bydefinition, and some may have not even driven a vehicle.Those learner drivers who had driven would also have

16
It was decided that the training material should have thefollowing characteristics:
� candidates receive a minimum of one session and amaximum of three sessions of training;
� each session lasts a maximum of one hour; candidatesreceive approximately one session per week;
� a session of one hour duration will be based uponapproximately 20 minutes of video material;
� candidates would receive training at the stage when theyhave mastered basic control skills - the timing of thiswill depend on the individual, but it is likely to be afterabout 10 hours of driving lessons;
� the training will be delivered in a ‘classroom’ typesetting in small groups, and will be interspersed withtheir regular on-road tuition.
The content of the package should facilitate a learningprocess in which students are required to be highly active.One method which has proved effective is to ‘freeze’ thevideo, and ask students to predict what might happen next,what they would do next, etc. (this is followed bycontinuing the video to see what in fact does occur).
A training package was developed by the DSA TrainingEstablishment at Cardington. The package consists of threemodules, one for basic training, and two for moreadvanced training. Each module was designed to last about60 minutes and to be delivered to groups of between 5 and10 students.
The modules use a combination of video, video-freezetechniques, some animation techniques to illustrateparticular points, and work-cards for trainees to complete.The video illustrates on-road situations that show possiblehazardous situations, and freeze-frame techniques are usedto help facilitate an interaction with the trainer by askingsubjects to identify situations. Work-cards are used in asimilar way. Group discussion is encouraged and this canbe facilitated with flip-charts. Subjects are given aworkbook at the end of the training; this summarizes thetraining session and could be used as an aide-memoire.The more advanced training modules focus more ondynamic situations, building on the initial training moduleexperience. The purpose of the training modules is toimprove learner driver awareness of developing roadscenarios, and so to make them more like experienceddrivers in this respect.
5.5 Training trial
The procedure for evaluating the trainability of hazardperception skills was to recruit learner drivers, test them,train some of them, and re-test all of them. The test was oftheir hazard perception skills as measured by theirperformance on the hazard perception tests developed aspart of this project.
Subjects were recruited at the time they attended aTheory Test centre to take their Theory Test. They werethus at a stage in obtaining a driving licence where theyfelt ready to take the Theory Test. This is also likely to bewhere a test of hazard perception might be introduced intothe licensing system, and although they would not have
received any hazard perception training, they were at themost appropriate stage for this trial. It is also quite possiblethat some subjects may not have even driven a vehicle, butmost would have done so, and this was one of thequestions included in a questionnaire.
Subjects took one of two hazard perception tests,designated test X or test Y. These tests are parallel versions,and if subjects took test X as their first test they took test Yas their second test, and vice versa. Subjects were allocatedrandomly to either test X or Y on the first test session. Thisensured that there were no learning effects that were notcontrolled for by test order and presentation.
Subjects were recruited to one of three groups, A, B, or C:
Group A took one hazard perception test on recruitmentin February and the other hazard perception test in April.
Group B took one hazard perception test on recruitmentin February and the other hazard perception test inApril, and received 1 hour of basic hazard perceptiontraining in March.
Group C took one hazard perception test on recruitmentin February and the other hazard perception test in April,and received 1 hour of basic hazard perception trainingplus 2 hours of more advanced training in March.
Group A was a control group. This was required becauseduring the period between taking the two tests all subjectswould probably have still been receiving driver training. Itwas thus necessary to control for a possible improvement inhazard perception skills due to additional driver training andexperience, and also because the taking of a hazardperception test may itself have influenced their score.
The analysis looked at the gains in hazard perceptionscores over a two month period. The gains in each groupwill have been influenced by the extra training andexperience gained during this two month period. The testtaken first or second was balanced across each group, and soany test effect was controlled for. The gain due to either 1hour of basic training on hazard perception, or the gain inreceiving 1 hour of basic training plus 2 hours of moreadvanced training can be calculated relative to the gain seenin the control group. This net gain indicates the benefitsattributable to the hazard perception training received.
Candidates were given a three part questionnaire whenthey were first recruited. The first part asked for somebasic information about their driver training andexperience at that time. The questionnaire was kept at thecentres, and when candidates came for re-testing they gaveinformation about the interim period. The questionnaireswere then returned to TRL, which confirmed that they hadreturned for re-test and so could receive a paymenttowards their expenses for helping with the trial.
It was important to obtain a good coverage of testcentres to minimise regional biases in the sample of learnerdrivers recruited. Advice was taken from Theory Test staffand the following ten centres were selected: Brighton,Harlow, Middlesborough, Milton Keynes, Slough,Southampton, Stirling, Stoke-on-Trent, Sutton Coldfield,and Swansea.
The approximate number of candidates booking testswere known for these centres and so the sample sizes

17
required (250 for each group), were known to be availablefor recruitment. In practice it was estimated that therecould be a 20% dropout rate, and so it was hoped to recruit300 in each group – 900 candidates in total. In the event, atotal of 861 candidates agreed to take part in the trial.
The average drop-out rate for the basic training wasabout 26%, calculated as the percentage of those that didnot turn up for their basic training. It excludes those whohad previously cancelled. Some candidates were unable tomake the training sessions they had booked, and wereeither re-scheduled to another day or were re-allocated to adifferent group. In part, this is why there are a highernumber in the control group. The actual response rate waslower than anticipated, but acceptable numbers wereachieved for analytical purposes.
Table 7 shows the numbers recruited (including thosere-allocated because they missed a training session), thenumbers where test scores could be matched and thenumbers where both the test scores and questionnairescould be matched. There were a few subjects who wereoriginally recruited to one of the three groups but failed toattend the scheduled training for some reason; most ofthese came back for re-testing as indicated in Table 7.Most of the analysis has been based on the 520 whose testscores were matched and who were in groups A, B, or C.
mix of candidates per group, although some candidateswere constrained by circumstances. The following tablesillustrate that there were some differences betweencandidate profiles within each group, but nothing thatappeared important.
Table 8 shows the numbers of candidates whocompleted the trial for each group by age. The Chi-squaredtest indicated that the distributions of age were notstatistically different between the groups.
Table 9 shows the numbers of candidates whocompleted the trial for each group by gender. The Chi-squared tests indicated that the distributions of genderwere not statistically different between the groups.
Candidates completed a questionnaire in two stages. Whenrecruited, candidates took their theory test and then after ashort interval the first hazard perception test. They completedpart 1 of the questionnaire at this time. This gave informationabout their instruction and driving history. When theyreturned to take their second test, up to 8 weeks later, theycompleted part 2 and part 3. Part 2 of the questionnaire is verysimilar to part 1 and asked about their instruction and drivinghistory as well as their success in passing the driver theory testand the practical driving test. Table 10 shows the mean valuesfor some of these questions, including age and number ofhours of driving either with a friend or under instruction. Themean values for each group are very similar, although thosein group B have had more hours of driving with friends butfewer hours of instruction between taking the two hazardperception tests.
Table 11 shows the percentages relating to thedichotomous response questions. The patterns of responsesare fairly similar for each group of candidates, althoughthe percentage who had passed the practical driving testbefore taking the second hazard perception test aresomewhat lower for group B than groups A or C.Interestingly, group B have the highest pass rate for thetheory test.
Table 12 shows the mean and standard error of thehazard perception scores, or derived measures, for eachgroup. The experimental design was that candidates wereallocated to take either hazard perception test X or test Yon their first test. If they took test X as their first test theytook test Y as their second tests, and vice versa. The twotests were reasonably well matched, but were not exactlyparallel. This can clearly be seen in Table 12, where test Xseems to be about 6 score points easier. This does not
Table 7 Number recruited by group
HP Test andHP Test score questionnaire
Group Recruited matched matched
A – no training 315 191 (60.6%) 188 (59.7%)
B – basic training 273 166 (60.8%) 160 (58.6%)
C – basic + 252 163 (64.7%) 160 (63.5%)advanced training
Others* 21 14 (66.7%) 14 (66.7%)
Total 861 534 (62.0%) 522 (60.6%)
* Those who did not complete training
Table 8 Candidates who completed trial by age group and training group
A: No training B: Basic training C: Basic + Advanced Total
Age Count Column % Count Column % Count Column % Count Column %
17-18 113 59% 92 55% 91 56% 296 57%18-19 17 9% 14 8% 16 10% 47 9%19-20 4 2% 9 5% 6 4% 19 4%20-25 25 13% 18 11% 18 11% 61 12%25-30 12 6% 8 5% 9 6% 29 6%30+ 16 8% 17 10% 21 13% 54 10%N/K 4 2% 8 5% 2 1% 14 3%
Total 191 100% 166 100% 163 100% 520 100%
The linking mechanism for all candidates was theunique theory test booking reference number. Allocationof candidates to training groups (A: no training, B: basictraining, and C: basic + more advanced training), wasarranged at the test centres when the candidate wasrecruited. The centre invigilator was instructed to obtain a

18
Table 9 Recruited candidates who completed trial by gender and training group
A: No training B: Basic training C: Basic + Advanced Total
Gender Count Column % Count Column % Count Column % Count Column %
Male 91 48% 90 54% 86 53% 267 51%Female 100 52% 76 46% 77 47% 253 49%
Total 191 100% 166 100% 163 100% 520 100%
Table 10 Mean values for candidates who completed trial
A: No training B: Basic training C: Basic + Advanced
Variable description Mean se Mean se Mean se
Age at 2nd February 1999 20.6 0.60 21.4 0.70 21.6 0.67Hours of driving with friends (at 1st test) 13.0 1.53 14.2 1.82 13.0 1.88Hours of driving with friends (at 2nd test) 14.9 1.60 18.5 2.97 15.1 1.74Hours of lessons (at 1st test) 17.5 0.99 18.6 1.05 17.5 0.83Hours of lessons (at 2nd test) 25.4 1.59 25.5 1.37 26.0 2.64Number of theory tests taken (at 1st test) 0.42 0.07 0.35 0.06 0.45 0.06Number of theory tests taken (at 2nd test) 1.46 0.07 1.39 0.06 1.45 0.08
se – standard error of the mean value
Table 11 Percentage of candidates who completed trial
A: No training B: Basic training C: Basic + Advanced
Variable description Yes No Yes No Yes No
Had driving lessons before 1st test 97% 3% 96% 4% 93% 7%Had driving lessons before 2nd test 97% 3% 98% 2% 97% 3%Driven with friends before 1st test 58% 42% 55% 45% 53% 47%Driven with friends before 2nd test 66% 34% 66% 34% 61% 39%Passed the theory test (after 1st test) 84% 16% 89% 11% 87% 13%Passed the practical test (after 1st test) 21% 79% 16% 84% 22% 78%
Table 12 Hazard perception test scores
A: No training B: Basic training C: Basic + Advanced
Variable description Mean se Mean se Mean se
First test taken Test X 30.33 1.13 30.94 1.29 31.20 1.11Test Y 24.71 1.13 24.83 1.25 22.82 1.14
Second test taken Test X 31.26 1.01 34.01 1.31 39.79 1.01Test Y 26.72 1.08 30.90 1.04 38.88 1.22
Unadjusted score increase between tests 1.49 0.72 4.40 0.84 12.07 0.98
Adjusted score increase between tests, 1.46 0.62 4.63 0.77 12.43 0.92(i.e. controlling for test difficulty)
Standardised score first test, N~(50,10) 50.01 0.73 50.34 0.82 49.58 0.73
Standardised score second test, N~(50,10) 51.36 0.68 54.61 0.77 61.03 0.77
Standardised score increase between 1.35 0.57 4.27 0.71 11.45 0.85tests, N~(50,10)
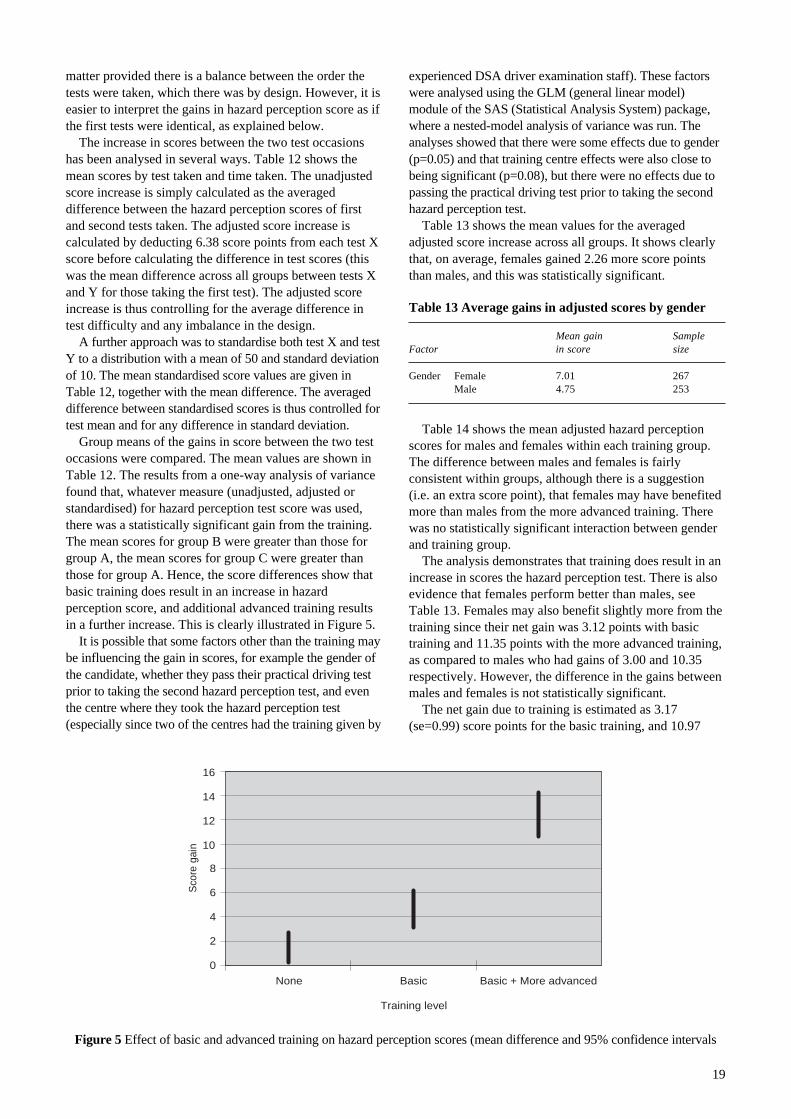
19
matter provided there is a balance between the order thetests were taken, which there was by design. However, it iseasier to interpret the gains in hazard perception score as ifthe first tests were identical, as explained below.
The increase in scores between the two test occasionshas been analysed in several ways. Table 12 shows themean scores by test taken and time taken. The unadjustedscore increase is simply calculated as the averageddifference between the hazard perception scores of firstand second tests taken. The adjusted score increase iscalculated by deducting 6.38 score points from each test Xscore before calculating the difference in test scores (thiswas the mean difference across all groups between tests Xand Y for those taking the first test). The adjusted scoreincrease is thus controlling for the average difference intest difficulty and any imbalance in the design.
A further approach was to standardise both test X and testY to a distribution with a mean of 50 and standard deviationof 10. The mean standardised score values are given inTable 12, together with the mean difference. The averageddifference between standardised scores is thus controlled fortest mean and for any difference in standard deviation.
Group means of the gains in score between the two testoccasions were compared. The mean values are shown inTable 12. The results from a one-way analysis of variancefound that, whatever measure (unadjusted, adjusted orstandardised) for hazard perception test score was used,there was a statistically significant gain from the training.The mean scores for group B were greater than those forgroup A, the mean scores for group C were greater thanthose for group A. Hence, the score differences show thatbasic training does result in an increase in hazardperception score, and additional advanced training resultsin a further increase. This is clearly illustrated in Figure 5.
It is possible that some factors other than the training maybe influencing the gain in scores, for example the gender ofthe candidate, whether they pass their practical driving testprior to taking the second hazard perception test, and eventhe centre where they took the hazard perception test(especially since two of the centres had the training given by
experienced DSA driver examination staff). These factorswere analysed using the GLM (general linear model)module of the SAS (Statistical Analysis System) package,where a nested-model analysis of variance was run. Theanalyses showed that there were some effects due to gender(p=0.05) and that training centre effects were also close tobeing significant (p=0.08), but there were no effects due topassing the practical driving test prior to taking the secondhazard perception test.
Table 13 shows the mean values for the averagedadjusted score increase across all groups. It shows clearlythat, on average, females gained 2.26 more score pointsthan males, and this was statistically significant.
Table 13 Average gains in adjusted scores by gender
Mean gain SampleFactor in score size
Gender Female 7.01 267Male 4.75 253
0
2
4
6
8
10
12
14
16
None Basic Basic + More advanced
Training level
Sco
re g
ain
Figure 5 Effect of basic and advanced training on hazard perception scores (mean difference and 95% confidence intervals
Table 14 shows the mean adjusted hazard perceptionscores for males and females within each training group.The difference between males and females is fairlyconsistent within groups, although there is a suggestion(i.e. an extra score point), that females may have benefitedmore than males from the more advanced training. Therewas no statistically significant interaction between genderand training group.
The analysis demonstrates that training does result in anincrease in scores the hazard perception test. There is alsoevidence that females perform better than males, seeTable 13. Females may also benefit slightly more from thetraining since their net gain was 3.12 points with basictraining and 11.35 points with the more advanced training,as compared to males who had gains of 3.00 and 10.35respectively. However, the difference in the gains betweenmales and females is not statistically significant.
The net gain due to training is estimated as 3.17(se=0.99) score points for the basic training, and 10.97

20
(se=1.11) for the basic + more advanced training. Thistakes into account the small gain in test scores for thecontrol group. The gains in test score can clearly be seen inFigure 5. It would appear that one hour of training is worthjust over 3 hazard perception score points.
6 Implementation
The Road Safety Strategy ‘Tomorrow’s roads: safer foreveryone’ (DETR, 2000) contained a commitment tointroduce a hazard perception test into the driving theorytest. Recognising that poor hazard awareness skills areassociated with increased accident liability, the intention isthat the enhanced theory test will contribute to the roadcasualty reduction targets.
The Road Safety Strategy document identified a date ofautumn 2002 for implementation, and work on theimplementation process started in 2000. The primeobjectives of the TRL project have been to demonstratethat hazard perception tests could be produced that werepsychometrically reliable, and on which scores could beimproved by training. Once these objectives had beenachieved, a necessary first step was to produce a number ofequivalent versions of a hazard perception test. This was toensure that candidates who had to re-take a test would notbe presented with the same material again. It also ensuredthat a wide spectrum of road conditions and road userswould be covered in the tests.
Initially a dedicated DSA film unit generated over 650hazard perception clips. These were reviewed by DSAsenior examiners and by TRL to ensure that the ‘blueprint’guidelines were being followed. Some 390 film clips wereselected and went forward for trials. They were given tosamples of 4,000 learners, 4,000 drivers with 3-24 monthspost-test driving experience, and 4,000 with more than 10years experience. Each clip was seen by about 150 subjectsfrom each of the three groups.
Those items that discriminated between the threeexperience levels were used to construct 20 equivalenttests. Each test contained a mix of items, such that everytest included at least one clip that included an LGV/PCV,a two-wheeled vehicle, pedestrians, adverse weather,rural scenes, suburban scenes, and either a motorway ordual carriageway.
These 20 test versions were then the subject ofcalibration trials with 150 learner drivers each. Two testversions were also taken by samples of LGV drivers andby ADIs. The psychometric properties of the items andtests were then analysed in order to ensure that the test
versions were as equivalent as possible, i.e. they were ofequal overall difficulty and had similar internalconsistency. The LGV/PCV and ADI trials were used todetermine how well these more experienced drivers wouldperform. This information, together with the data from theinitial trials, was used to help to establish pass mark levelsfor test candidates. This work will be reported in moredetail by DSA in due course.
7 Summary and Conclusions
Hazard perception has had a long history as a topic forinvestigation by research workers, but it is only inrelatively recent times that serious consideration has beengiven to the possibility of using it as a component of thedriver licensing system. This report has reviewed that earlyresearch history, and then gone on to describe the workthat has been carried out to arrive at the present position,where a hazard perception test will become part of theTheory Test that must be passed before new drivers canundertake the practical driving test.
The main conclusions may be summarised as follows:
� The literature review provides strong support for hazardperception testing and training. The theoretical basis issound, there is good evidence that it is a skill thatimproves with experience, it is capable of beingimproved through training, and there are indications thatpoor hazard perception skills are associated withelevated accident risk.
� The NFER study set out to demonstrate that it was possibleto produce tests that were sufficiently reliable inpsychometric terms to be used in the licensing process. Inthis they were successful, in that four tests were producedwith high levels of reliability, three of which distinguishedbetween inexperienced and experienced drivers.
� However, a number of studies found that the NFER testswere not able to demonstrate an association withaccident liability. To investigate this and other topics, afurther programme of work was undertaken by TRL.
� One of the first tasks in the TRL project was to evaluatethe hazard perception items that discriminated betterthan others on a driver experience scale. The ‘best’items were those that required good scanning practicesand an ability to anticipate potentially hazardoussituations. The sub-set of NFER items selected withthese characteristics was able to discriminate on thedriver experience scale and appeared to have someassociation with retrospective accident liability.
Table 14 Average gains in adjusted scores by gender and training group
A: No training B: Basic training C: Basic + More advanced training
Mean se Sample Mean se Sample Mean se Sample
Males 0.70 0.82 100 3.70 1.14 76 11.05 1.39 77Females 2.30 0.93 91 5.42 1.05 90 13.65 1.23 86
Total 1.46 0.62 191 4.63 0.77 166 12.43 0.92 163

21
� A broad-based ‘blueprint’ was developed to define thetype of hazard perception items required. Further itemswere filmed using staged situations as well asopportunistic filming, and produced enough usableitems to evaluate in a trial of different driver experiencegroups. The results of the trial demonstrated that therewere enough items that had the necessary psychometriccharacteristics to allow for the construction of new tests.
� While this test development was being undertaken, aspecification for suitable hazard perception trainingmaterial was being developed. This involved reviewingexisting driver training material as well as discussionswith the driver training industry. The resultantspecification was given to DSA who then created atraining package. This training package contained threemodules – basic, plus two more advanced levels oftraining. Each module took about an hour to administer,and was group-based training using video material witha structured schedule, which could be delivered bypeople who are not professional driver trainers.
� The final task in this research was to run a trial oflearners who were ready for their theory test, and to testtheir hazard perception skills before and after training.Only one hazard perception training package wasevaluated, but using this package - developedspecifically for this project - showed that 3 hours oftraining resulted in learner drivers obtaining similaraverage hazard perception scores to those ofexperienced drivers. The conclusion, therefore, is thathazard perception skills can be trained in learner drivers.Improving new drivers’ hazard perception skills shouldhave a beneficial effect on their accident liability,particularly in the first 2 or 3 years of driving which iswhen they would normally be gaining these skills.
� In order to encourage new drivers to take hazardperception training they need motivation, and thestrongest motivation is a hurdle in the licensing processin the form of a hazard perception test. Any hazardperception test introduced into the licensing system mustbe psychometrically sound and have face validity. Inother words those taking the test must see the value ofthe test and the test must be a reliable instrument.
� The Road Safety Strategy document (DETR, 2000)contained a commitment to introduce a hazardperception test into the driving theory test. Work on theimplementation process has led to the construction of 20equivalent tests covering a wide range of roadconditions and road users, and incorporating only thoseitems that have been shown to discriminate betweenexperienced, inexperienced, and learner drivers. Thetests have been calibrated, and pass marks for testcandidates have been identified.
8 References
Currie L (1969). The perception of danger in a simulateddriving task. Ergonomics, 12, 841-849.
Department of the Environment, Transport and theRegions (DETR) (2000). Tomorrow’s roads: safer foreveryone. London: Department of the Environment,Transport and the Regions.
Field D T, Groeger J A and Hammond S M (1997).Computerised assessment of drivers’ skills. In G BGrayson (Ed.) Behavioural Research in Road Safety VII.Crowthorne: TRL Limited.
Forsyth E, Maycock G and Sexton B (1995). Cohortstudy of learner and novice drivers: Part 3, Accidents,offences and driving experience in the first three years ofdriving. Project Report PR111. Crowthorne: TRL Limited.
Goldstein L G (1972). Youthful drivers as a special safetyproblem. Accident Analysis and Prevention, 4, 153-189.
Grayson G B (1991). Driver behaviour. Proceedings ofthe Safety 91 Conference. Crowthorne: TRL Limited.
Grayson G B and Maycock G (1997). What do driverslearn through experience - and can it be taught? Paperpresented to NHTSA Symposium on Risk TakingBehavior and Traffic Safety. Cape Cod, October 1997.
Grayson G B, Maycock G, Groeger J A, Hammond S Mand Field D T (2002). Risk, hazard perception andperceived control. TRL Report TRL560. Crowthorne:TRL Limited. (In production)
Hull M A and Christie R J (1993). The hazardperception test: the Geelong trial and future developments.VicRoads Report GR 93-13
Irving A and Jones W (1992). Methods for testingimpairment due to drugs. European Journal of ClinicalPharmacology, 43, 61-66.
Maycock G, Lockwood C R and Lester J F (1991). Theaccident liability of car drivers. Research Report RR315.Crowthorne: TRL Limited.
Mayhew D R and Simpson H M (1990). New to the Road.Ottawa: Traffic Injury Research Foundation of Canada.
McKenna F P and Crick J L (1991). Experience andexpertise in hazard perception. In G B Grayson and J FLester (Eds.) Behavioural Research in Road Safety.Crowthorne: TRL Limited.
McKenna F P and Crick J L (1994). Hazard perceptionin drivers: a methodology for testing and training.Contractor Report CR313. Crowthorne: TRL Limited.
McKenna F P and Crick J L (1997). Developments inhazard perception. TRL Report TRL297. Crowthorne:TRL Limited.

22
McKenna F P and Horswill M S (1997). Differingconceptions of hazard perception. In G.B. Grayson (Ed.)Behavioural Research in Road Safety VII. Crowthorne:TRL Limited.
McKenna F P and Horswill M S (1999). Hazardperception and its relevance for driver licensing. IATSSResearch, 23, 36-41.
Mills K L, Hall R D, McDonald M and Rolls G (1998).The effects of hazard perception training on the developmentof novice driver skills. Road Safety Report No.4. London:Department of the Environment, Transport and the Regions.
OECD (1975). Young Driver Accidents. Paris: OECD.
Pelz D C and Krupat E (1974). Caution profile anddriving record of undergraduate males. Accident Analysisand Prevention, 6, 45-58.
Quimby A R, Maycock G, Carter L D, Dixon R andWall J G (1986). Perceptual abilities of accident involveddrivers. Research Report RR27. Crowthorne: TRL Limited.
Quimby A R and Watts G R (1981). Human factors anddriving performance. Laboratory Report LR1004.Crowthorne: TRL Limited.
Underwood G and Chapman P A (1998). Eye movementsand hazard perception ability. In G.B. Grayson (Ed.)Behavioural Research in Road Safety VIII. Crowthorne:TRL Limited.
23
Abstract
This report describes the recent history of hazard perception testing using computer-based moving imagetechnology, and sets out the background to the decision to incorporate a hazard perception component into theTheory Test that learner drivers in the UK must pass before taking a practical driving test. Previous research hasshown that hazard perception improves with driving experience, is related to accident liability, and is capable ofimprovement through training. For a test to be suitable for inclusion in the licensing process, it must bepsychometrically sound, have a standardised scoring system, and be available in a number of parallel forms. Themain body of the report describes the development work that was undertaken to meet these criteria, and also reportson trials showing that the mean scores of learner drivers could be increased to those of experienced drivers by ashort programme of focused training.
Related publications
TRL560 Risk hazard perception and perceived control by G B Grayson, G Maycock, J A Groeger, S M Hammondand D T Field. 2002 (In production)
TRL297 Developments in hazard perception by F McKenna and J Crick. 1998 (price £25, code E)
PR111 Cohort study of learner and novice drivers: Part 3 Accidents, offences and driving experience in the firstthree years of driving by E Forsyth, G Maycock and B Sexton. (price £35, code J)
CR313 Hazard perception in drivers: a methodology for testing and training by F P McKenna and J L Crick.1994 (price £35, code H)
RR315 The accident liability of car drivers by G Maycock, C R Lockwood and J F Lester.1991 (price £20, code C)
RR27 Perceptual abilities of accident involved drivers by A R Quimby, G Maycock, I D Carter, R Dixon andJ G Wall. 1986 (price £20, code C)
Prices current at November 2002
For further details of these and all other TRL publications, telephone Publication Sales on 01344 770783, or visitTRL on the Internet at www.trl.co.uk.

24