The development of farm-level sustainability indicators...
19
1 The development of farm-level sustainability indicators for Ireland using the Teagasc National Farm Survey Mary Ryan 1 *, Cathal Buckley 2 , Emma Jane Dillon 1 , Trevor Donnellan 1 , Kevin Hanrahan 1 , Thia Hennessy 1 and Brian Moran 1 . 1 Agricultural Economics and Farm Surveys Department, Teagasc, Athenry, Co. Galway, Ireland. 2 Crops, Environment and Land Use Programme, Teagasc, Athenry, Co. Galway, Ireland. Contributed Paper prepared for presentation at the 88th Annual Conference of the Agricultural Economics Society, AgroParisTech, Paris, France 9 - 11 April 2014 Copyright 2014 by [Ryan et al.] All rights reserved. Readers may make verbatim copies of this document for non-commercial purposes by any means, provided that this copyright notice appears on all such copies. *Mary Ryan, Agricultural Economics and Farm Surveys Department, Rural Economy and Development Programme, Teagasc, Athenry, Co. Galway, Ireland. Email: [email protected] Acknowledgements: The authors wish to thank colleagues for their advice and staff involved in the collection and validation of Teagasc National Farm Survey data and the farmers who participate voluntarily. Any errors or omissions remain the responsibility of the authors. Abstract Developing the capacity to assess and chart trends in the sustainability of farming and food production is becoming increasingly more important as agriculture strives to produce more food while minimising the risk to the natural environment. The multi- faceted nature of sustainability is encompassed in economic, environmental, social and innovation indicators. This paper outlines the development of farm level indicators for these sustainability criteria in Ireland. A comparison of indicators across farm systems shows that dairy farms, followed by tillage farms, tend to be the most economically and socially sustainable farm systems. Interestingly, in relation to greenhouse gas emissions in particular, the top performing farms in an economic sense also tend to be the best performing farms from an environmental sustainability perspective. This trend is also evident in terms of the adoption of innovative practices on farm, which is found to be strongly positively correlated with economic performance. Keywords Agriculture, Sustainability JEL code Agricultural Economics, micro-analysis Q12, Q18, Q56
-
Upload
truongcong -
Category
Documents
-
view
222 -
download
1
Transcript of The development of farm-level sustainability indicators...

1
The development of farm-level sustainability indicators for Ireland using the
Teagasc National Farm Survey
Mary Ryan1*, Cathal Buckley
2, Emma Jane Dillon
1, Trevor Donnellan
1, Kevin
Hanrahan1, Thia Hennessy
1 and Brian Moran
1.
1Agricultural Economics and Farm Surveys Department, Teagasc, Athenry, Co. Galway, Ireland.
2Crops, Environment and Land Use Programme, Teagasc, Athenry, Co. Galway, Ireland.
Contributed Paper prepared for presentation at the 88th Annual Conference of
the Agricultural Economics Society, AgroParisTech, Paris, France
9 - 11 April 2014
Copyright 2014 by [Ryan et al.] All rights reserved. Readers may make verbatim
copies of this document for non-commercial purposes by any means, provided that this
copyright notice appears on all such copies.
*Mary Ryan, Agricultural Economics and Farm Surveys Department, Rural Economy
and Development Programme, Teagasc, Athenry, Co. Galway, Ireland.
Email: [email protected]
Acknowledgements: The authors wish to thank colleagues for their advice and staff
involved in the collection and validation of Teagasc National Farm Survey data and the
farmers who participate voluntarily. Any errors or omissions remain the responsibility
of the authors.
Abstract
Developing the capacity to assess and chart trends in the sustainability of farming and
food production is becoming increasingly more important as agriculture strives to
produce more food while minimising the risk to the natural environment. The multi-
faceted nature of sustainability is encompassed in economic, environmental, social and
innovation indicators. This paper outlines the development of farm level indicators for
these sustainability criteria in Ireland. A comparison of indicators across farm systems
shows that dairy farms, followed by tillage farms, tend to be the most economically and
socially sustainable farm systems. Interestingly, in relation to greenhouse gas emissions
in particular, the top performing farms in an economic sense also tend to be the
best performing farms from an environmental sustainability perspective. This
trend is also evident in terms of the adoption of innovative practices on farm, which
is found to be strongly positively correlated with economic performance.
Keywords Agriculture, Sustainability
JEL code Agricultural Economics, micro-analysis Q12, Q18, Q56

2
Introduction
An increasing number of “Grand Challenges” for food and agriculture have emerged in
the first decade of the 21st century. These include population growth, climate change,
energy and water supply, all of which affect the potential of agriculture to provide a
secure supply of safe food for a rapidly growing population. Clearly, international
efforts to reduce greenhouse gas (GHG) emissions will need to take account of
emissions from the entire food chain including agriculture. At the same time, an
increase in global food production is needed. As a result, “sustainable intensification”
of agricultural production is emerging as a priority for policymakers and international
development agencies (Herrero and Thornton, 2014).
Sustainable development was defined in the Bruntland report as “development which
meets the needs of the present without compromising the ability of future
generations to meet their own needs” (UN, 1987). Sustainability was the main
principle of the declaration of the Rio Earth Summit and Agenda 21, established in
1992 at the United Nations (UN) Conference for Environment and Development, which
established a mandate for the UN to formulate a set of indicators to gauge progress
towards sustainability (Dillon et al, 2010). Since then there has been a concerted effort
to monitor progress towards sustainable development, using indicators of sustainable
land management, land quality indicators, (Rigby et al., 2001) and indicators of
sustainable agriculture (Frater and Franks, 2013).
In the agricultural sustainability context, a comprehensive international literature
review was undertaken by (Dillon et al., 2007), and later (Dillon et al., 2010)
initializing the process of analysing Irish farm level data to assess the sustainability of
Irish agriculture. It is only very recently that the collection of additional data allows for
the augmentation of this initial suite of Irish sustainability indicators. Recently also,
there has been a recognition of the role of innovation as an indicator of the longer term
sustainability of agricultural practices. This paper builds on previous work to deepen
and broaden the measurement of farm sustainability, encompassing economic,
environmental, and social indicators, while also undertaking the development of
indicators of innovation based on the adoption of new or innovative farm practices. We
describe the sustainability criteria to be measured and the variables used to develop the
relevant indicators for the main farm systems, namely dairy, cattle, sheep and tillage. The
indicators are examined by system and aggregated nationally to facilitate more detailed
analysis and discussion of results.
Background
The goal of the EU Bioeconomy Strategy –‘Innovating for Sustainable Growth’ (EC,
2012) is to move to a more innovative and low emissions economy, reconciling
demands for sustainable agriculture, food security, while ensuring biodiversity and
environmental protection. For a country of just 4.5 million people, Ireland has a large
agri-food sector based mainly on exports. Of the total land area, 81 percent is devoted
to agriculture, which is predominantly pasture devoted to dairy and dry-stock
production, sufficient to feed around thirty million people (Govt. of Ireland, 2012).
This production is facilitated by favourable climatic conditions for the growing of
grass, allowing farmers to benefit from a natural, low-input production system. Irish

3
farming is not particularly intensive in nature. According to the Teagasc National Farm
Survey for 2012, the average farm size across all systems in 2012 was 47 hectares (ha)
and the average income was €541 per hectare. There is a heavy reliance on direct
payments across all farm systems, with the Single Farm Payment accounting for on
average 87 percent of income for the cattle other system and on average 35 percent of
dairy income (Hennessy et al., 2013a).
Projections suggest that the world’s population will rise from the 2012 figure of seven
billion to over nine billion by 2050 (FAO, 2009). This increase in global population is
being accompanied by growth in real-income that is leading to a change in
consumption, with meat and other livestock products becoming more prominent in the
diet as incomes rise. The industry-developed strategy for the food sector in Ireland,
Food Harvest 2020 (DAFM, 2010), maps the desired future direction of the agri-food
and drinks sector for the next decade and points to the challenges and opportunities that
lie ahead. One of the most pressing challenges for Irish agriculture will be to produce
more food without negatively impacting on the environment. Significant opportunities
for the sector will arise from 2015 with the reform of the Common Agriculture Policy
(CAP), which will allow for increased milk production within the EU. Dillon et al.
(2014) examines the specific challenges facing the Irish dairy sector in expanding
production in a sustainable manner.
There is a growing awareness of the need to capture international food market
opportunities in a sustainable way that minimises the impact on land use and GHG
emissions. Ireland’s food marketing board (Bord Bia) has built its “Origin Green”
marketing campaign on Ireland’s extensive, low-input, grass-based production systems.
In the more mature EU and US markets, consumers are increasingly seeking foods with
clear and credible health, wellness and sustainability attributes. Consumers who
demand the highest quality in food production and environmental standards expect
clear visibility on sustainability issues and, crucially, are willing to pay a premium for
this. Large retail outlets are also demanding that their food suppliers demonstrate the
principles of sustainability and traceability in their food products Government of
Ireland, 2012).
In 2012 about 30 percent of Ireland’s GHG emissions came from the agriculture sector
(EPA, 2013), whereas the corresponding EU average in 2010 was just over 10 percent
(Donnellan, 2014). The extent of beef and dairy production gives agriculture
prominence as a source of Irish GHG emissions (Breen et al., 2010)1. However, on a
like-for-like product basis, GHG emissions generated in Irish agricultural production
are among the lowest internationally. A study by the European Commission has shown
that Irish agriculture has the lowest carbon footprint in the EU for milk, and the fifth
lowest carbon footprint in the EU for beef (Leip et al., 2010). In this context, the
measurement of the relative sustainability of Irish agriculture and Irish food exports has
recently gained increased policy prominence.
Methodology
1 These GHG emissions come from a variety of sources, including methane belched by cattle, methane and nitrous
oxide from animal slurry, nitrous oxide from urine, and nitrous oxide from the use of nitrogen fertilisers. To put
these emissions in context, it is worth noting that, over the course of a year, the methane emissions associated with a
cow are comparable to the emissions produced from the fuel used in driving a typical family car.

4
Indicators of sustainability have been used to describe and measure key relationships
between economic, social and environmental factors with sustainable development
being seen as a balance between the dimensions of sustainability. Successful indicators
are usually readily understandable, representative of key environmental policies and
concerns, and capable of illustrating trends over time. In addition, indicators provide
an early warning of potential future economic, social or environmental damage. They
must be scientifically valid, analytically sound, measurable and verifiable. They
depend significantly therefore, on the availability of adequate, good quality data, which
is updated at regular intervals (FAO, 2003).
This study outlines the development of Irish farm-level sustainability indicators
using 2012 Teagasc National Farm Survey (NFS) data. The NFS is a nationally
representative weighted sample of over 1,000 Irish farms collected annually. The first
NFS results were published in 1972, just ahead of Ireland’s accession to the European
Economic Community (EEC) and have been published on an annual basis since then.
At that time, each Member State of the EEC also became members of the Farm
Accountancy Data Network (FADN) which provides a harmonised platform for the
collection of farm statistics across Europe. NFS data are particularly suitable for the
design of indicators as the collection method is consistent and verifiable, both
important issues for objective credible, national reporting. Furthermore, the
longitudinal nature of the data makes it possible to chart indicators over time. In recent
years, data collection in the NFS has been expanding in nature and complexity and is
now much richer than that required for economic performance analysis for FADN
purposes. Thus it is now possible to develop indicators to represent all four dimensions
of sustainability namely, economic, environmental, social and innovation (Hennessy et
al. 2013b). Additionally, the fact that the NFS is linked to FADN opens up the
possibility of engaging in future international comparative studies.
Economic indicators
Given the wealth of economic data within the NFS the design of economic indicators is
relatively straightforward. Although much of the focus in the sustainability debate is
directed towards environmental resource management, farms must also be
economically viable in the longer term. Farm level measures of sustainability that
capture the broad concepts of productivity, profitability and viability are presented in
Table 1.
Table 1. Economic Indicators Indicator Measure Unit
Productivity of labour
Income per unpaid labour unit €/labour unit
Productivity of land
Gross output per hectare €/hectare
Profitability Market based gross margin (less subsidies) per
hectare
€/hectare
Market orientation
Proportion of output derived from the market %
Farm viability
Farm is economically viable
1=viable, 0=not viable

5
The return to labour invested on the farm is measured as family farm income per
unpaid labour unit employed on the farm. Family farm income includes a
deduction for hired labour, hence the measure only includes unpaid family labour.
An economically viable farm is defined as having the capacity to remunerate
family labour on the farm at the average agricultural wage and the capacity to
provide an additional five percent return on non-land assets.
Environment indicators
The need to produce more food without impacting negatively on the environment is
possibly the greatest challenge facing the agricultural sector. The nature of the
interactions between agricultural practices and the environment are complex and it will
only be as scientific knowledge on these interactions grows that there will be greater
clarity on the extent and nature of the data required for the future development of
environmental indicators. While comprehensive economic data have been collected in
the NFS for 40 years, the inclusion of environmental data is relatively recent. The
environmental thematic areas which are of most concern include air quality and climate
change; risk to water quality; and habitat and biodiversity indicators (EPA, 2013).
Air quality and climate change
Most scientists agree that GHG emissions are a major contributor to climate change.
One of the most pressing challenges for Irish agriculture will be to produce more food
without increasing these emissions. Agriculture is Ireland’s single largest emissions
source by sector, accounting for 32.1 percent of total GHG emissions in 2012 (EPA,
2013). The measurement, reporting and verification of GHG emissions from the
agricultural sector are highly complicated from both a scientific and administrative
perspective. Generally, there are two different commonly used approaches to
measuring GHG emissions from agriculture and the agri-food chain. These are the
Intergovernmental Panel for Climate Change (IPPC) methodology and the Life-Cycle
Assessment (LCA) approach for agriculture. The standard method for reporting GHG
emissions is the IPCC approach which is confined to measuring emissions that occur
inside the farm gate and quantifies GHG emissions using a national sector-based
approach. In the case of agriculture it confines itself to the emissions within the farm
gate. Emissions associated with imported inputs, such as animal feed, fertiliser or farm
animals are not included in this measure. The more holistic LCA is product rather than
sector based and encompasses the length of the food chain from the production of
agricultural inputs right through to the retailer and consumer2.
The methodologies selected to measure GHG’s are dictated largely by the
availability of environmental data. Sufficient activity data are available within the
NFS dataset to estimate GHG emissions associated with each farm enterprise using
IPCC coefficients and conventions to produce an estimate of total emissions per
farm. Once GHG emissions per farm are estimated, three emissions indicators are
reported: total GHG emissions per farm, greenhouse gas emissions per unit of product
and GHG emissions emanating from electricity and fuel use on the farm. Total farm
emissions are presented as tonnes of carbon dioxide equivalent (CO2-eq). Emissions
per unit product are expressed in terms of CO2-eq per kilograms (kg) of product
2 For more detail on farm level LCA methodology, see Hennessy et al. (2013b).

6
produced. This is presented for the main product produced by the dairy, cattle and
sheep systems. In the case of dairy and tillage farms actual kilograms of milk and crop
production are recorded by the NFS. However, it was not feasible to develop per unit
product indicators for tillage farms as further work is required to allocate emissions to
the particular crops cultivated on the farm. For cattle and sheep farms it was necessary
to estimate kilograms of output by using standardised animal weights and prices. This
per unit product measurement approach allows for the incorporation of production
efficiencies in the measurement of the indicators. Emissions from fuel and electricity
used on the farm and by hired contractors also contribute to overall agricultural
emissions. These emissions are estimated separately from the above indicators and are
presented for the dairy, cattle and sheep systems in relation to the volume of output
produced.
Risk to water quality
Inefficient use of nutrients on farms has significant economic implications for farmers
as well as for the wider environment. Nitrogen (N) is one of the main elements
underpinning agricultural production. However, surplus nitrogen poses a risk to the
aquatic environment. All other things being equal, optimal use of nitrogen can deliver a
double dividend of reduced risk of nutrient loss from agricultural land, thereby helping
to achieve environmental water quality objectives while increasing the economic
margins at farm level. The complexity of the interactions between agriculture and water
quality are not yet fully understood, therefore developing relevant indicators on which
data are available is particularly challenging. The links between nitrogen balance
(imports of N less exports) at farm and field level and loss to the environment are
complex and difficult to predict as the nature of the interactions depends on a myriad of
factors such as soil type, hydrology, weather, farm structures and management
practices.
Both farm gate and whole farm balance nutrient accounting approaches provide a
reliable assessment of nutrient management efficiency at farm or enterprise level while
providing an indicator of environmental pressure in terms of risk to water quality. The
farm gate approach restricts analysis to imports and exports of nutrients over which the
farmer has direct control (through the farm gate). Whole farm approaches additionally
account for nutrient inputs and exports such as atmospheric deposition, biological
fixation and mineralisation of nutrients in soils. Ideally, holistic whole farm soil/surface
indicators would take account of the nutrient status of the soils but the full range of data
required to undertake a whole farm balance analysis is not available within the NFS.
However, farm gate nitrogen balances are a reliable indicator of agronomic efficiency
and environmental pressure (Schroder et al., 2004).
Using the available data, a farm gate nitrogen (N) balance per hectare measure of the
risk to water quality is developed for all systems. The farm gate N balance is
established by subtracting the total quantities of N imported from total quantities of N
exported on a per hectare basis. Each of the products exported from the farm (e.g. milk,
meat, crops, wool) and imports (mainly chemical fertilisers and feedstuffs) are
converted to kilogrammes of N using relevant coefficients (see Buckley et al. (2013).
Farms importing or exporting organic manures were excluded from the analysis due to
data limitations. Table 2 presents the environment indicators examined in this paper.

7
Table 2. Environment Indicators Indicator Measure Unit
GHG emissions per farm
IPCC estimate/ farm Tonnes CO2-eq /farm
GHG emissions per kg of output
IPCC estimate/ kg of output Kg /kg output
Nitrogen (N) balance
Risk to water quality Kg N surplus/hectare
Emissions from fuel and electricity
CO2-eq /kg output Kg CO2-eq /kg output
Habitat and biodiversity indicators
The measurement of biodiversity is a key component of any assessment of
environmental sustainability. Many Irish farming systems have a relatively high
proportion of habitats for farmland wildlife, and this is a feature of Irish agriculture that
is a key selling-point in Ireland’s “Origin Green” international agri-food marketing
campaign. Measurement of these features will be required to translate farmland wildlife
attributes into labelling and marketing initiatives. Aside from its intrinsic and cultural
values, biodiversity has a functional value in the provision of services, e.g. food and
fuel. In principle, methods for farm-scale assessment of wildlife habitats in Ireland are
well developed (e.g. Sheridan et al. 2011), and the primary constraint is the logistical
effort required to undertake habitat surveys.
Measurement of the number of land use types and their proportional abundance as
reported in the NFS dataset could, in the future form the basis of a future biodiversity
indicator; however the data collected on NFS farms is not currently sufficiently detailed
for indicator development. The land use types recorded in the NFS range in intensity of
farming from pasture and tillage to rough grazing and old woodland and can be used to
measure the richness and evenness of land use diversity. However, these data do not
contain information on the relative value of each land use in terms of the ecosystem
services provided. Additional data needs to be collected and further work needs to be
undertaken to investigate the weighting of each land use type in terms of its ecological
quality, before meaningful indicators of farmland habitat can be developed.
Social indicators
In evaluating sustainability in the past, economic and environmental factors took
precedence and income was commonly used as an indicator of social welfare in the
literature. There is now a growing recognition of the need to examine overall human
well-being and quality of life within the sustainability framework. Agriculture
contributes to the viability of rural areas, helping to maintain the rural infrastructure.
Social sustainability indicators are designed here to gauge the quality of life of the
farming community by identifying and quantifying those ‘social life’ dimensions not
determined by economic activity. Welfare is determined not only by economic activity
but also by a wide range of additional dimensions of social life. Five indicators are
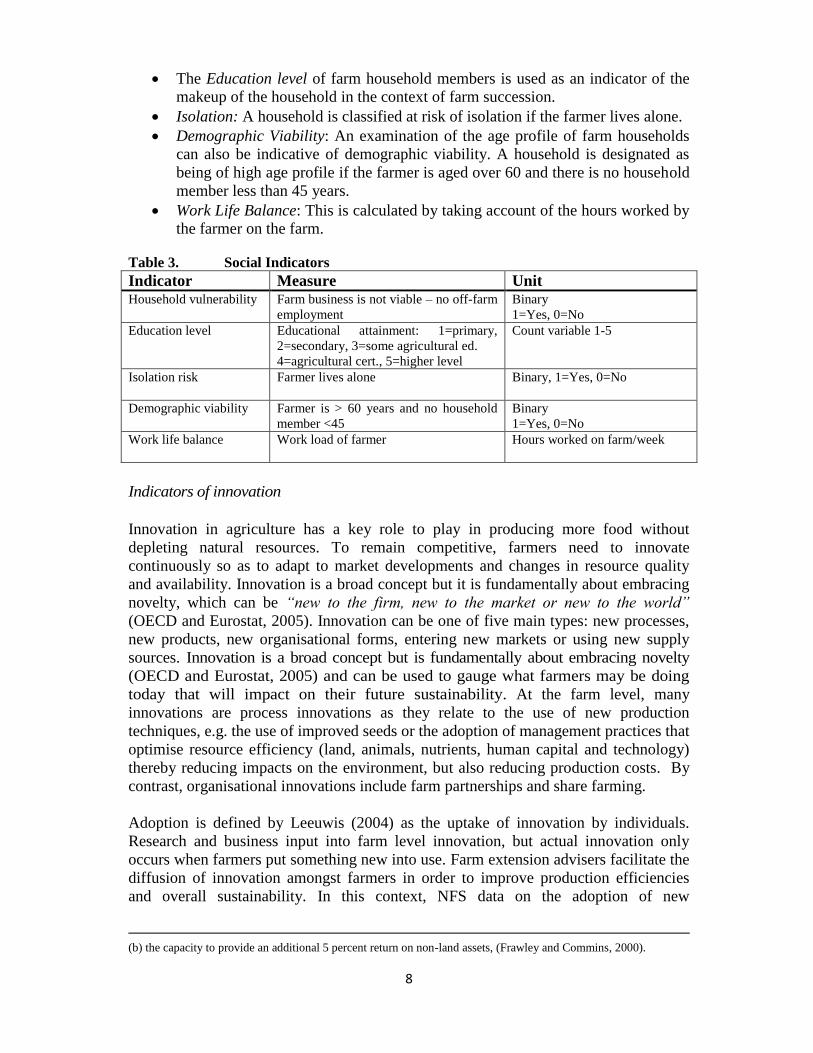
presented in Table 3 that quantify the ‘social life’ dimensions as follows:
Household vulnerability: A household is vulnerable if the farm is not
economically viable3 and neither the farmer nor spouse is employed off-farm.
3An economically viable farm has (a) the capacity to remunerate family labour at the average agricultural wage, and
8
The Education level of farm household members is used as an indicator of the
makeup of the household in the context of farm succession.
Isolation: A household is classified at risk of isolation if the farmer lives alone.
Demographic Viability: An examination of the age profile of farm households
can also be indicative of demographic viability. A household is designated as
being of high age profile if the farmer is aged over 60 and there is no household
member less than 45 years.
Work Life Balance: This is calculated by taking account of the hours worked by
the farmer on the farm.
Table 3. Social Indicators
Indicator Measure Unit Household vulnerability Farm business is not viable – no off-farm
employment
Binary
1=Yes, 0=No
Education level Educational attainment: 1=primary,
2=secondary, 3=some agricultural ed.
4=agricultural cert., 5=higher level
Count variable 1-5
Isolation risk
Farmer lives alone Binary, 1=Yes, 0=No
Demographic viability Farmer is > 60 years and no household
member <45
Binary
1=Yes, 0=No
Work life balance
Work load of farmer Hours worked on farm/week
Indicators of innovation
Innovation in agriculture has a key role to play in producing more food without
depleting natural resources. To remain competitive, farmers need to innovate
continuously so as to adapt to market developments and changes in resource quality
and availability. Innovation is a broad concept but it is fundamentally about embracing
novelty, which can be “new to the firm, new to the market or new to the world”
(OECD and Eurostat, 2005). Innovation can be one of five main types: new processes,
new products, new organisational forms, entering new markets or using new supply
sources. Innovation is a broad concept but is fundamentally about embracing novelty
(OECD and Eurostat, 2005) and can be used to gauge what farmers may be doing
today that will impact on their future sustainability. At the farm level, many
innovations are process innovations as they relate to the use of new production
techniques, e.g. the use of improved seeds or the adoption of management practices that
optimise resource efficiency (land, animals, nutrients, human capital and technology)
thereby reducing impacts on the environment, but also reducing production costs. By
contrast, organisational innovations include farm partnerships and share farming.
Adoption is defined by Leeuwis (2004) as the uptake of innovation by individuals.
Research and business input into farm level innovation, but actual innovation only
occurs when farmers put something new into use. Farm extension advisers facilitate the
diffusion of innovation amongst farmers in order to improve production efficiencies
and overall sustainability. In this context, NFS data on the adoption of new
(b) the capacity to provide an additional 5 percent return on non-land assets, (Frawley and Commins, 2000).

9
technologies or participation in knowledge transfer programmes are used to develop
measures of farm innovation. As innovations are generally specific to the farm
enterprise, indicators which are appropriate to each of the farm systems are developed.
The dairy measures chosen were: participation in a milk recording programme
which provides feedback on milk quality; membership of a dairy
discussion/knowledge transfer group; and farmers who have changed the
timing of slurry spreading to avail of greater uptake of nutrients during the
early growing season4.
For cattle and sheep farms, the measures chosen were: membership of a beef or
sheep Quality Assurance Scheme; undertaking of reseeding to improve
grassland within the last three years; and the undertaking of soil testing within
the last three years.
On tillage farms, the measures chosen were: availing of forward selling of
tillage crops; usage of ICT on the farm; and the undertaking of soil testing
within the last three years.
Aggregation of indicators
Up to 25 farm-level sustainability indicators (both quantitative and qualitative) are
developed for each farm system and aggregated nationally. In the results section which
follows, average values are presented for each indicator across each system. The
standard deviation which is a measure of the dispersion of the data around the mean is
also presented. As the indicators developed in this analysis are both qualitative and
quantitative in nature, measuring different concepts and using different scales, it is
necessary to normalise the data and bring the various indicators to a common scale.
Normalisation is performed using the MIN-MAX approach (OECD, 2008) whereby the
lowest value for each indicator is subtracted from the value for a given observation and
divided by the range of the dataset for that indicator. Indicators are then scaled from
zero to 100, zero indicating the poorest performance in the sample and 100 indicating
the best performance. The normalised indicators are then presented using spider
diagrams which show the relative performance of the various farm systems along each
dimension of sustainability.
Composite indicators
Indicators can take account of the various dimensions of sustainability separately, or
they can encapsulate all these components in frameworks of indicators. The various
indicators can be combined to arrive at one indicator for each of the dimensions of
sustainability, for example one economic, one social, one innovation and one
environmental indicator per farm. It is also possible to aggregate all of these indicators
so as to arrive at one composite measure of farm-level sustainability for each farm or for
the farming sector as a whole. However, there is much debate in the literature (Gomez-
Limon and Riesgo (2009), Gomez-Limon and Sanchez-Fernandez (2010), Reig-Martinez
et al. (2011)) surrounding the calculation and use of composite indicators with many
4 Farmers who opt to spread more than 50 percent of slurry during February/March/April benefit from both
economic and environmental dividends as there is a greater uptake of nutrients by grassland during these months,
thereby reducing the requirement for chemical fertiliser and the risk of runoff of nutrients to water bodies.

10
claiming they over-simplify a complex issue. Further work needs to be undertaken to
investigate the usefulness of composite indicators in an Irish context.
Results – economic sustainability
Table 4 presents the mean and standard deviation (SD) for the economic indicators for
each of the farm systems in 2012. As expected, the dairy system is the most profitable
of the farm systems. The average productivity of land (gross output per hectare) and
market profitability (market based gross margin per hectare) are €3,069 and €1,440
respectively, with an average productivity of labour (income per labour unit) of
€38,225. The market orientation of dairy farms (the proportion of output value derived
from the market, as distinct from subsidies) is 85 percent on average.
Table 4. Economic sustainability indicators (2012)
Farm
system
Productivity of
labour
€/labour unit
Productivity of
land
€/ha
Market
Profitability
€/ha
Farm
viability
%
Market
Orientation
%
Mean (SD) Mean (SD) Mean (SD) Mean (SD) Mean (SD)
Dairy 38,225 (28034) 3,069 (984) 1440 (619) 69 (46) 85 (7)
Cattle 15,742 (19986) 1,251 (552) 433 (306) 25 (43) 60 (13)
Sheep 16,629 (13975) 1,281 (599) 484 (328) 24 (43) 55 (17)
Tillage 43,098 (32279) 1,854 (690) 840 (519) 72 (45) 74 (8)
On cattle5 and sheep farms, the average gross output per hectare is €1,251 and €1,281
respectively, while the market gross margin is €433/ha for cattle and €484/ha for sheep.
The average income per labour unit on cattle farms is €15,742 with an average of
€16,629 for sheep farms. On cattle farms, 60 percent of output is derived from the
market with 55 percent from the market on sheep farms. In relation to economic
viability, the tillage system has the highest proportion of economically viable farms at
72 percent on average followed by dairy farms at 69 percent, while on average only
approximately a quarter of cattle and sheep farms are viable in 2012.
The average productivity of land on tillage farms is €1,854 per hectare and the average
market gross margin is €840 per ha, however tillage farms have the highest income per
labour unit (€43,098). Here there is wide variation around the mean with some tillage
farms achieving an income per labour unit of almost €120,000. These are farms with
very low labour input where most activities are contracted out. On average, 75 percent
of output on tillage farms is derived from the market in 2012.
The spider diagram presented in Figure 1 facilitates the examination of the relative
economic performance of the various farm systems for each dimension of economic
sustainability by comparing the economic indicators for dairy, cattle, sheep and tillage
5 The indicators for cattle farms combine cattle rearing and cattle finishing systems.

11
farms6. On average, dairy farms, followed by tillage farms, perform better along all of
the economic indicators relative to the other farm systems. The performance of sheep
and cattle farms is very similar, although sheep systems marginally outperform cattle in
relation to productivity of land, productivity of labour and market profitability. The
least variability in performance is exhibited along the market orientation dimension,
where the four farm systems are clustered closest together.
Figure 1: Economic sustainability spider diagram
Results – environmental sustainability
The measures of GHG emissions were calculated using IPCC coefficients and
conventions and include GHG emissions per farm and per kg of product. On dairy
farms on average, approximately 61 percent of the emissions were generated by the
dairy enterprise and 39 percent by cattle and other enterprises in 2012. On cattle farms,
almost all of the emissions come from the cattle enterprise. Despite being specialised in
sheep production, the cattle enterprise on sheep farms accounts for the larger
proportion of emissions at 54 percent compared to 44 percent from sheep. Similarly, on
specialist tillage farms, the cattle enterprise accounted for 63 percent of the emissions
with cereal crops in general accounting for only 28 percent and the remainder
accounted for by sheep or other crops. Further work is required to allocate the GHG
emissions from tillage farms to the particular crops on the farm and to validate these
results. Additional analysis is also required to allocate fuel and electricity usage to
particular crops, as these are currently recorded on a whole farm basis and are not
attributed to any particular crop.
6 Spider diagrams are constructed so that zero, or poorest performance, is at the centre of the diagram and 100, or
best performance is at the outer edge.
0
50
100Productivity
Profitability
Productivity ofLabour
Market Orientation
Economic Viability
Economic Sustainability
Dairy Cattle Sheep Tillage

12
In Table 5 we see that on average dairy farms emitted 434 tonnes of carbon dioxide
equivalent (CO2-eq), while cattle farms on average emitted 143 tonnes of CO2-eq per
farm. The average sheep farm emitted 118 tonnes of CO2-eq in 2012 and the tillage
farm emissions average 139 tonnes of CO2-eq. It is evident that the emissions from
electricity and fuel account for only a small proportion of overall farm GHG emissions.
Table 5. Environmental sustainability indicators (2012) Farm
system
GHG emissions per
farm
(tonnes CO2-eq)
GHG emissions
per kg of output
Nitrogen balance
per ha
Fuel and electricity
per kg of output
Mean (SD) Mean (SD) Mean (SD) Mean (SD)
Dairy 434 (246)
0.77 (0.12) 146 (63) 0.06 (0.02)
Cattle 143 (111)
12.3 (5.49) 54 (40) 0.66 (0.40)
Sheep 118 ( 95)
7.3 (3.51) 39.9 (28) 0.44 (0.25)
Tillage7 139 (144)
- 53 (36) -
Environmental indicators cannot be divorced from the economic performance of the
farm. As previously stated, inefficient use of nutrients on farms has significant
economic implications for farmers as well as for the wider environment. Measuring
emissions per unit product allows for the incorporation of production efficiencies in
indicator development. On this basis, Tables 6 and 7 present the emissions per kg
product (milk, beef and lamb) and the nitrogen balance indicators (kg N surplus/ha)
relative to the economic performance (on the basis of gross margin)8 of the average of
the top, middle and bottom one thirds of dairy, cattle and sheep farms.
Table 6. GHG emissions per unit product on the basis of economic performance
Average Top Middle Bottom
Dairy (CO2-Eq kg/kg of milk) 0.77 0.71 0.75 0.85
Cattle (CO2-Eq kg/kg of beef) 12.3 11.32 12.41 13.33
Sheep (CO2-Eq kg/kg of lamb) 7.3 5.8 7.16 9.02
Table 6 shows the same trend across dairy, cattle and sheep farms. There is a large
variation between the top and bottom performers, with the top economic performers
producing the lowest emissions and the bottom performing group producing the highest
emissions. These results show clearly the negative correlation between emissions and
economic performance.
In Table 7, there is evidence of considerable variation between the top and bottom
economic performers in the dairy system. The top performing dairy farms produce a
considerably larger surplus of nitrogen on average (174.6 kg N/ha) than the less
economic farms (118.5 kg N/ha). However these top performing dairy farms produce
7Per unit product indicators for tillage crops not included due to data limitations

13
more milk per kg of nitrogen surplus. The same trend is evident in the cattle and sheep
systems, with top performers producing more surplus nitrogen, although with less
variation between surplus nitrogen produced by the top and bottom performers. Sheep
farmers on average have smaller nitrogen surpluses, particularly in the bottom group in
which some of the more extensive sheep farms have a nitrogen surplus close to zero.
The nitrogen balance results for tillage farms are more homogeneous than the results
for livestock farms. There is very little variation in the mean values for the top, middle
and bottom groups, varying from approximately 54.5 to 51.4 kg per hectare.
Table 7. Nitrogen balance per hectare (kg of N surplus/ha) on the basis of
economic performance
Average Top Middle Bottom
Dairy (surplus N/ha) 146 174.6 145.1 118.5
Cattle (surplus N/ha) 54 71.03 44.4 49.04
Sheep (surplus N/ha) 39.9 49.6 41 27.6
Tillage (surplus N/ha) 53 54.5 53.5 51.4
These results are consistent with the more intensive production on these farms as the
top performing farms produce relatively more product per kg of nitrogen surplus.
However, it is indicative of greater risk of nutrient (N) losses to water as a result of the
higher N surplus on the more intensive, economically efficient farms. It is also
indicative of the positive correlation between intensity of production and risk to water
quality.
From an environmental efficiency perspective, it is not very effective to compare
different farm systems on an emissions per product basis, when the farm systems are
producing very different products, i.e. kilograms of beef versus kilograms of milk.
Here, environmental performance is examined within the farm system and farms are
compared on the basis of their economic performance. Figure 2 shows the
environmental performance of all farms on the basis of their economic performance
within their own farm system.
Figure 2: Environmental sustainability spider diagram
0
50
100GHG per product
Energy GHG perproduct
N balance
Environmental Sustainability
Top Middle Bottom

14
In examining GHG emissions produced per unit of product, a correlation between
economic and environmental performance is evident, i.e. the top performing farms
economically emit less GHG emissions per kilogram of product than the bottom farms.
The variation in performance is even more pronounced when GHG emissions from
electricity and fuel are also considered. In their analysis, Hennessy et al. (2013b) found
that across all farm systems, the top economic performing farms also tend to use energy
and fuel more efficiently and hence have lower emissions per product. Only nitrogen
balance per hectare is negatively correlated with economic performance. Along this
criterion the bottom farms perform best by having the lowest nitrogen surplus per
hectare.
Results – social sustainability
In relation to social sustainability, dairy farming tends to be quite labour intensive. The
work/life balance is represented by the number of hours worked by the typical farm
operator in an average week, which is on average 47 hours on dairy farms, while cattle
and sheep farmers work on average 32 and 34 hours per week respectively and tillage
farmers have the lowest average working hours at just 30 hours per week.
In relation to farm household vulnerability the lowest proportion of vulnerable
households are in the dairy system (15 percent) and tillage (18 percent) meaning that
the farm business is not viable and there is no other source of income in the household.
However, the proportion of vulnerable households is much higher for the cattle and
sheep systems with over 40 percent of cattle and over 42 percent of sheep farms classed
as economically vulnerable.
A similar trend is displayed in terms of the age profile of farmers. Where the farmer is
nearing retirement but there is no obvious successor, the demography of farms is
considered to be poor. This is the case on just 10 percent of dairy farms and on 20
percent of tillage farms, but there is evidence of poor demography on 28 percent of
cattle farms and 25 percent of sheep farms.
Figure 3: Social sustainability spider diagram
0
50
100Vulnerable
Age Profile
IsolationEducation
Work/life
Social Sustainability
Dairy Cattle Sheep Tillage

15
The social sustainability indicators for the farm systems are presented in Figure 3.
While dairy and tillage farms perform better than the dry-stock systems along the social
indicators, the differences between the systems are less pronounced than for the
economic indicators. In particular, with regard to the demographic variables, high age
profile and isolation tend to vary only slightly across the systems. Dairy and tillage
farmers in Ireland also tend to be better educated than other farmers. The poor
performance along the education indicator is likely to be a scaling issue (education is
measured as a count variable with values from 1 to 5).
Results – innovation
The indicators of innovation are farm specific and as such are not comparable across
farm systems. Figure 4 shows adoption rates on dairy farms across all three selected
practices are correlated with economic performance, although it is interesting that there
is a relatively high rate of adoption of early slurry spreading, as this is a practice which
is cost neutral to the farmer but gives both economic and environmental dividends and
has been the focus of recent knowledge transfer programmes.
Figure 4: Adoption of Innovative Practices on Dairy Farms
Three innovative farm practices appropriate to both cattle and sheep farms were
analysed. With regard to participation in the Beef and Sheep Quality Assurance
Schemes, approximately 42 percent of all cattle and 47 percent of sheep farms
participate. As is evident from Figures 5 and 6, participation tends to be highly
correlated with economic performance. The other practices include soil testing and
reseeding some grassland in the last 3 years.
Figures 5 and 6: Adoption of Innovative Practices on cattle and sheep farms (2012)
0
20
40
60
80
All Top Middle Bottom
% o
f fa
rms
Innovative Practices: Dairy Farms
Dis'n Group Milk Rec'g Early Slurry App'
0
20
40
60
80
All Top Middle Bottom
% o
f fa
rms
Innovative Practices: Cattle Farms
Soil Testing Quality Ass' Reseeding
0
20
40
60
80
All Top Middle Bottom
Innovative Practices: Sheep Farms
Soil testing Quality Ass' Reseeding

16
Adoption of these practices is also correlated with economic performance, with the top
group having greater rates of adoption for all three practices.
Forward contracting has emerged as a relatively new and innovative means of
managing price risk. Price volatility has been a major issue confronting tillage farms in
the last number of years. As can be seen in Figure 7 an average of approximately 30
percent of tillage farms entered a forward contract in 2012. It is interesting that there is
no strong relationship between the use of forward contracting and the economic
performance of the farm. In fact the use of contracting is lowest for the top group. It
should be borne in mind that in a given year, farmers will win or lose by entering a
forward contract depending on the difference between the contract price offered, which
is determined by the futures price, and the actual market price. Hence entering a
forward contract can in itself determine the economic performance of the farm. The
other farm practices considered were the use of a computer for farm business purposes
and soil testing. Soil testing is highly positively correlated with economic performance,
but the relationship between economic performance and IT usage is less pronounced.
Figure 7: Adoption of Innovative Practices on tillage farms (2012)
Discussion and conclusions
In assessing the sustainability of Irish farms across the selected indicators, we must
recognise that the indicators may be in conflict with each other. The fact that a farm
may be socially unsustainable (e.g. lack of successor) may actually benefit the
economic sustainability of that system over the longer term if it leads to farm
consolidation. There is also potential for conflict between economic and environmental
objectives as although more intensive production tends to generate less emissions on a
unit product basis it still produces more emissions overall.
The overall analysis shows that dairy farms, followed by tillage farms, tend to be the
most economically sustainable farm systems. The results reveal the wide variation in
environmental performance along all of the dimensions measured. While it is
evident that the intensive dairy systems produce more GHG emissions than other
less intensive systems, the consistent pattern running through all of the farm
systems is the correlation between economic performance and environmental
sustainability. In relation to GHG emissions, the top economically performing farms
0
20
40
60
80
All Top Middle Bottom
% o
f fa
rms
Innovative Practices: Tillage Farms
Fwd Contracts IT Usage Soil Testing

17
tend to be the best performing farms on this aspect of environmental sustainability,
in other words, they emit relatively less GHG’s per unit of product produced. In this
case, increases in efficiency and productivity generate increased profits, without
negative environmental consequences. Herrero et al. (2013) refer to this as a “positive
and simultaneously perverse impact” as farmers may be incentivised to increase herd
size, rather than produce more with fewer, more productive animals. In relation to risk
to water quality, the top performing economic farms tend to produce a greater nitrogen
surplus. However the top performers economically produce more product (e.g. milk)
per kg of N surplus. These intensive farmers may face the greatest challenge in
expanding production without increasing the risk to water quality.
An interesting conclusion of this analysis is that moderately intensive systems (middle
one-third in terms of gross margin) appear to be more sustainable than low intensive
systems. This may call into question the traditional view that low intensity systems of
production have the least negative impact on the environment. Given the need to
increase food production it may be desirable to encourage low intensity production to
become more intensive since this may improve both the environmental and economic
sustainability of such systems, while also increasing their volume of output. This may
include changing systems, for example from a dry-stock to a dairy system.
Dairy and tillage farms tend to be the most sustainable farms from a social
perspective but the differences across systems are not as pronounced as for the
economic indicators. Demography in particular tends to be correlated with economic
performance, whereby the better performing farms from an economic perspective also
tend to have a younger age profile. The adoption of innovative practices was also
shown to be highly correlated with farm economic performance across all systems.
Wider adoption of innovative practices which increase the efficiency of resource use
(land, animals, nutrients, human capital and technology) have the potential for a “win-
win” outcome by not only reducing the impact on the environment, but also reducing
production costs.
As our understanding of the interactions between the intensity of farming, it’s impact
on the environment, and the role of innovation in this relationship deepens, new and
more sophisticated indicators will be developed. Indicator development is an iterative
process as, particularly in the area of environmental sustainability, the development of
novel scientific methodologies will necessitate further data collection. As such,
indicator design will evolve over time and will benefit from on-going validation and
expert consultation. One of the greatest advantages of sustainability indicators is that
they can be used to chart progress over time, however it is likely that this will
necessitate the retrospective recalibration of indicators as additional data and more
sophisticated methodologies become available. It is important to stress that the true
value of sustainability indicators lies not in the interpretation of the absolute values in a
given time period but in the evaluation of trends that are of concern to stakeholders
generally and policy makers in particular. Indeed as environmental policy targets are
set out, there will also be better insight into future policy analysis requirements. As the
science and policies evolve, so too will the collection of data and the selection of
indicators.

18
References
Breen, J., Donnellan, T. and Westhoff, P. (2010). ‘Food for thought: EU climate change policy presents new challenges for
agriculture’, EuroChoices 9 (3), 24–9.
Buckley, C., Murphy, P., Wall., D., 2013. Farm-gate N and P balances and use efficiencies across specialist dairy farms in the
Republic Ireland. REDP Working Paper Series 13-WP-RE-02 Available: http://www.agresearch.teagasc.ie/rerc/downloads
workingpapers/13wpre02.pdf
DAFF (2010). Food Harvest 2020, A vision for Irish-agri-food and fisheries. Department of Agriculture, Fisheries and
Food, Dublin, Ireland.
Dillon, E. J., Hennessy, T., Buckley, C., Dillon, E., Donnellan, T., Hanrahan, K., Moran, B. and Ryan, M. (2014). The
sustainable intensification of the Irish dairy sector. Paper prepared for presentation at the 88th Annual Conference of the
Agricultural Economics Society, AgroParisTech, Paris, France.
Dillon, E.J., Hennessy, T., Hynes, S., Garnache, C. and Commins, V. (2007) Measuring the Sustianability of Irish
Agriculture. Rural Economy Working Paper Series: 07-WP-RE-01. Teagasc.
Dillon, E.J., Hennessy, T. and Hynes, S. (2010) Assessing the sustainability of Irish Agriculture. International Journal of
Agricultural Sustainability 8(3) 2010:131-147.
Donnellan, T. (2014) Climate change and the food chain. RIA Climate Change Sciences Committee. Issue 12 2014. Royal
Irish Academy:Dublin.
EC (2012) Innovating for Sustainable Growth: A Bioeconomy for Europe. Communication form the Commission to the
European Parliament, the Council, the European Economic and Social Committeed of the Regions. Innovating for
Sustainable Growth: A Bioeconomy for Europe {SWD(2012) 11 final}
EPA (2009) AG-BIOTA – Monitoring, Functional Significance and Management for the Maintenance and Economic
Utilisation of Biodiversity in the Intensively Farmed Landscape. (2001-CD/B1-M1) STRIVE Report.
EPA (2013) https://www.epa.ie/pubs/reports/air/airemissions/ Ire_GHG_Emissions_1990_2012_handout.pdf
Frater, P. and Franks, J. (2013) Measuring agricultural sustainability at the farm-level: A pragmatic approach. International
Journal of Agricultural Management, Vol. 2, Issue 4.
FAO, (2003). Compendium of Agricultural – Environmental Indicators 1989-91 to 2000. Statistics Analysis Service,
Statistics Division, Food and Agriculture Organisation of the United Nations, Rome (November, 2003).
FAO (2009). How to Feed the World in 2050. Food and Agriculture Organisation of the United Nations
http://www.fao.org/fileadmin/templates/wsfs/docs/expert_paper /How_to_Feed_the_World_in_2050.pdf
Frawley, J., P. Commins, S. Scott and F. Trace (2000) Low Income Farm Households: Incidence, Characteristics and
Policies. Combat Poverty Agency Research Series, Oak Tree Press, Dublin.
Gómez-Limón, J. A., Riesgo, L. (2009) Alternative approaches to the construction of a composite indicator of agricultural
sustainability. An application to irrigated agriculture in the Duero basin in Spain. Journal of Environmental Management,
90, 3345-3362.
Gómez-Limón, J. A., Sanchez-Fernandez, G. (2010) Empirical evaluation of agricultural sustainability using composite
indicators. Ecological Economics, 69, 1062-1075.
Government of Ireland (2012) Delivering our Green Potential. Government Policy Statement on growth and employment in
the green economy. Government of Ireland.
Hennessy, T., Moran, B., Kinsella, A. and Quinlan, G. (2013a) Teagasc National Farm Survey Results 2012. Teagasc, Oak
Park.
Hennessy, T., Buckley, C., Dillon, E., Donnellan, T., Hanrahan, K., Moran, B. and Ryan, M. (2013b). Measuring Farm
Level Sustainability with the Teagasc National Farm Survey. Teagasc, Athenry, Co. Galway.
Herrero, M. and Thornton, P.K. (2013) Livestock and global change: emerging issues for sustainable food systems.
Proceedings of the National Academy of Sciences of the United States of America. Vol. 110. No. 52.

19
Leeuwis, C. (2004) Communication for Rural Innovation: Rethinking Agricultural Extension. Oxford: Blackwell Science.
Leip, A., Weiss, F., Wassenaar, T., Perez, I., Fellmann, T., Loudjani, P., Tubiello, F., Grandgirard, D., Monni, S. and Biala,
K., (2010). Evaluation of the livestock sector’s contribution to the EU greenhouse gas emissions (GGELS): Final report.
European Commission Joint Research Centre.
OECD and Eurostat (2005) Oslo Manual: The Measurement of Scientific and Technological Activities – Proposed
Guidelines for Collecting and Interpreting Technological Innovation Data. Joint publication: OECD and Eurostat. Third
Edition.
OECD (2008), Handbook on Constructing Composite Indicators: Methodology and User Guide. Organisation for Economic
Co-operation and Development. Paris.
Reig-Martinez, E., Gómez-Limón, J. A., Picazo-Tadeo, A. J. (2011) Ranking farms with a composite indicator of
sustainability. Agricultural Economics, 42(4), 2011.
Available : http://decigarrasyhormigas.files.wordpress.com/2013/01/artc3adculo-de-reig-martc3adnez-et-al-2011.pdf
Rigby, D., Woodhouse, P., Young, T., Burton, M., 2001, ‘Constructing a farm level indicator of sustainable agricultural
practise’, Ecological Economics 39, 463–478.
Schroder, J. J., Scholefield, D., Cabral, F. & Hofman, G., 2004. The effects of nutrient losses from agriculture on ground and
surface water quality: the position of science in developing indicators for regulation. European Journal of Agronomy, 7, 15-23.
UN (1987) Report of the World Commission on Environment and Development Our Common Future. United Nations.