Communication indicators, I: communication indicators...
73
T i . . ,* Communication and society 3 Communication indicators I. Communicationindicators and indicatorsof socio-economic development Summary of a study made by Rita Cruise O’Brien Ellen Cooper Brian Perkes Henry Lucas
Transcript of Communication indicators, I: communication indicators...

T i . .
,*
Communication and society 3
Communication indicators
I. Communication indicators and indicators of socio-economic development
Summary of a study made by Rita Cruise O’Brien Ellen Cooper Brian Perkes Henry Lucas

COMMUNICATION INDICATORS
I. COMMUNICATION INDICATORS AND INDICATORS OF SOCIO-ECONOMIC DEVELOPMENT
Summary of a study made by:
Rita Louise O'Brien Ellen Cooper Brian Perkes Henry Lucas
-..- --.-- -.-

cc. 79/ws/134 Paris, 20.12.79 Orfginal.: English

PART I:
PART II:
,
PART III:
PART IV:
PARTV;
PARTVI:
PARTVII:
TABLE OF CONTENTS
COMMUNICATION AND SCCIAL INDICATORS
Introduution The Use of Social Indicators and the UNRISD Data Bank 1970 The Preliminary Selection of Variables (1970-1960) - the Data
COMMUNICATIONS AND GNP
The Problem of Causality between Communications and GNP The Relationship Between Communioations and GNP: The
Commindex Analysis in GNP deciles
"DEVELOPMENT PATTERNS" AND COMMUNICATION
Definition and Analysis of llDevelopment Patterns11 Countries Between $100 and $1,000 GNP Per Capita: Analysis
of Communication Indioators
COMPARATIVE ANALYSIS OF COMMUNICATION AND CTHER DEVELOPMENT INDICATORS
The selection of Core Indicators: Methodology Commindex and Core Indicators, 1970, Ranks, Correlations and
Scatter Diagrams Individual Communioation Indicators and Core Indicators
1970, in Separate GNP Groups Surmnary of Analysis in Five GNP Groups
INTER-TEMPORAL COMPARISONS 19604970
Indices of Growth of Communi cation by GNP Groups Growth of Communication Indicators and other indicators of
Development (196001970) Conclusion
TIME; SERIES (19604975)
Choice of Indioators Some Problems of Analysis with Scattergram Codes Country Profiles based on twelve indicators
INCOME DISTRIBUTION AND ECONOMIC DUALISM
Income distribution and Comications Methods of Ranking Methods of Correlation with literacy and Communication
. PART VIII: INVESTMENT AND PRODUCTION IN MASS COMMUNICATION
PART IX: CONCLUSION
Communication and other Social Indicators: The problems for . Planning Limitations of this type of Study Implications for Data Collection and Future Studies
APPENDIXA
APPENDMB
Pas 3
3 10 12
17
17
18 19 24
24
26
28
28
31
35 s
43 44
45 48
49
49 50 50
52
52 54
55
57
2: 59
60
70

-2-
PREFACE
In February 1976, Unesco convened its first consultation specifiually devoted to the subJect of communication indicators. Staff members from the Institute of Development Studies of the University of Sussex (U.K.) and from the IF0 Institute of Economic Research (Federal Republic of Germany) took pert in the uonsultation. As a result of the meeting, research contracts were established with the two institutions.
The study undertaken by the Sussex group was submitted to Unesco two years later under the title l~Comnunication Indicators and Indicators of Socio-Economio Develop- ment, 1$O-197011. Meanwhile, the IF0 group submitted a national case study "One Hundred Years of Mass Communication in Germany".
While the first study involved a careful process of data selection to allow for cross-national comparability among the countries included in the report, the German study was based entirely on a large amount of national data which enabled the researchers to undertake a very detailed analysis.
Although the two studies have used quantitative indicators, it does not necessarily mesn that cormnunication indiuators need only be quantitative. The studies are exploratory in nature and are both obviously limited to an analysis of existing and available data.
A second consultation on Communication Indicators held in Paris from 11 to 15 December lg‘j'6 discussed the various approaches to the use of indicators in studying communication phenomena generally and with particular reference to their role in the formulation of national communication policies, thereby providing Unesoo with some guidelines to follow in its future programming; to identify some of the main methodological problems to be taken into account by Unesco in commissioning future studies in the field of communication development; describe the scope and limita- tions of cross-nation&L comparability of communication systems through the use of indicators; identify the most significant parts of the two studies and to recommend future action in the field of communication indicators with special emphasis on the role of Unesco in assisting Member States in their efforts at communication research and policy formulation.
It is with satisfaction that we are able to publish summaries of these two interesting studies in the present series of Communication and Society.
This is the summary version of the study: Wommunication Indicators and Indicators of Socio-Economic Development?. The original study was written by: Rita Cruise O'Brien, Ellen Cooper, Brian Perkes and Henry Lucas, under a Unesco contract in pursuance of a contract established with the Institute of Development Studies at the University of Sussex, Brighton.
The study is not an official document. The views stated therein are the author's and do not necessarily represent the official views of Unesco.

-3-
PART I
COMMUNICATION AND SOCIAL INTXCATORS
Introduction
Changes in developing countries in the decade 1960-1970 have given rise to a number of important characteristics which have dampened the optimism within which studies on the relationship of communication and development were undertaken fffteen years ago. Among these processes, population growth has tended to mitigate economic gains measured particularly in terms of growth; there has been a worsening of income distribution in many countries acoeeding to the initial stages of economic growth; poor nations have been falling behind and are increasingly dominated by the industrialised world. Thus, while there have been marked strides in terms of growth, this has not lead to integrated development between the sectors of the economies in poor countries, or the provision of sufficient employment, or a move towards a reasonably equitable distribution of gains, as an eradication of poverty. The growth of communication in developing countries must be set within some of these negative trends.
In this same period, there has been significant expansion in both telecommunica- tions end mass communications. The extent to which communications reflect and even perhaps reinforce inequalities between rich and poor countries and inequalities within poor countries ought to be considered. Taking as given nonetheless, that communica- tions in principle can play a central role in rectifying some of these problems, and that for optimal effectiveness, there is a need to plan resources in relation to other sectors and to overall development planning, this initial. study has been undertaken.
This study may only be seen as a modest contribution in the form of a compendium of data or handbook considering various types of analysis on existing data. Each of the chapters considers several different types of statistical analysis which order global data on the growth of mass communications in relation to other socio-economic indicators of development in the period 1960-1975. In a certain sense the value of this study is to present the data in such a way as to clear the road for future studies which ought to be built more solidly on: a) the collection of disaggregate data to deal with micro or comparative features of communications growth, or b) the formulation of hypotheses about the relationship between communications and other sectors. From the state of the present available data (using published, mainly UN sources) it was very difficult to move towards hypothesis or model building which would help explain the dynamics of many of the processes documented here.
This study starts from a limited base in that it cannot answer questions about the distribution of mass communications within countries, the access to the media, nor can it distinguish between types and qualities of programmes. It cannot assess the differential impact of radio , newspaper circulation or television. The available data base compels it to operate principally at the national level, to explore the range of differences among countries according to the growth of oommunications and other features of economic and social development. The theoretical literature on the growth of communications and development (or modernisation as it has often been termed) offers few leads. While a certain amount of disenchantment with the optimistic views on the contribution of communication to development has recently
-- ---

-4-
become apparent, (1) such reconsiderations have yet to link the actual growth and use of communications to apparent trends of distribution or features of "negative development".
Literacy, Urbanisation and Communications
One of the features which has been considered in the communications growth literature in statistica terms is based on now almost classic early assumptions made by Daniel Lerner in 1964 t 2, about the relationship of communication growth to literacy, education and urbanisation. A number of scholars have considered these hypotheses subsequently, notably Schramm and Ruggels (x967),(3) and others, but the comparison of cross sectional data and time series data based on these relationships has proven inconclusive in trying to assess a causal relationship among these indi- cators, as summarised in Fry (1973)(4). Improvements in technology and therefore reduction in price has meant in empirical terms that radios could be much more widely available ,to sections of the population who were neither resident in urban areas, nor literate. It is common knowledge that radio is a much more important instrument of mass communication in almost all developing countries, with due consideration to the phenomenal growth and importance of television in Latin America. The hypotheses raised in this literature have not been pursued in this study largely because the statistical base on which the indicator for radios per 1,000 population is formu- lated is license fees, and this recording mechanism at the national level is wholly inadequate to assess the real distribution of radio receivers within countries.
Diffusion and Political Participation
Other theoretical studies which have tried to link the growth of communications to development have also failed to establish a causal relationship in this process. A number of studies, particularly those of Everett Rogers have concentrated on the diffusion aspects of communications best monitored at the local level or in indi- vidual terms. (5) This work is related to a body of development literature which attempts to monitor individual receptiveness to modernisation.(G) There are a number of other studies which have attempted to link the growth of communications to the political mobilisation. But as the researchers of this study choose to work from a quantitative base, they considered so-called political indicators, recorded in World Handbook of Social and Political Indicators,(T) of rather dubious value, largely because the enormous qualitative difference of what is called political participation in individual countries, lends itself unhappily to quantification, and where quantification is imposed it is usually fairly subjective. Studies on the relationship of growth of mass media to participation or democratic performance have not been proven. Overconcern for this aspect has led scholars to ignore other
(1)
(2)
(3)
(4)
(5)
(6)
(7)
Wilbur Schratnm and Daniel Lerner eds. Communication and Change: the last Ten Years and the Next, East-West Centre University of Hawaii, 1976.
The Passing of Traditional Society, Glencoe III, the Free Press, 1964.
"How Mass Media Systems Grow" in D. Lerner & W. Schramm, eds. Communications and Change, East-West Centre Press, 1967
"Communication and Development", in de Sola Pool et al. Handbook of Communica- tions, Chicago: Rand McNally, 1973, p. 416 With Lynne Svenning (1969), Modernisation Among Peasants: The Impact of Commu- nication, N.V. Holt Rinehart and Winston, 1969, with F. Shoemakar (1971) Communication of Innovations: A Cross Cultural Approach
D.C. McClelland et al. Motivating Economic Achievement, N.Y. Free Press, 1969
Charles Lewes Taylor and Michael C. Hudson, Yale University Press 1972

-5 -
indicators which may be relevant from planning purposes.(l) It was observed in the course of the study that in certain cases socialist countries, whether in Eastern Europe or the developing world often have a more significant growth of communications relative to their GNP, but this can hardly be conclusive. It is much more important to rate the quality and content of media in countries like Cuba to planned objectives than to note that it rates slightly higher in relation to other indicators.
The lack of Theoretical Models
This rather brief summary of work done in the field is intended to indicate that when this study was undertaken there was very little theoretical base from which models for testing could be established. A few studies have attempted to link the growth of GNP per capita and primary education or urbanisation and GNP to literacy communications and other indicators.(2) All that can be concluded from these attempts is that growth of GNP is strongly related to both literacy and urbanisation, as is mass communications but at differing rates. This has been confirmed in the study's detailed investigations. There is a central problem of multi-colliniarity in regression which affects the analysis of the growth of socio-economic indicators and those of communications growth. For this reason the use of regression analysis was rejected in most of the cross sectional data, and the use of simpler more usable presentation in country profiles, scatters and bar charts to indicate comparative features was preferred. When the data base of communications indicators improves, it may be possible to combine cross-section and time series data so that long term and short term adjustments to exogenous variables can be integrated.
The Inductive Method
In the absence of theoretical models, a separate course of inductive enquiry working with various configurations of the quantitative data and applying to it various tests in order to raise questions which might lead to the formulation of hypotheses was chosen. This type of work has been done by Kusnets for example in a series of articles published in Economic Development and Cultural Change (1956-1967) in which he considered the intercountry variation in the principal components of GNP and compared these results to various historical changes. Considering that*the wealth of particular countries, expressed in its GNP would be of central importance to the growth of communications, various tests were done around GNP groupings and growth over time. Other indicators were then considered in relationship to commu- nications in order to try to assess whether or not there was at least statistically a "stronger relationship" between them than one could assume because of the strong influence of GNP on each of them. This type of global cross sectional analysis has its limitations. In the absence of significant models for studying the relationship between communications and other feature of socio-economic development, the hypo- thesis testing process in orthodox terms is not possible.
The Data Base Problems
The poor quality of statistical information in developing countries provides problems for cross sectional comparisons of precisely the countries in which one is most interested. First, there are considerable gaps in the data especially for countries in the lower GNP groups. Second, the quality of data which exists is questionable since the collection and enumeration techniques in most developing
(1) For example, D.J. McCrone and C.F. Cnudde, "Towards Communication Theory of Democratic Political Development: A Causal Model American Political Science Review, 61.,March, 1967.
(2) W. Schrsmm and A. Ruggels, op. cit.

-6 -
countries are rudimentary. There are certain specific problems with the communica- tions indicators themselves, their reliability and their method of collection. Some pilot studies ought to be done perhaps to try to consider a more adequate form of data collection than license fees , particularly for radios (which is apparently already under discussion).(l) Changing definitions of certain indicators like "newspapers of daily general interest" and their variation of definition from one country to another make their use for comparative purposes difficult.
The problems of reliability and comparability encountered by the researchers are fully documented in the text and are only brought out here to emphasise in general terms the limitations of this type of study. The conclusion to the Report indicates the kind of data collection in the future which would make a much more positive link between quantitative assessments of growth of communications and planning.
Methods of Analysis: An Introductory Note
While all the communications indicators, except radios per thousand population tend to move with GNP, they do not do so at the same rate in all countries or in groups of countries with similar income. In the report a comparison of individual communication indicators with GNP is provided as well as a composite communications indicator ("commindex") derived from principal component analysis. The inclusive- ness and exclusiveness of that composite indicator are explained in the text. Countries are grouped according to their GNP and from these major groups country profiles have been established to facilitate the comparison of the growth of commu- nications with other key indicators. As will subsequently be explained the data base for these comparisons were the Data Banks for 1960 and 1970 established by the United Nations Research Institute for Social Development (UNRISD). A number of gaps were filled in and data updated (particularly on literacy) by the use of the publication of the World Bank, World Tables, 1976, in the early part of 1977. The researchers of this study choose, however, not to generate data where none were available, through statistical techniques. The data gaps in the UNRISD Data Bank were considerable (about 504% of the 112 x 121 Data Matrix for 1970) hence distor- tions and biases would have resulted from an analysis based on such a large number of artificially-generated observations.
The methods of analysis, levels of significance and limitations are explained in the text. A number of different methods were used including correlations, principal component analysis, non-parametric ranking tests and regressions. None of these tools of analysis took the researchers too far from the data base itself as the lack of a complete and representative matrix excluded the use of more sophisticated statistical techniques. The aim of the researchers was to use methods of analysis appropriate to a clear presentation of the data, suggestive of hypotheses which might be considered for further work rather than to try to move to considera- tions of causality, which they felt to be premature at such a global level. This is especially so because of the lack of theoretical models in the communications literature and the explained weaknesses in the data base. At this point the use of more sophisticated methods would at best be an interesting intellectual exercise.
(1) Country case studies like the one recently prepared on the growth of communioa- tions in Finland by Unesco provide an excellent data source as well as making practical or methodological points about data collection. Investment data on communications is notably absent from most National Income statistics or not sufficiently disaggregate to be used separately.

-7 -
GNP as a Central Variable
The researchers found a recent publication of particular assistance in the cross- sectional analysis of all countries, ment,(l) l%O-1970 (1975),
H. Chenery and M. Syrquin, Patterns of Develop- especially for their valuable consideration that 75-80$
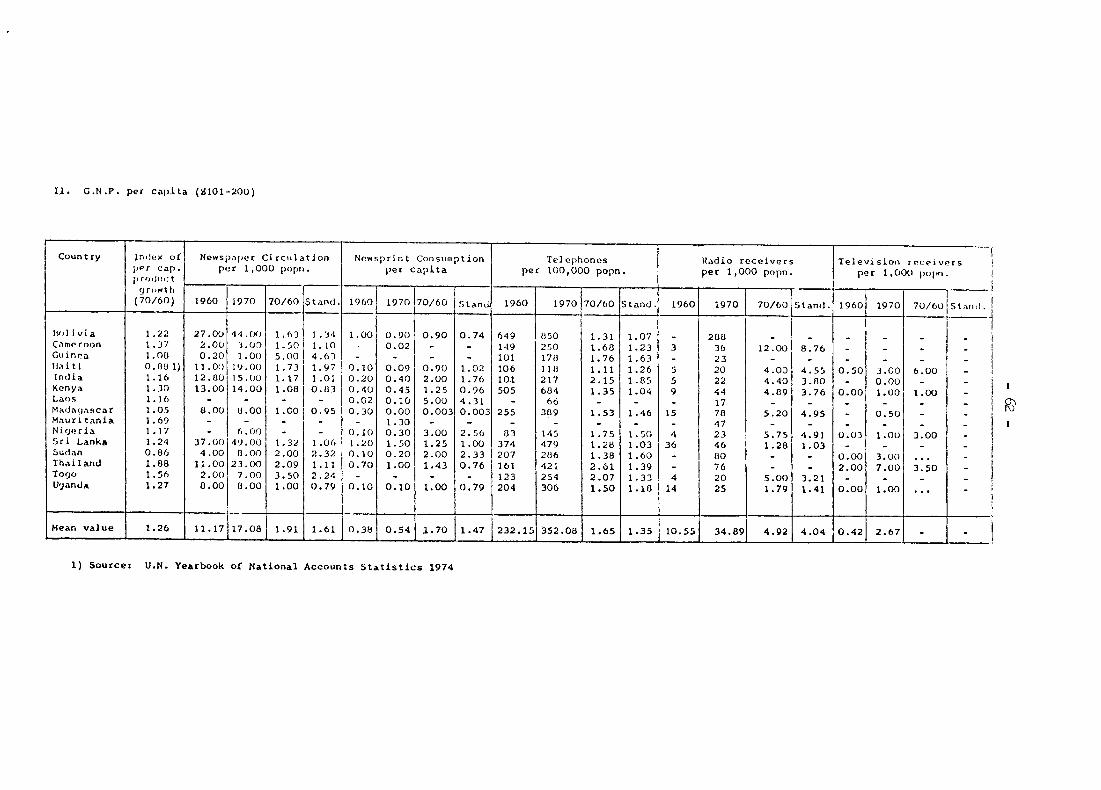
of the structural changes associated with development occur among countries with an annual GNP per capita of $100 - $1,000. They therefore isolated this group of countries for a series of tests on their GNP growth, growth in communications in comparison with other indicators. For planning purposes, in particular, it may be very useful to be able to denote at which level of GNP the greatest changes occur in education or industrialisation, for example, in relation to communications. For ten development processes analysed, the authors note that the midpoint of most of the changes come at about $300 and that the changes are 90$ complete at $900 or 1,000.(2) Using the same group of countries they considered in a series of scatter diagrams the relationship of the "commindex" to other core indicators for 1970, as well as a series of other tests which focus on the group of countries in this GNP category. Given the mean for all the countries in this group, the researchers were able to examine whether countries were showing an early or late accumulation of mass communications. Such tests can only be suggestive, as they amalgamate a great deal of data.
Developed and Developing Countries: Some Differences
One of the most useful features of isolating countries with $100 - $1,000 GNP for analysis was that countries of over $1,000 GNP seem to illustrate certain features of media consumption which are totally different from those which are in the early stages of accumulation and allocation in economic terms. That is, in many developing countries where literacy rates remain low one can therefore expect newspaper circu- lation to be much less important than the electronic media. And although many developing countries have acquired television, the cost of receivers is a considerable luxury in relation to per capita income and reserved usually for comparatively wealthy urban dwellers. The more industrialised the country, the richer is the diet in terms of multi-media access at least in principle, which is not at all the case for the poorer countries. One interesting feature which seems to be apparent in the rich countries is the substitution effect of television for newspapers, while news- print consumption figures remain high, indicating a greater variety of weeklies or other periodicals which use newsprint. This merely outlines a number of considera- tions which are apparent in more detail in the text, but which justify the isolation of a certain group of developing countries ($100 - $1,000 GNP per capita) for particular analysis.
GNP and Communications Indicators
While noting that the growth of radios per thousand population does not appear to be affected by the growth of GNP as are other indicators, this may be equally a feature of the income inelasticity of demand for radios which are available to people with fairly limited income, as well as a weak data base. This is hardly the case with television, which does tend to respond more closely to the rise in GNP, although (as indicated in the body of the Report on the deciles of GNP)(J) there appears to
(1) Used as the basis of Part 111,
(2) See H. Chenery and H. Syrquin esp. Chapter One. The ten structural characteri- stics analysed were investment, government revenue, education, structure of domestic demand, structure of production, structure of trade, labour allocation, urbanisation, demographic transition, income distribution.
(3) See Part II.

-8 -
be a levelling off of demand for television after the initial acquisition of the capability perhaps because of the cost of the receivers relative to per capita income . That is, there is a sharp rise in the number of receivers just after a television system is installed and then the income constraint begins to level off demand.
Growth in television is most difficult to compare between 1960 and 1970 since most African and Asian countries acquired television after 1960, or only had a very small number of sets in the early part of the decade. Newspaper consumption and circulation appear to be more variable in their relation to GNP than telephones and televisions. For the composite index of communications the researchers preferred to use newsprint consumption, more reliably collected with the trade portion of national income data than the problematic definition of newspapers of 'daily general interest" on which the circulation figures are based. In order to assess the relationship between newsprint production and consumption, a number of charts of countries of similar GNP which are producers and non-producers are provided.(l) This did not offer any significant indication of producer advantage, as the structure of demand usually does not bear much relationship to resource endowment.
Telecommunications
Telecommunications is an essential feature of industrialisation and it has been noted that there is a strong positive relationship between GNP and the growth of telephones. This indicator was included in the study's communications index. It was also noted that in most of the developing countries, telephones per thousand population often grows much more rapidly than GNP. At the present stage of data collection, it is somewhat easier to relate telecommunications to planning because of the availability of investment data for this sector on a country basis which is totally absent for mass communications.(2) In one section of the text tables on telecommunications investment for a series of countries as comparative data with other aspects of growth in these countries are included, but one is a long way from producing the kinds of studies available chiefly through the International Telecommunications Union for member states , precise1 range of the data available in telecommunications.(3 3
because of the quality and
Cross Sectional Analysis
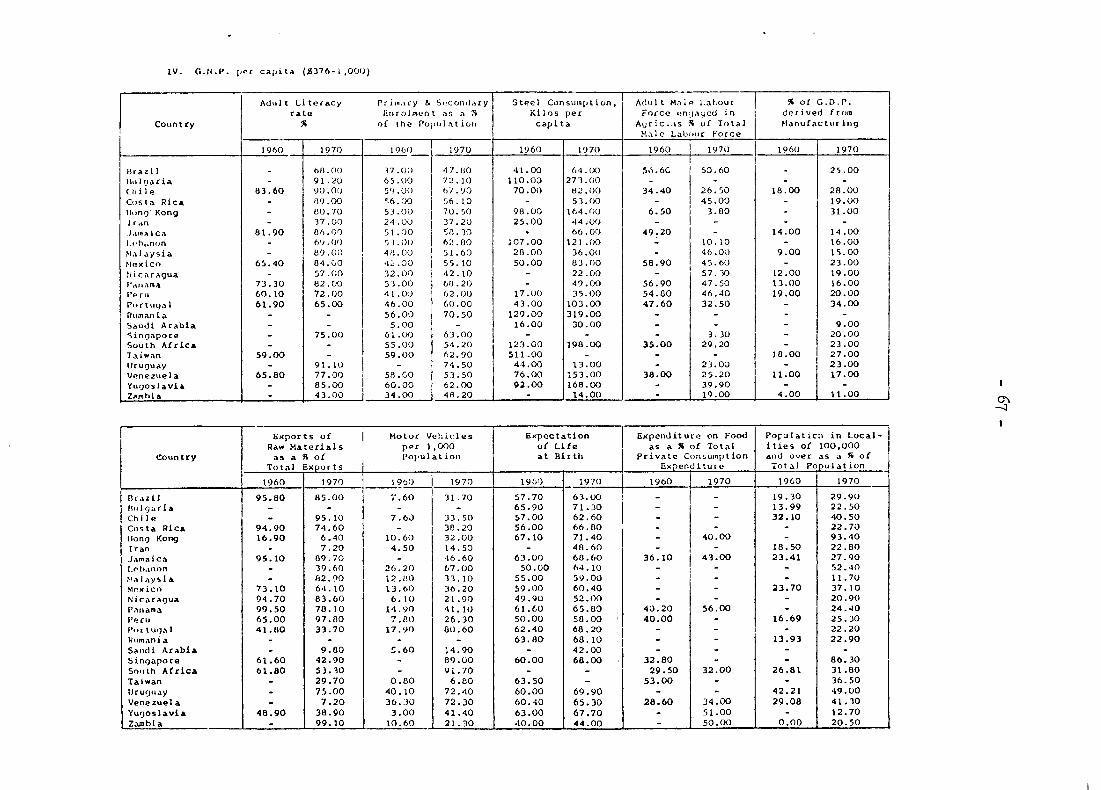
A comparison of the communication indicators with other core indicators of socio-economic development are examined in Part IV. For comparative purposes the researchers used the composit indicator "the commindex" and looked at the compara- tive placement of these indicators in five GNP groups. They were able to identify a few central features in the relationship between communications and other indi- cators and particularly perhaps to identify the group of countries between $375 and $1,000 GNP per capita as crucual to the growth of the indices of communications, health and education, for example. The opportunity cost of investing among these sectors is considered in relation to planning in the conclusion.
(1) See Section 7.4
(2) In any case, the development of telecommunications planning is much further advanced and often sets up parameters for the planning of mass communications - especially since the former is closely linked with industrialisation while the latter is or ought to be an indicator of distribution.
(3) In particular, Economic Studies at the National Level in the Field of Telecommu- nications: 1964-1972, C.C.I.T.T., I.T.U., Geneva 1972. D.J. Marsh, 'Telecommuni- cations as a factor in the Economic Development of a Country', IEEE Transactions on Cormnunications, Vol. Corn-24. No.7, July 1976. See Section 7.3 for the invest- ment data considered.

-9-
Inter-Temporal Analysis
Considerations of the growth of mass communications in relation to other indica- tors of development from 1960 to 1970, one of the central questions proposed by Unesco for this study was by far perhaps the most difficult to analyse (see the introduction to Part V). While it was possible to confirm a few patterns discerned in the cross- sectional analysis, most of the relationships (based on correlation coefficients) are unexplainable and possible spurious. In this area of analysis one is in some sense extending beyond the bounds of what is possible, given the non-comparability particu- larly of non-economic indicators, p oor data base overall and the lack of a theoretical base from which elements of causality might be explained.
Income Distribution and Dualism
Working as they were exclusively from national data, the researchers considered how to make some assessment of the relation of mass communications to the structure of income distribution. Using a ranking method for ordering countries on the basis of income distribution, they then considered the growth of communications in these countries.(l) IvIost initial processes of industrialisation and urbanisation seem to coincide with a marked worsening of income distribution and also economic dualism. On this last feature they were unable to pursue any hypotheses because of the absence of reliable quantitative data for the comparative measurement of dualism, for reasons outlined in the text. The data on income distribution is more suggestive, and merits further consideration in research terms. The limitation of working principally from national statistics, however, is that it does not relate individual income capacity to access to communi 'cations, nor does it enable the researcher to identify PartiCU- la;rly disadvantaged groups in society which would be essential. for pls.n.nir% PurPosesI especially if policies were envisaged to give greater access to more isolated or poorer sections of the population. Time Series Data
A series of different tests were run on the cross sectional data, which included features of growth and allocation of differing levels of development and compared communications to other indicators. Both in the communications literature and that on economic and social development, in general, it has been noted again and again that trends observed in cross-sectional comparisons are not often borne out if tested against time series analysis. Twenty countries and twelve key indicators (including four communications indicators) for comparative purposes were therefore considered. The researchers standardised for the years 1960-1975 by mean standard deviations and applied regression analysis to time series data, not to imply causality, but merely to be able to control the volume of data and test it against GNP. Data usually presented on such a time series basis can lead to the formulation of causal sequences, but the problem is not only the generalisation from one case that is always present, but the problem of multicolliniarity which affects the analysis of all communications growth data. When the data base of communications indicators improves, it may be possible to combine cross-section and time series data so that long term cross section adjust- ments to exogenous variables can be integrated.(2)
Regional Variation
One of the most important differences in the growth of mass communications and other features of development can be found at the regional level. The analysis in
(1) See Part VII.
(2) See R. Chenery and Ivl. Syrquin, op. cit. Technical Appendix.

- lo-
the report based on comparisons of regional coherence in terms of level and growth of indicators did not yield very useful information. To some extent, this is explained by the fact that this particular study uses GNP as the most important core variable and the GNP range within the developing regions.(Africa, Asia, Latin America and the Middle East) is very varied. Well recognising the considerable importance of studies on a regional basis particularly emphasising economic factors such as linguistic, cultural and social differences, this is a considerable limita- tion to this type of report.
The Unesco handbook, World Communications, gives a useful analytical summary of the development of communications on a regional basis. Although the researchers of this study were more concerned with the use of development indicators as the focus of analysis and comparison of countries on a global basis, they have applied one test based on cluster analysis which does indicate in quantitative terms the considerable regional homogeneity (with a few exceptions) on communications at the national level.
Regional means were calculated for each of the cormnunications variables with the intention of doing "t" tests to determine whether these regional means were significantly different from one another. It was found that regional differences in communications cannot simply be explained by regional differences in GNP.
Conclusion
To summarise, a number of interesting features and trends have been outlined by having done this type of analysis, some of which will perhaps be useful for initial considerations of communications planning. However, the researchers feel that the strength of analysis by indicators, especially on a global basis, lies in the possibilities of monitoring certain features of the development process, rather than "prognosis" of how ne ought to impute from the actual situation what should be the basis for planning. 1 4) To reiterate, one of the greatest problems in this type of analysis lies in the weakness of the data base as it presently exists. A problem from the starting point has also been the lack of theoretical models about the relationship on which one could check the quantitative trends observed in the indicators in different situations. One value of at least making a first, however general, attempt may be to raise in the minds of both scholars and planners the importance of considering the processes of communications as fundamental to the development process as a whole. Although this is already taken as a given among many, the precise aspects of the relationship to other processes of socio-economic change over time is still largely unresearched. This report may be taken as an initial attempt to map these processes.
The Use of Social Indicators and the UNRISD Data Bank, 1970
"Social indicators" and its allied phrases, "social accounting", social reporting and monitoring social change came into use by social scientists, commen- tators and policy-makers in the mid-196Os.(2) Since that time these indices have been used for a number of purposes in the analysis of development processes of all countries, and certain agencies and authors have been concerned with their specific application to developing countries. Several distinguishable types of research
(1) See the following Part.
(2) E.B. Sheldon and R. Parker "Social Indicators" Science, 16 May 1975, p. 693.

- 11 -
activities have emerged including: (a) conceptual, methodological and data develop- ment work (for example at the United Nations Research Institute for Social Develop- ment), (b) welfare measurement (particularly the work of Jan Drewnowski(l), (c) evaluation of institutional phenomena (particularly I. Adelman and C.T. Morris(2), (d) the application of indicators to development {lanning(3), (e) the content measure- ment of progress at the local level (also UNRISD( )). The most recent example of the use of indicators for the projection of global needs for future growth is found in the components of the Bariloche model, developed to try to indicate the future world development was more threatened by its present structural characteristics
b rather than exhaustable natural resources. Most social scientists using indicators are engaged essentially in analysis and measurement of social change, although some show an enthusiam for their usefulness in guiding social policy.
How far are indicators actually used in planning or to incorporate the social dimensions of planning? In the move to establish communications planning at a national level the usefulness of indicators can only be a reflection of the level of statistical development and the administrative structure of planning in each country.(5) We are at best at a rudimentary stage in the collection of relevant and reliable data. It is assumed that the study of communications indicators will make an initial contribution towards the collection of comparable data at the national level. The use of social indicators for planning purposes is hardly developed in developing countries compared with its uses in the highly developed industrialised states such as the U.S. of America, Germany and Australia. From the point of view of policy and planning, the important question is not what level a country has reached in a given component of development but whether that level is high or low for the particular country at the
P resent and in the planned future
given the totality of its current conditions(6 .
In keeping with their assessment of the utility of indicators the type of analysis adopted by UNRISD is based on the technique of the best fitting curve(7) which presents their data according to a series of scores or indices. The specific work arising out of their 1960 and 1970 data banks consists in the construction of a general index of socio-economic development. They have also offered guidelines for cross-sectoral and cross spatial analysis as well as planning in a note on the general uses of indicators for a unified approach to development analysis and * planning(8).
(1) (2)
(3) .
(4)
(5)
(6)
(7)
(8)
On Measuring and Planning the Quality of Life, Mouton, The Hague, 1974
"The Measurement of Institutional Characteristics of Nations: Methodological Considerations", Journal of Development Studies, Vol. 8, No.3, April, 1972
See, for example, N. Baster "The Use of Social Indicators in Development Planning: A Case Study of the Sudan", UNESCO Division of Social Sciences SHC. 76/WS/l6.
UNRISD Research Notes: A review of Recent and Current Studies Conducted at the Institute. No.4, Geneva, 1974
See the necessary distinction made between types of economies and their stati- stical needs for planning in D. Seers, Statistical Needs for Development. IDS Communication No. 120, 1977. The list of questions submitted in the Revised Guidelines for the Economic Evaluation of National Communication Systems (UNESCO, COM/WS/366, Feb. 1974) are an initial statement, amplified further in UNESCO Reports and Papers on Mass Communications, Towards Realistic Communication Policies NO. 76. 1976
UNRISD Contents and Measurement of Socio-Economic Development, Geneva 1970, Report No. 70. 10, p.17
UNRISD Staff Study, Methods of Estimation and Prediction in Socio-Economic Development: Regression and the Best-Fitting Line, Geneva, 1973
uN-KL% E/CN 5,‘519 PP- 25-35

- 12 -
The UNIUSD data - both 1960 and 1970 compilations of social and economic indicators and the 196X3-70 comparisons which were based on 50 indicators(l) became a useful starting point for the analysis of this study. Some of the problems of comparability found in the UNRISD indicators (which also appear in other time series data) are changes in definition of the indicator, models based on trends, and values expressed in monetary terms. Comparability over time is also reduced because of technological changes or changes in social value which affect the contents and signi- ficance of an indicator. Similar problems were encountered during the course of this study.
The Preliminary Selection of Variables (1970, 1960)
The data
The 1960 UNRISD "Compilation of Indicators" uses 92 indicators and has observa- tions for 115 countries.(2) The 1970 "Compilation of Indicators" uses 112 indicators in its pre-publication copy and 100 indicators in Vol. I. 121 countries.(3) As expected,
'There are observations for there are a great many more common observations for
developed countries than for the countries of Asia, Africa and Latin America, and economic indicators are as a rule better represented than social or welfare indicators.
As the researchers of this study wanted to look at the growth of communications in comparison with other indicators of development from 1960 to 1970, they took into account the number of common observations for those two time periods. They wanted to establish a set of core indicators for a fixed set of countries and use these common observations for comparative purposes, provided the gaps in the data allowed them a meaningful1 spread of indicators and countries to choose from.
In order to get a clearer picture of the data available for both 1960 and 1970, a matrix was drawn up with the 64 common indicators. On one axis the indicators were ranked in order of descending frequency of countries in which they appeared; on the other axis, the countries were ranked in order of descending frequency of the indi- cators for which they had readings. It was hoped in this way to arrive at a common matrix which would be free of gaps.
The resulting complete matrix excluded many developing countries, and some indicators which were relevant to communications. For the communications indioa- tars(4), they had a spread of 36 countries in which these four indicators appeared in 1960 and 1970. This list excluded most African and socialist countries. But if 1960 and 1970 were taken separately, there was greater scope. For 1960, they had 46 countries with readings for these indicators; for 1970, they had 73 countries with observations for those indicators and for newsprint consumption.(5)
(1) UNRISD Report No. 76,'~ (P re-Publication Issue) Research Data Bank of Development Indicators, Vol. III, lg60-1g70 Comparisons
(2) "Compilation of socio-economic indicators of Development lg60”, UNRISD. "Compilation of indicators for 1970". Vol. I. UNRISD,
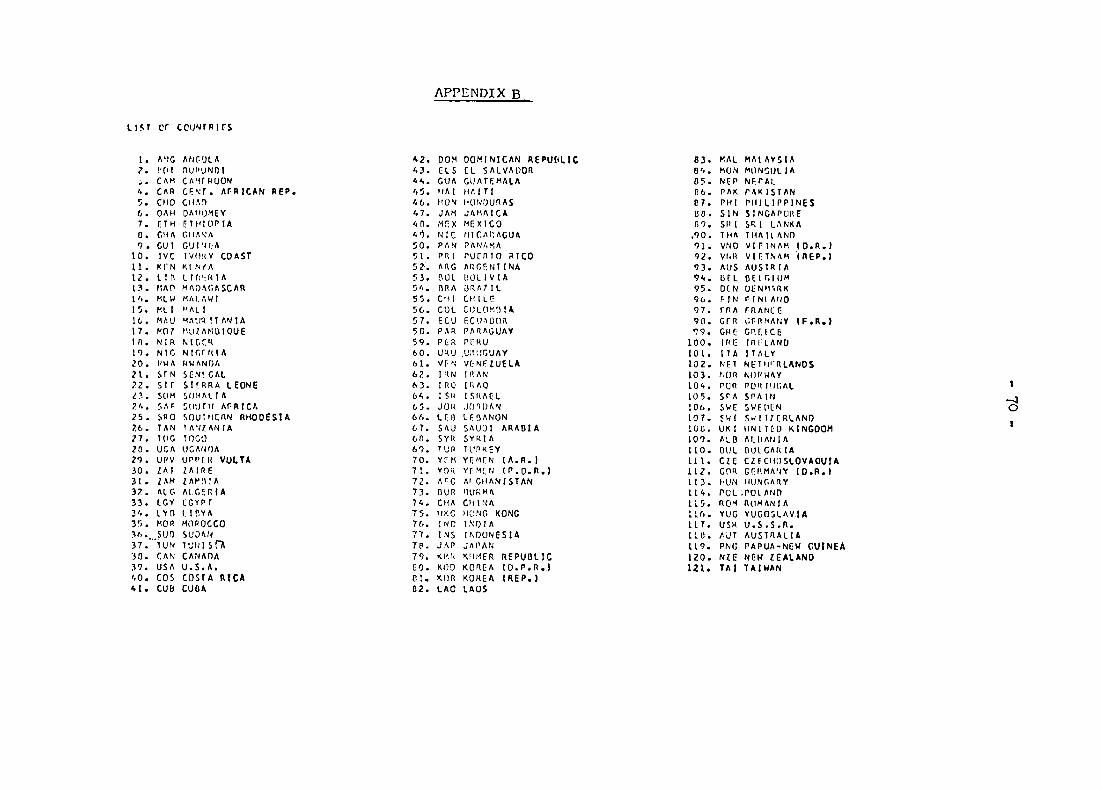
(3) See Appendix B for list of countries included in the data bank.
(4) Newspaper circulation per 1,000 population; Telephones per 1,000 population; Radio receivers per 1,000 population; T.V. receivers per 1,000 population.
(5) If we include "Domestic Mail" in this set, the number of values falls to 46. This indicator did not appear in the 1960 data bank and hence was omitted for 1970 l

- 13-
Since they wanted to observe the statistical relationships between the communi- cations indicators and other indicators of development, the authors of the study felt that it would have been inappropriate to fill up the gaps of missing data through regression analysis or by estimating the "best-fitting line",(l) because this implied generating relationships in the data that might not, in fact, exist. Accepting the limitations set by the gaps in the data, they had to reject certain types of techniques (example: factor analysis, discriminant analysis) which they had planned to use in the first instance. They therefore opted for the simpler but clearer presentation of cross-sectional analysis on the 1970 data alone, because it was more comprehensive.
I For 1960-1970 comparisons,both the spread of countries and the number of indicators would have to be restricted by the availability of the 1960 data.
The preliminary selection of indicators
A number of indicators were selected from the 1960 and 1970 UNRISD data bank on which the researchers could carry out their preliminary tests. These indicators were chosen on the basis of their probable relationship to communications, of their incidence in 1960 and in 1970, of their representation in terms of total countries and geographical spread. As far as possible the indicators were classified under general headings, each corresponding to a particular aspect of development.
List of Variables
The following 53 variables(2) were selected for 1970 at the initial stage:-
Communications: (3)
v.l. Newspaper ("Daily General Interest") Circulation per 1,000 Population (NEWSPAPER).
v.2. Newsprint Consumption per capita (NEWSPRINT). v.3. Telephone per 100,000 population (TEIEPHON). v.4. Radio receivers per 1,000 population (RADIO). v.5. Television receivers per 1,000 population (TV).
Education:
v.6. Literate Adults (age group 15 and over) as a $6 of total population of adults (LITERACY).
v.7. Combined Primary and Secondary enrolment as a $ of age group 5-19 (PSENROL). v.8. Vocational Enrolment as a $ of age group 15-19 (VOCENROL). v.g. Higher Education Enrolment per 1,000 aged 20-29 (HIGHERED). V.10. Pupil/Teacher ratio in primary education (FTRATIO).
(1) UNRISD: "Contents and Measurement of socio-economic development", Geneva, 1970
(2) In the computer print-outs the variables have been abbreviated to the names shown in the brackets.
(3) For the communication indicators , gaps were filled in by going back to the original data. When pre-1970 and post-1970 data were available the 1970 figure was calcu- lated by moving averages. The World Tables provided additional data on Newsprint consumption.
(4) s ource: World Tables 1976 (IBRD). The World Bank Literacy data was considered more reliable*and was better represented than in the Unesco source, which had very few observations.

- 14 -
Transport:
V.ll. Railway passenger - km. per square km.per cap. (RAIL) V.12. Passenger cars per 1,000 (CARS) V.13. Motor vehicles (passenger cars and commercial vehicles) per 1,000 (MOTORS). V.14. $ economically active in transport, storage communications (TSC)
Urbanisation:
V.15. Population in urban areas as ,% of total population (POPURB). v.16. Population in localities of 100,000 or over as $ of total population (LOC 100).
Income distribution:
V.17. Protein consumption per capita (PROTEIN) v.18. Dwellings with piped water as $ of total (WATERHSE) V.19. Dwellings with electricity as a $ of total dwellings (ELECHSE). V.20. $ National Income to top 20$ of population (TOP 20) V.21. $ National Income to bottom 40$ of population (ROT 40) V.22. Compensation of employers as $ of National Income in 1970 U.S. dollars (COM
EMP). V.23. Expenditure on food as $% of total private consumption expenditure in 1970
U.S. dollars (FOODEXP). V.24. $ National Income received by bottom 20% (YBOT20)(1) V.25. $ National Income received by highest 5% (YTOP 5)(l)
Industrialisation:
V.26. Electricity consumption/kwh per capita (ELEC). v.27. Steel consumption/kwn per capita (STEEL). v.28. Energy consumption - kg. of coal equivalent per capita (ENERGY) V.29. Economically active population in manufacturing as $ of total economically
active population (POPMANU). V.30. GDP dividend at purchaser's value from manufacturing as $ of total GDP
(GDPMANU).
Technology:
V.31. Professional, technical and related workers as a $ of total economically active population (PROF).
V.32. Scientists and engineers engaged in research and development per 10,000 population (RDEV).
Growth potential:
V.33. Average annual growth rate of GNP per capita ('60-170) (GROWTH) V.34. Average annual growth rate of population (POPGRO). v.35. Investment per economically active person ('60 -170). V.36. Salaried and wage earners as a $ of total economically active population
(SALARY) V.37. GDP at Purchaser's Values derived from agriculture as a percentage of total
GDP in US dollars (AGGDP).
(1) s ource: World Tables 1976. This data updates V.20 and V.21 which UNRISD computed from Redistribution with growth, IBRD, 1974

- 15 -
Demography:
v.38. Area (AREA) V.39. Population (POP)
v.38. Population density (POPDEN). V.39.
Other Variables:
V.40. GNP per capita at current market prices 1970, US dollars (GNP).(l) V.41. Adult male labour engaged in agriculture as $ of total male labour (AGPOP). V.42. Agricultural production per male agricultural workers (AGPROD). V.43. Expectation of life (LFXPECl!).(2) V.44. Inhabitants per physician (DOCTORS) V.45. Population aged 15 and over as $ of total population (POP15). v.46. Concentration of Exports (Exports of largest item in terms of single digit
srrc code as $ of total exports) (EXPORTS) V.47. Export Concentration Index (commodity) (COMEXP) v.48. Exports of manufacturers as $GDP (MANEXP) V.49. Exports of raw materials as $ of total exports (RAWEXP) V.50. $ of Rural dwellings connected to Electricity (RURELEC)(3) V.51. Population density per sq. km. of agricultural area (AGPOPDEN).(3) V.52. Average Size of private households (HSESIZE).
The following 39 variables were selected for 1960 at the initial stages:-
Communications:
v.l. Newspaper ("Daily General Interest") Circulation per 1,000 population (NPSPR 60)
v.2. Newsprint Consumption per capita (NPNT 60)(4) v. 3. v.4.
Telephones per 100,000 population (TEIE 60). Radio receivers per 1,000 population (RADIO 60)
v.5. Television receivers per 1,000 population (TV 60)
Education:
v.6. Literates as $ of total population (age group 15 and over) (LITN 60) v. 7. v.8.
Combined primary and secondary enrolment as $ of age group 15-19 (PSEN 60) Vocational enrolment as $ of age group 15-19 (VOCEN 60)
v.g. Higher Education enrolment per 1,000 aged 20-29 (HIGHFD 60).
Transport:
V.ll. Railway passenger - km. per square km. (RAIL 60) V.13. Motor vehicles (passenger cars and commercial vehicles) per 1,000 (MOTORS 60) V.14. $ economically active in transport, storage communications (TSC 60)
(1) s ource : World Bank Atlas - IBRD 1972
(2) Some additional data were included from World,Tables 1976 - IBRD
(3) s ource: World Tables 1976 - IBRD
(4) The UNRISD data bank did not include Newsprint Consumption from 1960. These data were obtained from the UNESCO Statistical Yearbooks.

- 16 -
Urbanisation:
v.15. Population in urban areas as $ of total population (URBAN 60) V.16.A. Population in localities of 20,000 and over as $ of total population (UC
2060) V.16.B. Population in localities of 100,000 or over as $ of population in localities
of 20,000 and over (IGC 10060). v.16. v.16.~. x v.16.~. - Population in localities of 100,000 or over as $ of total
100 population
Income distribution:
v.17. Protein consumption per capita (PRCPEN 60) v.18. Dwellings with piped water as $ of total (WATHSE 60) V-19. Dwellings with electricity as a $ of total dwellings (ELEXHSE 60) V.24. $ of National income to top 5% of population (TOP 560) V.25. $ of National income to bottom 20$ of population (BOY! 2060) V.23. Expenditure on food as $, of total private consumption expenditure in 1970 US
dollars (FODEXP 60).
Industrialisation:
v.26. Electricity consumption&h per capita (ELEC 60) v.27. Steel consumption/kwn per capita (STREL 60) v.28. Energy consumption - kg. of coal equivalent per capita (ENERGY 60) V.30. GDP derived from manufacturing (ISIC div. 2-3) as $ of total GDP (GDPMANGO)
Growth potential:
v.36. Salaried and wage earners as a $ of total economically active population (SALARY 60)
Demography:
V.3. Population (POP 60)
v.38. Population Density (PDEN 60) v* 39*
Other Variables:
V.40. GNP per capita at current market prices: 1960 US dollars (GNP 60) V.41. Adult male labour engaged in agriculture as $ of total male labour (AGLAB 60) v.42. Agricultural production per male agricultural workers (AGPROD 60) v.43. Expectation of life @8X 260) V.44. Inhabitants per physician (DOCTRS 60) V.45. Population aged 15 and over as $ of total population (POP 1560) V.47. Export Concentration Index (commodity)(EXCONC 60) v.48. Exports of manufactures as $ GDP (MANEXP 60) V.49. Exports of raw materials as $ of total exports (RAWEXP 60) V.50. $ of Rural dwellings connected to Electricity (RUREIC 60) V.51. Population density per sq. km. of Agricultural Area (AGPDEN 60).

- 17 -
PART II
CGMMUNICATIONS AND GNP
The Problem of Causality between Communications and GNP
Are communications contributory to the growth of GNP or are they the outcome of a growth in GNP? In other words, are communications consumption goods which are
. consumed for their own sake or are they investment goods which contribute to further output? Or, as Y.V.L. Rae(l) points out, are they a combination of both. While it is true that economic development leads to an increase in the flow of information through the greater purchasing capacity of the people, reflected in subscriptions to newspapers, magazines, and specialized journals as well as the ownership of radio sets and travel, it is also true that increased information in turn furthers economic development".
The provision of telecommunications is essential to industrialisation, while mass communications or the output of the system is clearly on the consumption side. The relationship between communication and GNP would therefore differ according to which aspect of communications was being considered. The investment effect of the mass media (radio and television receivers, newsprint consumption) could also be considered in relation to the educational content of the mass media and on its impact on the audience by increasing skills and information in the community.(2) In terms of the educational content of the mass media, one would have to distinguish between the long-run yields of this investment (example - broadcasting for schools; propa- ganda aimed at changing peoples attitudes) and the short-run yields (example - direct guidance for new agricultural methods of production).(3)
Lack of detailed analysis of the educational content of the mass media at the global and its impact on the population to see if this has a multiplier effect on GNP(b) makes it 1 mpossible to establish or evaluate any causal relationships between GNP and mass communications. Mass communications in this study are therefore regarded as consumption goods and the level of communications are related to that of GNP and other development indicators in the same time-scale.
(1)
(2)
(3)
(4)
Y.V.L. Rao, quoted in W. Schramm: 1964, (P-50).
Mass media and National Development, UNESCO,
The effects of mass communications on the diffusion of skills or innovation has recently been reconsidered, with serious doubt about its effectiveness. See Everett M. Rogers, Communication & Development: Publications 1976.
Critical Perspectives, Sage
Ibid pp. 130-136
Mark Blaug, An Introduction to the Economics of Education, Penguin, 1970 (p. 66-68). Mark Blaug mentions that studies done on the relationship between education and GNP seemed to show that the causal chain runs from income to education and not vice-versa. When education was not treated as a homogeneous good, but broken down into types of education and related to GNP, it was found that "a certain vocational-academic mix of secondary education is highly related to economic development, but in such a way that it increases up to a certain point in the development process (roughly indicated by a GNP per head of $500) and thus declines again". (cross section evidence).

- 18 -
Preliminary Investigations
In
a>
b)
cl
d)
4
f>
the preliminary analysis the study carried out the following analytical tests:
the construction of a composite index of communications indicators "a commindex" used later in Part IV in connection with other indicator compari- sons.
a regression of "commindex" on GNP to indicate which particular countries fell outside the'confidence" belt around the regression line - a means of indicating unusual country characteristics.
correlation coefficients for communications indicators and GNP, and the indicators themselves showing the level of significance of these relationships.
scatter diagrams of communications indicators and GNP (all countries) to indicate the strength of the correlation and outlying countries.
an examination of communications indicators in three preliminary GNP groupings, established on a more systematic analytical basis.
a more detailed breakdown of communications indicators in standardized decile means of GNP, expressed in bar charts.
The relationship between Communications and GNP: The Commindex (based on 1970 data).
In order to consider the relationship of GNP per capita to communications a composite index for the communications indicators was drawn to give some measure of the total level of communications in each country. analysis(l)
By using principal component on the five communications indicators, the value of the first principal
component was used to set up this index of communication ('commindex') for each country with all five communication indicators. The coefficient of multiple determination calculated between the values of the commindex and GNP (R2 = .gl), gave a highly significant result.
To investigate the overall relationship of each indicator to GNP, the correla- tion coefficients of each communication indicator to GNP were calculated and scatter diagrams were drawn. Results of the correlation coefficients indicate that all communications indicators are highly correlated with GNP per capita. Telephones and television receivers come first, whilst radio receivers show the lowest correlation.
The scatter diagrams which follow indicate the correlation between separate communications indicators and GNP over the global range. They indicate the pattern of growth. Thus it is observed that newspaper circulation increases steadily as GNP rises, the main exceptions to the trend being Hong-Kong and Japan (both very high on newspapers) and Canada (very low). With telephones and GNP only New Zealand (high on telephones) shows a deviation from the trend line. Radio and GNP
(1) Principal Component Analysis concentrates on the relationships within a single set of variables. The main objective of principal component is to reduce the dimension of a large set of variables through linear transformationsinto a few components which are uncorrelated with one another. The components formed through linear transformations in principal component analysis can be considered to provide a description of the structure of the original set of variables. When the first component explains a large amount of the variation, it is possible to approximate a set of variables in terms of that first component. The first principal component can therefore be used as an index of an inter-variable set.

- 19 -
show a very interesting relationship: the range of radios does not appear to differ significantly (except in Canada and the U.S.A.) as GNP increases. This suggests a low income elasticity of demand for radios. T.V. shows a steady growth with GNP (with the exception of Libya). Newsprint shows a steady growth with GNP, but there are more deviations from the trend line than with newspaper circulation. Notable exceptions are Argentina (very high on newsprint), France, East Germany, Czechoslovakia and Libya (relatively low on newsprint).
All indicators are highly correlated with each other at a level of significance of 0.001, the highest being between telephones and television, television and news- print. As might be expected, correlations with radio show the lowest readings, especially newspaper and radio.
Furthermore, except for the correlation of radio with television, each communi- cations indicator correlates better with GNP than with the other communications indicators. This implies that the growth relationship between individual communica- tions indicators and GNP is more linear than that of the communications indicators in relation to each other.
Analysis in GNP deciles
The researchers also wished to investigate how the communications indicators varied with GNP and with each other over the whole GNP range. Deciles grouped according to GNP on 1970 data give the mean, minimum and maximum for each of the ten groups of countries according to the main communication indicators.
The 120 countries in the sample of this study were ranked by GNP per capita (1970) and divided (in their GNP ranking order) into deciles of twelve countries each. The mean and standard deviation of GNP were calculated for the countries in each decile, while the maximum and minimum values were noted within each decile. Next, the mean and standard deviation of the communications indicators were calculated for the countries within each GNP decile grouping (because of the gaps in the communications data, sometimes fewer than 12 cases were represented in each decile). Again, the maximum and minimum values were noted for each decile.
Conclusions
1. With the exception of radio receivers, all communications indicators show increasing percentage changes from decile to decile over the whole GNP range. In other words, as GNP increases, the rate of growth of the communications indicators also increases.
2. The communications indicators increase at different rates to each other, so that the relative position of their decile means changes as GNP increases. Telephones, for example, have the highest mean in relation to the other communications indicators in the GNP range of $30 - 120; radio receivers in the GNP range of $121 - 730; newspapers in the range of $730 - 2,4x; television and newsprint in the range $2,431 - 4,700.
3* Until a level of GNP per capita of $1,400 has been reached, the decile means of radio receivers rank much higher than those for television receivers in that range, while this pattern is reversed above a GNP level of $1,400. This suggests that, in the lower income countries, radio is more important than television, but that television replaces radio in the higher income countries.

i
f I
c 1
i i i I 2 * * : I IL * * : : 1
54. t . I 4 I II L l * 1 f I
I 21*4 I I I a* . I AZ2222 k :
I : I I
. t”QtbJ 1* . e 1 I 4 ,+~...+..~~,~.~r*r.~~*~~-~-rt~~-~,--~.+-.~~,.*~.*~.~-*.~.~*-..~*---~*~~-- )r.~.*-.rr,r+.~+~~-*+~-..+-*~-*,
32. 5 a3 . 379. 1449. 1922; 2.595. 2868, 3341, 3814, 4287, 4760,
“L?IIy’ VIL’JES - 34 EXC~,JDED vA’.‘.JFs- B MtSSI’Js VALUES - ?3
323,
2b9:
215;
161;
I#
ar;

S!IP 46tIqST fYDlCIIDA 3f; CD’WJyICAT~DN 70 DrlA
llliEl 033351170 (CRPIlIDY DATE, a. ~7~12/76 ) 8iX~~f,?GftAM of1 IDOWJ) Y&lSPAYT
27;

- 22 -
4 . Telephones expand markedly between $440 - 730 GNP per capita, and again above $1,400. However, they do not expand as rapidly over the whole GNP range as most of the other communications indicators; their relative ranking position changes from the first position in the first two deciles to that of third (after television and newsprint) above a GNP level of $2,430. The slow growth of telephones (in relation to the growth of the other communications indicators) below a level of $1,400 may be due to the fact that this growth represents mainly the growth in industrial telephones.
59 Newsprint consumption has a mean higher than that of newspapers until a GNP level of $440 is reached and again above a GNP level of $2,400. The latter result may confirm the earlier hypothesis that, in the highest income group countries, a saturation level in newspapers has been reached and that further increases in newsprint are due to an increase in "non-daily general interest" newsprint. It is interesting to note that until a GNP level of $2,400 has been reached, newspapers grow faster than newsprint consumption.

G.N. P per capita Newspaper Circulation Telephones Radio Receivers Talevision Newsprint Cons. c 7 3 F 2.
I
I , I 1 1 I , 1 I 1 1 rllrrlrrlll r-l 1 I I1 I I I I I I 12345678910 12345678910 12345678910 ,,I,111111
‘I 2345678910 rr u-1 I, I, I,1 12345678910 ‘I I 2’34 I 1 I 5 6’78 I 9 I Id 2
GNP Deciles GNP Deci Ies GNP Deciies GNP Deciles GNPDeciles GNP Deciles 1
KEY GNP per capita in deciles I-$ 30-80 6-g 311 - 440 2- $ 81-120 3- 0 121 -180
7-$441- 730
4- 8 I81 -260 8-$731-1400
5- $261- 310 O-$MOl-2430
IO-$2431-4700
Communications Indicators in GNP Deciles Groups
Illustrating the acquisition of media in standardised mean values in relation to,GN P groups from $30 4700 p.c. incomes (all countries)

- 24 -
PART III
"DEVELOPMENT PATTERNS" AND COMMUNICATIONS
Definition and Analysis of "Development Patterns"
This study also tried to ascertain whether there were any noticeable or signi- ficant differences that existed in the development of communication systems among countries as a result of the development pattern of the country in question. Rather than make totally subjective and inexpert judgements on the pattern of development apparent in particular countries, the study used the classification as outlined by Chenery and Syrquin.(l) In their book Patterns of Development 1950-1970 Chenery and Syrquin outline and discuss four basic patterns of development. Although this classification has its limitations, particularly in relationship to different development strategies which may affect the allocation and use of mass communication, the data collected on the basis of these categories were useful. The four basic patterns of development with their characteristics are:
4
b)
c>
d)
Primary Specialisation
I. primary-oriented exports ii. primary-oriented production iii. export level usually above normal
Balanced Production and Trade
i. normal export orientation ii. normal production orientation
Import Substitution
i. primary export orientation ii. low total exports iii. production not primary oriented
Industrial Specialisation
i. industrial specialisation ii. industrial production Ori@ntatiOn
According to this typology, countries are classified on the basis of their produc- tion and trade patterns. Chenery and Syrquin have attempted to define the expected biases in production and export orientation for countries of similar population, similar GNP per capita levels, and similar levels of capital inflow. The introduction of the final explanatory variable, that is capital inflow, allows groups (b) and (d) both to be subdivided into two groups depending on whether inflows are considered to be 'high" or "normal".
(1) Patterns of Development, 1950-1970 by Chenery & Syrquin, O.U.P. 1975, p.104.

-5-
'Primary Specialisation++ Countries
Tanzania Uganda Sudan Sri Lanka Zambia Ivory Coast Iran Iraq Malaysia Saudi Arabia Nicaragua Venezuela
"Balanced" (Normal Capital Inflow Countries)
Thailand Philippines Syrian Arab Rep. Morocco El Salvador Guatemala Peru Jamaica South Africa
'Balanced' (High Capital Inflow Countries)
Ghana Costa Rica Spain Greece Ireland
"Import Substitution+' Countries
India Bolivia Ecuador Brazil Colombia Chile Mexico Uruguay Argentina
"Industrialised Specialisation+' (Normal Capital Inflow Countries
Kenya %mt Taiwan Yugoslavia Singapore Hong Kong
"Industrial Specialisation++ (High Capital Inflow Countries
Pakistan Korea (Rep. of) Tunisia Portugal Lebanon Israel
To ascertain whether these six distinct patterns of development seemed to have an influence on communications development the mean and standard deviation for each communications indicator within each of the six groups-were calculated. Then the "t" test was applied to see whether the mean for each communications indicator in each group was significantly different (with a 95% level of confidence) from its counter- part in all the other groups.
+ Since the classification is based on a country's departure from the average, expected or normal patterns of production, trade and capital inflow, a normal range for each of these three measures has to be provided. The width of the normal range was chosen by Chenery and Syrquin to include roughly 40% of the observations for each measure and on this basis a total of 50 countries was distributed between the six groups.
__.-- .._ ___._

- 26 -
The results in most cases indicated that development patterns as defined by Chenery and Syrquin did not appear to have a systematic and significant influence on communications development in a country. One of the reasons for these results could be the very wide range of GNP per capita levels within each group, and second, the fact that the development strategies, defined in terms of state planning and control contrasted with market oriented capitalist development is also not differentiated, thus real development strategy is not distinguished in this classification. In terms of examining communications input into a development strategy, more significant quali- tative results might be obtained from such a differentiation.
Owing to the large range of GNP levels within each group the means and standard deviation for GNP per capita for each group were calculated, followed by the 't" test procedure to discover whether mean GNP levels were significantly different across groups.
The results showed that GNP per capita levels were significantly different in Primary Specialisation countries as against Balanced Countries with High Capital Inflows and significantly different in the Balanced Countries with Normal Capital Inflows again against Balanced Countries with High Capital Inflows. In all the other possible pairings there was no significant difference in GNP per capita levels. Thus it was not surprising to find that with each of the communications indicator's a significant difference between the means of these particular groups was the exception rather than the rule.
Although this particular line of analysis based on the development patterns did not yield fruitful results, its negative usefulness is to discard the classification as important to the growth of mass communications. It also seems to indicate that the commodity, trade or industrial base of an economy is not a significant explana- tory factor for the acquisition of mass communications.
Countries $100 - $1,000 GNP per capita: Analysis of Communications Indicators
To determine whether the aggregate features in the range of countries $lOO- 1,000 GNP per capita showed any significance, the relationship between individual communications indicators and GNP on a set of scatter diagrams were examined. Seventy-five countries in this range (based on the 1965 figures) were considered. Results indicated that there is a good correlation between newspapers and GNP. Scatter diagrams show that several countries fall outside the general trend. Until a level of GNP per capita of $250 is reached, 20 out of 23 countries have a news- paper circulation below 25 per 1,000 population. From $250 to $750 there is a big variation in newspaper circulation, from 5 to 13 (although from $250 to $450 most countries fall below a circulation of 70 per 1,000 population). Beyond a GNP per capita of $750, almost all countries have readings above 1% per 1,000.
The scatter diagrams also illustrate the very high correlation between tele- phones and GNP. Four countries show deviations from the normal trend; but until a level of GNP of $220 is reached, all countries have readings below $850 telephones per 100,000 population. From $220 to $470 there is a big variation in telephones, from 0.20 to 3,665 per 1,000 population. Beyond the level of 4,470 GNP, all countries have readings above 2,900.
Television and GNP also show a strong correlation. Until a level of $300 GNP is reached, all countries have readings below 27 television receivers per 1,000 population. From $300 to $600 GNP, there is a big variation in television receivers from I to 114. Above $600 GNP, all countries have readings for television above 36 per 1,000 population.

- 27 -
Although the correlation coefficient for radio and GNP is significant at the . 001 level, it is significantly lower than that of the other correlation coefficients with GNP. Even at the very low GNP levels, there is a large variation in the number of radio receivers per 1,000 population. However, until a level of GNP of $500 is reached, most countries have fewer than 140 radio receivers per 1,000 population. Above $500, all have readings above 70 radio receivers per 1,000 population. This wide variation at all GNP levels might be explained by two factors: firstly, by the unreliability of the radio data; secondly, by the fact that radios probably have a low income elasticity of demand, showing high readings even at very low GNP levels.
Newsprint and GNP are very highly correlated together. Until a level of GNP of $230 is reached, all countries have readings of less than 2 kilos per inhabitant. From $230 to $450, the variation is from 0.2 to 3.70. Above $450 GNP per capita, all countries have readings above 0.80 kilo per inhabitant.

- 28 -
PART IV
COMPARATIVE ANALYSIS OF COMMUNICATIONS AND OTHER DEVEMPMENT INDICATORS
The Selection of Core Indicators: Methodology
Having selected the 53 variables for 1970 (and the 46 for 1960) from the original 112 UNRISD variables, the researchers originally intended to use principal component analysis as a means of identifying various components of development from this list of variables and to see how these related to communications. However, the large number of gaps in the data made it impossible to use a statistical procedure which depended on a fixed matrix. Because of the small fixed matric and the high inter- correlation both within and between the two sets of variables, the results were highly unstable.
The Pearson correlation coefficient of GNP per capita with the communications variables was high for each variable:
GNP
Commindex 0.9539 Newspaper o .8o2g
Telephones o-9351 Radio o .7803
T.V. 0 l 9635
Newsprint o. 8253
Subsequently it was decided to select indicators on the basis of the corre- lation coefficients between the communications indicators and the other variables and to reduce the original 53 variables for 1970 to a set of ten "core" variables.
Correlation Coefficients
The task of selecting (through correlation) indicators of development which might be ' relevant'(l) to communications presents certain problems. One problem lies in the interpretation of such correlations, because most indicators are very closely correlated with GNP. One may therefore find that two variables are very highly correlated simply because they both correlate highly with GNP, but not because there is a close link between them. However, this is not necessarily a drawback as long as one can understand why the correlation coefficients are high or low, and as long as one does not arrive at any hasty conclusions about the two variables under consideration.
(1) "Relevance" is to be seen in two contexts: firstly, as explaining a link, perhaps a causal one, between a communications indicator (e.g. rail, km. per capita, which is more highly correlated with newspaper than with GNP): secondly, as being more closely associated with one particular aspect of development than another (e.g. income distribution, which is found to bear a closer relationship to communications than urbanisation). One therefore needs indicators which bear a direct relationship to communications (without necessarily representing an aspect of GNP).

- 29 -
The correlation coefficients were calculated first on all countries for 1970 and for 1960. This was done a pair-wise basis, since it was impossible to set up a list-wise correlation matrix. Any matrix involving more than six indicators becomes so small in terms of countries that any statistical test applied to it would be of little significance.
For each pair-wise correlation the number of countries and the level of signi- ficance with the value of the correlation coefficient were included. (See Table I). Furthermore, the correlation coefficients for all countries with a GNP per capita between $100 and $bl,OOO in 1970 were calculated. It was felt that, in some cases, relationships might be different in countries at the two extreme ends of the GNP scale and hence would give a low (or lower) correlation coefficient when all countries were taken into account. The correlation coefficients for 1960 were calculated only on those countries which fell in the $lOO-1,000 GNP range for 1970, in order to compare these coefficients with those for 1.970 with the same group of countries.
The Core Indicators
Most correlations are significant at the level of .OOl. Where a choice had to be made between highly significant variables, all representing the same aspect of development, the following criteria were used in the selection process:
i) size of the correlation coefficient in relation to the number of countries used for the correlation;
ii) the number of countries represented, with preference being given to those variables with a wide geographical spread;
iii)the direct bearing of each indicator on communications (for example, the pupil/teacher ratio, one of the five education variables, is an indicator of the quality of education and hence has no direct bearing on communications);
iv) the size of the correlation coefficient both in 1960 and 1970, when calculated for all countries with GNP of $100 - 1,000.
On these grounds the following core variables were selected:
1. Population in localities of 100,000 and over as $ of total popu- lation (urbanisation indicator).
2. Literate as $ of total population (aged 15 and over) (Literacy indicator).
3. Primary and secondary enrolment as $ of age group 5 - 19 (literacy indicator).
4. Expenditure on food as $ of total private expenditure (general economic indicator).
5. Motor vehicles per 1,000 population (transport indicator).
6. Expectation of life at birth (health indicator)
7. Steel consumption - Kg. per capita (industry indicator)
8. Export of raw materials as a $ of total exports (general economic indicator).
9. $ GDP derived from manufacturing (industry indicator)
10. Adult male labour in agriculture as $ of total male labour (employment indicator).

-30 -
Note on core indicators
For the urbanisation indicator, "g population in localities of 100,000 and over" was selected in preference to "$ population in urban areas". Both these indicators suffer from definitional problems. What is considered an "urban area" varies from country to country: sometimes it is defined by population density, sometimes by centres with a population above a certain threshold level, for example, 1,000, 2,000, 5,000, 10,000 or 20,000, sometimes by agglomerations with urban characteristics regardless of density. With neither indicator is it made clear when suburbs have been included. $ population in localities of 100,000 and over is a somewhat more precise indicator, although it has the drawback of excluding relatively large urban centres which do not meet the 100,000 population threshold level but which may never- theless play an important role in the economy of many countries.
'Literates as a $ of total population aged 15 and over" was taken from the World Tables 1976. The World Bank Data had a more complete set of figures for literacy than the UNESCO sources. Its sources are the World Bank Comparative Education Indicators, the UNESCO Statistical Yearbook, the UN Demographic Yearbook, the UN Statistical Yearbook.
'Primary and Secondary enrolment as $ of age group 5-19" reflects the availa- bility of education in any given country, though not necessarily the quality of education provided. Enrolment figures include part-time pupils, as well as pupils outside the 5-19 age range; consequently the figures will be inflated in those countries where these pupils represent a large proportion of the total pupil popu- lation.
"Expenditure on food as 5 of total private consumption expenditure" is an indicator of development. The lower the income, the higher is the percentage spent on food. This indicator, however, is useful in determining how much income is generally available for the consumption of goods other than food.
"Motor Vehicles per 1,000 population' was chosen in preference to "Rail - km. per sq. km. per capita" and "Cars per capita". All highly significant correlations with GNP and with the communications indicators.
'Expectation of life at birth' is a health indicator representing a particular aspect of development which has no direct bearing on communications, but which reflects the level of expenditure on healthcare.
"Steel Consumption' is a good indicator of development and correlates very highly with GNP. It is a better indicator of industrialisation than either Energy or Electricity consumption, since the latter also includes the consumption of private households.
'Exports of raw materials as a $ of total exports" correlates highly with GNP (negative correlation). This indicator includes SITC codes 0, 1, 2, 4 and 68 - that is, live animals, meat, dairy products, cereals and non-ferrous metals. A high degree of dependence on primary exports is often taken as an indication of a comparatively low level of development.
"$ GDP derived from manufacturing (ISIC 3) as $ of total GDP in 1970 in 1970 US dollars" differs from "$ GDP derived from industry" because it excludes mining, construction and public utilities. An increase in manufacturing is commonly associated with certain early strategies of industrial development, for example, import-substitution.

- 31-
"Adult male labour in agriculture as $ of total male labour" was chosen as the employment variable because it appears both in 1970 and 1960. It is highly nega- tively correlated with GNP.
Commindex and Core Indicators 1970: Ranks, Correlations and Scatter Diagrams
To investigate the relationship of mass communications (l) (Newsprint Consump- tion,(2) Radio and Television) to the indicators selected, first a communication index (commindex) for these indicators for the 87 countries which had readings on these three indicators for 1970, was drawn. (See Part II for the methodology). The first principal component of this commindex explained 85.1.g of the variance. The commindex was then regressed against GNP per capita(3) and the core variables, giving the following coefficients of determination and of correlation: (See Table I). The highest correlation coefficient is that between commindex and GNP per capita, while the lowest is between commindex and exports of raw materials as $ of total exports. While most low income countries are usually large exporters of raw materials, there is a wide variation between exports of raw materials and GNP, especially in the $375 - 1,000 GNP range. Scatter diagrams of commindex drawn against these variables show either exponential or linear trends in their growth rate.
Commindex and GNP
There is a clear linear relationship between these two variables. Two countries, Libya and Argentina, fall well outside the linear trend line, Argentina rating exceptionally high on the commindex (1.86), Libya exceptionally low (-0.93) in relation to GNP. Argentina already exceptionally high on the first commindex, which included newspapers and telephones. Its level of mass communications, as given by the present commindex, lies between that of Denmark and of the U.K. It is exceptionally high on television and newsprint. Libya, on the other hand, has a level of mass communications that lies between that of Zambia and Kenya. It is exceptionally low on all three indicators of mass communications, a pattern shared by other oil rich states, where pc. GNP rates are very high, and personal incomes for the vast majority of inhabitants are very low,
Commindex and Literacy
Until a level of literacy of approximately 55% is reached, there is little growth of communications. Communications increase between 55% and gO$ literacy, but a highly significant growth is only noticeable once a level of gC$ is reached. Data in the country profiles indicates that countries attain a level of literacy
(1) Mass Communications, now exclude telephones.
(2) Newsprint consumption was chosen in preference to newspaper circulation because it is a more reliable indicator. Newsprint consumption data are obtained from trade statistics, while Newspaper ("Daily General Interest") Circulation data often refer to different numbers of newspapers from year to year and sometimes excludes a circulation in rural areas.
(3) A spearman-rank correlation test was also done between GNP per capita and the values for each country on commindex. The value of the coefficient was r - 0.88, significant at the 0.01 level (see Commindex and GNP 1970, Table 2).

- 22 -
Commindex and Core Indicators
Table1 Based on simple linear regression
c 0 mmin d e x
r Level of
significance
0.00001
0.00001
0.00001
0.00001
0.00001
0.00001
0.00001
0.00001
0.00001
0.00003
0.00001
R2
G.N.P. per capita I 0.9208 0.8479
0.4748 Literacy I O-6890
0.7341 0.5389 Primary & Secondary Enrolment
Motor Vehicles 0.9100 0.8281
Steel Consumption 0.8517 0.7253
% G.D.P. from manufacturing
% Pop. in Locations of 100,000+
0.6766 0.4578
0.3897
0.5647 Expenditure on food I -0.7514
0.5118 0.7154 Life expectancy
Exports of raw materials as % total exports
-0.4312 0.1859
-0 -7494 0.5617 Agricultural pop. as % total population
-- - _-.- “._l. _.I .-I_--I”._.-_.

- 33-
of 55$, only after a GNP level of $375 has been reached, while a literacy level of 90% is only reached by countries with a GNP of $1,000 or over. Countries with a GNP level below $375 are low on all mass communications, though radio is by far the most important medium. Countries with GNP levels above $1,000 are relatively higher on television and newsprint than on radio. This suggests that it is not just literacy per capita which determines the medium of mass communications, but more the use to which literacy can be applied once a high enough level of income has been reached.
Commindex and Primary-Secondary Enrolment
Analysis reveals a clear exponential growth pattern of mass communications, with marginal changes beginning to increase more significantly around a school enrolment of 5C$ and over. From the data in the country profiles, it can be observed that a 50% school enrolment rate occurs in countries with a GNP of $375 and over. Below that GNP level, there is a low level of mass communications. There is a high correlation between primary and secondary enrolment and GNP; hence, once a 50% school enrolment rate (or GNP level of $375) has been reached, one would expect mass communications and school enrolment to grow simultaneously. The exponential growth curve implies that, at first, school enrolment increases faster than mass communications, but that this pattern is reversed once a school enrolment level of approximately 75% is reached, that is, once a level of GNP of $1,000 is reached.
Commindex and Motor Vehicles
There is a clear linear trend between these two variables. It differs from the relationship between commindex and GNP in that this scatter diagram suggests that countries with a commindex below 0.18 (that is, with GNP below $1,000) are relatively higher on mass communications than on motor vehicles. Argentina again falls outside the trend line because of its high level of mass communications, while Australia and New Zealand show a high level of motor vehicles in relation to mass communications. Both show a commindex that is commensurate with their GNP level, but from the country profiles, it can be seen that they both have exceptionally high readings for 'Motor Vehicles per 1,000 population'.
Commindex and Steel Consumption
The trend line shows an exponential relationship between mass communications and steel consumption. Argentina is again comparatively high on mass communications given its level of steel consumption, while Japan, West Germany, and Czechoslovakia are relatively high on steel consumption in relation to mass communications. However, these three countries are all major steel producers and since their commindex values are commensurate with their GNP, the above results can be explained in terms of high domestic steel consumption, not relatively low communications.
Commindex and $ GDP from manufacturing
This scatter shows an exponential growth pattern. Two countries (U.S.A. and Canada) are relatively low on $ GDP derived from manufacturing given their level of communications. Both TJSA and Canada have unusually high proportions of primary (as opposed to manufactured) output because of rich natural resources. For this reason $ GDP derived from manufacturing is low compared to other high industrialised countries.

Table 2: Comparison of Commindex and GNP Ranks
- 1 Ranks by Ranks by Ranks by Ranks by
CountKy COllUTlidt?~ I G.N.P.per cap. Cosmindex G.N.P.per cap. Country Commindex G.N.P.per cap. Commindrx G.N.P.poc cap. -
ZTliKO -1.02 .90.00 1 3 Iraq -0.51 320.00 44.5 33 Ethi<lpia -1 .Ol no.00 2 1.5 Iran -0.51 3ao.00 44.5 37.5 fanz;ti)ia -1.00 100.00 3 4.5 Costa Rica -0.41 560.00 46 46 Saudi Arabia -0 . 99 440.00 4 42 Chile -0.38 720.00 47 52 Fakiatart Lo.90 100.00 5.5 4.5 Portugal -0.35 660.00 48 49 Sierra Leo;le -0.98 l‘U.00 5.5 14 Rumania -0.32 930.00 49 57 Ivory coast -0.97 310.00 9 31 Cuba -0.31 530.00 50 45 Haiti -0.97 110.00 9 6.5 Ecuador -0.2Y 290.00 51 26.5 India -0.97 110.00 9 6.5 Yuyosl avia -0.17 650.00 52 48 U<l‘VIdii -0.97 130.00 9 10.5 Venez~tela -0.15 QUO.00 53 59 Niyc:r ia -0.97 120.00 9 a.5 Panma -0.13 730.00 54.5 53 zamtji a -0.1)s 400.00 12 39 Clexico -0.13 670.00 54.5 50.5 Libya -0.93 1770.00 13 67 Sinyapure -0.04 920.00 56 56 KCny<l -0.92 150.00 14 13 POl‘Uld -0.01 1400.00 57 64 SLYlOiJiil -0.09 230.00 15 18.5 Ilong Kong 0.03 970.00 50 58 Al !wr La -0.88 300.00 16 28.5 Jmmica 0.04 670.00 59 50.5 ttollduras -0.~6 2RO.00 17.5 24.5 Lebanon 0.06 590.00 60 47 Ifilrx!eiia -0.U6 2uo.00 17.5 24.5 Ui-ll‘JU.3y 0.10 820.00 55 sutt3n -0.85 120.00 19.5 8.5 Spaj 11 0.13 1020.00
6”: 60
Ghana -0.85 310.00 19.5 31 Bulgaria 0.10 760.00 63 54 Norocco -0.84 230.00 21 18.5 Israel 0.19 1960.00 64 70 Tunisia -0.63 270.00 22 23 Italy 0.39 1760.00 65.5 66 Phi I ippines -0.R2 210.00 23.5 16.5 IlllllCJ;LKy 0.39 1600.00 65.5 65 Th.lil and -0.82 200 .oo 23.5 15 U.S.S.R. 0.49 1790.00 67 68 Dominican Rep. -0.82 350.00 2” 35 Czechoslovakia 0.61 2230.00 60 72 Jnduocsia -0.79 80.00 27 1.5 Ire1 and 0.6h 1360 . O,l 65) 63 t.t.\uritAnia -0.79 140.00 27 12 Austria 0.84 2010.00 70 71 Paral~uay -0.79 260.00 27 22 France 1.02 3100.00 71 82 Turhc,, -0.78 310.00 29 31 G.D.R. 1.08 2490 .oo 72 76 >lalav~ia -0.75 380 .oo 30 37.5 13olgium 1.23 2720 .OO 73 78 N ic,>l'agua -0.73 430 .oo 31 41 Norway 1.24 2860.00 74 80 GIJLI t ~‘llli~l ;I -0.72 360.00 32.5 36 Switzerland 1.35 3320.00 75 84 hhnle r Rep . -0.72 130.00 32.5 10.5 W. Ckrnmny 1.45 2930.00 76 81 EtJ,‘i-‘t ’ -0.67 210.00 34 16.5 Nether1 ands 1.55 2430.00 77 75 Vnni;u t i a -0.65 460 .oo 35 44 Fin1 and 1.60 2390 .OO 78 74 Greece -0.64 1090.00 36 61 Australia 1.62 2820.00 7Y 79 Jordan -0.62 25q.00 37.5 20.5 Japan 1.63 1920.00 80 69 El Salvador -0.62 300.00 37.5 28.5 New Zcai and 1.65 2700 .OO 81 77 Korea (Rep.) -0.61 250.00 39 20.5 Denmark 1.82 3190.00 82 a3 Co1 ombia -0.59 340.00 40 34 Argentina 1.86 1160.00 a3 62 Syria -0.52 290.00~ 42 26.5 U.K. 1.89 2270 .OO 84 73 Brazil -0.52 420 .OO 42 40 Canada 2.93 3700.00 85 85 Peru -0.52 450.00 42 43 U.S.A. 4.37 4760.00 86 06
Note ~~Commindexl~ includes Only newsprint consumption, T.t. and radio per 1,000 populations.

- 35-
Commindex and $ Population in Locations of 100,000 +
This scatter shows a lot of variation from the trend line showing that the growth of communications is linked to urbanisation, but that the relationship is not a very strong one. The two countries which fall well outside the trend line are Hong Kong and Singapore, showing a very high level of urbanisation (9% and 86% respectively) in relation to their level of mass communications. Both have levels of communications which are commensurate with their GNP levels, which suggests that income, rather than urbanisation, is a main determinant of the growth of mass communications.
Commindex and Expenditure on Food as '% of total private expenditure
Results reveal a weak linear relationship (negative) between commindex and food expenditure. Israel, Venezuela and Rhodesia fall outside the trend line. However, both Israel and Venezuela are slightly low on mass communications in relation to GNP, as well as relatively low on food expenditure in relation to their GNP, so that these two factors may explain why they fall outside the trend line. Rhodesia, on the other hand, has a level of communications commensurate with its GNP level, but a level of food expenditure (3C$) that is much lower than that of other countries in the same GNP grouping. The latter may be explained by the skewness of Rhodesia's income dis- tribution, favouring a high consumption of non-edible consumer goods by the minority.
Commindex and life expectancy
This scatter shows an exponential growth pattern. tancy of 68 years is reached,
Once a level of life expec- the growth of mass communications rises much faster
than that of life expectancy. The pattern is very similar to that of primary and secondary school enrolment, showing that until a certain level of GNP is reached ($1,000 in both cases) mass communications will rise faster than life expectancy. This implies that, at GNP levels below $1,000, health and education grow faster than mass communications.
Commindex and exports of raw materials
There is only a very weak negative correlation between these two variables, although both correlate well with GNP per capita. Hence it is felt that GNP, rather than a particular development pattern, is more important determinant to the growth of mass communications.
Commindex and $ Adult Males in Agriculture
This shows a negative exponential growth rate. Below the level of JO$ male agricultural population, there is a relatively faster growth cf communications in relation to the fall of the male agricultural population. The H level of adult males in agriculture is reached at GNP levels between $375 and $1,000. Thus mass communications expand at different rates in relation to various indicators of develop- ment. The next chapter investigates these different cross-sectional growth rates in greater details.
Individual Communications Indicators and Core Indicators, ,197O in Separate GNP Groups
Having considered the relationship of communications indicators to the core indicators for all countries, the researchers choose to look at a more detailed break- down by dividing the countries into five GNP per capita groupings (1970), using the

- 36 -
classification used in World Tables 76 (IRRD). The number of countries included in each group were as follows:
Group I - GNP per capita ($0 - 100): 16 countries Group II - GNP per capita ($101 - ZOO): 15 countries Group III - GNP per capita ($201 - 375): 22 countries Group IV - GNP per capita ($376 - 1,000): 23 countries Group V - GNP per capita ($1,001 and over): 27 countries
Total: . . . . 103 countries
The readings for each country were noted in its appropriate GNP grouping on the five communications indicators and on the ten core indicators. This particular breakdown was chosen in order to highlight the features of developing countries in the first four groups (below $1,000 GNP per capita) while including most developed countries for comparative purposes in Group V.
Since all the variables in question are highly correlated with GNP per capita, the researchers felt Justified in comparing the countries at various levels of development by GNP per capita groupings. The mean and standard deviation of each indicator in each GNP group was calculated and the maximum and minimum values on that indicator was noted. (See Table 3). Thus in group I, Burma has the highest newspaper circulation, while Burundi has the lowest; the mean for newspaper circulation is 4.62, calculated for eleven countries.
It would have been preferable to have used the same set of countries for all the indicators, but because of the problem of missing data the sample in each GNP grouping would have been drastically reduced (for example, taking only the five comrmulications indicators into account, the have been reduced from 16 to 4; taking all countries would have been reduced to I).
number of countries in group I would 15 indicators into account, the number
For comparative purposes, the means of each indicator were then standardised (with overall mean 0 , standard deviation I) (set out in Table 4). As in Part III, the mean of each indicator within each GNP group has been represented pictorially as a bar ohart, showing its distance from the overall mean zero (see Table I).
Summary of Anslysis in Five GNP groups
I. When the standardised means of the communications indicators are compared in the five GNP groupings, it is found that Newspaper Consumption and Telephones show very similar growth patterns (except in Group V where Telephones show a mean that is the highest of all the communications indicators).
2. The communications indicators and llSteel Consumption~~ and "Motor Vehicles" (and to some extent I'$ GDP derived from manufacturing I1 and "literacy") show growth rates that are comparable within certain ranges in each GNP groupinge This means that the growth of communications is in line with that of industrialisation and the consumption of Motor Vehicles, although in Group V the mean of "Steel Consump- tion" is ahead of that of the communications indicators. ~Literacyl~ and *I% GDP derived from manufacturing I1 means are well below the level of communications means in Group I, but well ahead of those in Group IV.
of
3. YExpectation of Life", ltcombined primary and secondary enrolment" and '1% Population in localities of 100,000 and overI* show similar growth patterns, with means well below those of the communications indicators in Group I and Group II, but

TABLE I
Core Indicators i Illustrating the Magnitude of Indicator
Newspaper Newsprint Telephones Bad io
n SGNP Groups rs in terms of Sta%dardised Meon Values
Television O/oLiterute Primary s2? Stee I $Xulbtibn Consumption Receivers Receivers adult pops schac+-ol- Consuyt ion
O/oMale labour o/cbDPfrom Motor in agriculture
0/oExports manufocturb~ raw materials Vehicles
E;p;$ation o/o,“,x~o~idture O/O& .. in loca!l t’ 14s of
KEY
GNP per Capita Groups
I $ o-100 IlIt $E lOl-200
III $ 201-375
ip $ 376-1000
Y Over $1,000
‘y5gi?-? 5-‘ziiE ‘r’n’niti~ 7l.i3iz 5Yi!izs ‘+iiGE i7iiz-s 6.NJ? per cap qroupinqs
. I” , ”

TA&.?. MEANS OF CCBiMUNKA’~lONS INDICATORS AND OTIIER INDICATORS OF DEVELOPMENT BY
I. O.N.P. pur cap. (SO-100)
G.N;P. PER CAPITA GROUPING
(MEANS AND STD. DEVIATIONS)
tiw,prhbt TulqJh”ne. ‘onsump- Per ion per 100,ooo capita POP.
7 0.18 ,w.o* 0.20 73.57 8.00 15.00 0.00 298.lN3 0.00 93.00
t
G.D.P. derived I.levlslor rocaivarr per 1,ooc
POP.
0.78 0.67
;:2 0.30
re,e,ision Literate receivers Adults as per 1.000 I toti
POP. POP.
2.06 37.94 2.17 20.58 8.00 8.00 7.00 85.00 0.00 19.00
I -- ,0.?2 3.45 18.97 13.00 16.00 3.w
I. 81.17 13.00 99.40 40.70
b0.m 3.61 3.00
65.00 56.00
L.18 47 .a* 3.59 7.85
13.00 13.00 12.00 59.80 1.70 40.00
36.83 14.2* 11 .oo LO.30
il.80
--
Radio receivers per l.l?ao
PUP.
4U.31 23.49 21.m 91 .oo 10.00
73.12 26 .a0 at.00 97.60
4.50

I”. C.N.P. (Mr cap. ,u37a-1,ow,
Islevicio” Literate r.caivars Ad”l‘f as
per 1.000 I total POP. P-P.
--
I-
-
54.45 75.32 33.43 15.83 a*.00 19.00
12l.00 90.00 2.00 37.00
8xprctrtlrn of Ill.? .f
birth - bott reres
Conbinsd pri- mary L socon‘?. ary enrdrrnt af n age op.
(5-19)
s.‘.oe, con- iUGip‘lOn kgs per
UP.
59.1, 99.52 32.4, 9.86 85.07 16.73
22 .oo 21.00 17.00 74.50 319.00 57.30 57.20 14.00 10.10
fdS@i”llOS rlulio Per recelvorr
100,ow per l,ocu
POP. POP.
zlz ‘,*t(4.17 159.59 3411.57 103.33
23.00 22.00 147"Q.m-l 346.00
looo.*~ 11.00
POptIll lt‘on ,a Localitia. Of 100,ooo 0‘
.ore a* I ot tot., pp.
z:z 22.00 93.10 11.70
WhlCl*, per 1ool
POP.
43.7, 9.03 7.m
56.00 31.09
20.53 57.OB 6.59 32.66
:9.00 21.00 28.00 99.10
9.00 6.40
! btc.tol
vohlcle per loo
PV.
2,..6b 12..7,
25.00 521.,0
22.70
-- IS3lCNl&‘iX receivers
,er l.ooo POP.
211.96 79.15 27.00
*,3.00 25.00
428.30 166.50
27.00 869.00
75.00
AJvlt .alP labour in
a9riful‘u*s as K Of total
.a?* lrbovr
15.60 a.97
26.00 33.90
3.50
(1970 U.S. dsllrrr)
24.72 34.70
5.,9 24.00
Id.00 24.M 42.00 al3.40
20.00 5.60
39.20 14.88 26.00 49.59 15.00
I --

----- ‘,‘.” ~slo9l * uver) 1 l.36 , L
---- -0.59 -0.57 -0.73 -0.60
--
-0.57 -0.55 -0.53 -0.76
-0.5, -0.47 -0.29 -0.70
-0.19 -0.21 0.04 -0.25
1.15 ,..2 1.19 1.36
Literate Corbined prl- Adults a* .ary L racm*.
I tot.1 L‘y P”‘Ol.‘m( YOP* as I Age op.
(5-19)
-1.25 -1.47
-0.75 -0.61
-O..Z -0.46
0.,2 0.31
I.12 1.09
steel Con- Ad”,, .a,o G.O.P. derived mport. of NO,Ol ltxp.?ct.tton Bxpondltur.
.u.ption. lrbour In from manufact- I ra” q terirl~ vohlcles or IIfO .t on rood .9 *
kgs per wricu1turs “ring *,s I J. 0 total per ,ooo birfh - booth TOf~l privata cap. a* (I of“ot.3 total G.O.P. 6xpolt. pop. .exll* Eonrwptio”
Dal* ,abovr (1970 U.S. dollrrr) Grpondi‘ura
-0.69 0.90 -0.98 0.611 -0.0, -1.20
-0.6s 0.45 -0.76 0.53 -0.59 -o.tla 1.36
-0.5, 0.28 -0.31 0.27 -0.50 -0.55 9.63
-0.19 -0.27 0.32 -0.23 -o.aa 0.38 0.32
1.50 -0.03 L.37 -0.93 1.41 1.13 -0.2.
Popul~‘iorl in Loc*lIt~~r of 100,ooo o*
.OKQ .s % of total pop. I4 -1.05
I
-0.90 Iz
-0.52
II I
0..5
0.70

:'.WLE 5: Standardised means ranked within each G.N.P. pet capita oroupinq
Tele- Radio phones receiv- -T- per ers per 100,000 1,000 POPa POP.
Liter- School ate Enrol- Adults ment (%I (%s)
Expect- aiion of life
Tel;- vision receiv- ers per l,CQO POP'
(8)
(10.5)
(14)
(15)
(5.5)
G.D.P. Exports from of xaw mnnu- mater- fact- ials uring (36) 1). (%I -
9 (4)
(10.5) (2.5)
(4) 1
4.5 8
(4) 12
Motor Vehic- les per '1,m POP-
(3) 14
.F;.P. per XPita rouping
roup I
News-
paper cir. p== 1.m POP.
(7)3).
(8)
(10.5;
(10)
(5.5)
News- print cons. PC= cap.
(2)
(5)
(12)
(11)
(7)
12 13 (1) (6)
15 I 14 (9) 12 (6)
--
(10.5)
13 coup II (4) (2.5) (7) 1
(13) 2
(12) 7
1 14
(9) (3)
----I- (7) (f-3) (6) coup III
coup IV
:oup v
Yk- (2) I (10)
(13)
---
(3)
2 6 3
(9) 11 (8)
1). Since we are comparing the means in terms of their distance from the overall mean zero, we can reflect the signs of these indicators for ranking purposes.
2). Not included in Groslp I
3) Erackets ( ) indicate which indicator means fall within the range of the means 0: the communications indicators.

-42-
well ahead in Group IV. This suggests that the growth of the health and education sectors move together with urbanisation until a level of GNP of $1,000 is reached. In Group V, "Population in localities of 100,000 and over", has a very low mean and a high standard deviation, indicating a big variation in levels of urbanisation. The other two variables, however show standardised means which are similar in magnitude, with small standard deviations.
Conclusions to Inter-Sector&. Analysis (Part IV)
In this particular part of the report the relationship between communication indicators and other core indicators of development are examined (the latter selected for the reasons outlined in the text, with appropriate reservations as to their validity). This inter-sectoral examination reveals a few central features which are important to reiterate before moving onto features of growth (1g60-1g70), geographi- cal and income distribution and time series analysis in the remaining sections of the report.
The scatter diagrams, showing both an exponential and linear relationship between communications and other indicators confirm apparent trends: radio is available at much lower income levels than newsprint and television, for example. At low levels, literacy, education and health indicators increase more rapidly than mass communications. It is only after 75f D school enrolment (on income above $1,000 GNP p.c.) that mass communications llovertakes~l the growth of this indicator. This
is perhaps the ri&t order of priorities for development purposes. The I1opportunity Cost" of investing in mass communications for a country with an income between $375 and 1,000 p.c. rather than other important sectors such as health or education must be carefully considered. But it is perhaps Just in this crucial lltransitional" income group that mass communications can assist the other sectors. The next step might be to consider the 23 countries which fall into this particular group and examine their communication needs in relation to their development strategy.
It is obvious from the consideration of certain other indicators like the export of raw materials that mass communications has much less to do with development pattern (or pattern of national income accumulation) than development strategy (or a plan for the allocation of public income).
Illustrating its close relationship to steel production and motor vehicles, mass communications indicators here reflect their close movement with a rise in GNP due to industrialisation or growth. Mass communi cations growth shows the opposite trend, of course, to indicators such as primary product concentration, $ of male labour force in agriculture and $ of income allocated to food expenditure.
While mass communications show a similar pattern to urbanisation, it is not a very strong relationship, indicating that the growth of mass communications has more to do with the national aggregate individual income than the internal distribution of the population. This can only be a tentative hypothesis as the definition of ~~urban1~ used in the study~s~core indicator is based on ISpopulation in localities of more than 100,0001~, which-may be too large an agglomeration to note significant changes in developing countries. Confirmation or further analysis of these inter- sectoral trends are now considered in terms of growth on a global basis and in terms of time series data of particular uountries.
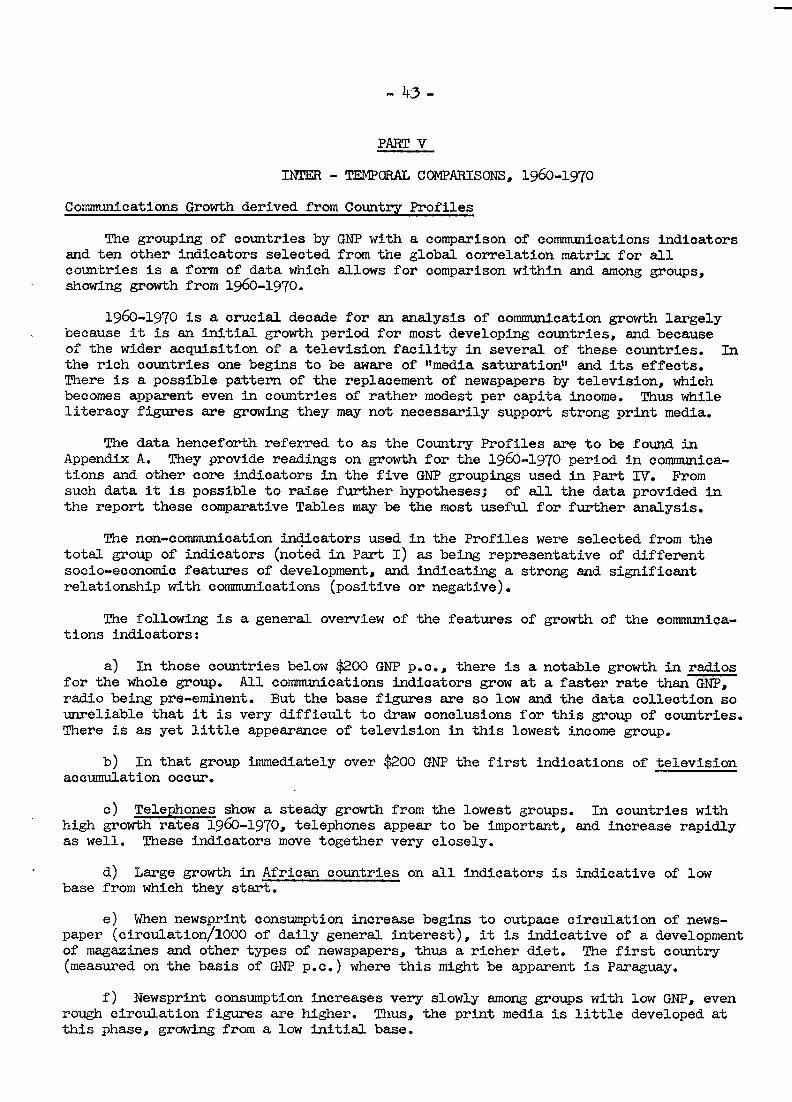
- k3 -
PARTV
INTER - tt?ma'QRAL COMPARISONS, lg6o-lg7o
Communications Growth derived from Country Profiles
The grouping of countries by GNP with a comparison of communications indicators and ten other indicators seleuted from the global correlation matrix for all countries is a form of data which allows for comparison within and among groups, showing growth from 19604970.
1960-1970 is a c~~ial decade for an analysis of communication growth largely because it is an initial growth period for most developing countries, and because of the wider acquisition of a television facility in seversl of these countries. In the rich countries one begins to be aware of lImedirt saturationlJ and its effeots. There is a possible pattern of the replacement of newspapers by television, which becomes apparent even in countries of rather modest per capita income. Thus while literacy figures are growing they may not necessarily support strong print media.
The data henceforth referred to as the Country Profiles are to be found in Appendix A. They provide readings on growth for the 1960-1970 period in communica- tions and other core indicators in the five GNP groupings used in Part IV. From such data it is possible to raise further hypotheses; of all the data provided in the report these comparative Tables may be the most useful for further analysis.
The non-communication indicators used in the Profiles were selected from the total group of indicators (noted in Part I) as being representative of different socio-economic features of development, and indicating a strong and significant relationship with oommunications (positive or negative).
The following is a general overview of the features of growth of the communica- tions indicators:
a) Ln those oountries below $200 GNP p.c., there is a notable growth in radios for the whole group. All communications indicators grow at a faster rate than GNP, radio being pre-eminent. But the base figures are so low and the data collection so unreliable that it is very difficult to draw conclusions for this group of countries. There is as yet little appearance of television in this lowest income group.
b) In that group immediately over $200 GNP the first indications of television accrumulation occur.
6) Telephones show a steady growth from the lowest groups. In countries with high growth rates 1960-1970, telephones appear to be important, and increase rapidly as well. These indicators move together very closely.
d) Large growth in African countries on all indicators is indicative of low base from which they start.
e) When newsprint oonsumption increase begins to outpace circulation of news- paper (circulation/1000 of daily general interest), it is indicative of a development of magazines and other types of newspapers, thus a richer diet. The first country (measured on the basis of GNP p.c.) where this might be apparent is Paraguay.
f) Newsprint consumption increases very slowly among groups with low GNP, even rough oirculation figures are higher. Thus, the print media is little developed at this phase, growing from a low initial base.

- 44 -
g) It would be possible to select specific countries which show an unusually high rate of growth in radio and television for their particular group (for example, Jordan, Ecuador, Iraq, Ghana) and check the policy/planning profile of these countries in mass comication.
h) While all communications indicators follow growth in GNP, radio and television are much more variable in low GNP groupings (starting from a very low base) than newsprint consumption or telephones which follow it more closely.
i) Telephones show a consistently moderately higher index of growth 1960~1970, thus indicating (as supposed with the deciles) that it may be an enabling factor for GN'P increase. For example, the substantial growth in Hong Kong and Taiwan both of whioh have strong growth rates 1960-1970.
j) Changes between $376 and $1,000 GNP seem to be particularly important. Note the slower growth in newspaper ciroulation of daily general interest uompared to GNP. There Ss an apparent biversifioation in terms of other newspapers, and maga- zines. Newsprint consumption does not increase as fast as GNP but it shows a notable improvement over newspaper circulation. It is in this group that the first large increase in television occurs.
k) In the group of countries with GNP of $1,000 and over, newspaper circulation definitely shows a slower growth compared to GMP, the highest being in the Soviet Union. Newsprint consumption growth in relation to GNP is slower except in twelve out of 27 countries. Newsprint consumption means growth in this group is slower than in the group preoeding ($376~1,000). It is tempting to suggest therefore that in countries where television has really established itself ell types of print media 'grow at a slower rate (or has a llsaturation~~ point per&%3 been reached for newsprint consumption above a certain income level?).
1) It is necessary to compare print media figures with literacy for these particular groups, in order to indicate that the increase in a literate population does not necessarily mean commensurate growth in the print media.
m) For the most advanced group (over $1,000 GNP) it would be interesting to consider the viability of the print media in the twelve countries which show a commensurate relationship with the growth of QN?.
Indices of Growth of Communications by GNP Groups
Using the breakdown of countries into the five income groups, an index of growth for each indicator for each individual country was derived by dividing its 1970 value on that indicator by its 1960 value. This index of growth was then standardi- sed by the index of per capita product growth. The latter index was given by the 1970/1$0 ratio of GNP per capita, using GNP per capita at constant market prices. The mean value of growth of that indicator was then calculated for that group. Where there were no data available in the World Tables for those two time periods, the index was calculated from the U.N. year book of National Accounts Statistics 1974, Vol. III (per capita product at constant prioes). Some countries, however, had no GNP data (either for 1960 or for 1960 and 1970) end had to be excluded.
Although data analysis is not provided the following conclusions were apparent:
1) As a general rule, the higher the GNP level, the lower the rate of growth of communications over time.

- 45 -
2) There is no correspondence in the growth rates of the communications indicators between the GNP groupings. Radio has grown faster than the other indicators in Groups I, II and III, but loses its relative importance in groups IV end V. Telephones show the fastest growth rate in Groups IV and V, but a relatively slow growth in Groups I and II. News- papers rank second in Groups I and II, but last in Groups IV and V. News- print ranks third or last from Group I to Group IV, but is second in Group v. These results are in general accordance with the cross-section rates of growth of the communications indicators in relation to GNP.
3) All communication indicators have grown faster than GNP per capita in each GNP grouping, with the exception of newspapers in Groups IV and V and radio reaeivers in Group V.
4) The variation of the growth of communications among different groups of countries based on income is probably much less helpful than an analysis of the variation of countries within a similar range, in relation to GNP and other indicators of development. This type of information can be derived from the country profiles in Appendix A, which are printed in full in order not to allow assumptions to obscure some of the distortions which are inevitably inherent In any such group comparisons.
Growth of Communications Indicators and other Indicators of Development (196049'j'O)
The prooedure used to standardise the communications indicators by GNP per capita could not be applied to all the ten core Indicators (only to those expressed in per capita terms), therefore a different method for comparing the growth of the comnnmioation indicators with the ten core indicators over time was used. There was no way of standardising these indicators, nor of comparing percentage differences over time because of their different definitional bases.
Hence the 92 countries (which had readings on GNP per capita 1960) by GNP were ranked and divided into groups of twenty (except for Group V which only has 12 aountries). Then the 1970-1960 differences of each of the indioators for all the oountries in each group were calculated and correlated against each other so that these would show the growth patterns between these two periods. If the correlation was significant, it could be deducted that there was a linear association in the rates of growth of the two variables concerned and that these two moved together over time.
It must be noted that although these countries are still in five GNP groups, these groups are not the same as those used in Parts 3 and 4. The reason for this is that in order to have sufficient observation in each of the cells of the oorrela- tion matrix the number of countries in each group had to be roughly similar. There- fore it will be noted that the GNP ranges inclusive to each group differ from the five groups used previously. The GNP figures at 1960 market prices were used because the changes from that base year were being analysed (the GNP groups previously used are based on 1970 market prices).
This particular section of the Report, while responding to the central problems raised in the brief by UNESCO is in some respects the least satisfactory. Since the growth of one indicator does not relate necessarily to the growth of another (except in restricted cases) the rates of change of social indicators cannot be worked out. They were not designed for that purpose and therefore the attempt to see whether there is a linear growth pattern in comparative terms is the only way to overcome lack of oomparability in definitional terms. While suggesting patterns of growth, it cannot be the basis for interpreting the causality in those patterns or analytical inter-relationships.

- 46 -
The following countries have been included in each group:
Group I: GNP per capita ($0 to $95.4 at 1960 market prices)
Nepal Uganda Chad Ethiopia India Niger Rwanda Guinea Burma Malawi Dahomey Pakistan Tanzania Kenya MaiLi Upper Volta Zaire Togo
Nigeria Indonesia
Group II: GNP per oapita ($95.5 to $188.4 at 1960 market prioes)
Cameroon Ivory Coast Thailand Morocco Central Afriuan Rep. Egypt Bolivia P=4iww Sudan Vietnam Rep. Khmer Rep. Jordan Yugoslavia Ghana Taiwan Laos Korea Saudi Arabia Syria Honduras
Group III: (1) GNP per capita ($188.5 to $341.4 at 1960 market prices)
Turkey Nicaragua Iraq Brasil Tunisia Columbia Senegal Hong Kong Iran Malaysia El Salvador Mexioo Peru Guatemala Ecuador POrtugal Algeria L&a Dominican Rep. SP& Philippines
Group IV: GNP per capita ($341.5 to $1,248.4 at 1960 market prices)
Panama Argentina Jamaica Ireland Costa Rica Italy Lebanon Puerto Rho Greece Austria Netherlands South Africa Singapore Venezuela Japan Finland urw3-y Israel Chile
Group V: GNP per oapita ($1,248.5 and over at 1960 market prices)
Belgium Australia Norway New Zealand Denmark Switzerland Germany (Fed.Rep.) United States Sweden France Canada United Kingdom
Group I. In the group of correlations are not
co 2tries with the lowest GNP per capita most significant. 'Q"> There is, however, a positive correlation
(0.05 level) of significance between ?tPrimary and secondary school enrolmer-0 and "Life Expectanoy(l. This correlation confirms the uross-sectional results that, at very low levels of GNP, the growth of the education and health sectors tend to move together. The other two significant correlations ("Television~~ and 11% GDP from manufacturin@, "Television" and "Life expectancyt') are more difficult to interpret. From the cross-section results, one would have expected a high correla- tion between *tTelevisionfl and "Motor vehiclesl', as well as between tlTelevisioi+ and
(1) Group III consists of 21 countries because Spain and Portugal have the same GNP per capita'. Hence Group IV has 19 countries.
(2) All correlations with less than five oases were ignored.

- 47.
I'$ GDP from manufacturin@. It is possible that, had there been more data available (instead of only three cases for steel and motors correlated against television), these two correlations might have been highly significant. As for lTTelevisfon" and "Life expectancy", the highly significant correlation may be a spurious one, due to the fact that the 1960 base for television was abnormally small for most of the countries in the group.
In Group II, as expected, "Motor Vehicles", "Steel Consumption" and to some degree "5 GDP from manufacturing I1 are highly correlated with the communications indicators (with the exceptions of radio). "Motor vehicles" correlates highly with "Telephone.9, "Television" and lTNev?sprinW; l*Steel Consumption'* oorrelates highly with "Telephones" and "Newsprint'*; IT% GDP from manufacturi@ correlates highly with "Telephones" . Furthermore, 'lTelephonesT1, '*Televisionl, and TINewsprint" are all highly intercorrelated. IT% Males in Agriculture" is highly negatively correlated with l*Radio". In tne cross-section results, these two vsriables showed large changes in relation to the other variables in the low GNP countries. It is interesting to note that I'$ Males in Agriculture I1 also shows highly significant correlations with "Telephones", '$ GDP from manufacturing" (negative correlation) and with '1% Exports of raw materials" (positive correlation) in this group. 'I$ GDP from manufacturing" is also highly negatively correlated with '1% Exports of raw materiak?: the high correlation between the two variables and '1% GDP from menu- facturing" may explain the high correlation between '$ Exports of raw materials*' and '1% Males in Agriculture". As for the significant correlations with '1% GDP from manufacturing", these can be explained by the fact that at such "low" levels of GNP the growth of the manufacturing sector would be directly linked to the foreign income received from primary exports, while the fall in the agricultural population would be nearly completely accounted for by the growth of the manufacturing sector (since the service sector is very small at suuh low levels of GNP).
In Group III, "Motor Vehicles" and "Steel Consumption" are high1 with the communications indicators (with the exception of "Radio").(l T
correlated However,
"GDP from manufacturing" is not significantly correlated with any of the communica- tion indicators as is '1% Males in Agriculture". It is possible that the growth of the service sector occurs at this point (including the growth of the communica- tions sector which the cross-section evidence shows as occurring around this GNP level) and that the fall in the agricultural population is now more closely linked to the growth of the service sector than that of the manufacturing sector. "Life expectancy" is highly correlated with "Primary and secondary school enrolment" as in Group I, while's GDP from manufacturing'* is highly correlated to both.
'$ Population in localities of over 100,000 or over" is highly negatively correlated with "Life expectancy". Cross-sectional evidence showed that "Life expectancy", "Primary and secondary enrolment I' and '$ Population in localities of 100,000 and over" had similar growth rates until a level of GNP of $1,000 (1970 prices) was reached. The present evidence shows high correlation between "Life Expectancy" and urbanisation in this group (in Groups I end II the number of oases is insuffic%ent), while "Primary and Secondary Enrolment 11 and "Life Fxpeotancy(1 are only highly correlated in Group I. It is possible that urbanisation is a more important factor in the distribution of health care (for example, through the provi- sion of vaccination uentres in cities, sewage disposal, etc.) than it is $n the distribution of school education.
In Group IV, "Motor Vehicles" and "Steel Consumption" correlate highly with "Telephones" and "Television", but not with "Newsprint". "Radid' shows a signifi- cant correlation with "Steel Consumption *I although it does not correlate signifi- cantly with the other communications indicators. "Telephones" and *'Television",
(1) As in group II, "Telephones'*, l'TelevisiorY' and "Newsprint" are all highly inter- correlated.

-48,
though not "Newsprint" are highly intercorrelated. Cross-section results show that, at these GNP levels, there is not only an expansion in Newsprint Consumption, but also a great variation from country to country. Group IV includes Singapore, which is particularly high on Newsprint. This wide variation between countries probably explains the insignificant correlation with the other communications indicators.
Urbanisation and "Life expectancy++ are no longer highly correlated as in Group III, although +'$ Males in Agriculture'+ and "Life expectancy" are negatively corre- lated. It is difficult to find an explanation for this correlation other than through indirect evidence from the cross-section results. It seems plausible that, in this GNP range, the two variables might move together at a constant rate over time, the direct link between them being through GNP. Similarly "$ Exports of Raw Materials+' are highly correlated to "Steel Consumption" and "Motor Vehicles" in this GNP grouping.
In Group V, '+Radio" is significantly correlated with "Television" and "Telephones" although there is no significant correlation between the latter two indicators. This high correlation with "Radios' may be explained by the fact that, at high GNP levels, the growth of television and telephones continues to expand, while that of radio contracts proportionately. This is certainly true of television and radio which become substitutes at high income levels (note that 'Television+' only correlates significantly with "Radio"). "Telephones++ also correlate significantly with "Newsprint".
"Motor Vehicles+' and "Steel Consumption++ are no longer significantly correlated with the communications indicators, nor with each other. Since this group covers a wide GNP range, there is a big variation in each indicator from country to country. "4% GDP derived from manufacturing' correlates highly with 'Radio" and 'Television'+, while '$ Population in localities of 100,000 and over' is found to be highly corre- lated with "Telephones". Furthermore, "Steel Consumption++ correlates highly with "Life expectancy+', with "5 Males in Agriculture+', although "Life expectancy+' and "$ Males in Agriculture" show no significant intercorrelation in this group.
Conclusion
This summary of the correlation results underlines some of the significant features which bear out some of;the patterns previously encountered. Many of these variables are, however, not significantly related or perhaps only spuriously related. One must also beware of interpreting changes based on aggregate groupings of this kind since the variation within them may be significantly greater in this type of analysis which adds the dimension of change over time.

- 49 -
PART VI
TIME SERIES (lg6o-1975)
Time series data on the growth of communication and core indicators was con- sidered to monitor some of the trends noted in the aggregate cross-sectional analysis (Parts III and IV). In this type of quantitative analysis, trends often observed in cross section comparisons are not often borne out in the time series analysis. In view of the difficulties of tracing growth trends observed in relation to growth in specific countries would be more obvious and therefore more useful for analysis.
The countries were chosen to represent a reasonable geographical spread including North and Sub-Saharan Africa, Central America, the Caribbean, Latin America, the Middle East, South Asia, South-east Asia and Europe (both capitalist and socialist development). The choice of countries was influenced by the availability of data. Thus developing countries of particular interest, like Tanzania and Cuba, had to be omitted because of poor readings on the necessary indicators.
Choice of Indicators
Communications
Among the mass communications indicators used are newsprint consumption per capita in kilograms, and television receivers per 1,000 inhabitants for reasons out- lined earlier in the report; these are felt to be good quality variables. Regret- tably radios per 1,OOC population (a most central feature in analytical terms) had to be omitted because of its poor quality and reliability. Similarly newspaper circula- tion is not used because of definitional problems. Included in this series are telephones in use per 100 inhabitants(') because of its previously observed importance as an indicator of development and Domestic Mail Traffic (number of items per capita) to complement the group of communications indicators. For the latter relatively good quality data is available. (Source: UNESCO Statistical Yearbooks).
Education The primary school enrolment as a percentage of children of primary school age
is an "adjusted" ratio, using a population figure which corresponds to the actual duration of school in each country. It is an attempt to minimise the effect in the calculation of differences in the national school system, thereby improving inter- national comparability of the data. (Source: UNESCO Statistical Yearbooks).
Health
The expectation of life at birth in years from the UN Demographic Yearbook is one of the most sound indicators of the state of health of the total population. The per capita protein supply in grams per day from the FA0 Production Yearbook complements the demographic indicator but gives some estimation of the quality of the diet of the population throughout life.
Employment
From the ILC Yearbook of Statistics the percent of the economically active population in agriculture and industry used separately indicates the composition of the labour force and the rate of employment. One would expect the percentage to be greater in agriculture for most developing countries, and the opposite for developed or highly industrialised countries using technology to reduce the need for a large work-force in agriculture.
Industrialisation Of all the indicators in this field, steel consumption per capita in kilograms
(from the UN Statistical Yearbook) seems to be the least difficult to interpret.
(1) In previous calculations this measure has been used per 100,000 inhabitants.

- 50 -
Although its use perhaps assumes a certain direction of industrialisation, it is very closely associated with GNP per capita, and also with most of the core communi- cation indicators.
Urbanisation
In contrast with the indicator used in the previous analysis, the indicator for urbanisation used in the time series data is urban population as a percent of total population. The definition of urban in this case is left to the national statistical offices of each country rather than being based on settlements of 100,000. Although the definitional base obviously differs, each can be considered more realistic in the national context.
Some Problems of Analysis with Scattergram Codes
Transforming to standard deviation units implies that variations from year to year are measured in units reflecting average variation over the total period. If 'this average variation is low what appears to be dramatic fluctuations may result. The relevance of such fluctuations can only be assessed by considering the individual variable for the particular country. For example, a drop in the life expectancy for Israel from 72 years in 1961 to 71 years in 1969 is in fact a dramatic change. By contrast, a drop in the primary school enrolment from 96% to 94% for Yugoslavia from 1960 to 1965 may be less important. Unfortunately these fluctuations are illustrated very dramatically in the visual presentations.
Where the points seem to fit closely to a straight line they are probably based on a data estimation only. Given the weak statistical base for many developing countries, this tendency is quite apparent. For some cases, this may be attributed to the rounding off of very low values, or interpolation for gaps in the data from previous years.
Country Profiles based on twelve Indicators
One of the most striking conclusions that can be drawn when observing the national growth patterns as a whole is that only certain countries of the total group show a definite linear growth pattern on all indicators around GNP. These are: Korea, Iran, Singapore, Yugoslavia, Poland, Spain and Japan. $378 GNP per capita per annum.
Korea is the only one'below Three are in the income group $375-1,000 GNP per
capita, and three fall in the highest income group. Therefore it might be safe to assume that the process of linear growth (at least on the indicators presented) is difficult to achieve in the low income groups. In the first group of five countries, all of which are below $375 GNP per annum, Kenya and Thailand begin to show some regular pattern of growth with the notable exception of two communication indicators.
Individual patterns of national development are different compared to aggregates based on GNP or regional location. Thus countries with similar levels of development (measured in GNP terms) may have a contrasting pattern from others, with which they have been associated in the previous analysis. In planning terms, it is essential to consider these patterns in conjunction with development policies in order to con- struct a realistic base rather than work from aggregates and try to project communi- cation needs.
Changes from a low base are difficult to interpret because minute changes show somewhat misleadingly dramatic fluctuations. BesSdes, given the state of the statistical departments in most countries in the initial phase of development, projections from these levels may be very difficult to obtain.

- 51 -
Worthy of note are some specific features particularly in communications growth. Television receivers often show significant growth in relation to income, even in countries of relatively modest GNP, like Kenya and the Dominican Republic. This was also noted in growth figures in deciles among that group of countries of low incomes with the new acquisition of a television facility. Domestic mail and newsprint consumption do not follow the GNP per capita increase in many of the countries examined. Telephones, which have been considered elsewhere in this study as an enabling feature of growth especially among low income countries is noted in sharp rise in a number of countries, although starting from a fairly low base particularly in middle income countries (including Chile, Argentina, Korea, and the Philippines, Iran, Yugoslavia, Poland and Spain). Part of the explanation as to why telephones lie at a lower relationship to other communication indicators is that the calculation begins from the base year of 1966. Many of the countries do not have readings on some of the important nutrition and employment indicators, making this comparative analysis that much more limited.

PARTVII
INCOME DISTRIBUTION AND ECONOMIC DUALISM
This particular part of the report attempts to examine the relationship between income distribution and communications in various countries. Working, from national statistics on income distribution and comparing these with the development of mass communications is but considering the tip of the iceberg of studies required in this field. Firstly, they are based on income approximatfons, many of which are difficult to compare and second, they ignore the social and cultural features of unequal. access to mass sommunications which may or may not be related to income inequality. Third, and perhaps most important, one is oompsr%ng a distribution quantity of income with a national aggregate on communications, which is not based on distribution, therefore they are not strictly comparable except in the terms layed out in the text. This was inevitable because of the necessity of using a national quantitative base for communications. Data on this subject ought to be collected on the basis of national studies from which some hypotheses might emerge.
Many scholars of communication who have considered the growth of various media in the decade between 1960 and 1970 are at a point of reconsidering rather orthodox Indices of i f relationship to development in favour of its unequal distributfon in the society. 1) It has been noted that mass media campaigns have usually had the greatest impact on the most advantaged segments of society (literate, higher incomes, and urban), and highly unequal access of communication also reflects or may possibly reinforce already existfng disadvantages.
In attempting to classify countries according to patterns of development and subsequently observing the configuration of communications growth or spread of communications, the possibility of rank- countries according to dualism was considered. The initial idea was to consider how these countries which showed a cleavage between their modern sector (industrial, extractive or cash crops agricul- ture based on modern techniques) and their traditional or non-monetised agricultural or hand production sector rated on the growth of communications. It was thought that this type of cleavage may possibly have some influence on the total stock of communi- cation or their allocation. But although Adelman and Morri s in their paper Economic Growth and Social Equity in Developing Countries (1973) do offer a classification scheme for ranking countries, it was felt that given the numerous problems of definitional vagueness this type of analysis was not quantitatively possible.
Income Distribution and Communiaations
The 31 countries listed in Table I are those which appeared in the UNRISD Data Bank List of Countries; whiah had what was considered to be satisfactory income distribution data contained in the IBRD publication World Tables 1976 (pp. 514-517, Social Indicators Table 3), and for which the researchers of this study had some information on communications development.
A number of countries, although appearing on the UNR'ISD Data Bank end attri- buted with income distribution data by the IERD were excluded because of the quality of the data. These countries were Argentina, Lebanon, the Dominican Republic, Romania, Liberia, and Israel. Despite these exclusions the data is still by no means strictly comparable. As can be seen from Table I, it applies to different yesrs for different countries. Furthermore, the unit of data collection varied from country to
(1) Notably E. Rogers, Communications and Development, Sage Publications 1976.

- 53 -
Table 1. Income distribution ranked by share of Lowest 20% and Highest 5% of National Income
(A) (8) (Cl Country & Year 96 of National
to which data Income % ofI;,";;& (B) + (A) - g ; 5
zig Y refers received by received by
Lowest 20% Highest 5% I
-‘j: f I c $

- 54 -
country among the following definitions - households, income recipients per capita, or economically active population. The IRRD states where possible the data was concerned with the share of the Top 5% and Bottom 20$ of Households but this data was not available for many countries.
Methods of Ranking
RANK (A) r&s the 31 countries listed from 1 to 31 according to the inequality of their income, based on the criterion of the $ of National Income Received by the Lowest 20s. A ranking of 1 indicates that the country in question has the most unequal distribution of income based on this criterion, whereas a ranking of 31 indicates that this country has the most even distribution of income. When tied scores occur each of them is assigned the average of the ranks which would have been assigned had no ties occurred.
The RANK (B) column and RANK (C) column follow the same procedure as the RANK (A) ooltmm except that in each uase a different criterion is used as the basis for determining the ranking from 1 to 31, or from the most uneven to the most equal distribution of income. The basis in the RANK (B) Column is the $ of National Income Received by the Highest 576, whereas in the RANK (C) column the basis is the ratio of the $ of National Income Received by the Top 5% to the $ of Income received by the Bottom 2076.
These three rankings and rankings for this same group of countries were then used to ascertain whether income distri'oution was an important variable in the determination of the extent of communications development in a country.
Methods of Correlation with Literacy and Communications
Income Distribution rankings based on these three criteria were shown against rankings of Adult Literacy, Newsprint Consumption per capita, Television Receivers per 1,000 Inhabitants, Telephones per 100,000 Inhabitants, Newspaper Circulation per 1,000 Population, and Radio Receivers per 1,000 Population. The statistical method used to determine whether any association existed between Income Distribution and these six indicators was the Spearman Rank Correlation Coefficient (rs).
In the Anelysis each of the communications variables and literacy was considered separately in relation to the three remaining systems on income distribution. Although the detailed analysis is not included in the text, it seems to bear out the following general conclusions: it seems safe to accord an influence independent of GNP per capita to the Income Distribution obtaining in a country; of the three measures of the equality of income distribution only the $ share of the top 5% in National Income consistently produces significant Spearman Rank Correlation Coefficients (it is only in the case of radios that no association with this measure is observed); the share of the bottom 20$ in National Income fails to appear as an explanatory variable in communications development; the ratio of the Top 5% to Bottom 2076 similarly does not appear through the tests to be an important explanatory variable in determining communications development; and the influence of income distribution is obvious when communication development is considered against this variable for countries of very similar GNP.
- 55 -
PAETVIII
INVESTMENT &ID PRODUCTION IN MASS COMMUNiCATIONS
mvestment and Capital Expenditure in Communications
in order to offer any meaningful explanation of the relationship of the growth of communications to planning, data on investment is essential. Thus far no such systematic data has been colleuted for mass communications. Using available sources (I.T.U., I.B.R.D.. O.E.C.D.), partial data was set out in Tables (not included in the text). These data are difficult to interpret with any exactitude.
Investment in Telecommunications
Countries are ranked according to their level of GNP and investment in tele- communications as a percentage of total fixed capital formation offered for two years as close to 1967 and 1973 as possible. These years were chosen as base years for comparison, principally because of their comparability with data from the I.B.R.D.
The Economic Survey of Telecommunications, I.T.U. GAS-5, 1972, delineates the extent to which indicators of growth relate directly to GNP, and this is confirmed broadly by the investment proportions in this field. Mean investment appears to increase over time in t'ne richer countries, but the two base years for countries below $1,000 GNP does not show mean growth. Figures for countries with GNP below $1,000 GNP per annum show a greater percentage range of investment. A feature of investment in richer countries appears to be stabilisation about a level between 2% and 4% with a few exceptions. In the poorer countries, investment is much more sporadic in the early phases of accumulation, thus some countries illustrate a large capital outlay in one year.
Capital Current Expenditure
The expenditure in communications in those countries, starting from a low base, is obviously on capital outlay. One assumes that this may be in this decade a ground receiving station for both television and telecommunication and the origin of tele- vision. In most countries current expenditure is below 3.5% compared with between 15 and 2076 in education. Certain of the Asian and African countries show a sharp rise in current expenditure while in Latin American countries there is a decline. The Latin American countries start, however, from a much higher base. In countries where current expenditure rates in communication are variable, they are much less variable in education.
Gross Domestic Product in Communications and other Sectors
This is not a very productive sector compared to the level of investment and expenditure allocated to it, although in all countries except Argentina it appears to be rising.
Newsprint Production and Newsprint Consumption: A focus on LDC Producers
Newspaper production and circulation is critically affected by a number of factors such as transportation and literacy. Given the substantial shortages in newsprint since about 1970 and its high priae rises on the world market, the relationship between newsprint production and consumption was considered. Of particular interest was the question whether producers had an advantage over non-producers, who would have to use foreign exchange to import newsprint.

- 56 -
The method utilised involved the pair- off of those countries which produce newsprint (excluding the advanced countries and those whose production is exceedingly small), against other non-producing, or very minor producers, which were of similar GNP per capita 1972 according to the World Bank Atlas. This pairing was arbitrary where a large group of countrfes existed and had much the same GNP. However, attempts were made where possible to pair countries either by geographical proximity or cultural similarity, or if possible by both. But it was not always possible to find criteria other than similar GNP per capita.
After pairing the two countries in each pair were compared by Newsprint Consump- tion per capita in 1965 and 1972 and by production of Newsprint per capita in 1972, in order to ascertain whether local production seemed to encourage greater consump- tion.
From the results it is difficult to infer any strong tendency for producers of newsprint to consume more than non-producers of a similar GNP. Five of the pairings show producers consuming more than non-producers, five pairings show the reverse, and one pairing indicates similar consumption.
The same pairings, that is by similar 1972 GNP per capita, were considered further. Imports in .OOO metric tons for the period 1965-73 were compared with -the quoted CIF value in .OOO $ for the same period. By finding the ratio of these figures year by year.a unit value in dollars per metric ton could be extracted and thus an indication of the price movement over the period could be gained. !This price movement, since it is CIF based, will reflect not only upward production cost trends but also similar trends in freight rates and insurance charges. Over the period a very rough indication of the price movement for most countries would be $4 120-160 in 1965 to $170-210 in 1972.
From this type of analysis, it was not possible to demonstrate that producers have a relative advantage which may shape their local consumption of newsprint. It may, for example, be more profitable to sell newsprint rather than consume it all, especially if the world market price remains high. On the other hand, some countries have introduced rigorous newsprint allocation internally, as they only produce a small part of their total requirements.
_

- 57 -
PARTM
CONCLUSION
This study was originally commissioned with a particular aim in mind, to relate the study of indicators to communication planning. We feel that we have raised a number of very interesting features in the course of the analysis which point to certain aspects of the relationship of communications to the general processes of development. This type of work can only provide an initial base for suggesting hypotheses which require further confirmation. It is more than a simple intellec- tual exercise, but less than a coherent analysis of I1pay sensitiveI' indicators. The study considersxe highly practical aspects of the development process, but it would be impossible from such an initial enquiry to identify different types of development processes and impute from this analysis how it ought to be in planning terms. We are, however, pleased with the significance of some of the results and have endeavoured to present them in such a way that they would be a ready reference for planners who wished to compare their country's llperformancerl relative to others in their region or GNP group. We hope that we have suggested certain hypotheses which will interest scholars to take the much needed steps further towards verifica- tion. The study falls short of its initial aim for a number of reasons. The first which has been mentioned throughout is the weakness of the data base. The second is the mistaken consideration, we feel, that one can predict from a quantitative empirical enquiry on communications data at this stage what ought to be the elements of the planning process. It is certainly appropriate to consider all types of communications including telecommunications and mass communication as a critical requirement for planning, or a powerful tool for political and social organisation. But mass communications is much more difficult to research for policy implications precmy, because it is less an enabling mechanism of industrialisation, as is telecommunications, than a means of ensuring a distribution of information to people, among other things. In so being, therefore, its impact can hardly be measured in quantitative terms, any more than the number of telephone receivers or exchanges tells you about the efficiency or quality of the service in a developing country, albeit assuming that it does assist the processes of commerce and industrialisa- tion.
Communications and Other Social Indicators: the Problemsfor Planning
It is very difficult to use social indicators in general as a planning tool because of the unsystematic relationship between them. As in the case of the communications indicators, composit social indicators have no underlying theoretical structure which explains their relationship. Such indicators cannot indicate results, even given a certain input of resources, as analytical transformation is lacking. In the Introduction to the Report we have surveyed the lack of theoretical models which were available in the literature, and perhaps most centrally of all, the absence of analyses which would situate communications in relation to other aspects of social and economic development. Before such quantitative work is undertaken again, it is advisable to commission at least some studies on mass communications and GNP per capita level, disaggregating from telecommunications.
It might be useful to compare this work to other recent studies on composit social indicators like the UNRISD general development index(l) or the Physical Quality of Life index (P.Q.L.I.).(2) Th ese are attempts to designate non-economic
(1) This general index constructed on the basis of correspondence points among indi- cators, set out on the basis of a best-fitting line cannot be used for inter- temporal comparisons. UNRISD Vontents and Measurement of Socio-Economic DevelopmentV1, 1970.
(2) Overseas Development Council and J.W. Sewell, The US and the World Development Agenda, 1977

- 5’8 -
measures of development in some quantitative form. In the case of some of these measurements, they relate to the need to consider a basic needs strategy in development planning. As in the investigation of communications indicators, however, there are at least some scholars (1) who still prefer to relate these measures to incomes (GDP or GNP) because of: 1) the incomparability among indicators, 2) the weakness of the theoretical base implied in composit measurements, 3) the lack of inter-temporal comparison permissable.
At the very best, therefore, indicators may be used to monitor the outcome of certain planned policies, especially when sufficiently disaggregated and considered in terms of features of internal distribution. If, in the context of national planning, targets are set for communications growth, they can be thus analysed.
Above all, indicators ought to be collected in relation to the development strategy of a country, not an economic development pattern (the non-significance of which has been noted in Part III) or income level. In fact, communications ought to be made part of a system of national accounts related to that strategy. (2)
Very often one has been able to detect the constraint of the system of national accounts on a development strategy because data was not being collected in relation to the country's priorities (socialist countries, in particular). The same can be true of a communications strategy. Apart therefore from establishing the need for very general quantitative data collection, specific communications indices for monitoring purposes must be constructed after the establishment of a communication policy and may be used to consider the output of specific programmes and evaluate for further programmes.
Limitations of this type of study
Studies of this type give no indication of the quality or content of mass communication, whether for example, the system is used principally for carrying advertising and entertainment or for the purposes of education and public instruc- tion. It does not differentiate between the impact of different types of media in differing circumstances. Because it deals with data exclusively at the national level, it cannot make crucial distinctions between the variability in access to communications, even the basic difference between the rural and urban audience,in developing countries. It cannot thus explore the obvious concentration of media facilities in the urban areas. It may be that communications just accentuate the lack of integration of the rural areas in participatory or structural terms into the urban techno-bureaucratic framework.(3) It has also been suggested that cam- paigns for development through mass media usually have their greatest impact among advantaged segments of the population, thus serving to widen the communications gap between the advantaged and the disadvantaged.(4) Such considerations are central to planning.
(1) Unpublished papers by Ellen Cooper "Composit Socio-Economic Indices of Develop- ment: A Critique" (N ovember 1977) and Michael Ward "A Defense of GDP as an Interm Index of Development" (November 1977)
(2) "It is difficult to generalise about the statistical resources or statistical needs of developing countries since their administrative, productive and social structures, like their dominant political ideologies vary so greatly." D. Seers, Statistical Needs for Development, IDS Communication No. 120, 1977, p.2.
(3) M. Lipton, Why the Poor Stay Poor, The Urban Bias in Planning, 1977.
(4) Note Everett Rogers, Communication and Development, Safe Contemporary Social Sciences Issues, No.32, 1976, p.9

- 59 -
There is a host of non-quantitative aspects which are central to a consideration of exposure to the media or media impact. Media exposure may have a cumulative impact which implies message reinforcement from one mass medium to another, whereas considera- tions of the use of television, for example among rural groups may be fraught with problems of perception and understanding, or "television literacy" as it has been called in another context.(l) Distinctions among potential users including sex, location of residence, literacy, education and employment escape the broad distinc- tions drawn in comparative national indicators but are essential to planning considera- tions. The difficulty of even scaling countries at the national level is fraught with innumerable cultural, geographical, political and economic problems which belie the underlying distinctions which may be recognisable in quantitative terms.
Studies of this type also ignore the importance of verbal communication in conveying central aspects of information in developing countries. For example, it is tempting to try to link the role of communications to migration and employment. Literature on these subjects delineates the observation that people tend to migrate from the rural areas to the towns on the expectations of getting a 'ob, which may bear little relationship to actual job opportunities in the cities. r' 2, It is not clear whether the information on-which this perception is based is passed on by word of mouth, received through the mass media or a reinforcement of both. Global comparisons of communications and employment are not conclusive.
Nor can this study explore the importance of group reading or sharing of radio or television sets. It ignores whether the content of what is being communicated is imported, or locally produced. In many of the developing countries which are multi-lingual, literary statistics, on which this study has relied heavily as a crucial indicator are somewhat dubious. The meeting of literacy in a predominantly oral society is itself problematic.
Implications for Data Collection and Future Studies
If further studies of this type are considered particularly in relation to planning, the following quantitative data would be an essential starting point:
a)
b)
c>
d)
4
reliable figures on investment in the field of mass communications, as distinct from telecommunications, including disaggregate estimates for production, transmission and special uses of comunication beyond national networks;
the local cost of receivers, and policies of subsidy or import subsidy if such exist, relative to per capita income;
the number of national networks, and daily newspapers with some indication of the focus of circulation of the latter;
employment in the field of mass communications in particular, in order to dis- aggregate the IL0 indicator on employment in the sector of technical, services and communications occupation;
the structure of revenue derived from mass communications, including advertising, government provision, etc.
(1) "Sesame Street: Patterns of International Adaptation' Journal of Communications, Spring 1976.
(2) Principally, the work of Harris and Todaro, and Todaro, American Economic Review, 1969.
East African Economic Review,