The Decline in African-American Representation in Unions and
22
Issue Brief • February 2008 Center for Economic and Policy Research 1611 Connecticut Ave, NW Suite 400 Washington, DC 20009 tel: 202-293-5380 fax: 202-588-1356 www.cepr.net The Decline in African-American Representation in Unions and Manufacturing, 1979-2007 BY JOHN SCHMITT AND BEN ZIPPERER* Introduction For much of the postwar period, a higher share of African-American workers have been in unions than workers from other racial and ethnic backgrounds. As union representation and union coverage have declined for the country as a whole, however, unionization rates for African-American have fallen more quickly than for the rest of the workforce. Black workers are still about 30 percent more likely than the rest of the workforce to be in a union today, but as recently as the mid-1980s, black workers were almost 50 percent more likely to be in a union or covered by a union at their workplace. Part of the reason for the decline in unionization rates among African-Americans is undoubtedly related to the decline of U.S. manufacturing. For example, since the 1960s, African-Americans were more likely to work in the heavily unionized automotive sector than white or Latino workers. As these sectors have declined in relative importance, unionization rates for blacks have also dropped. The broad decline in manufacturing, however, can only explain part of the decline in unionization rates for African-American workers. First of all, the share of black workers in manufacturing has actually been falling more rapidly than the overall share of manufacturing employment. From the end of the 1970s through the early 1990s, African- Americans were just as likely as workers from other racial and ethnic groups to have manufacturing jobs. Since the early 1990s, however, black workers have lost considerable ground in manufacturing. By 2007, blacks were about 15 percent less likely than other workers to have a job in manufacturing. Second, even within manufacturing, unionization rates have been on the decline, to the point where manufacturing workers now are no more likely to be in a union than workers in the rest of the economy (see Schmitt and Zipperer, 2007a). By contrast, unionization rates have held steady in the public sector over the last 25 years, which suggests that employer opposition to unions, not simply economic restructuring, may play an independent role in the decline in overall unionization rates (see Schmitt and Zipperer, 2007b). * John Schmitt is a Senior Economist and Ben Zipperer is a Senior Research Associate at the Center for Economic and Policy Research in Washington, D.C.
Transcript of The Decline in African-American Representation in Unions and

Issue Brief • February 2008
Center for Economic and Policy Research
1611 Connecticut Ave, NW Suite 400
Washington, DC 20009 tel: 202-293-5380 fax: 202-588-1356
www.cepr.net
The Decline in African-American Representation in Unions and Manufacturing, 1979-2007
BY JOHN SCHMITT AND BEN ZIPPERER*
Introduction
For much of the postwar period, a higher share of African-American workers have been in unions than workers from other racial and ethnic backgrounds. As union representation and union coverage have declined for the country as a whole, however, unionization rates for African-American have fallen more quickly than for the rest of the workforce. Black workers are still about 30 percent more likely than the rest of the workforce to be in a union today, but as recently as the mid-1980s, black workers were almost 50 percent more likely to be in a union or covered by a union at their workplace.
Part of the reason for the decline in unionization rates among African-Americans is undoubtedly related to the decline of U.S. manufacturing. For example, since the 1960s, African-Americans were more likely to work in the heavily unionized automotive sector than white or Latino workers. As these sectors have declined in relative importance, unionization rates for blacks have also dropped.
The broad decline in manufacturing, however, can only explain part of the decline in unionization rates for African-American workers. First of all, the share of black workers in manufacturing has actually been falling more rapidly than the overall share of manufacturing employment. From the end of the 1970s through the early 1990s, African-Americans were just as likely as workers from other racial and ethnic groups to have manufacturing jobs. Since the early 1990s, however, black workers have lost considerable ground in manufacturing. By 2007, blacks were about 15 percent less likely than other workers to have a job in manufacturing.
Second, even within manufacturing, unionization rates have been on the decline, to the point where manufacturing workers now are no more likely to be in a union than workers in the rest of the economy (see Schmitt and Zipperer, 2007a). By contrast, unionization rates have held steady in the public sector over the last 25 years, which suggests that employer opposition to unions, not simply economic restructuring, may play an independent role in the decline in overall unionization rates (see Schmitt and Zipperer, 2007b).
* John Schmitt is a Senior Economist and Ben Zipperer is a Senior Research Associate at the Center for Economic and Policy Research in Washington, D.C.

The Decline in African-American Representation in Unions and Manufacturing, 1979-2007 • 2
Findings
Our analysis of data from the Current Population Survey, the government's most important regular source of data on the labor market, also finds:
• Between 1983 (the earliest year for which consistent data are available) and 2007, the share of African-American workers who were either members of a union or represented by a union at their place of employment fell substantially, from 31.7 percent of all black workers in 1983 to 15.7 percent in 2007. In 2007, African-Americans were still more likely to be in a union (15.7 percent) than whites (13.5 percent) and Hispanics (10.8 percent). Nevertheless, the decline in union membership for black workers between 1983 and 2007 was sharper for blacks (down 16.0 percentage points) than it was for whites (down 8.7 percentage points) or Hispanics (down 13.4 percentage points). (See Table 1A.)
• In 2007, African-American women were more likely to be in a union (14.5 percent) than white women (12.3 percent) or Hispanic women (10.7 percent). In the preceding 25 years, however, unionization rates dropped more steeply for black women (down 12.9 percentage points) than rates did for white women (down 4.2 percentage points) or Hispanic women (down 9.4 percentage points). (See Table 1B.) A similar pattern holds for black men, who, in 2007, have higher unionization rates (17.2 percent) than white men (14.6 percent) or Hispanic men (10.8 percent), but have seen larger declines in unionization (down 18.8 percentage points) than white men (down 12.4 percentage points) and Hispanic men (down 16.2 percentage points). (See Table 1C.)
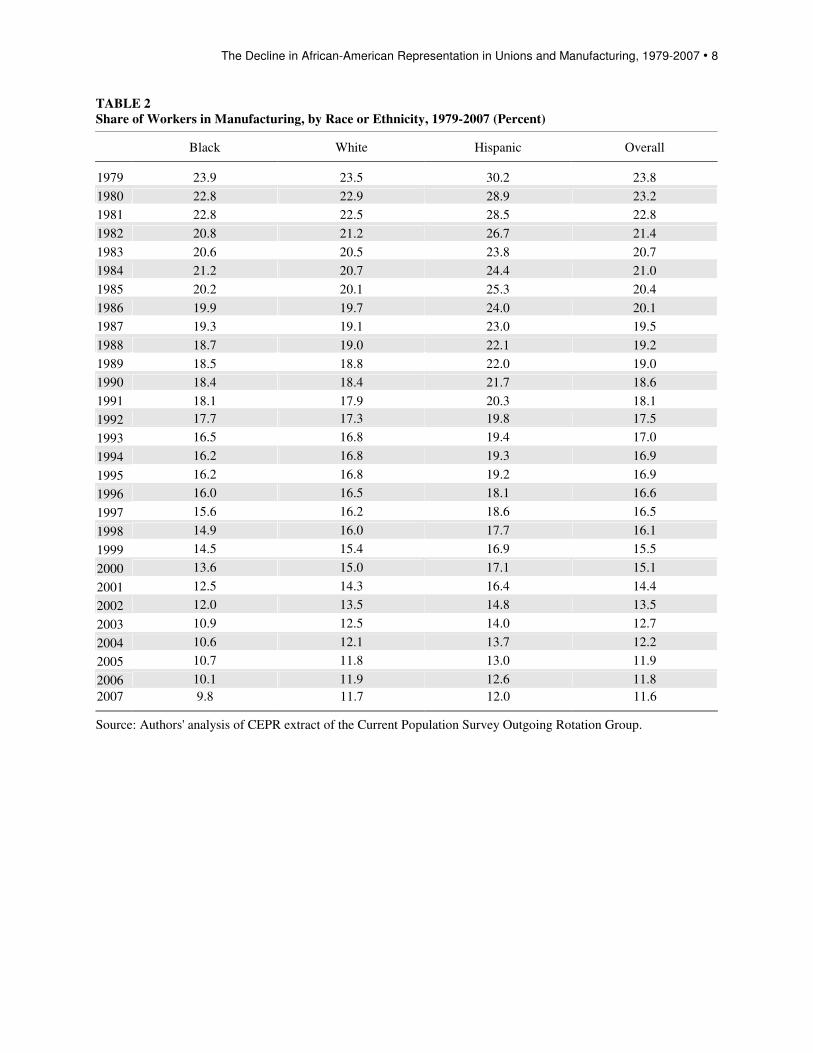
• The share of African-Americans working in manufacturing declined from 23.9 percent in 1979 to 9.8 percent in 2007. Whites saw slightly smaller declines (from 23.5 percent to 11.7 percent), while Hispanics experienced a larger drop (from 30.2 percent to 12.0 percent). (See Table 2.)
• Between 1979 and 2007, the share of workers in auto manufacturing dropped for blacks, whites, and Hispanics. Blacks suffered the biggest declines ― a 1.1 percentage-point decline, from 2.1 percentage points in 1979 to 1.0 percentage points in 2007 ― compared to a 0.3-0.4 percentage-point drop for whites and Hispanics. (See Table 3.)
• Throughout the entire 1983-2007 period, black workers have made up 13 to 15 percent of all union workers. Over the same period, the share of whites in the total union workforce fell from 78.1 percent to 68.9 percent, while the share of Hispanics rose from 5.8 percent to 11.8 percent of all union workers. (See Table 4A.)
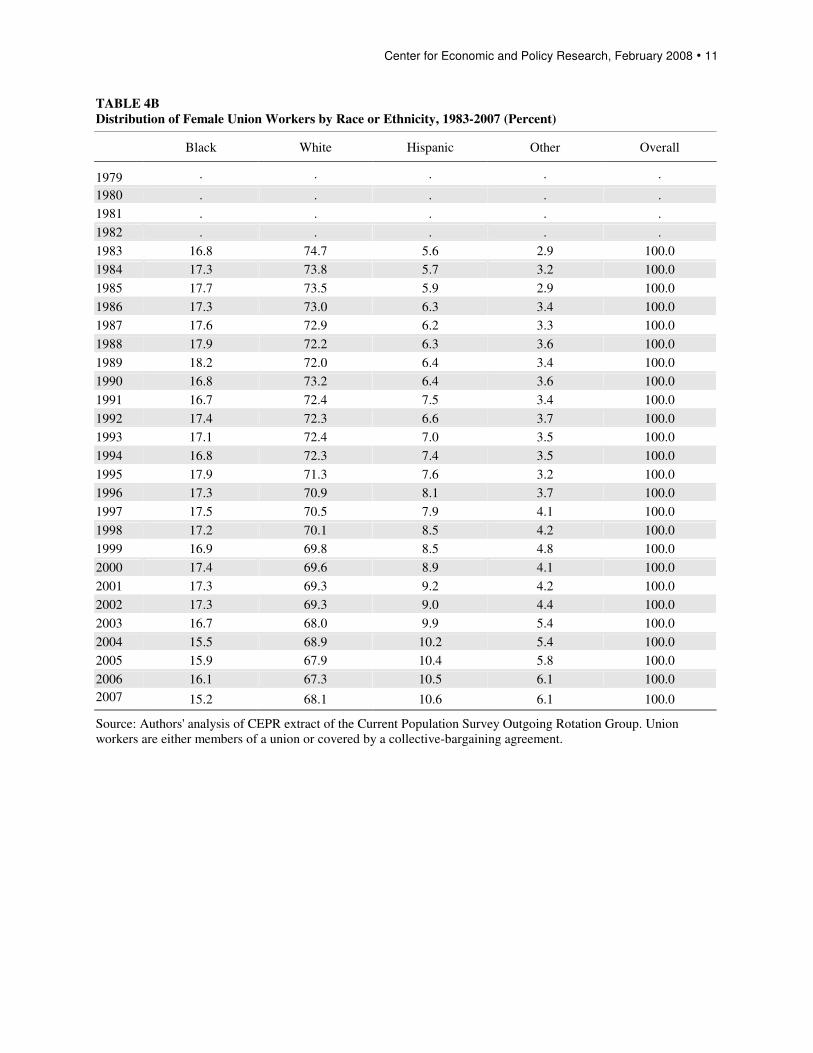
• Over the period 1983-2007, African-American women consistently accounted for 15 to 18 percent of all women in U.S. unions. The share of white women in total female union members, however, fell over the same period, from 74.7 percent in 1983 to 68.1 percent in 2007. Meanwhile, the share of Hispanic women and women from other racial and ethnic backgrounds increased sharply. Hispanic women made up 5.6 percent of all unionized women in 1983, but 10.6 percent in 2007; women from other racial and ethnic backgrounds accounted for 2.9 percent of women in unions in 1983, rising to 6.1 percent by 2007. (See Table 4B.)
• Since 1983, African-American men have consistently made up 12 to 13 percent of all unionized men in the country. Over the same period, the share of white men in the total unionized male workforce fell sharply --from 80.0 percent in 1983 to 69.6 percent in 2007. Hispanic men and men from other racial and ethnic backgrounds, meanwhile, account for an increasing portion of the unionized male workforce. Hispanic men were 5.9 percent of all male union workers in 1983, but 12.7 percent by 2007. Men from other racial and ethnic backgrounds were only 2.1 percent of unionized men in 1983, and 5.3 percent in 2007. (See Table 4C.)

Center for Economic and Policy Research, February 2008 • 3
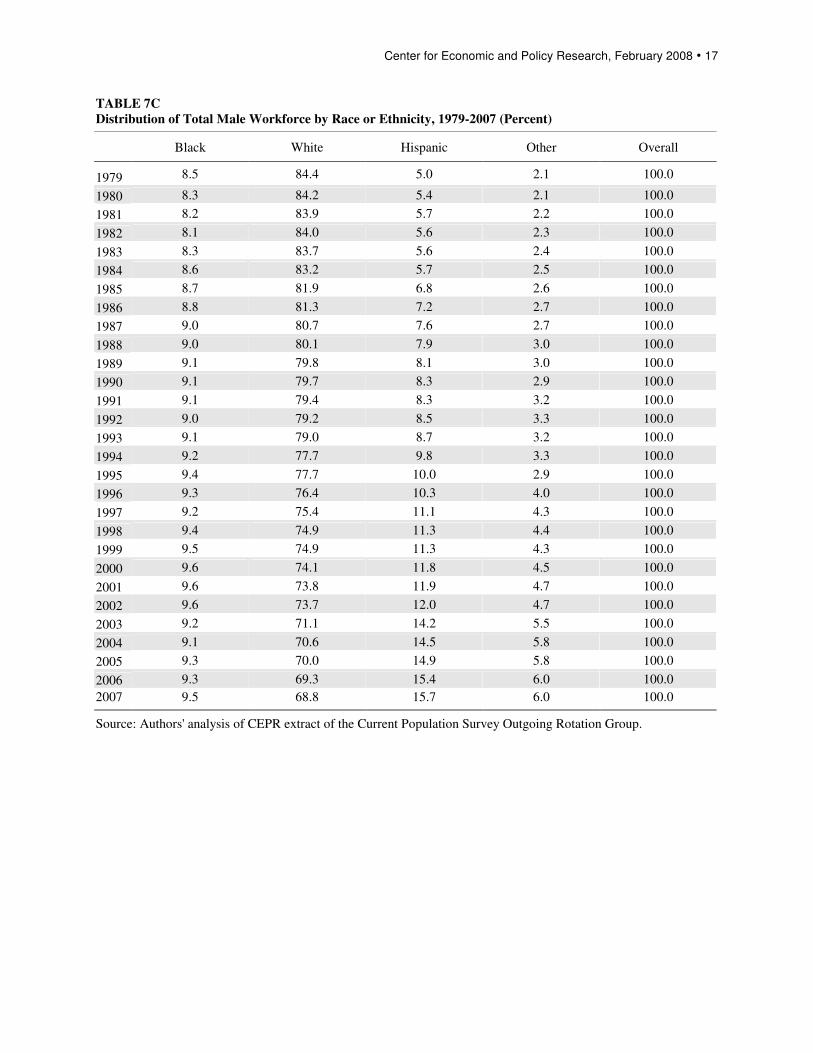
• Throughout the entire period from 1979 to 2007, the share of African-American workers in the total manufacturing workforce hovered around 9 or 10 percent. Meanwhile, white workers dropped from 82.7 percent of all manufacturing workers in 1979 to 70.1 percent in 2007. By contrast, Hispanics significantly increased their representation in the manufacturing workforce over the same period (up from 6.0 percent of manufacturing jobs in 1979 to 14.5 percent in 2006); as did workers from other racial and ethnic backgrounds (up from 1.8 percent in 1979 to 6.4 percent in 2007). (See Table 5.)
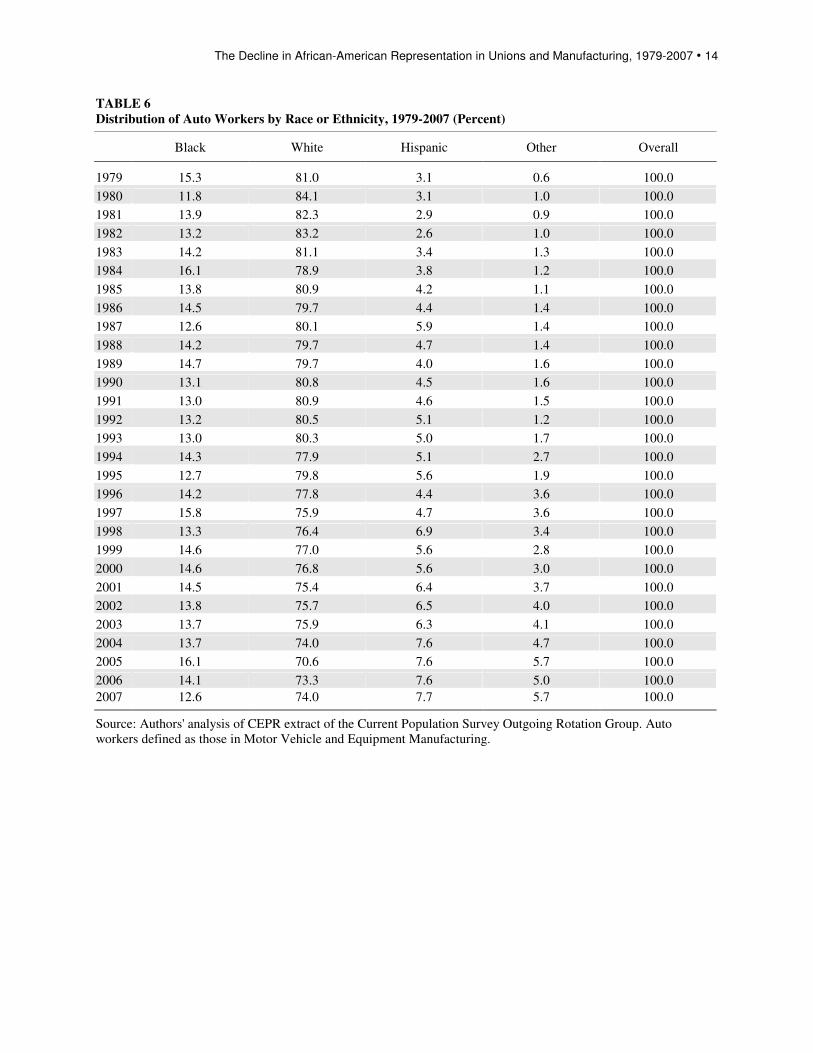
• In 2007, blacks made up 12.6 percent of the auto manufacturing workforce; whites were 74.0 percent; and Hispanics, 7.7 percent. Between 1979 and 2007, the share of blacks and whites in the total auto manufacturing workforce both fell --down 2.7 percentage points for blacks and 7 percentage points for whites. The share of Hispanic and other workers, meanwhile, increased, although remained at relatively low levels --up 4.6 percentage points in the case of Hispanics and 5.1 percentage points for workers from other racial and ethnic backgrounds. (See Table 6.)
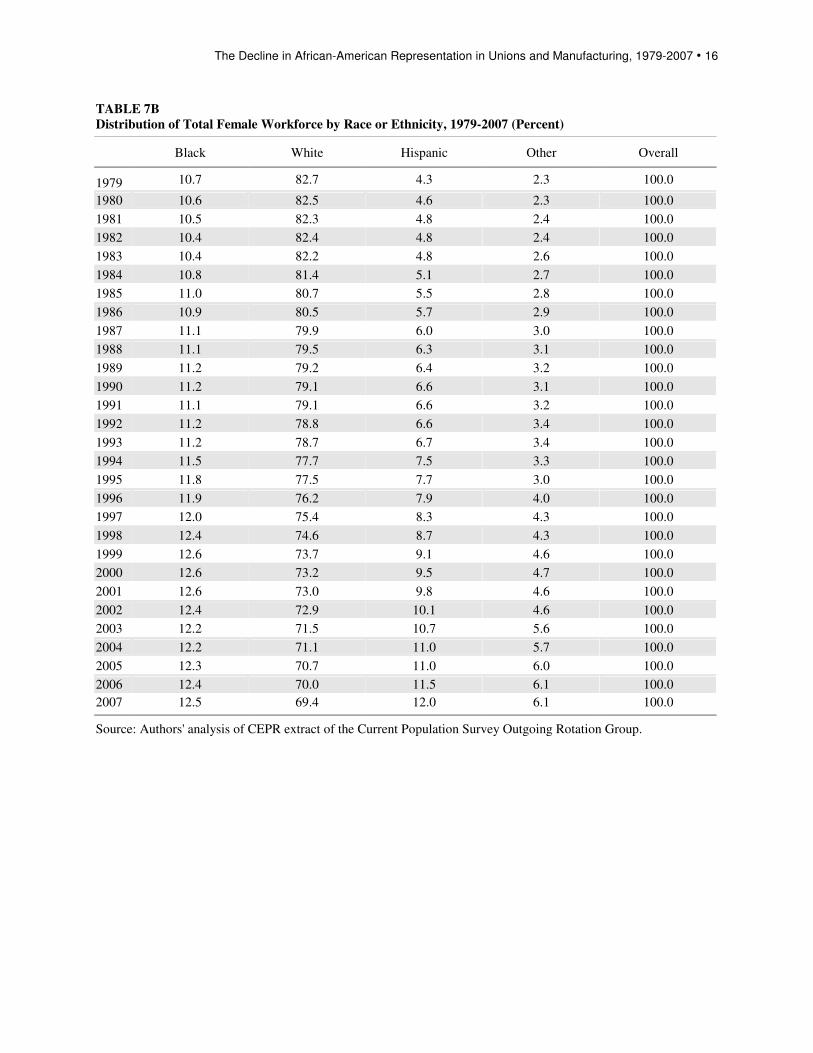
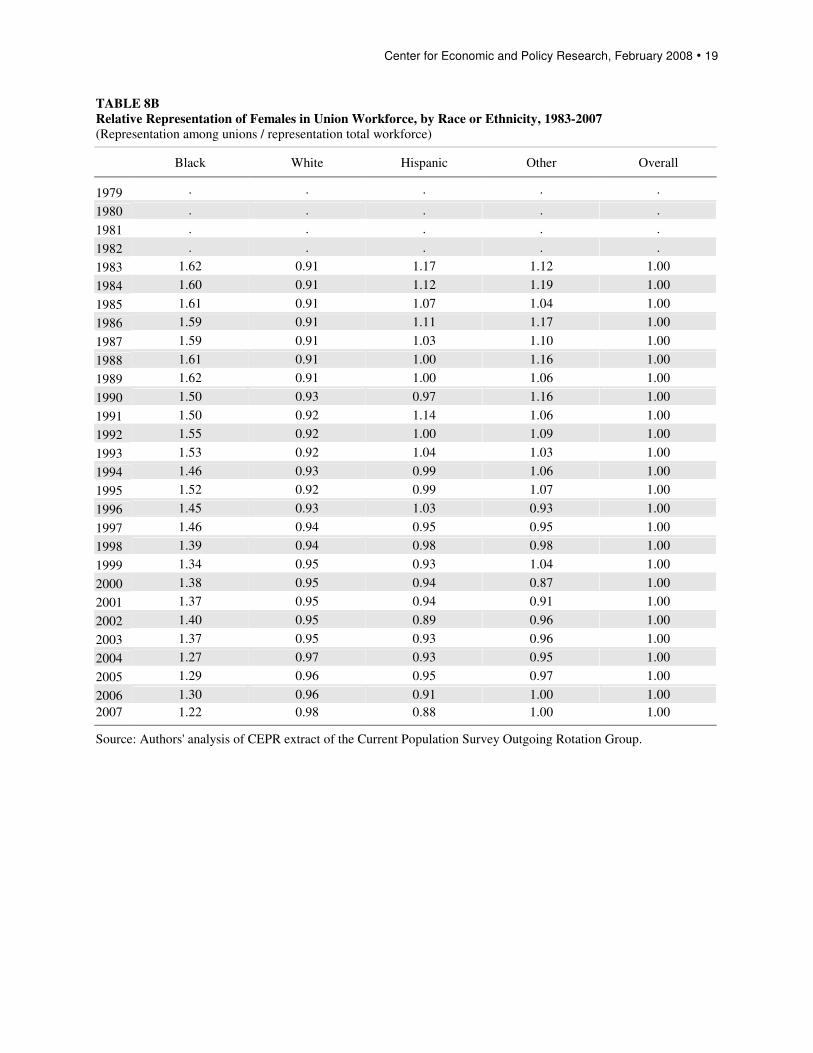
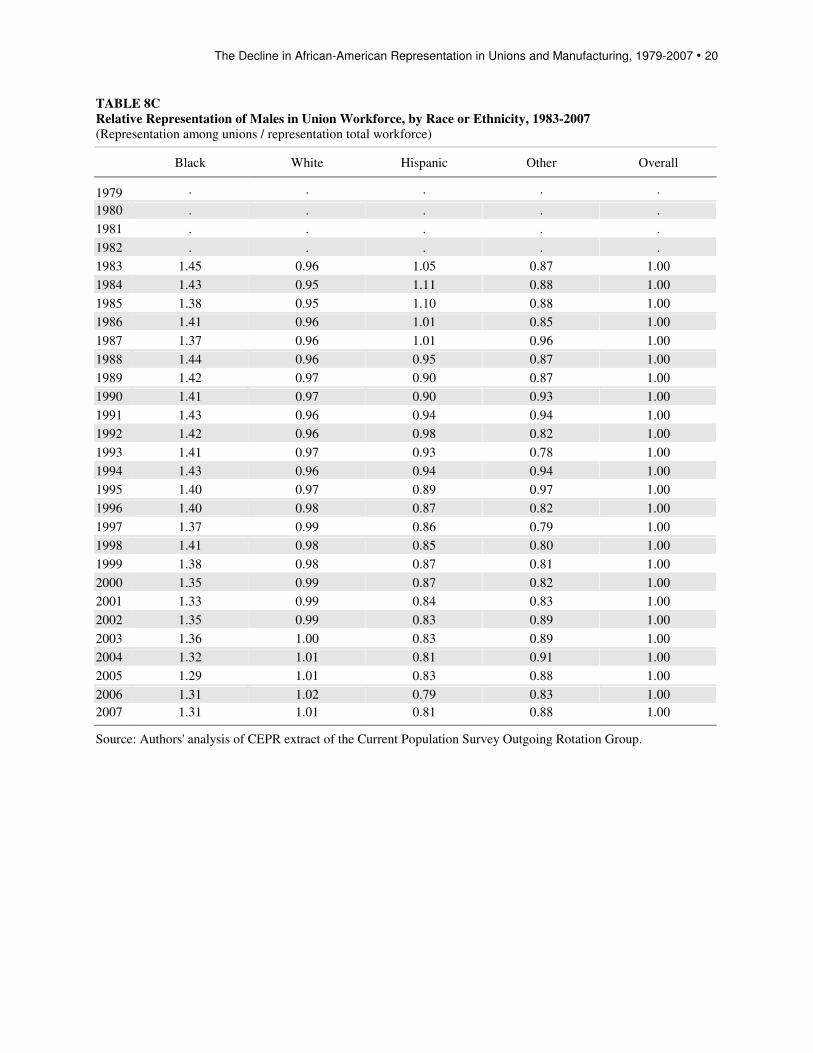
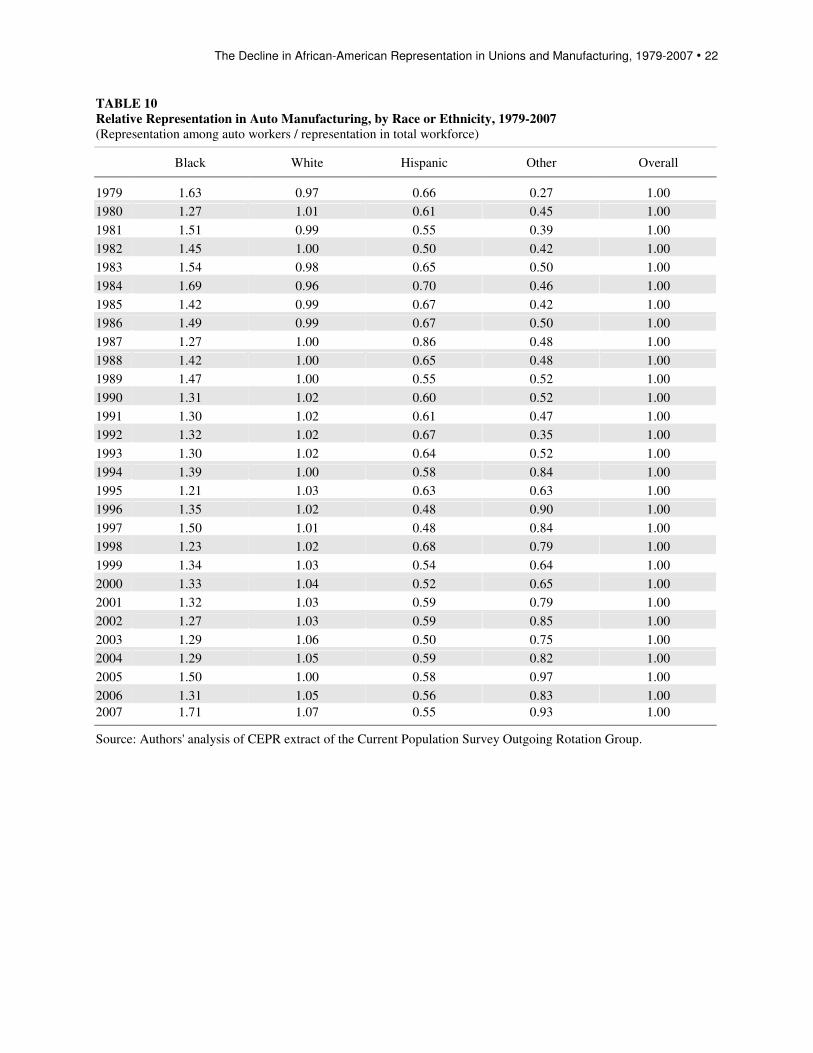
• Interpreting the preceding changes in the distribution of African-American employment and unionization rates can be complicated since the share of African-Americans and other racial and ethnic groups in the total workforce has changed over time. Tables 8, 9, and 10 show the "relative representation" of whites, blacks, Hispanics and other workers in the total union workforce (Tables 8A, 8B, and 8C), the total manufacturing workforce (Table 9), and the auto manufacturing workforce (Table 10). The simplest way to explain the calculation is with an example. To calculate the relative representation of African-Americans in the share of all union workers, we take the ratio of the share of African-Americans in all union workers (13.7 percent in 2007, in Table 4A) to the share of African-Americans in the total workforce (10.8 percent in 2007, in Table 7A). The resulting ratio is 1.27, which is greater than 1, indicating that African-Americans are "over-represented" among union workers since there is a larger share of African-Americans in unions than there is in the workforce as a whole. In the same year, Hispanic women made up 10.6 percent of union workers (Table 4B), but 12.0 percent of the total workforce (Table 7B), resulting in a relative representation of 0.88, which is less than 1, indicating that Hispanic women are "under-represented" among union workers. If a group has the same share of workers in unions as they do in the total workforce, then the ratio for relative representation would equal one (which is exactly the rate for whites in 2007).
• In 2007, African-American workers were "over-represented" in unions (Table 8A) and in auto manufacturing (Table 10), but are actually "under-represented" in manufacturing as a whole (Table 9).
• The relative representation of African-Americans in unions (Table 8A) has been declining, especially for African-American women (Table 8B). In 1983, African-American women were 1.62 times more likely to be in a union than the average female worker; by 2007, they were only 1.22 times more likely than the average. For black men, the decline in relative representation was less steep: from 1.45 times more likely than average to be in a union in 1983, to 1.31 times more likely in 2007 (Table 8C).
• The relative representation of blacks in manufacturing has also been declining from the mid-1990s for overall manufacturing (Table 9) and for auto manufacturing (Table 10). From the mid-1990s on, black workers have actually been under-represented in manufacturing, relative to the rest of the economy.

The Decline in African-American Representation in Unions and Manufacturing, 1979-2007 • 4
References Center for Economic and Policy Research. Uniform Extracts of the Current Population Survey Outgoing
Rotation Group. 2007. http://ceprdata.org Schmitt, John and Ben Zipperer. 2007a. "Union Rates Fall in 2006, Severe Drop in Manufacturing,"
Washington, D.C.: Center for Economic and Policy Research Union Byte (January). http://www.cepr.net/index.php?option=com_content&task=view&id=1019&Itemid=138 Schmitt, John and Ben Zipperer. 2007b. "Dropping the Ax: Illegal Firings During Union Election
Campaigns," Washington, D.C.: Center for Economic and Policy Research Briefing Paper (January). http://www.cepr.net/index.php?option=com_content&task=view&id=775&Itemid=8

Center for Economic and Policy Research, February 2008 • 5
Tables TABLE 1A
Share of Workers in Unions, by Race or Ethnicity, 1983-2007 (Percent)
Black White Hispanic Overall
1979 . . . .
1980 . . . .
1981 . . . .
1982 . . . .
1983 31.7 22.2 24.2 23.3
1984 29.1 20.5 22.8 21.5
1985 27.3 19.5 21.3 20.4
1986 26.5 19.0 20.0 19.9
1987 25.3 18.3 19.1 19.2
1988 25.9 18.1 17.7 18.9
1989 25.2 17.8 16.8 18.5
1990 24.2 17.7 16.4 18.3
1991 24.1 17.4 17.6 18.2
1992 24.0 17.1 16.9 17.8
1993 23.6 17.1 16.6 17.7
1994 22.9 16.8 15.9 17.4
1995 22.2 16.1 14.8 16.7
1996 21.2 15.8 14.6 16.2
1997 20.1 15.4 13.5 15.6
1998 19.7 15.1 13.2 15.4
1999 19.2 15.1 13.1 15.3
2000 18.9 14.7 12.8 14.9
2001 18.7 14.7 12.5 14.8
2002 18.8 14.4 12.0 14.6
2003 18.1 14.2 11.9 14.3
2004 16.6 13.9 11.4 13.8
2005 16.5 13.7 11.5 13.7
2006 16.0 13.3 10.7 13.1
2007 15.7 13.5 10.8 13.3
Source: Authors' analysis of CEPR extract of the Current Population Survey Outgoing Rotation Group. Union
workers are either members of a union or covered by a collective-bargaining agreement.

The Decline in African-American Representation in Unions and Manufacturing, 1979-2007 • 6
TABLE 1B
Share of Female Workers in Unions, by Race or Ethnicity, 1983-2007 (Percent)
Black White Hispanic Overall
1979 . . . .
1980 . . . .
1981 . . . .
1982 . . . .
1983 27.4 16.5 20.1 18.0
1984 25.3 15.3 18.3 16.7
1985 24.1 14.5 16.3 15.8
1986 23.1 14.1 16.4 15.4
1987 22.2 13.7 15.1 14.9
1988 22.8 13.7 14.3 14.9
1989 22.7 13.6 14.5 14.8
1990 21.1 13.9 14.2 14.9
1991 21.0 13.6 16.2 14.8
1992 22.0 13.8 14.4 14.9
1993 21.8 14.0 15.3 15.1
1994 20.6 14.2 14.2 15.1
1995 20.4 13.3 13.5 14.3
1996 19.0 13.0 13.9 13.8
1997 18.3 12.7 12.2 13.4
1998 17.2 12.4 12.3 13.1
1999 16.6 12.5 11.8 13.0
2000 17.3 12.6 11.8 13.1
2001 17.2 12.6 12.0 13.1
2002 17.5 12.5 11.3 13.0
2003 16.7 12.4 11.6 12.9
2004 15.1 12.3 11.4 12.5
2005 15.5 12.3 11.6 12.6
2006 15.1 11.9 10.9 12.2
2007 14.5 12.3 10.7 12.4
Source: Authors' analysis of CEPR extract of the Current Population Survey Outgoing Rotation Group. Union
workers are either members of a union or covered by a collective-bargaining agreement.

Center for Economic and Policy Research, February 2008 • 7
TABLE 1C
Share of Male Workers in Unions, by Race or Ethnicity, 1983-2007 (Percent)
Black White Hispanic Overall
1979 . . . .
1980 . . . .
1981 . . . .
1982 . . . .
1983 36.0 27.0 27.0 27.7
1984 33.0 24.7 26.1 25.6
1985 30.6 23.7 24.6 24.3
1986 30.1 23.2 22.3 23.7
1987 28.5 22.4 21.7 22.9
1988 29.0 22.0 20.0 22.5
1989 27.9 21.5 18.4 21.8
1990 27.5 21.0 17.9 21.4
1991 27.4 20.8 18.5 21.3
1992 26.3 20.1 18.7 20.5
1993 25.6 19.9 17.5 20.1
1994 25.5 19.2 17.0 19.6
1995 24.2 18.6 15.6 18.8
1996 23.7 18.4 15.0 18.4
1997 22.1 17.9 14.3 17.7
1998 22.6 17.5 13.8 17.4
1999 22.2 17.4 14.1 17.4
2000 20.7 16.6 13.5 16.5
2001 20.5 16.6 12.9 16.4
2002 20.3 16.2 12.5 16.0
2003 19.8 15.9 12.1 15.6
2004 18.4 15.5 11.5 15.0
2005 17.6 15.1 11.5 14.7
2006 17.1 14.6 10.6 14.0
2007 17.2 14.6 10.8 14.1
Source: Authors' analysis of CEPR extract of the Current Population Survey Outgoing Rotation Group. Union
workers are either members of a union or covered by a collective-bargaining agreement.
The Decline in African-American Representation in Unions and Manufacturing, 1979-2007 • 8
TABLE 2
Share of Workers in Manufacturing, by Race or Ethnicity, 1979-2007 (Percent)
Black White Hispanic Overall
1979 23.9 23.5 30.2 23.8
1980 22.8 22.9 28.9 23.2
1981 22.8 22.5 28.5 22.8
1982 20.8 21.2 26.7 21.4
1983 20.6 20.5 23.8 20.7
1984 21.2 20.7 24.4 21.0
1985 20.2 20.1 25.3 20.4
1986 19.9 19.7 24.0 20.1
1987 19.3 19.1 23.0 19.5
1988 18.7 19.0 22.1 19.2
1989 18.5 18.8 22.0 19.0
1990 18.4 18.4 21.7 18.6
1991 18.1 17.9 20.3 18.1
1992 17.7 17.3 19.8 17.5
1993 16.5 16.8 19.4 17.0
1994 16.2 16.8 19.3 16.9
1995 16.2 16.8 19.2 16.9
1996 16.0 16.5 18.1 16.6
1997 15.6 16.2 18.6 16.5
1998 14.9 16.0 17.7 16.1
1999 14.5 15.4 16.9 15.5
2000 13.6 15.0 17.1 15.1
2001 12.5 14.3 16.4 14.4
2002 12.0 13.5 14.8 13.5
2003 10.9 12.5 14.0 12.7
2004 10.6 12.1 13.7 12.2
2005 10.7 11.8 13.0 11.9
2006 10.1 11.9 12.6 11.8
2007 9.8 11.7 12.0 11.6
Source: Authors' analysis of CEPR extract of the Current Population Survey Outgoing Rotation Group.

Center for Economic and Policy Research, February 2008 • 9
TABLE 3
Share of Workers in Auto Manufacturing, by Race or Ethnicity, 1979-2007 (Percent)
Black White Hispanic Overall
1979 2.1 1.3 0.8 1.3
1980 1.3 1.0 0.6 1.0
1981 1.5 1.0 0.5 1.0
1982 1.2 0.8 0.4 0.8
1983 1.5 1.0 0.6 1.0
1984 1.9 1.1 0.8 1.2
1985 1.6 1.1 0.8 1.1
1986 1.7 1.1 0.8 1.1
1987 1.3 1.0 0.9 1.0
1988 1.5 1.0 0.7 1.0
1989 1.5 1.0 0.6 1.0
1990 1.3 1.0 0.6 1.0
1991 1.2 0.9 0.6 0.9
1992 1.3 1.0 0.6 1.0
1993 1.2 1.0 0.6 1.0
1994 1.4 1.0 0.6 1.0
1995 1.2 1.0 0.6 1.0
1996 1.4 1.0 0.5 1.0
1997 1.5 1.0 0.5 1.0
1998 1.2 1.0 0.7 1.0
1999 1.3 1.0 0.5 1.0
2000 1.3 1.0 0.5 1.0
2001 1.1 0.9 0.5 0.9
2002 1.1 0.9 0.5 0.9
2003 1.3 1.1 0.5 1.0
2004 1.3 1.1 0.6 1.0
2005 1.5 1.0 0.6 1.0
2006 1.3 1.0 0.5 1.0
2007 1.0 0.9 0.5 0.9
Notes: Authors' analysis of CEPR extract of the Current Population Survey Outgoing Rotation Group. Auto workers
defined as those in Motor Vehicle and Equipment Manufacturing.

The Decline in African-American Representation in Unions and Manufacturing, 1979-2007 • 10
TABLE 4A
Distribution of Union Workers by Race or Ethnicity, 1983-2007 (Percent)
Black White Hispanic Other Overall
1979 . . . . .
1980 . . . . .
1981 . . . . .
1982 . . . . .
1983 13.7 78.1 5.8 2.4 100.0
1984 14.1 77.3 6.1 2.5 100.0
1985 14.1 76.6 6.9 2.4 100.0
1986 14.1 76.2 6.9 2.8 100.0
1987 14.2 75.8 7.2 2.8 100.0
1988 14.8 75.2 7.1 2.9 100.0
1989 14.9 75.3 6.9 2.9 100.0
1990 14.3 75.6 7.1 3.0 100.0
1991 14.4 74.7 7.7 3.2 100.0
1992 14.6 74.6 7.6 3.2 100.0
1993 14.5 74.9 7.7 2.9 100.0
1994 14.7 73.6 8.4 3.3 100.0
1995 15.1 73.5 8.4 3.0 100.0
1996 14.7 73.1 8.7 3.5 100.0
1997 14.6 72.8 8.9 3.7 100.0
1998 14.9 72.2 9.1 3.8 100.0
1999 14.7 72.1 9.3 3.9 100.0
2000 14.9 71.5 9.7 3.9 100.0
2001 14.7 71.6 9.7 4.0 100.0
2002 14.9 71.4 9.5 4.2 100.0
2003 14.3 69.6 11.0 5.1 100.0
2004 13.5 70.1 11.0 5.4 100.0
2005 13.7 69.4 11.5 5.4 100.0
2006 14.0 69.2 11.5 5.3 100.0
2007 13.7 68.9 11.8 5.6 100.0
Source: Authors' analysis of CEPR extract of the Current Population Survey Outgoing Rotation Group. Union
workers are either members of a union or covered by a collective-bargaining agreement.
Center for Economic and Policy Research, February 2008 • 11
TABLE 4B
Distribution of Female Union Workers by Race or Ethnicity, 1983-2007 (Percent)
Black White Hispanic Other Overall
1979 . . . . .
1980 . . . . .
1981 . . . . .
1982 . . . . .
1983 16.8 74.7 5.6 2.9 100.0
1984 17.3 73.8 5.7 3.2 100.0
1985 17.7 73.5 5.9 2.9 100.0
1986 17.3 73.0 6.3 3.4 100.0
1987 17.6 72.9 6.2 3.3 100.0
1988 17.9 72.2 6.3 3.6 100.0
1989 18.2 72.0 6.4 3.4 100.0
1990 16.8 73.2 6.4 3.6 100.0
1991 16.7 72.4 7.5 3.4 100.0
1992 17.4 72.3 6.6 3.7 100.0
1993 17.1 72.4 7.0 3.5 100.0
1994 16.8 72.3 7.4 3.5 100.0
1995 17.9 71.3 7.6 3.2 100.0
1996 17.3 70.9 8.1 3.7 100.0
1997 17.5 70.5 7.9 4.1 100.0
1998 17.2 70.1 8.5 4.2 100.0
1999 16.9 69.8 8.5 4.8 100.0
2000 17.4 69.6 8.9 4.1 100.0
2001 17.3 69.3 9.2 4.2 100.0
2002 17.3 69.3 9.0 4.4 100.0
2003 16.7 68.0 9.9 5.4 100.0
2004 15.5 68.9 10.2 5.4 100.0
2005 15.9 67.9 10.4 5.8 100.0
2006 16.1 67.3 10.5 6.1 100.0
2007 15.2 68.1 10.6 6.1 100.0
Source: Authors' analysis of CEPR extract of the Current Population Survey Outgoing Rotation Group. Union
workers are either members of a union or covered by a collective-bargaining agreement.

The Decline in African-American Representation in Unions and Manufacturing, 1979-2007 • 12
TABLE 4C
Distribution of Male Union Workers by Race or Ethnicity, 1983-2007 (Percent)
Black White Hispanic Other Overall
1979 . . . . .
1980 . . . . .
1981 . . . . .
1982 . . . . .
1983 12.0 80.0 5.9 2.1 100.0
1984 12.3 79.2 6.3 2.2 100.0
1985 12.0 78.2 7.5 2.3 100.0
1986 12.4 78.0 7.3 2.3 100.0
1987 12.3 77.4 7.7 2.6 100.0
1988 13.0 76.9 7.5 2.6 100.0
1989 12.9 77.2 7.3 2.6 100.0
1990 12.8 77.0 7.5 2.7 100.0
1991 13.0 76.2 7.8 3.0 100.0
1992 12.8 76.2 8.3 2.7 100.0
1993 12.8 76.6 8.1 2.5 100.0
1994 13.2 74.5 9.2 3.1 100.0
1995 13.2 75.1 8.9 2.8 100.0
1996 13.0 74.7 9.0 3.3 100.0
1997 12.6 74.4 9.6 3.4 100.0
1998 13.3 73.6 9.6 3.5 100.0
1999 13.1 73.6 9.8 3.5 100.0
2000 13.0 73.0 10.3 3.7 100.0
2001 12.8 73.3 10.0 3.9 100.0
2002 13.0 72.9 9.9 4.2 100.0
2003 12.5 70.8 11.8 4.9 100.0
2004 12.0 71.0 11.7 5.3 100.0
2005 12.0 70.6 12.3 5.1 100.0
2006 12.2 70.6 12.2 5.0 100.0
2007 12.4 69.6 12.7 5.3 100.0
Source: Authors' analysis of CEPR extract of the Current Population Survey Outgoing Rotation Group. Union
workers are either members of a union or covered by a collective-bargaining agreement.

Center for Economic and Policy Research, February 2008 • 13
TABLE 5
Distribution of Manufacturing Workers by Race or Ethnicity, 1979-2007 (Percent)
Black White Hispanic Other Overall
1979 9.5 82.7 6.0 1.8 100.0
1980 9.1 82.4 6.3 2.2 100.0
1981 9.2 82.1 6.6 2.1 100.0
1982 8.9 82.4 6.5 2.2 100.0
1983 9.2 82.2 6.0 2.6 100.0
1984 9.6 81.4 6.3 2.7 100.0
1985 9.6 80.1 7.7 2.6 100.0
1986 9.7 79.5 7.9 2.9 100.0
1987 9.8 78.9 8.1 3.2 100.0
1988 9.7 79.1 8.3 2.9 100.0
1989 9.8 78.6 8.4 3.2 100.0
1990 9.9 78.4 8.7 3.0 100.0
1991 10.0 78.2 8.4 3.4 100.0
1992 10.1 77.9 8.6 3.4 100.0
1993 9.7 78.1 8.8 3.4 100.0
1994 9.8 76.9 10.0 3.3 100.0
1995 10.0 76.8 10.1 3.1 100.0
1996 10.0 75.5 10.0 4.5 100.0
1997 9.9 74.1 11.0 5.0 100.0
1998 10.0 74.3 11.0 4.7 100.0
1999 10.2 73.9 11.2 4.7 100.0
2000 9.9 72.9 12.1 5.1 100.0
2001 9.5 72.9 12.4 5.2 100.0
2002 9.7 73.1 12.1 5.1 100.0
2003 9.2 70.5 13.9 6.4 100.0
2004 9.2 70.2 14.4 6.2 100.0
2005 9.6 69.7 14.3 6.4 100.0
2006 9.2 69.9 14.5 6.4 100.0
2007 9.2 70.1 14.5 6.4 100.0
Source: Authors' analysis of CEPR extract of the Current Population Survey Outgoing Rotation Group.
The Decline in African-American Representation in Unions and Manufacturing, 1979-2007 • 14
TABLE 6
Distribution of Auto Workers by Race or Ethnicity, 1979-2007 (Percent)
Black White Hispanic Other Overall
1979 15.3 81.0 3.1 0.6 100.0
1980 11.8 84.1 3.1 1.0 100.0
1981 13.9 82.3 2.9 0.9 100.0
1982 13.2 83.2 2.6 1.0 100.0
1983 14.2 81.1 3.4 1.3 100.0
1984 16.1 78.9 3.8 1.2 100.0
1985 13.8 80.9 4.2 1.1 100.0
1986 14.5 79.7 4.4 1.4 100.0
1987 12.6 80.1 5.9 1.4 100.0
1988 14.2 79.7 4.7 1.4 100.0
1989 14.7 79.7 4.0 1.6 100.0
1990 13.1 80.8 4.5 1.6 100.0
1991 13.0 80.9 4.6 1.5 100.0
1992 13.2 80.5 5.1 1.2 100.0
1993 13.0 80.3 5.0 1.7 100.0
1994 14.3 77.9 5.1 2.7 100.0
1995 12.7 79.8 5.6 1.9 100.0
1996 14.2 77.8 4.4 3.6 100.0
1997 15.8 75.9 4.7 3.6 100.0
1998 13.3 76.4 6.9 3.4 100.0
1999 14.6 77.0 5.6 2.8 100.0
2000 14.6 76.8 5.6 3.0 100.0
2001 14.5 75.4 6.4 3.7 100.0
2002 13.8 75.7 6.5 4.0 100.0
2003 13.7 75.9 6.3 4.1 100.0
2004 13.7 74.0 7.6 4.7 100.0
2005 16.1 70.6 7.6 5.7 100.0
2006 14.1 73.3 7.6 5.0 100.0
2007 12.6 74.0 7.7 5.7 100.0
Source: Authors' analysis of CEPR extract of the Current Population Survey Outgoing Rotation Group. Auto
workers defined as those in Motor Vehicle and Equipment Manufacturing.

Center for Economic and Policy Research, February 2008 • 15
TABLE 7A
Distribution of Total Workforce by Race or Ethnicity, 1979-2007 (Percent)
Black White Hispanic Other Overall
1979 9.4 83.7 4.7 2.2 100.0
1980 9.3 83.4 5.1 2.2 100.0
1981 9.2 83.2 5.3 2.3 100.0
1982 9.1 83.3 5.2 2.4 100.0
1983 9.2 83.0 5.2 2.6 100.0
1984 9.5 82.5 5.4 2.6 100.0
1985 9.7 81.4 6.3 2.6 100.0
1986 9.7 80.9 6.6 2.8 100.0
1987 9.9 80.3 6.9 2.9 100.0
1988 10.0 79.9 7.2 2.9 100.0
1989 10.0 79.6 7.3 3.1 100.0
1990 10.0 79.4 7.5 3.1 100.0
1991 10.0 79.3 7.5 3.2 100.0
1992 10.0 79.0 7.6 3.4 100.0
1993 10.0 78.9 7.8 3.3 100.0
1994 10.3 77.7 8.8 3.2 100.0
1995 10.5 77.6 8.9 3.0 100.0
1996 10.5 76.3 9.2 4.0 100.0
1997 10.5 75.4 9.8 4.3 100.0
1998 10.8 74.8 10.1 4.3 100.0
1999 10.9 74.4 10.3 4.4 100.0
2000 11.0 73.7 10.7 4.6 100.0
2001 11.0 73.4 10.9 4.7 100.0
2002 10.9 73.3 11.1 4.7 100.0
2003 10.6 71.3 12.6 5.5 100.0
2004 10.6 70.8 12.9 5.7 100.0
2005 10.7 70.3 13.1 5.9 100.0
2006 10.8 69.6 13.6 6.0 100.0
2007 10.8 69.1 14.0 6.1 100.0
Source: Authors' analysis of CEPR extract of the Current Population Survey Outgoing Rotation Group.
The Decline in African-American Representation in Unions and Manufacturing, 1979-2007 • 16
TABLE 7B
Distribution of Total Female Workforce by Race or Ethnicity, 1979-2007 (Percent)
Black White Hispanic Other Overall
1979 10.7 82.7 4.3 2.3 100.0
1980 10.6 82.5 4.6 2.3 100.0
1981 10.5 82.3 4.8 2.4 100.0
1982 10.4 82.4 4.8 2.4 100.0
1983 10.4 82.2 4.8 2.6 100.0
1984 10.8 81.4 5.1 2.7 100.0
1985 11.0 80.7 5.5 2.8 100.0
1986 10.9 80.5 5.7 2.9 100.0
1987 11.1 79.9 6.0 3.0 100.0
1988 11.1 79.5 6.3 3.1 100.0
1989 11.2 79.2 6.4 3.2 100.0
1990 11.2 79.1 6.6 3.1 100.0
1991 11.1 79.1 6.6 3.2 100.0
1992 11.2 78.8 6.6 3.4 100.0
1993 11.2 78.7 6.7 3.4 100.0
1994 11.5 77.7 7.5 3.3 100.0
1995 11.8 77.5 7.7 3.0 100.0
1996 11.9 76.2 7.9 4.0 100.0
1997 12.0 75.4 8.3 4.3 100.0
1998 12.4 74.6 8.7 4.3 100.0
1999 12.6 73.7 9.1 4.6 100.0
2000 12.6 73.2 9.5 4.7 100.0
2001 12.6 73.0 9.8 4.6 100.0
2002 12.4 72.9 10.1 4.6 100.0
2003 12.2 71.5 10.7 5.6 100.0
2004 12.2 71.1 11.0 5.7 100.0
2005 12.3 70.7 11.0 6.0 100.0
2006 12.4 70.0 11.5 6.1 100.0
2007 12.5 69.4 12.0 6.1 100.0
Source: Authors' analysis of CEPR extract of the Current Population Survey Outgoing Rotation Group.
Center for Economic and Policy Research, February 2008 • 17
TABLE 7C
Distribution of Total Male Workforce by Race or Ethnicity, 1979-2007 (Percent)
Black White Hispanic Other Overall
1979 8.5 84.4 5.0 2.1 100.0
1980 8.3 84.2 5.4 2.1 100.0
1981 8.2 83.9 5.7 2.2 100.0
1982 8.1 84.0 5.6 2.3 100.0
1983 8.3 83.7 5.6 2.4 100.0
1984 8.6 83.2 5.7 2.5 100.0
1985 8.7 81.9 6.8 2.6 100.0
1986 8.8 81.3 7.2 2.7 100.0
1987 9.0 80.7 7.6 2.7 100.0
1988 9.0 80.1 7.9 3.0 100.0
1989 9.1 79.8 8.1 3.0 100.0
1990 9.1 79.7 8.3 2.9 100.0
1991 9.1 79.4 8.3 3.2 100.0
1992 9.0 79.2 8.5 3.3 100.0
1993 9.1 79.0 8.7 3.2 100.0
1994 9.2 77.7 9.8 3.3 100.0
1995 9.4 77.7 10.0 2.9 100.0
1996 9.3 76.4 10.3 4.0 100.0
1997 9.2 75.4 11.1 4.3 100.0
1998 9.4 74.9 11.3 4.4 100.0
1999 9.5 74.9 11.3 4.3 100.0
2000 9.6 74.1 11.8 4.5 100.0
2001 9.6 73.8 11.9 4.7 100.0
2002 9.6 73.7 12.0 4.7 100.0
2003 9.2 71.1 14.2 5.5 100.0
2004 9.1 70.6 14.5 5.8 100.0
2005 9.3 70.0 14.9 5.8 100.0
2006 9.3 69.3 15.4 6.0 100.0
2007 9.5 68.8 15.7 6.0 100.0
Source: Authors' analysis of CEPR extract of the Current Population Survey Outgoing Rotation Group.

The Decline in African-American Representation in Unions and Manufacturing, 1979-2007 • 18
TABLE 8A
Relative Representation in Union Workforce, by Race or Ethnicity, 1983-2007
(Representation among unions / representation total workforce)
Black White Hispanic Other Overall
1979 . . . . .
1980 . . . . .
1981 . . . . .
1982 . . . . .
1983 1.49 0.94 1.12 0.92 1.00
1984 1.48 0.94 1.13 0.96 1.00
1985 1.45 0.94 1.10 0.92 1.00
1986 1.45 0.94 1.05 1.00 1.00
1987 1.43 0.94 1.04 0.97 1.00
1988 1.48 0.94 0.99 1.00 1.00
1989 1.49 0.95 0.95 0.94 1.00
1990 1.43 0.95 0.95 0.97 1.00
1991 1.44 0.94 1.03 1.00 1.00
1992 1.46 0.94 1.00 0.94 1.00
1993 1.45 0.95 0.99 0.88 1.00
1994 1.43 0.95 0.95 1.03 1.00
1995 1.44 0.95 0.94 1.00 1.00
1996 1.40 0.96 0.95 0.88 1.00
1997 1.39 0.97 0.91 0.86 1.00
1998 1.38 0.97 0.90 0.88 1.00
1999 1.35 0.97 0.90 0.89 1.00
2000 1.35 0.97 0.91 0.85 1.00
2001 1.34 0.98 0.89 0.85 1.00
2002 1.37 0.97 0.86 0.89 1.00
2003 1.35 0.98 0.87 0.93 1.00
2004 1.27 0.99 0.85 0.95 1.00
2005 1.28 0.99 0.88 0.92 1.00
2006 1.30 0.99 0.85 0.88 1.00
2007 1.27 1.00 0.84 0.92 1.00
Source: Authors' analysis of CEPR extract of the Current Population Survey Outgoing Rotation Group.
Center for Economic and Policy Research, February 2008 • 19
TABLE 8B
Relative Representation of Females in Union Workforce, by Race or Ethnicity, 1983-2007
(Representation among unions / representation total workforce)
Black White Hispanic Other Overall
1979 . . . . .
1980 . . . . .
1981 . . . . .
1982 . . . . .
1983 1.62 0.91 1.17 1.12 1.00
1984 1.60 0.91 1.12 1.19 1.00
1985 1.61 0.91 1.07 1.04 1.00
1986 1.59 0.91 1.11 1.17 1.00
1987 1.59 0.91 1.03 1.10 1.00
1988 1.61 0.91 1.00 1.16 1.00
1989 1.62 0.91 1.00 1.06 1.00
1990 1.50 0.93 0.97 1.16 1.00
1991 1.50 0.92 1.14 1.06 1.00
1992 1.55 0.92 1.00 1.09 1.00
1993 1.53 0.92 1.04 1.03 1.00
1994 1.46 0.93 0.99 1.06 1.00
1995 1.52 0.92 0.99 1.07 1.00
1996 1.45 0.93 1.03 0.93 1.00
1997 1.46 0.94 0.95 0.95 1.00
1998 1.39 0.94 0.98 0.98 1.00
1999 1.34 0.95 0.93 1.04 1.00
2000 1.38 0.95 0.94 0.87 1.00
2001 1.37 0.95 0.94 0.91 1.00
2002 1.40 0.95 0.89 0.96 1.00
2003 1.37 0.95 0.93 0.96 1.00
2004 1.27 0.97 0.93 0.95 1.00
2005 1.29 0.96 0.95 0.97 1.00
2006 1.30 0.96 0.91 1.00 1.00
2007 1.22 0.98 0.88 1.00 1.00
Source: Authors' analysis of CEPR extract of the Current Population Survey Outgoing Rotation Group.
The Decline in African-American Representation in Unions and Manufacturing, 1979-2007 • 20
TABLE 8C
Relative Representation of Males in Union Workforce, by Race or Ethnicity, 1983-2007
(Representation among unions / representation total workforce)
Black White Hispanic Other Overall
1979 . . . . .
1980 . . . . .
1981 . . . . .
1982 . . . . .
1983 1.45 0.96 1.05 0.87 1.00
1984 1.43 0.95 1.11 0.88 1.00
1985 1.38 0.95 1.10 0.88 1.00
1986 1.41 0.96 1.01 0.85 1.00
1987 1.37 0.96 1.01 0.96 1.00
1988 1.44 0.96 0.95 0.87 1.00
1989 1.42 0.97 0.90 0.87 1.00
1990 1.41 0.97 0.90 0.93 1.00
1991 1.43 0.96 0.94 0.94 1.00
1992 1.42 0.96 0.98 0.82 1.00
1993 1.41 0.97 0.93 0.78 1.00
1994 1.43 0.96 0.94 0.94 1.00
1995 1.40 0.97 0.89 0.97 1.00
1996 1.40 0.98 0.87 0.82 1.00
1997 1.37 0.99 0.86 0.79 1.00
1998 1.41 0.98 0.85 0.80 1.00
1999 1.38 0.98 0.87 0.81 1.00
2000 1.35 0.99 0.87 0.82 1.00
2001 1.33 0.99 0.84 0.83 1.00
2002 1.35 0.99 0.83 0.89 1.00
2003 1.36 1.00 0.83 0.89 1.00
2004 1.32 1.01 0.81 0.91 1.00
2005 1.29 1.01 0.83 0.88 1.00
2006 1.31 1.02 0.79 0.83 1.00
2007 1.31 1.01 0.81 0.88 1.00
Source: Authors' analysis of CEPR extract of the Current Population Survey Outgoing Rotation Group.

Center for Economic and Policy Research, February 2008 • 21
TABLE 9
Relative Representation in Manufacturing, by Race or Ethnicity, 1979-2007
(Representation among manufacturing workers / representation total workforce)
Black White Hispanic Other Overall
1979 1.01 0.99 1.28 0.82 1.00
1980 0.98 0.99 1.24 1.00 1.00
1981 1.00 0.99 1.25 0.91 1.00
1982 0.98 0.99 1.25 0.92 1.00
1983 1.00 0.99 1.15 1.00 1.00
1984 1.01 0.99 1.17 1.04 1.00
1985 0.99 0.98 1.22 1.00 1.00
1986 1.00 0.98 1.20 1.04 1.00
1987 0.99 0.98 1.17 1.10 1.00
1988 0.97 0.99 1.15 1.00 1.00
1989 0.98 0.99 1.15 1.03 1.00
1990 0.99 0.99 1.16 0.97 1.00
1991 1.00 0.99 1.12 1.06 1.00
1992 1.01 0.99 1.13 1.00 1.00
1993 0.97 0.99 1.13 1.03 1.00
1994 0.95 0.99 1.14 1.03 1.00
1995 0.95 0.99 1.13 1.03 1.00
1996 0.95 0.99 1.09 1.13 1.00
1997 0.94 0.98 1.12 1.16 1.00
1998 0.93 0.99 1.09 1.09 1.00
1999 0.94 0.99 1.09 1.07 1.00
2000 0.90 0.99 1.13 1.11 1.00
2001 0.86 0.99 1.14 1.11 1.00
2002 0.89 1.00 1.09 1.09 1.00
2003 0.87 0.99 1.10 1.16 1.00
2004 0.87 0.99 1.12 1.09 1.00
2005 0.90 0.99 1.09 1.08 1.00
2006 0.85 1.00 1.07 1.07 1.00
2007 0.85 1.01 1.04 1.05 1.00
Source: Authors' analysis of CEPR extract of the Current Population Survey Outgoing Rotation Group.
The Decline in African-American Representation in Unions and Manufacturing, 1979-2007 • 22
TABLE 10
Relative Representation in Auto Manufacturing, by Race or Ethnicity, 1979-2007
(Representation among auto workers / representation in total workforce)
Black White Hispanic Other Overall
1979 1.63 0.97 0.66 0.27 1.00
1980 1.27 1.01 0.61 0.45 1.00
1981 1.51 0.99 0.55 0.39 1.00
1982 1.45 1.00 0.50 0.42 1.00
1983 1.54 0.98 0.65 0.50 1.00
1984 1.69 0.96 0.70 0.46 1.00
1985 1.42 0.99 0.67 0.42 1.00
1986 1.49 0.99 0.67 0.50 1.00
1987 1.27 1.00 0.86 0.48 1.00
1988 1.42 1.00 0.65 0.48 1.00
1989 1.47 1.00 0.55 0.52 1.00
1990 1.31 1.02 0.60 0.52 1.00
1991 1.30 1.02 0.61 0.47 1.00
1992 1.32 1.02 0.67 0.35 1.00
1993 1.30 1.02 0.64 0.52 1.00
1994 1.39 1.00 0.58 0.84 1.00
1995 1.21 1.03 0.63 0.63 1.00
1996 1.35 1.02 0.48 0.90 1.00
1997 1.50 1.01 0.48 0.84 1.00
1998 1.23 1.02 0.68 0.79 1.00
1999 1.34 1.03 0.54 0.64 1.00
2000 1.33 1.04 0.52 0.65 1.00
2001 1.32 1.03 0.59 0.79 1.00
2002 1.27 1.03 0.59 0.85 1.00
2003 1.29 1.06 0.50 0.75 1.00
2004 1.29 1.05 0.59 0.82 1.00
2005 1.50 1.00 0.58 0.97 1.00
2006 1.31 1.05 0.56 0.83 1.00
2007 1.71 1.07 0.55 0.93 1.00
Source: Authors' analysis of CEPR extract of the Current Population Survey Outgoing Rotation Group.