The debate on secular stagnation: a status report
12
No. 182 October 2016 The debate on secular stagnation: a status report The concept of secular stagnation was introduced in 1938 by Alvin Hansen, who was concerned that investment might be too low to achieve full employment. After being forgotten for decades, the concept was revived in November 2013 by Larry Summers, who defined it as a situation in which the economy is unable to approach its potential growth rate, for reasons that include the difficulty of sufficiently reducing real interest rates. The concept initially focused on persistent slackness of demand, but now also encompasses a weakening of potential growth, and particularly of productivity and capital accumulation. The explanations for economic weakness based on supply and demand factors are not exclusive; indeed, they mutually strenghten one another. Slack demand can curtail potential growth through hysteresis effects such as the loss of human capital due to the persistence of long-term unemployment. Reciprocally, expectations of weak long-term potential supply can restrain demand even in the short term. The geographic scope of application of the secular stagnation concept is still open to question. While some economists stress the importance of the global dimension, the initial applications have often been proposed at national level. At present, the academic debate centers on the international transmission of secular stagnation and the attendant risks of currency wars and global economic stagnation. The concept of secular stagnation is the subject of lively debate among economists, in regard to its reality and its causes. Most economists, however, agree on the need for a global response to avert the risk of lasting stagnation– a response combining monetary, fiscal and structural measures, that are preferably coordinated at international level. Source:OECD, Economic Outlook, April 2016. Interpretation: The chart shows average output gaps and average 3-month real interest rates in the United States, Japan, euro area and United Kingdom (weighted by their share of world GDP in PPP). A persistent output gap after the 2008-2009 crisis in the advanced economies, despite a negative real interest rate -5.00% -4.00% -3.00% -2.00% -1.00% 0.00% 1.00% 2.00% 3.00% 4.00% 2005 2006 2007 2008 2009 2010 2011 2012 2013 2014 2015 OECD output gap 3-month real interest rate
Transcript of The debate on secular stagnation: a status report

No. 182October 2016
The debate on secular stagnation: a status report
The concept of secular stagnation was introduced in 1938 by Alvin Hansen, whowas concerned that investment might be too low to achieve full employment.After being forgotten for decades, the concept was revived in November 2013 byLarry Summers, who defined it as a situation in which the economy is unable toapproach its potential growth rate, for reasons that include the difficulty ofsufficiently reducing real interest rates.
The concept initially focused on persistent slackness of demand, but now alsoencompasses a weakening of potential growth, and particularly of productivityand capital accumulation. The explanations for economic weakness based onsupply and demand factors are not exclusive; indeed, they mutually strenghtenone another. Slack demand can curtail potential growth through hysteresiseffects such as the loss of human capital due to the persistence of long-termunemployment. Reciprocally, expectations of weak long-term potential supplycan restrain demand even in the short term.
The geographic scope of application of the secular stagnation concept is stillopen to question. While some economists stress the importance of the globaldimension, the initial applications have often been proposed at national level. Atpresent, the academic debate centers on the international transmission ofsecular stagnation and the attendant risks of currency wars and global economicstagnation.
The concept of secular stagnation is the subject of lively debate amongeconomists, in regard to its reality andits causes. Most economists, however,agree on the need for a globalresponse to avert the risk of lastingstagnation–a response combiningmonetary, fiscal and structuralmeasures, that are preferablycoordinated at international level.
Source:OECD, Economic Outlook, April 2016.
Interpretation: The chart shows average output gaps andaverage 3-month real interest rates in the United States,Japan, euro area and United Kingdom (weighted by theirshare of world GDP in PPP).
A persistent output gap after the 2008-2009 crisis in the advanced economies, despite a
negative real interest rate
-5.00%
-4.00%
-3.00%
-2.00%
-1.00%
0.00%
1.00%
2.00%
3.00%
4.00%
2005 2006 2007 2008 2009 2010 2011 2012 2013 2014 2015
OECD output gap 3-month real interest rate

TRÉSOR-ECONOMICS No. 182 – October 2016 – p. 2
1. Secular stagnation: supply-side or demand-side approach?Introduced by Alvin Hansen in the 1930s, the theory ofsecular stagnation focused initially on the weakness ofdemographic growth and the decline in productivity. Thetheory fell into oblivion after the Second World War. LarrySummers revived it in late 2013 out of concern for the down-trend in growth among the advanced economies. He raisedquestions about the persistent slackness of demand (thedifficulty in closing the output gap) in a context of extremelylow interest rates (see Chart on first page), triggering a stillvigorous debate among economists.
1.1 A concept initially focused on the slackness ofdemand, explained in particular by a rise in desiredsavingIn late 2013, Summers defined the risk of secular stagnationas the risk of a persistent slackness of demand, citing the U.S.economy as a prime example. Weak demand, he argued, isdue to changes in saving and investment behaviours leadingto an increased desire for saving in a context where thegrowth in profitable investment projects appears to beslowing. Summers described this problem as an "excess ofsaving"1, which should be understood as an excess ofdesired saving before an adjustment in real interest rates.The excess of saving, according to Summers, dragged downreal interest rates and hampered the economy when ratescould no longer fall sufficiently given the zero lower bound–a situation known as the liquidity trap2 (see Part 2 for adetailed explanation).
In his initial comments, Summers stressed the inefficientdistribution of income, arguing that it promoted savings inthe developed economies, particularly the U.S. Changes inincome distribution have benefited less to agents with thestrongest marginal propensity to consume. Indeed, asJoseph Stiglitz and others have noted3, corporate profits rosein the 2000s and wage inequality widened. High-incomehouseholds–who enjoy the benefits of their wage income,their dynamic savings, and their capital gains–generally havean above-average saving rate. Paul Krugman has challengedthis argument by pointing out that the U.S. saving rate felleven as inequality increased between 1980 and 2008-2009.
This finding appears to suggest that a rise in inequality doesnot necessarily reduce demand4. Summers, however,emphasised that the rise in saving was concealed by anincrease in debt among the lowest-income households, atrend that sustained demand artificially before the crisis. Soas long as vigorous debt growth persisted, the economy didnot suffer, but Summers argued that the debt slowdown trig-gered by the 2008-2009 crisis revealed secular stagnation.
Summers later extended his analysis from national to globallevel. It was then picked up by other economists5, who drewinspiration from the "saving glut" theory developed by BenBernanke in the 2000s. Countries with a lower marginalpropensity to consume (such as oil-exporting countries andChina, which has a high saving rate because, among otherreasons, of weak social protection) seemingly enjoyedstrong income growth in the 2000s relative to countries witha higher marginal propensity to consume (such as the U.S.).Summers argues that this reallocation of wealth drove upglobal saving, with consequences including a negativeimpact on U.S. demand. By way of illustration, Olivier Blan-chard et al.6 note that the saving rate in the emerging coun-tries rose by 10 percentage points in the 2000s, causing a1.7 percentage point increase in the global saving ratebetween 2000 and 2007.
1.2 A concept complemented by supply factors,which explain such phenomena as the decline ininvestmentIt is harder to use demand factors to explain the investmentdowntrend, whose causes appear to include the slowergrowth in the labour force and the decline in productivitygains, as Summers already noted in 2013. Economists suchas Robert Gordon and Barry Eichengreen7 stress the burdenof these supply factors on potential growth. For example, thedependency ratio8 in Europe is expected to rise from 20.3%in 2000 to 35.4% in 2025 and 57.5% in 2100 (see §3.1 andChart 5), reducing labour factor growth. Regarding thecauses of the decline in productivity growth (see Chart 1),opinions are divided. Gordon contends that the great wavesof education may have ended in the advanced economies,
(1) The excess of saving concept was referenced by Mario Draghi in his 2 May 2016 speech to explain the weakness of interestrates: "It is this phenomenon-the global excess of savings over profitable investments-that is driving interest rates down to very low levels."Similarly, Barry Eichengreen (2015) defines secular stagnation "as a downward tendency of the real interest rate, reflecting an excess ofdesired saving over desired investment, and resulting in a persistent output gap and/or slow rate of economic growth" ("Secular Stagnation: TheLong View", American Economic Review, vol. 105, no. 5, May 2015, pp. 66-70; quote from p. 66). See also http://larrysummers.com/2015/04/01/on-secular-stagnation-a-response-to-bernanke/: "The essence of secular stagnation is a chronicexcess of saving over investment."
(2) A "liquidity trap" is defined here as a situation where the real interest rate does not achieve equilibrium between desiredsaving and desired investment. Its characteristics include an aggregate demand deficit and destruction of wealth (see Part 2).
(3) See http://opinionator.blogs.nytimes.com/2013/01/19/inequality-is-holding-back-the-recovery/.(4) See http://krugman.blogs.nytimes.com/2013/01/20/inequality-and-recovery/?_r=0: "So look at overall private saving as a share
of GDP. The trend before the crisis was down, not up–and that surge with the crisis clearly wasn't driven by a surge in inequality."(5) S. Lo and K. Rogoff also articulate the argument of inefficient distribution of income at national and world levels in their
article "Secular stagnation, debt overhang and other rationales for sluggish growth, six years on" (2014): "Growing inequality ofincome, at least within countries, implies reducing relative spending power for low-income households with a high propensity to consume. Conversely,increasing equality across the world as a whole, powered by the transformation of India and China, might have also led to a downward shift indemand, as fast-growing countries with underdeveloped capital markets spin off savings to diversify risk."
(6) See Teulings, C. and Baldwin, R. (eds) (2014), "Secular Stagnation: Facts, Causes and Cures", voxeu.org book, chap. 8, Blanchard,O., Furceri , D. and Pescatori, A., "A prolonged period of low interest rates?"
(7) See Teulings and Baldwin (eds) (2014), op. cit. (note 6), chaps. 2-3.(8) Jimeno, J. F., Smets, F. and Yiangou, J. (in Teulings and Baldwin (eds) (2014), op. cit. (note 6), chap. 13) define the
dependency ratio as the number of retirees (proxied by the number of persons over 65) divided by the number of working-age persons (proxied by the number of persons aged 20-64).

TRÉSOR-ECONOMICS No. 182 – October 2016 – p. 3
restraining future rises in average education levels and thusin productivity9. Other authors, such as Eichengreen, believethis weakness in productivity is temporary: productivity gainsshould materialise once the production system has adjustedand has been restructured to fully exploit the potential ofnew technologies–particularly the digital revolution with bigdata, machine learning and mobile robotics.
Chart 1: Average annual growth in total factor productivity
Source: OECD, "Growth in GDP per capita, productivity and ULC" data base.
Interpretation: Data series for starred countries end in 2013.
1.3 Mutually strengthening supply and demandfactorsThese explanations in terms of supply and demand factorsare not mutually exclusive. On the contrary, they strengthenone another.
Factors that slow demand can inhibit potential growththrough hysteresis effects. These may arise, for example,
from a loss of human capital due to the persistence of highlong-term unemployment, which undermines workerproductivity or leads people of working age to leave thelabour market. The climate of uncertainty can also lead firmsto accumulate precautionary saving in the form of liquidassets and to cut back on investment, both tangible andintangible, with a negative impact on capital stock and futureproductivity.
Conversely, factors that weaken potential supply can restraindemand even in the short term through expectation effects.For example, a return of growth in technical progress to itshistorically low standard pace may cause an immediateslowdown in investment aimed at optimising the adjustmentto the future decline in capital stock. The slowdown in demo-graphic growth, which diminishes the prospects for futuredemand, can also curb present investment.
Blanchard, Cerruti and Summers (2015)10 analyse 122recessions in 23 countries in the past 50 years to empiricallytest the presence of hysteresis or expectation effects. Theauthors demonstrate a correlation between recession andlasting deterioration of the economy (in two-thirds of cases),or even of growth (in one-half of cases) in the post-recessionyears. To determine if the correlation is due to hysteresis orexpectation effects, the authors remove the recessionscaused by supply shocks (such as a rise in oil prices or afinancial crisis), which would trigger a crisis and havepersistent effects on the economy. Among the remainingrecessions, the authors show the likely presence of hyste-resis or expectation effects in the sample studied.
2. Secular stagnation: a decline in the equilibrium real interest rate that makes economies vulnerable topermanent weakness
2.1 A gap between desired saving and desiredinvestment that sends down the equilibrium realinterest rateThe supply and demand factors described above lead to an"excess of saving" if the real interest rate stays constant. In aclassic IS-LM model, excess saving is eliminated through adecrease in the real interest rate (see Charts 2): a lower realinterest rate discourages agents from saving and stimulatesinvestment, resulting in a balance between saving and invest-
ment11. In some circumstances, however, the downwardadjustment in the real interest rate may not be sufficient toachieve this equilibrium, particularly when nominal interestrates have trouble moving below zero and inflation is veryweak. In this situation, known as a liquidity trap, it is thequantities that adjust in order to balance saving and invest-ment: output is cut back to adjust to weak demand, reducingincome and saving, up to the point where saving matcheslonger-term investment.
(9) Gordon also notes that, in the case of the U.S., this involves a return of the growth in technical progress to its historically lownorm. Between 1900 and 1930, total factor productivity (TFP) rose by an estimated average 0.5% a year, as it has since 1980.The anomaly appears to reside, instead, in the vigour of the TFP growth rate from 1930 to 1980, which was three times asgreat.
-1.0%
-0.5%
0.0%
0.5%
1.0%
1.5%
2.0%
France Germany Italy Spain* UnitedKingdom
United States Japan*
1985-2000 2001-2007 2008-2014
(10) Blanchard, O., Cerruti, E. and Summers, L. (2015), "Inflation and activity: two explorations and their monetary policyimplications", Peterson Institute for International Economics.
(11) As the saving-investment balance is an accounting equation at global level, it is always obtained ex post.

TRÉSOR-ECONOMICS No. 182 – October 2016 – p. 4
By measuring the equilibrium real interest rate, we can esti-mate the risk of such an adjustment through quantities,calculated as the gap between the equilibrium real interestrate and the effective real interest rate. The equilibrium realinterest rate is the rate that–with a zero output gap–makesit possible to balance saving and investment, and thus topreserve full employment and price stability. The effectivereal rate should therefore be lower than the equilibriumrate when output is below its potential. As of now, empiricalanalyses suggest that the equilibrium real interest rate has
been trending down since the early 2000s and has stayedlow–or even slightly negative in some developed econo-mies–after the 2008-2009 financial crisis, reflecting an ex-ante situation of excess saving and investment deficit. TheU.S. equilibrium real rate may remain below its 2% "refe-rence value"12 in the years ahead, according to estimates byLaubach and Williams (2015)13 (see Box 1) and Hamiltonet al. (2015)14. Because of the high uncertainty of theseestimates, the latter authors estimate a forecasting intervalof 0.4 - 2% in the longer term.
Chart 2: In an IS-LM model, downward adjustment of prices (real interest rate) or of quantities (decline in output) in the event of a liquidity trap
Source: DG Trésor, illustration diagrams.Interpretation: In an IS-LM model, when agents engage in intensive saving behaviour and the number of profitable investment projects is seen todecrease, the real interest rate adjusts downwards to stimulate investment and discourage saving (top left chart). If the effective real interest rate cannotreach the level that would balance saving and investment, excess saving persists in the economy (top right chart, gap between points A and B). In thelonger run, output decreases to adjust to weak demand: income and therefore saving decrease, until the two aggregates match (bottom chart).
(12) Value based on the long-term forecasts by the Federal Open Market Committee (see FOMC December 2012 Summary),which gave median values of 4% for the nominal rate and 2% for inflation, implying a real rate of 2%.
(13) Laubach, T. and Williams, J. C. (2015), "Measuring the Natural Rate of Interest Redux", Working Paper, Fed of San Francisco.(14) Hamilton, J. D., Harris, E. S., Hatzius J. and West, K. D. (2015), "The Equilibrium Real Funds Rate: Past, Present and
Future", NBER Working Paper no. 21476.
TRÉSOR-ECONOMICS No. 182 – October 2016 – p. 5
2.2 Does the decline in the equilibrium real interestrate expose the economy to a permanent risk ofweakness in today's conditions?A weakness in equilibrium real interest rates could put theeconomy at risk of permanent stagnation. The lower theequilibrium real rate, the harder it is for the effective realrate to converge towards it, because of the nominal ratefloor–particularly when inflation is weak. The problem isaggravated in the event of an economic shock that createsa negative output gap (such as the 2009-2010 financialcrisis). When the output gap is negative, the interest ratemust fall below the equilibrium rate in order to stimulatethe economy and close the output gap (if this does nothappen, or to complement its effects if it does, otherlevers–such as fiscal policy–can be applied as a stimulus).
The OECD estimates15 suggest heterogeneous gaps betweenequilibrium real interest rates and effective rates, especiallysince the 2008-2009 crisis. In the U.K. and U.S., the effectivereal interest rate appears to have stayed close to or below theequilibrium rate in recent years, with a gradual narrowing ofthe output gap. By contrast, in Japan, the effective rate hasbeen running well above the equilibrium rate for severalyears, even as the output gap has remained wide since the2008-2009 crisis. The OECD sees a more ambiguous patternin the euro area, with a phase in which the effective rateexceeded the equilibrium rate (2007-2010) followed by agradual convergence (see Charts 4) at a time when theoutput gap started to widen again.
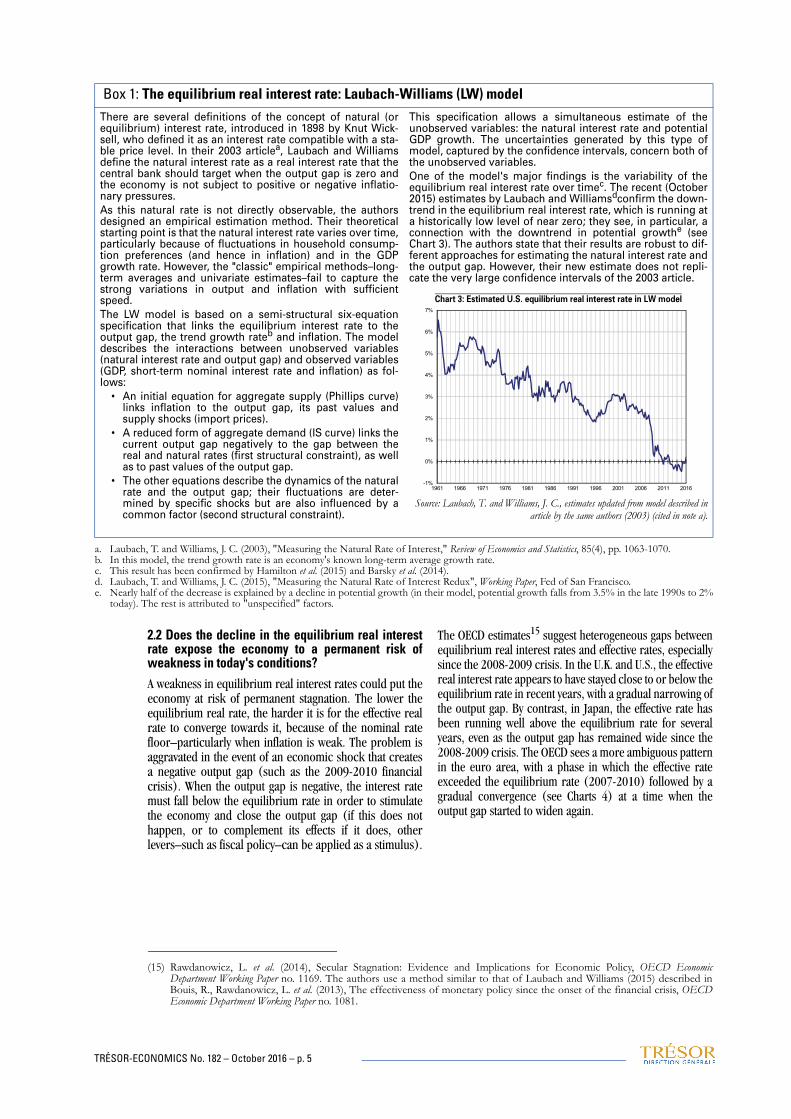
Box 1: The equilibrium real interest rate: Laubach-Williams (LW) modelThere are several definitions of the concept of natural (orequilibrium) interest rate, introduced in 1898 by Knut Wick-sell, who defined it as an interest rate compatible with a sta-ble price level. In their 2003 articlea, Laubach and Williamsdefine the natural interest rate as a real interest rate that thecentral bank should target when the output gap is zero andthe economy is not subject to positive or negative inflatio-nary pressures.As this natural rate is not directly observable, the authorsdesigned an empirical estimation method. Their theoreticalstarting point is that the natural interest rate varies over time,particularly because of fluctuations in household consump-tion preferences (and hence in inflation) and in the GDPgrowth rate. However, the "classic" empirical methods–long-term averages and univariate estimates–fail to capture thestrong variations in output and inflation with sufficientspeed.The LW model is based on a semi-structural six-equationspecification that links the equilibrium interest rate to theoutput gap, the trend growth rateb and inflation. The modeldescribes the interactions between unobserved variables(natural interest rate and output gap) and observed variables(GDP, short-term nominal interest rate and inflation) as fol-lows:
• An initial equation for aggregate supply (Phillips curve)links inflation to the output gap, its past values andsupply shocks (import prices).
• A reduced form of aggregate demand (IS curve) links thecurrent output gap negatively to the gap between thereal and natural rates (first structural constraint), as wellas to past values of the output gap.
• The other equations describe the dynamics of the naturalrate and the output gap; their fluctuations are deter-mined by specific shocks but are also influenced by acommon factor (second structural constraint).
This specification allows a simultaneous estimate of theunobserved variables: the natural interest rate and potentialGDP growth. The uncertainties generated by this type ofmodel, captured by the confidence intervals, concern both ofthe unobserved variables.One of the model's major findings is the variability of theequilibrium real interest rate over timec. The recent (October2015) estimates by Laubach and Williamsdconfirm the down-trend in the equilibrium real interest rate, which is running ata historically low level of near zero; they see, in particular, aconnection with the downtrend in potential growthe (seeChart 3). The authors state that their results are robust to dif-ferent approaches for estimating the natural interest rate andthe output gap. However, their new estimate does not repli-cate the very large confidence intervals of the 2003 article.
Chart 3: Estimated U.S. equilibrium real interest rate in LW model
Source: Laubach, T. and Williams, J. C., estimates updated from model described inarticle by the same authors (2003) (cited in note a).
a. Laubach, T. and Williams, J. C. (2003), "Measuring the Natural Rate of Interest," Review of Economics and Statistics, 85(4), pp. 1063-1070.b. In this model, the trend growth rate is an economy's known long-term average growth rate.c. This result has been confirmed by Hamilton et al. (2015) and Barsky et al. (2014).d. Laubach, T. and Williams, J. C. (2015), "Measuring the Natural Rate of Interest Redux", Working Paper, Fed of San Francisco.e. Nearly half of the decrease is explained by a decline in potential growth (in their model, potential growth falls from 3.5% in the late 1990s to 2%
today). The rest is attributed to "unspecified" factors.
-1%
0%
1%
2%
3%
4%
5%
6%
7%
1961 1966 1971 1976 1981 1986 1991 1996 2001 2006 2011 2016
(15) Rawdanowicz, L. et al. (2014), Secular Stagnation: Evidence and Implications for Economic Policy, OECD EconomicDepartment Working Paper no. 1169. The authors use a method similar to that of Laubach and Williams (2015) described inBouis, R., Rawdanowicz, L. et al. (2013), The effectiveness of monetary policy since the onset of the financial crisis, OECDEconomic Department Working Paper no. 1081.

TRÉSOR-ECONOMICS No. 182 – October 2016 – p. 6
3. Secular stagnation: a local or global phenomenon?3.1 Local application of the concept: from the U.S.example to the European exampleWhile Summers effectively stressed the role of internationalfactors–particularly the saving-investment imbalances inlarge areas of the world–in his address to the IMF economicforum in November 2013, his discussion of the U.S. exampleinitially led to the application of secular stagnation to indivi-dual countries or regions. The concept was applied to theU.S. in the context of a heated debate on the rise of inequalityin the U.S., which included the publication of ThomasPiketty's study16. However, the U.S. economy's accelerationfrom 2013, on-despite a major fiscal consolidation, soonshifted the debate away from the U.S. towards the euro area.The limpness of the euro area recovery, and particularly ofinflation and investment, raised fears of slack growth overthe long run. The debate also concerns Japan, where growth
has been relatively weak since the 1990s amid sluggishproductivity and population ageing. The weakness of infla-tion, often in negative territory since the mid-1990s, restrictsthe Japanese central bank's manoeuvring room and aggra-vates the risk of adjustment through quantities.
Several factors are cited as evidence of the risks to the euroarea, as noted by Jimeno, Smets and Yiangou17. The increasein the dependency ratio (see Chart 5) and uncertainty overthe future of pension systems could drive up the saving rateper capita. Explanations based on rising inequality and thelow propensity to consume among higher-income groupspervaded the analyses of the U.S., but they have been invokedless often for the euro area, where income inequality is loweralbeit trending up (see Chart 6).
Charts 4: Estimated equilibrium real interest rate (OECD) and effective real interest rate
United States Japan
Euro area United Kingdom
Source: Rawdanowicz et al. (2014).
-6%
-4%
-2%
0%
2%
4%
6%
8%
10%
1990 1992 1994 1996 1998 2000 2002 2004 2006 2008 2010 2012
Confidence interval 95 % Estimates of the natural rate of interest - OECD Real effective interest rate
-6%
-4%
-2%
0%
2%
4%
6%
8%
10%
1990 1992 1994 1996 1998 2000 2002 2004 2006 2008 2010 2012
-6%
-4%
-2%
0%
2%
4%
6%
8%
10%
1990 1992 1994 1996 1998 2000 2002 2004 2006 2008 2010 2012
-6%
-4%
-2%
0%
2%
4%
6%
8%
10%
1990 1992 1994 1996 1998 2000 2002 2004 2006 2008 2010 2012
(16) Piketty, T. (2014), "Capital in the Twenty-First Century", Cambridge, Mass.: Harvard University Press / Belknap Press (transl.of Le capital au XXIe siècle, Paris: Le Seuil).
(17) Teulings, Baldwin et al. (2014), op. cit. (note 16), chap. 13.

TRÉSOR-ECONOMICS No. 182 – October 2016 – p. 7
The imbalance between desired saving and desired invest-ment also seems due to slack investment. Several factors maycontribute to the structural weakness of investment in theEuropean Union. They include Member States' commitmentto long-term debt reduction, a rise in risk premiums thatmay have increased the cost of capital in certain MemberStates after the sovereign-debt crisis, weak demographicgrowth, and a relatively weaker productivity performancethan in the other major economies (see Chart 1). The 2008-2009 crisis accentuated this structural decline: the climate ofuncertainty–which leads firms to accumulate precautionarysaving ex ante in the form of liquid assets–curbs bothtangible and intangible investment. The decline in investment(and economic activity) since the 2008-2009 crisis may alsorestrain future investment. As the OECD working paper byRawdanowicz et al. (2014)18 emphasises, hysteresis effectsseem relatively stronger in the euro area (0.3) than in theU.S. (0.1)–possibly owing to the euro area's lesser labour-market flexibility or a lower geographic mobility of itsworkers.
3.2 A global dimension at the core of secularstagnation, based on market transmission of safeassetsSeveral economists19 have voiced their doubts about aregional analysis of secular stagnation. In a world of inte-grated goods and capital markets, real interest rates are alsodetermined by international factors such as the volume offoreign saving. A country experiencing secular stagnation inisolation could pull out of it (or export its problem) thanksto capital flows and exchange-rate adjustments. A shortage ofprofitable investment projects in the domestic economywould trigger a capital outflow and hence a depreciation of
the national currency. Thanks to competitiveness gains, thedepreciation would allow the country to revive exports andtherefore the domestic economy. Secular stagnation in anopen economy therefore implies a persistent weakness ofprofitable investment projects in all countries or weak inte-gration with the other economies.
The article by Caballero et al. (2015)20 references this inter-national dimension. The authors argue that the observeddowntrend in real interest rates reflects a growing scarcity ofsafe assets (a point also raised by Blanchard et al.21) afterthe 2008-2009 crisis. Caballero et al. elaborate on thenotion of "liquidity trap", which appeared in the initialdebates on secular stagnation, by describing what they call a"safety trap"22. In this situation, the real interest rate thatbalances global safe-asset supply and demand is negativeand unattainable, particularly because of the positivity cons-traint on the nominal rate and because of low inflation. Theauthors therefore refocus the debate on safe-asset supplyand demand. The simplified version of the theoreticalmodel23 yields two opposing equilibriums: either all coun-tries fall into a safety trap, or all countries escape it. In afuller version of the model–which assumes a domestic biason goods and an income elasticity of trade differing fromunity–the authors show that the severity of the safety trap ineach country results from several propagation mechanisms.First, an efficient international integration of safe-assetmarkets (low domestic bias) may promote the export ofsurplus saving and contagion effects. Second, when acurrency is perceived as a safe asset, the issuer country'seconomy will deteriorate24. The reason is that each countrywill offset the weakness of domestic demand by accumula-ting current-account surpluses and capital outflows to the
Chart 5: Dependency ratios = population over 65 / population aged 20-64 Chart 6: Disposable income inequality in OECD member countries (Gini)
Source: UN, "The Revision of the World Population Prospects 2015" data base. Source: OECD, Focus Inégalités et croissance, December 2014.
0%
10%
20%
30%
40%
50%
60%
70%
80%
World Europe United Kingdom Italy Spain France Germany
0.000
0.100
0.200
0.300
0.400
0.500
0.600
1985 2011 or most recent year
Rise in inequality Weak variation in inequality
Decrease in inequality
(18) Rawdanowicz et al. (2014), op. cit. (note 15).(19) See Bernanke: https://www.brookings.edu/blog/ben-bernanke/2015/03/31/why-are-interest-rates-so-low-part-2-secular-
stagnation/. Responding to this post, Summers himself admitted: "With the benefit of hindsight, I wish I had been clearer in seeking toresurrect the secular stagnation hypothesis that one should take a global perspective" (https://www.brookings.edu/blog/ben-bernanke/2015/04/01/on-secular-stagnation-larry-summers-responds-to-ben-bernanke/).
(20) Caballero, R. J., Farhi, E. and Gourinchas, P. O. (2015), "Global imbalances and currency wars at the ZLB", NBER WorkingPaper No. 21670.
(21) See Teulings, Baldwin et al. (2014), op. cit (note 6), chap. 8.(22) Like liquidity traps, safety traps imply an asset shortage, zero lower bound, aggregate demand deficits and recessions.
However, the safety trap specifically concerns a single asset class: safe assets. This distinction is important because the supplyof safe assets is less elastic. For example, it is hard for firms or the financial sector to produce safe assets.
(23) The authors describe a perpetual-youth, overlapping-generations model incorporating nominal rigidities (on prices andwages) to illustrate the heterogeneity of financial-asset supply and demand across different countries.
(24) The issuing country faces a safety trap and a greater under-utilisation of productive capacity if it was already experiencing asafety trap in autarky. It is at even greater risk of falling into a safety trap if it was not in a safety trap in autarky. The authorsdescribe here what they call the "paradox of the reserve currency": if, in normal conditions, the economy whose currency isperceived as a safe asset enjoys purchasing power gains, its currency's hegemony may become a handicap if a safety trapdevelops.
TRÉSOR-ECONOMICS No. 182 – October 2016 – p. 8
"safe" economy. This increases the risk of a safety trap in thesafe economy, all the more so as the capital inflows willcause its currency to appreciate and undermine competitive-ness, aggravating its productive capacity under-utilisation.
The presence of even stronger domestic bias in national safe-asset markets could mitigate the contagion mechanismsdescribed by this model. Assuming adequate financial inte-gration, the model finds that the U.S. should be particularlyaffected by the global saving glut, which causes safety traps.
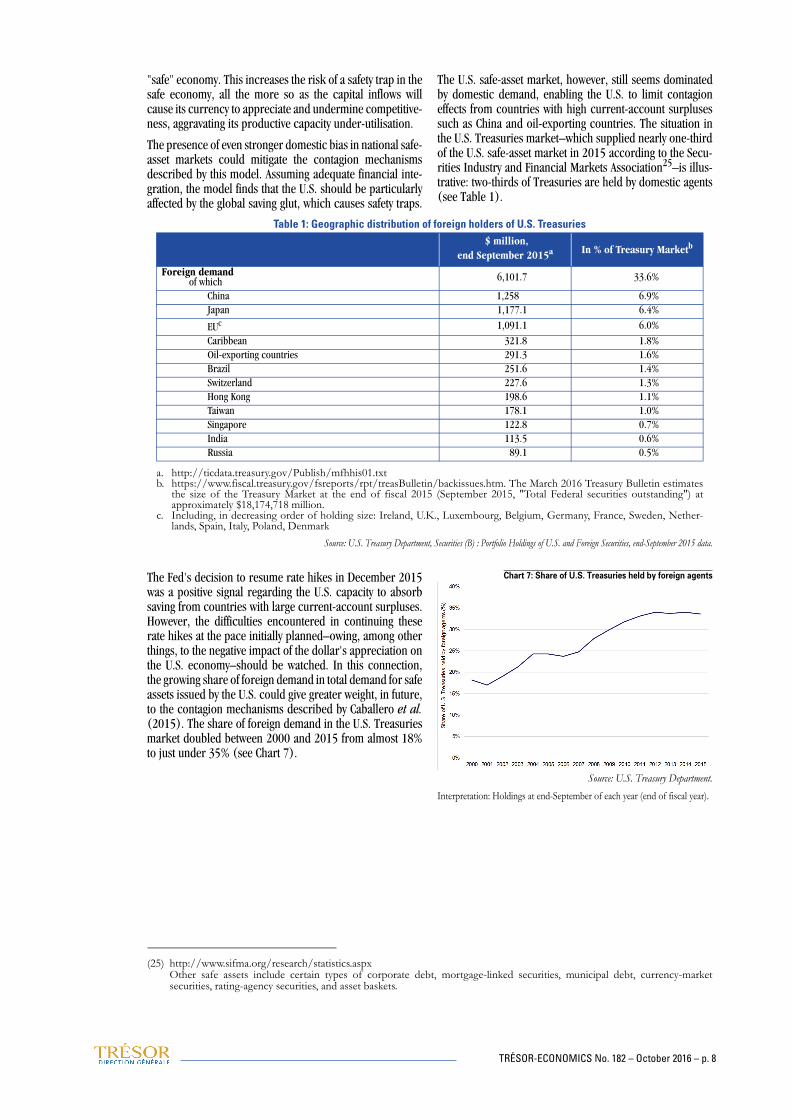
The U.S. safe-asset market, however, still seems dominatedby domestic demand, enabling the U.S. to limit contagioneffects from countries with high current-account surplusessuch as China and oil-exporting countries. The situation inthe U.S. Treasuries market–which supplied nearly one-thirdof the U.S. safe-asset market in 2015 according to the Secu-rities Industry and Financial Markets Association25–is illus-trative: two-thirds of Treasuries are held by domestic agents(see Table 1).
Source: U.S. Treasury Department, Securities (B) : Portfolio Holdings of U.S. and Foreign Securities, end-September 2015 data.
The Fed's decision to resume rate hikes in December 2015was a positive signal regarding the U.S. capacity to absorbsaving from countries with large current-account surpluses.However, the difficulties encountered in continuing theserate hikes at the pace initially planned–owing, among otherthings, to the negative impact of the dollar's appreciation onthe U.S. economy–should be watched. In this connection,the growing share of foreign demand in total demand for safeassets issued by the U.S. could give greater weight, in future,to the contagion mechanisms described by Caballero et al.(2015). The share of foreign demand in the U.S. Treasuriesmarket doubled between 2000 and 2015 from almost 18%to just under 35% (see Chart 7).
Chart 7: Share of U.S. Treasuries held by foreign agents
Source: U.S. Treasury Department.
Interpretation: Holdings at end-September of each year (end of fiscal year).
(25) http://www.sifma.org/research/statistics.aspxOther safe assets include certain types of corporate debt, mortgage-linked securities, municipal debt, currency-marketsecurities, rating-agency securities, and asset baskets.
Table 1: Geographic distribution of foreign holders of U.S. Treasuries $ million,
end September 2015a In % of Treasury Marketb
Foreign demand of which 6,101.7 33.6%
China 1,258 6.9%Japan 1,177.1 6.4%
EUc 1,091.1 6.0%
Caribbean 321.8 1.8%Oil-exporting countries 291.3 1.6%Brazil 251.6 1.4%Switzerland 227.6 1.3%Hong Kong 198.6 1.1%Taiwan 178.1 1.0%Singapore 122.8 0.7%India 113.5 0.6%Russia 89.1 0.5%
a. http://ticdata.treasury.gov/Publish/mfhhis01.txtb. https://www.fiscal.treasury.gov/fsreports/rpt/treasBulletin/backissues.htm. The March 2016 Treasury Bulletin estimates
the size of the Treasury Market at the end of fiscal 2015 (September 2015, "Total Federal securities outstanding") atapproximately $18,174,718 million.
c. Including, in decreasing order of holding size: Ireland, U.K., Luxembourg, Belgium, Germany, France, Sweden, Nether-lands, Spain, Italy, Poland, Denmark

TRÉSOR-ECONOMICS No. 182 – October 2016 – p. 9
4. Policy recommendations to mitigate the risk of secular stagnation4.1 An overall response combining monetary andfiscal policies and structural reformsIf secular stagnation does materialise, economists now agreeon the need to apply all the tools of economic policy depen-ding on each country's manoeuvring room and efficiency. Itis still hard to decide between the presence of hysteresiseffects and that of expectation effects. As Blanchard et al.(2015) point out26, both phenomena are probably at work,hence the vital need to combine reforms that supportdemand and potential output.
Without calling current monetary policies into question,several academics call for prudence in regard to monetarypolicy decisions, given the uncertainty over estimates of the
equilibrium real interest rate. Hamilton et al. (2015)27
suggest, for example, assigning greater weight to past valuesof the key rate in determining the current key rate, i.e., adop-ting a more inert monetary policy28. The authors concludethat it would be preferable for the Fed to raise interest rateslater rather than sooner, even if this entails a faster subse-quent rise in rates (see Box 2). Conversely, other econo-mists, who do not subscribe to the secular stagnationtheory29, recommend the adoption of more restrictivemonetary policies to provide long-term protection from theadverse effects on financial stability of over–accommodativemonetary policies–such as the risk of capital misallocationand even bubbles.
Summers, joined by Blanchard, advocates instead a fiscalresponse that would support demand (through a rise inpublic spending) but also potential output (by raisingproductivity). Among other examples, Summers discusses arevival of public infrastructure investment, in a contextcharacterised by very low lending rates, relatively cheapmaterials given the decline in commodity prices and–parti-
cularly in the U.S.–the availability of construction workers.The IMF30 also recommends raising expenditures on activeemployment and education policies31, R&D investment, andtransfers targeted at households relatively more affected byslower economic growth. These measures would aim toincrease productivity and combat the risk of secular stagna-tion.
(26) Blanchard, Cerruti and Summers (2015), op. cit (note 10).(27) Hamilton et al. (2015), op. cit (note 14).(28) We define a more inert monetary policy here as a monetary rule that attaches relatively greater weight to past (and observed)
values of the interest rate.(29) See Borio, C. and Disyatat, P., "Policy frameworks should allow for the option to tighten monetary policy to lean against the
build-up of financial imbalances even if near-term inflation appears to be under control" (http://www.bis.org/publ/work346.pdf).
Box 2: Monetary policy rule and uncertainty about the estimate of the equilibrium real interest ratea Using the Federal Reserve Bank's FRB/US model, the article by Hamilton et al. (2015) shows that the uncertainty over thevalue of the equilibrium interest rate (estimated in an interval of 0.4-2%) generates volatility in U.S. economic perfor-mance and in interest rates movements if the Fed follows a "classic" Taylor rule (with no policy inertia) of the form:
If the equilibrium interest rate r* is estimated correctly, the economy and interest rates conform to the medium-termforecasts of the model's baseline scenario. However, if the estimated value of r* exceeds its actual value, the Fed mayraise rates sooner and more aggressively, and this may hinder the decline in unemployment and the attainment of the 2%inflation target. Eventually, the economic downturn slows the increase in Fed rates. Conversely, if the estimated value ofr* is below its actual value, the Fed will raise rates later, stimulating the decline in unemployment and sending inflationover the 2% target. The Fed will then need to raise rates faster than expected to keep the economy from overheating.To limit this volatility linked to the uncertainty over the estimated equilibrium real interest rate r*, the authors-drawing onthe results of Orphanides and Williams (2002)b–recommend the adoption of a more inert monetary policy rule based onthe "classic" Taylor rule, to which they add an autoregressive term:
In the event of uncertainty about the value of r*, this new monetary policy rule makes it possible to keep the economy andinterest rates moving on a track relatively closer to the reference scenario (classic Taylor rule when the value of r* is notuncertain) than the classic rule. This rule with inertia also suggests that the Fed should normalise rates later and that rateswill then rise faster. The argument is that the rate response will require a greater decline in unemployment and a steeperincrease in inflation than with the earlier rule. This patience in raising rates should result in a greater decrease inemployment and stronger inflation, requiring larger rate hikes later on.Adopting a more inert policy has both advantages and disadvantages: on the one hand, inertia yields less volatile pathsfor the economy and rates. On the other hand, a more inert policy generates stronger rate responses in the future. Byusing a well-being measurement function, the authors show that the greater the uncertainty over the equilibrium realinterest rate, the higher the inertia (weight assigned to past values of the key rate in determining present key rate) must beto minimise losses of well-being.
a. Cf. Hamilton J. D. et al. (2015), op. cit. (note 14).b. Orphanides, A. and Williams, J. C. (2002), "Robust Monetary Policy Rules with Unknown Natural Rates", Brookings Papers on Economic Activity.
it rt∗ πt 0 5 πt π∗–( ) 2 ut u∗–( )–,+ +=
it a0it 1– 1( a0 )– rt∗ πt+( )+ 0 5 πt π∗–( ) 2 ut u∗–( )–,+=
(30) See World Economic Outlook, April 2016, chap. 1.(31) See, for example, Anne-Braun, J., Lemoine, K., Saillard, E. and Taillepied, P. (2016), "Initial and continuing education: the
implications for a knowledge-based economy", Trésor-Economics, no. 165

TRÉSOR-ECONOMICS No. 182 – October 2016 – p. 10
Structural responses are increasingly present in the debate,in particular to stimulate productivity and counteract hyste-resis and expectation effects. Beyond the fiscal stimulusmeasures mentioned earlier, reforms in the composition ofpublic revenues and spending could provide incentives toexpanding private investment and innovation–for example,in green technologies. It is also vital to limit uncertainty inorder to fight against negative expectation effects. In thisarea, specific announcements on future changes in retire-ment pension systems would make it possible to curtailprecautionary saving in countries experiencing a substantialageing of their labour force. Financial reforms such as theenactment of the European Banking Union would also stimu-late a domestic demand recovery. Lastly, measures concer-ning the labour market to promote the return to employmentcould help to combat hysteresis effects. To limit the negativeeffects of these policies in the short term, the introduction ofminimum guaranteed welfare benefits in countries currentlylacking them would also provide a short-term stimulus todomestic demand.
4.2 A coordinated response to allow for the globaldimension of the phenomenonEconomists also emphasise the need for international coor-dination of economic policies to address the risk of secularstagnation.
While fiscal stimulus is an instrument for getting out of safetytraps, its use must be coordinated to avoid an under-sizedglobal response. In the models designed by Eggertsson et al.(2015)32 and Caballero et al. (2015)33, fiscal policies aresources of externalities in an integrated world and in a globalsafety-trap situation. The reason is that fiscal stimulus, parti-cularly in countries running a current-account surplus,would allow an increase in the global equilibrium real inte-rest rate and so make it easier to rebalance the global safe-asset market. Without coordination, "free rider" behavioursmay appear and lead to an inadequate increase in globalpublic demand. A country could thus benefit from itspartners' revival of public demand–through export growthand a decline in the global real interest rate–without havingto implement a fiscal stimulus itself.
Policies aimed at raising competitiveness–such as anexchange-rate policy or cost-competitiveness policy–mustalso be coordinated under pain of seeing their effects cancelone another out, or even triggering a "race to the bottom".Devaluations and competitive disinflation policies that seekto rely on external demand to revive the domestic economycan, for example, provoke a currency war that would furtherdamage the world economy. As Benoît Coeuré stressed in hisspeech in Berkeley in November 201534, priority must go toreforms aimed at strengthening productivity rather thancompetitiveness through cost compression.
It is also vital to take account of the global effects of struc-tural reforms aimed at achieving price and wage flexibility atnational level. Caballero et al.35 (2015) show that, in aglobal safety trap, the countries with the most flexible pricesand wages are relatively less affected by capacity under-utili-sation than countries with greater rigidities, for their econo-mies adjust more easily and–most important–increase theirrelative competitiveness. However, at world level, excessiveprice and wage flexibility raises the global real interest rate(by reducing inflation even as the nominal rate is at thefloor), resulting in greater global capacity under-utilisation.
Without taking a position on the existence of secular stagna-tion, G20 political leaders agree on the need for global,collective action to support world growth in the long term.The Communiqué from the Finance Ministers and CentralBank Governors at the G20 summit in Shanghai (February2016) accordingly advocates a global, coordinatedresponse: "Over the last several years, the G20 has madeimportant achievements to strengthen growth, invest-ment and financial stability. We are taking actions tofoster confidence and preserve and strengthen the reco-very. We will use all policy tools–monetary, fiscal andstructural–individually and collectively to achieve thesegoals."36 It also states that the G20 countries are ready toramp up their response if the macroeconomic outlookworsens: "To enhance our readiness to respond to poten-tial risks, we will continue to explore policy options thatthe G20 countries may undertake as necessary to supportgrowth and stability." These commitments have since beenreiterated in the G20 communiqués at the Washington (April2016) and Chengdu (July 2016) Meetings.
Anne JAUBERTIE, Linah SHIMI
(32) Eggertsson, G. B., Mehrotra, N. R., Singh, S. and Summers, L. (2015), "A Contagious Malady? Open Economy Dimensionsof Secular Stagnation", Brown University.
(33) Caballero, Farhi and Gourinchas (2015), op. cit. (note 20).(34) Coeuré, B., 21 November 2015: "It is high time that the growth narrative is shifted from a narrow view of 'competitiveness' towards a broader
understanding of 'productivity', both within and across countries." (35) Caballero, Farhi and Gourinchas (2015), op. cit. (note 20).(36) Communiqué from G20 Finance Ministers and Central Bank Governors, Shanghai, 27 February 2016.

TRÉSOR-ECONOMICS No. 182 – October 2016 – p. 11
Counterpoint by... Xavier Ragot
This text admirably describes the current stagnation as a short-term demand problem that monetary policy cannotresolve and/or as a long-term supply problem. It seems to me that two factors can allow us to be more specific. Theproblem facing monetary policy, which is unique in the postwar era, is not the weak real interest rate but the perma-nently weak inflation rate. The weakness of inflation leads us to nuance the role of supply factors in the short andmedium term. A productivity slowdown generates unobserved inflationary effects. Furthermore, as the authorsremind us, the U.S. has returned to a still perilous growth path, admittedly at a moderate pace, while stagnationmainly affects Europe and China.This brings me to the missing element in the secular stagnation debate: the set of medium-term imbalances. Theworld is experiencing powerful deflationary forces produced by China and the euro area. China has managed theconsequences of the 2008 crisis by implementing investment recovery plans. This has resulted in manifest capacitygluts in tradable goods sectors such as steel and cement, but also in non-tradable goods such as real estate, whichgenerates bad loans in China. Capital overaccumulation creates deflationary pressures in China.Next, the disastrous management of European divergences since 2007 has led to recommendations for wage cuts inmany euro area countries. This downward pressure on wages (rather than the significant wage increases in high-sur-plus countries such as Germany) leads to wage stagnation, which is perhaps the true cause of weak inflation andhence secular stagnation in Europe. In far more direct terms, the German trade surplus-the largest as a percentage ofGDP among the developed countries-is the result of low German wages and reveals an imbalance in Europeandemand rather than a more general problem.A final remark on the medium term: for reasons connected to the exchange-rate regime, it is often argued that themacroeconomic adjustment between supply and demand must be achieved through monetary policy and therefore,in the event, by a policy of low interest rates. The use of fiscal policy is too often excluded from the debates because ofthe high level of public debt in many countries. However, in a context of low interest rates (liquidity trap), we knowthat fiscal policy is a far more powerful tool than monetary policy for reviving economic activity. These considerationspoint to an inescapable conclusion: secular stagnation is also another way to describe our difficulty in managing anasymmetrical demand deficit in a world of high public debt, which is the product of the financial crisis.
Xavier RagotPrésident , Observatoire Français des Conjonctures Économiques (OFCE)
(French Economic Observatory)

TRÉSOR-ECONOMICS No. 182 – October 2016 – p. 12
Publisher:
Ministère de l’Économieet des Finances
Direction Générale du Trésor 139, rue de Bercy75575 Paris CEDEX 12
Publication manager:
Michel Houdebine
Editor in chief:
Jean-Philippe Vincent+33 (0)1 44 87 18 [email protected]
English translation:
Centre de traduction des ministères économiqueet financier
Layout:
Maryse Dos Santos
ISSN 1962-400XeISSN 2417-9698
Rece
nt Is
sues
in E
nglis
h
September 2016
No. 181. The world economy in summer 2016: moderate but gradually accelerating growthJean-Baptiste Bernard, Laetitia François, Thomas Gillet, Julien Lecumberry, Ysaline Padieu,Alexandre Tavin
No. 180. Fighting corruption: positive impacts on economic activity, including in developed countriesJean-Baptiste Chauvel, Laura Le Saux
No. 179. The economic consequences of obesity and how to limit themDaniel Caby
August 2016
No. 178. The October 2015 agreement on France's complementary pension schemes forprivate-sector employees (AGIRC and ARRCO) will improve the pension system balance by 0.3 points of GDP from 2020 to 2060Julia Cuvilliez, Thomas Laurent
No. 177. How effective are hiring subsidies for boosting employment?Jonas Anne-Braun, Sophie Ozil
http://www.tresor.economie.gouv.fr/tresor-economics
This study was prepared under the authority of the Directorate General of the Treasury (DG Trésor) and does not necessarily reflectthe position of the Ministry of Economy and Finance.