The Daft.ie House Price Report analysis of recent trends in the Irish residential sales market for...
13
An analysis of recent trends in the Irish residential sales market for 2017 Q2 The Daft.ie House Price Report Introduction by Ronan Lyons, Assistant Professor of Economics at Trinity College Dublin and author of the Daft Report.
Transcript of The Daft.ie House Price Report analysis of recent trends in the Irish residential sales market for...

An analysis of recent trends in the Irish residential sales market for 2017 Q2
The Daft.ie HousePrice Report
Introduction by Ronan Lyons, Assistant Professor of Economics
at Trinity College Dublin and author of the Daft Report.
Sales market shows rule changes had expected effect.
The figures from this latest Daft.ie House Price Report show a sharp increase in prices around the country, for the second quarter in a row.
The national average list price in June was 8.8%
higher than in December. To put that in perspective,
prices rose by 8% in the whole of 2016 – and by
8.5% in 2015. If the first half of 2017 is anything to
go by, price increases are likely to match or exceed
those in 2014, when they rose by 14%.
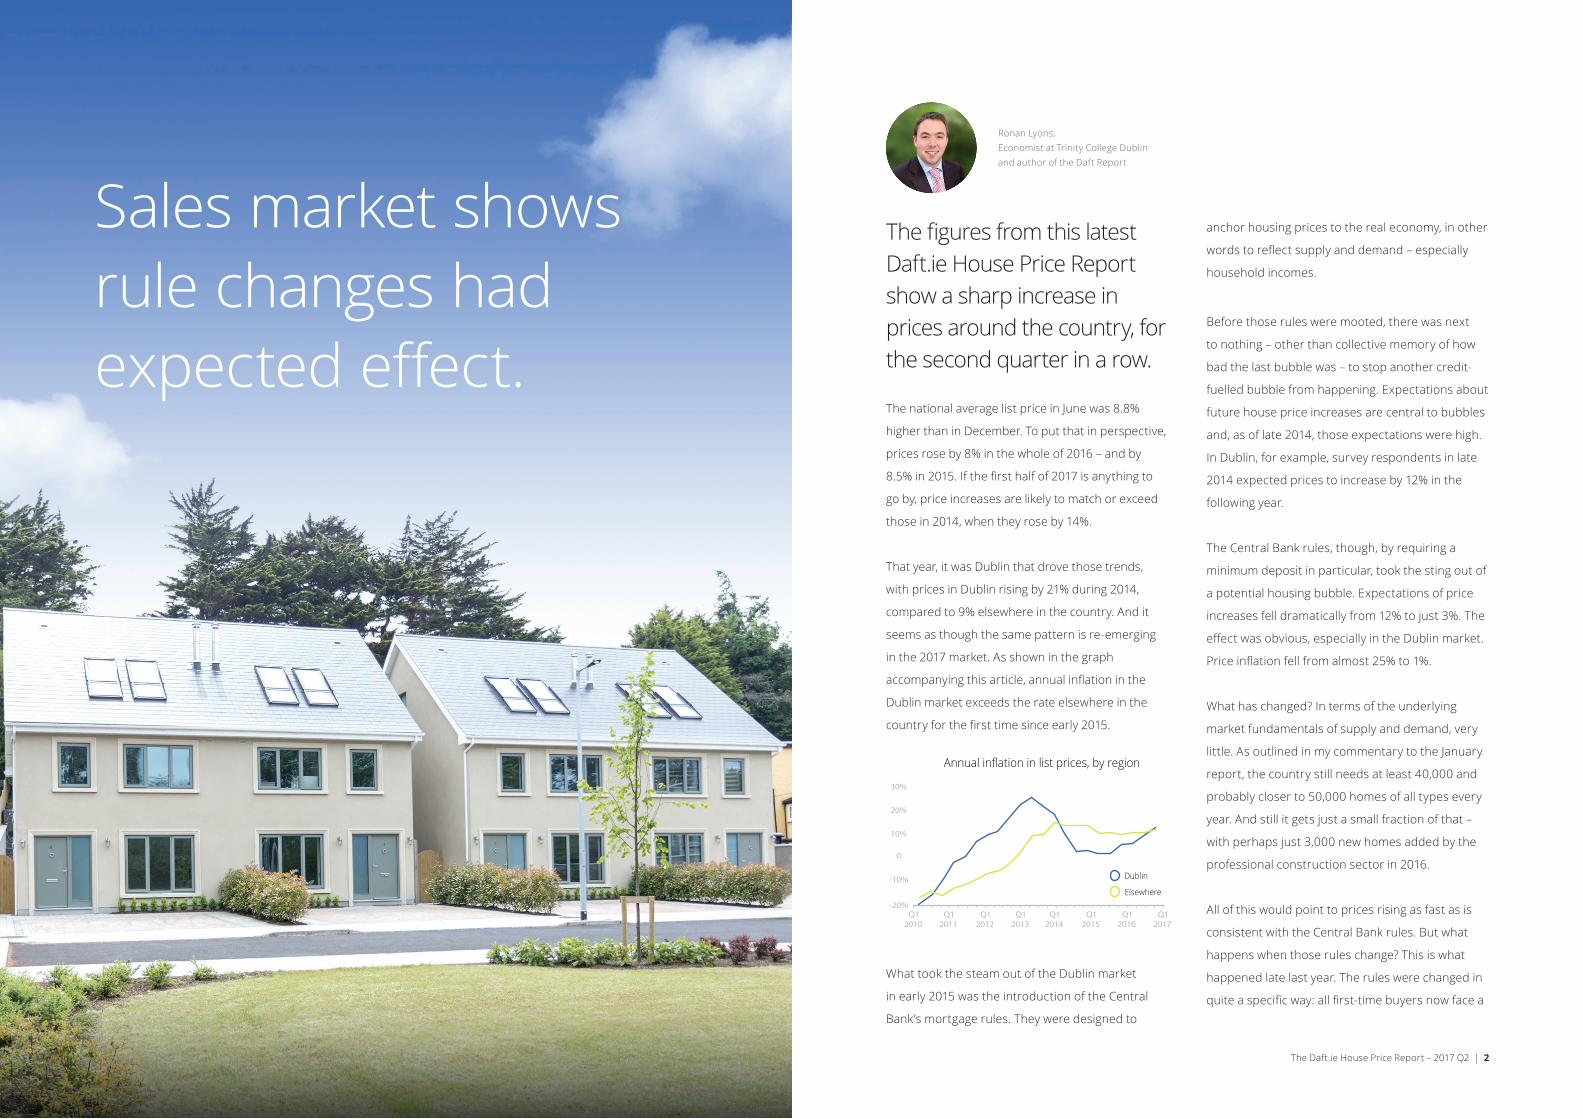
That year, it was Dublin that drove those trends,
with prices in Dublin rising by 21% during 2014,
compared to 9% elsewhere in the country. And it
seems as though the same pattern is re-emerging
in the 2017 market. As shown in the graph
accompanying this article, annual inflation in the
Dublin market exceeds the rate elsewhere in the
country for the first time since early 2015.
-20%
-10%
0
10%
20%
30%
Elsewhere
Dublin
Q12015
Q12012
Q12010
Q12017
Q12016
Annual inflation in list prices, by region
Q12014
Q12011
Q12013
What took the steam out of the Dublin market
in early 2015 was the introduction of the Central
Bank’s mortgage rules. They were designed to
anchor housing prices to the real economy, in other
words to reflect supply and demand – especially
household incomes.
Before those rules were mooted, there was next
to nothing – other than collective memory of how
bad the last bubble was – to stop another credit-
fuelled bubble from happening. Expectations about
future house price increases are central to bubbles
and, as of late 2014, those expectations were high.
In Dublin, for example, survey respondents in late
2014 expected prices to increase by 12% in the
following year.
The Central Bank rules, though, by requiring a
minimum deposit in particular, took the sting out of
a potential housing bubble. Expectations of price
increases fell dramatically from 12% to just 3%. The
effect was obvious, especially in the Dublin market.
Price inflation fell from almost 25% to 1%.
What has changed? In terms of the underlying
market fundamentals of supply and demand, very
little. As outlined in my commentary to the January
report, the country still needs at least 40,000 and
probably closer to 50,000 homes of all types every
year. And still it gets just a small fraction of that –
with perhaps just 3,000 new homes added by the
professional construction sector in 2016.
All of this would point to prices rising as fast as is
consistent with the Central Bank rules. But what
happens when those rules change? This is what
happened late last year. The rules were changed in
quite a specific way: all first-time buyers now face a
Ronan Lyons, Economist at Trinity College Dublin and author of the Daft Report
The Daft.ie House Price Report – 2017 Q2 | 2

Market SurveyEach quarter, Daft.ie surveys over 1,000 property market participants, asking them about their sense of the market as a whole, and their own intentions. Below are some of the headline results.
Expected house price inflation over next five years reaches new high
The expected change in house prices over the coming 5 years currently stands at 13.6%, its highest on record since 2011. In Dublin, expected inflation over five years has risen from 8.4% in early 2016 to 19.1% in mid-2017.
Expected price change this year
Expected price-income ratio reaches new high in Dublin
Nationwide, the average expected price-income ratio is stable 4.4 - and outside Dublin is stable at 4.2. In the capital, however, the ratio has reached 4.8, the join highest on record (with 2015Q4).
Planned house price-to-income ratio
Perceptions of value at record low
Fewer than 10% of respondents believe property prices in Dublin represent good value currently, down from 43% in late 2012. Elsewhere in the country, the fraction believing prices represent good value has fallen from 49% to 26% since late 2015.
Perceptions of value
National Dublin Ex-Dublin National Dublin Ex-Dublin
0%
10%
20%
30%
40%
50%
60%
70%
80%
Q22017
Q12017
Q42016
Q32016
Q22016
Q12016
Q42015
Q42014
Q42013
Q42012
Q42011
Q22017
Q12017
Q42016
Q32016
Q22016
Q12016
Q42015
Q42014
-15%
-5%
0%
5%
10%
15%
-10%
Q42013
Q42012
Q42011
20%
-20%
National Dublin Ex-Dublin
1.5
2.0
2.5
3.0
3.5
4.0
4.5
5.0
Q22017
Q12017
Q42016
Q32016
Q22016
Q12016
Q12015
Q12014
Q12013
Q12012
1.0
The Daft.ie House Price Report – 2017 Q2 | 4
10% deposit, rather than the 20% faced by the rest
of the market on anything over €220,000.
This means that first-time buyers buying expensive
homes have seen the biggest reduction in the
deposit required. To give an example, someone
buying a property in Dublin worth €250,000
has seen the required deposit fall by just over
10% (from €28,000 to €25,000). But someone
buying a property worth €660,000 has seen their
deposit requirement fall by 40% (from €110,000 to
€66,000).
Therefore, we would expect the change in the
Central Bank rules to have the largest effect on the
most expensive markets in the country. And, by
and large, this is what we have seen in the last six
months. Prices in Connacht and Ulster have risen
by 6% in the last six months. But prices in Dublin
have risen by 10% in just six months. In Dublin 2
and Dublin 8, two of the country’s most expensive
markets, prices are up by 16% since the start of the
year.
Some might argue that what we are seeing is the
effect not of the change in Central Bank rules, but
rather the almost contemporaneous Help-to-Buy
scheme brought in by the Government in the
last Budget. There have simply not been enough
new homes sold in the first half of 2016 for this to
explain such market-wide trends, however.
There have been about 1,200 sales of new homes
in Dublin in the first half of 2017, compared to
about 1,500 in the second half of 2016. This
represents about one fifth of the overall market in
the capital – which is probably too small a tail to
wag the dog that is the second-hand market. (In a
more health market, the new-home segment would
constitute close to half of all sales.)
More importantly, though, the Help-to-Buy scheme
would have had opposite effect across cheaper and
dearer markets. Its caps were such that its impact
would be greatest in the cheaper segments of the
market. Those buying new homes above €400,000
have a smaller percentage rebate, while those
buying above €600,000 have none at all.
Thus, we are left with the conclusion the changes
in the Central Bank rules had precisely the effect
predicted of them. There is some solace in that:
the Central Bank rules are perhaps the single most
important brake on housing prices. When those
rules are relaxed, prices rise, as supply is simply
not sufficient to meet demand. But if they are
maintained in their current form, the current spike
in house price inflation will prove to be just that.
The primary focus of policy efforts in the housing
market over the last 18 months has been to further
stimulate demand and prices. As I have written on
a number of occasions in the last year, what we
need is a focus on supply and quantities. When
obsolescence, falling household size, natural
increase and net migration are factored in, the
country needs 50,000 homes a year. It is not getting
that, and supply has not been meeting demand
since 2011, meaning we have also a backlog to
meet.
The principal reason why so few homes are being
built is the high cost of construction. Hopefully the
new Housing Minister will focus on reducing the
hard costs of construction. This will have beneficial
effects for both market and social housing.
Combined with a strategy for using vacant homes,
using land better and reform of housing subsidies,
it is entirely possible for this country to have a
healthy housing system.
3 | The Daft.ie House Price Report – 2017 Q2

Cork City€256,201 | 9.2%
Limerick City€177,199 | 15.1%
Galway City€268,535 | 13.4%
Waterford City€158,861 | 14.5%
NationwideAverage asking prices and Y-on-Y change
DublinAverage asking prices and Y-on-Y change
North County€302,457 | 12.7%
South County€563,442 | 8.8%
West County€297,070 | 7.0%
South City€387,266 | 11.7%
City Centre€299,635 | 18.2%
North City€323,550 | 13.0%
MN€160,55910.5%
CN€149,1328.3%
WH€184,02415.7%
LD€128,81623.5%
LH€210,08816.9%
MH€249,90312.5%
KE€253,68512.1%
WW€314,84011.2%
WX€197,53915.2%
CW€176,51018.0%
KK€210,17612.0%
LS€164,30711.8%
OY€170,56613.2%
G€182,3108.5%
MO€145,6187.0%
SO€133,88713.8%
DL€145,2175.0%
RN€129,6686.7%
LM€123,8844.5%
CE€165,4989.5%
T€162,9569.1%
L€170,8665.4%
C€206,68611.4%
KY€179,6836.4%
W€204,72911.9%
Prices up 46% from their lowest pointNationally, the average asking price reached its lowest point in
the third quarter of 2013 and has risen 46.2% - or just under
€76,000 - since then. In Dublin, however, the bottom was
reached in the second quarter of 2012 and prices have risen
by an average of 60% - or €132,500 - since that time. The last
part of the country to see prices level off was Limerick - in
both Limerick city and county, prices only reached their lowest
point in the final quarter of 2014 but prices have risen by 49%
in the city (and by 30% in the county) since then.
The Daft.ie House Price Report – 2017 Q2 | 65 | The Daft.ie House Price Report – 2017 Q2

4.3%Quarter-on-quarter change in average list price
Daft.ie List Price Index
2006 2007 2008 2009 2010 2011 2012 2013 2014 2015 2016 2017
January 185.3 213.8 212.9 184.5 151.6 128.2 105.6 96.8 99.9 112.8 122.1 134.1
February 200.2 215.8 212.3 180.9 150.3 128.1 104.5 96.1 99.3 117.6 122.9 135.6
March 198.1 214.8 209.6 177.4 146.7 125.3 102.9 96.6 103.3 119.1 125.7 135.8
April 203.2 216.5 208.1 174.7 146.6 121.8 101.7 96.6 104.5 118.7 125.0 140.9
May 205.3 217.5 205.7 171.0 145.0 120.1 102.2 97.0 107.2 119.4 126.0 141.9
June 207.1 217.1 203.4 167.7 141.8 116.1 99.5 97.5 107.9 118.2 127.8 140.9
July 209.3 219.2 202.3 165.1 138.0 115.4 97.8 96.5 109.9 120.3 128.9
August 210.4 217.5 199.6 161.2 137.6 113.1 98.9 97.0 111.2 120.4 130.1
September 213.8 215.8 198.1 159.2 136.5 113.3 97.1 96.7 112.9 121.5 130.9
October 214.7 214.8 193.7 156.4 134.0 108.7 97.9 97.2 110.5 120.6 128.7
November 212.8 212.4 188.2 152.3 130.9 106.0 95.8 96.9 110.0 119.5 129.0
December 214.9 213.5 186.3 150.9 129.8 106.0 96.0 96.2 111.1 119.8 131.0
Asking Prices, Residential Sales(2012 average = 100)
7 | The Daft.ie House Price Report – 2017 Q2
Strong rises in prices continueThe rise of 4.3% in the average list price seen in the second quarter of 2017 matches the rise in the first quarter, which was the largest since early 2015.
Inflation in Dublin now exceeds rate elsewhere
For the first time in over two years, the annual rate of inflation in Dublin (12.3%) exceeds the rate elsewhere in the country (11.3%).
Largest number of new listings since mid-2008
May 2017 saw over 6,000 properties listed for sale nationwide, the largest monthly total in almost 9 years.
Two in five properties sell within two months
40% of properties listed currently find a buyer within four months, up from 35% a year ago.
Stock of properties on Daft.ie (start of month) and flow of properties, 2007-2017
Stock (lhs) Inflow (rhs) Outflow (rhs)
0
2000
4000
6000
8000
10000
12000
14000
2009 2010 2011 2012 2013 2014 2015 2016 2008 2007
0
10000
20000
30000
40000
50000
60000
70000
2017
The Daft.ie House Price Report – 2017 Q2 | 8
The Daft.ie Asking Price Index is based on asking prices for properties posted for sale on Daft.ie. An index based on asking price, as opposed to closing price, is a measure of sellers’ expectations. Figures are calculated from econometric regressions, which calculate changes in price that are independent of changes in observable measures of quality, such as location, or bedroom number.

Daft.ie Snapshot ofAsking Prices Nationwide Average asking prices across Ireland (€000s), and annual change (%), 2017 Q2
The Daft.ie House Price Report – 2017 Q2 | 109 | The Daft.ie House Price Report – 2017 Q2
LEIN
STER
MU
NST
ERCO
NN
ACH
TU
LSTE
R
OTH
ER C
ITIE
S
1 bed apartment 2 bed terraced 3 bed semi-d 4 bed bungalow 5 bed detached
Dublin 1 €204 17.6% €306 19.3% €415 17.2% €579 11.4% €770 16.5%
Dublin 2 €275 19.0% €382 20.4% €526 14.8% €748 10.5% €871 12.8%
Dublin 3 €222 4.5% €332 13.5% €453 12.0% €668 3.0% €876 11.2%
Dublin 4 €320 14.4% €435 7.7% €648 8.7% €1,036 5.4% €1,299 7.7%
Dublin 5 €177 9.6% €254 17.3% €360 12.5% €565 9.6% €724 20.9%
Dublin 6 €293 10.6% €420 17.9% €595 13.1% €935 10.2% €1,197 21.6%
Dublin 6W €239 7.4% €342 14.9% €485 10.2% €762 7.4% €976 18.5%
Dublin 7 €186 13.0% €267 20.9% €378 15.9% €594 13.0% €761 24.6%
Dublin 8 €194 14.7% €278 22.7% €394 17.7% €618 14.7% €792 26.6%
Dublin 9 €181 7.2% €259 14.6% €367 10.0% €576 7.2% €738 18.2%
Dublin 10 €116 10.5% €166 18.3% €235 13.4% €369 10.5% €472 22.0%
Dublin 11 €141 11.9% €202 19.7% €286 14.8% €450 11.9% €576 23.5%
Dublin 12 €159 11.2% €228 19.0% €324 14.2% €509 11.2% €651 22.8%
Dublin 13 €182 6.2% €261 13.7% €370 9.0% €582 6.2% €745 17.2%
Dublin 14 €230 7.6% €329 15.1% €466 10.4% €733 7.6% €938 18.7%
Dublin 15 €144 10.6% €206 18.3% €292 13.5% €459 10.6% €588 22.1%
Dublin 16 €200 8.1% €287 15.6% €406 10.9% €638 8.1% €818 19.3%
Dublin 17 €122 6.5% €175 14.0% €248 9.3% €390 6.5% €499 17.6%
Dublin 18 €221 5.2% €317 12.6% €450 8.0% €707 5.2% €905 16.1%
Dublin 20 €166 9.6% €238 17.3% €338 12.5% €530 9.6% €679 21.0%
Dublin 22 €117 8.1% €168 15.6% €238 10.9% €374 8.1% €478 19.3%
Dublin 24 €125 7.5% €179 15.0% €254 10.3% €399 7.5% €510 18.6%
North Co Dublin €144 8.6% €207 16.2% €293 11.5% €460 8.6% €589 19.9%
South Co Dublin €259 4.7% €372 12.0% €527 7.4% €827 4.7% €1,060 15.5%
West Dublin €139 6.0% €200 13.4% €283 8.7% €444 6.0% €569 16.9%
Cork City €101 7.3% €145 16.0% €221 7.4% €383 7.2% €463 8.6%
Galway City €98 11.5% €141 20.5% €215 11.6% €372 11.4% €449 12.8%
Limerick City €73 12.5% €104 21.6% €159 12.6% €276 12.4% €333 13.8%
Waterford City €62 12.5% €89 21.6% €136 12.6% €237 12.4% €286 13.8%
1 bed apartment 2 bed terraced 3 bed semi-d 4 bed bungalow 5 bed detached
Meath €90 10.6% €128 20.1% €179 14.8% €346 14.9% €390 19.9%
Kildare €97 10.4% €137 19.8% €192 14.6% €372 14.7% €419 19.7%
Wicklow €119 9.5% €167 18.8% €235 13.7% €453 13.7% €511 18.7%
Louth €82 14.9% €116 24.8% €162 19.3% €313 19.4% €353 24.6%
Longford €44 21.9% €61 32.4% €86 26.6% €167 26.7% €188 32.2%
Offaly €61 11.6% €86 21.2% €121 15.9% €233 16.0% €263 21.0%
Westmeath €67 13.9% €94 23.6% €132 18.3% €255 18.3% €287 23.5%
Laois €61 10.2% €86 19.6% €121 14.4% €233 14.5% €263 19.5%
Carlow €63 16.5% €89 26.5% €125 21.0% €242 21.1% €273 26.3%
Kilkenny €73 10.3% €104 19.7% €145 14.5% €281 14.6% €317 19.6%
Wexford €66 13.5% €93 23.3% €131 17.9% €253 18.0% €286 23.1%
Waterford Co €74 16.6% €94 16.6% €138 14.4% €261 11.7% €295 14.0%
Kerry €63 11.4% €81 11.3% €119 9.2% €225 6.6% €254 8.9%
Cork Co €76 16.3% €97 16.2% €142 14.0% €268 11.3% €304 13.6%
Clare €61 13.6% €78 13.6% €115 11.4% €216 8.8% €244 11.0%
Limerick Co €59 17.2% €75 17.2% €110 15.0% €208 12.3% €235 14.6%
Tipperary €59 13.9% €76 13.8% €111 11.7% €209 9.0% €237 11.3%
Galway Co €55 5.8% €75 19.8% €109 17.4% €204 7.0% €245 15.6%
Mayo €50 4.1% €68 17.9% €99 15.5% €184 5.3% €221 13.7%
Roscommon €41 4.8% €56 18.6% €81 16.2% €152 5.9% €182 14.4%
Sligo €49 9.6% €67 24.1% €97 21.5% €182 10.8% €218 19.7%
Leitrim €42 1.9% €57 15.3% €83 13.0% €155 3.0% €185 11.2%
Donegal €47 1.9% €64 15.3% €93 13.0% €174 3.0% €208 11.2%
Cavan €47 4.8% €64 18.6% €93 16.2% €175 5.9% €209 14.4%
Monaghan €54 6.0% €73 20.0% €106 17.6% €199 7.2% €238 15.8%
DU
BLIN

DublinStrong price gains continue into second quarter
One year ago Previous quarter Current quarter
Proportion of properties marked as sale agreed and withdrawn, 2012-2017.
0% 10% 20% 30% 40% 50% 60% 70% 80% 90%
Within 6 months
Within 4 months
Within 2 months
How fast are properties in Dublin selling?
11 | The Daft.ie House Price Report – 2017 Q2
North CityAverage price: €323,550Qtr-on-qtr change: 4.4%Year-on-year change: 13.0%Change from trough: 64.1%
City CentreAverage price: €299,635Qtr-on-qtr change: 6.1%Year-on-year change: 18.2%Change from trough: 78.7%
South CityAverage price: €387,266Qtr-on-qtr change: 3.6%Year-on-year change: 11.7%Change from trough: 59.2%
North CountyAverage price: €302,457Qtr-on-qtr change: 3.3%
Year-on-year change: 12.7%Change from trough: 48.4%
West CountyAverage price: €297,070Qtr-on-qtr change: 3.2%
Year-on-year change: 9.7%Change from trough: 59.9%
South CountyAverage price: €563,442Qtr-on-qtr change: 2.8%
Year-on-year change: 8.8%Change from trough: 62.8%
Dublin City Centre North Dublin City South Dublin City North County Dublin South County Dublin West County Dublin
€650,000
€600,000
€550,000
€500,000
€450,000
€400,000
€350,000
€300,000
€250,000
€200,000
€150,000
Average rental price by area, 2006-2017.
€700,000
Q12006
Q12007
Q12008
Q12009
Q12010
Q12011
Q12012
Q12013
Q12014
Q12015
Q12016
Q22017
€750,000
How have house prices changed?
The Daft.ie House Price Report – 2017 Q2 | 12
Half sell within 2 months50% percent of Dublin properties find a buyer within
two months - up from 41% a year ago.
Transaction volumes reach new highThere were 3,550 transactions in Dublin between
January and March, the highest first-quarter total since
the start of the Price Register in 2010.
Stock on market down year-on-yearThere were 3,250 properties for sale in Dublin in June,
higher than three months previously (2,700) but lower
than a year ago (3,800).
Double-digit rises in most of cityTwenty of Dublin’s 25 markets saw prices increase by
at least 10% in the year to June - the highest number
since early 2015.

LeinsterSharp increase in prices in second quarter
One year ago Previous quarter Current quarter
Proportion of properties marked as sale agreed and withdrawn, 2012-2017.
0% 10% 20% 30% 40% 50% 60% 70% 80% 90%
Within 6 months
Within 4 months
Within 2 months
How fast are properties in Leinster selling?
13 | The Daft.ie House Price Report – 2017 Q2
LouthAverage price: €210,088Qtr-on-qtr change: 7.1%Year-on-year change: 16.9%Change from trough: 64.7%
MeathAverage price: €249,903Qtr-on-qtr change: 5.0%Year-on-year change: 12.5%Change from trough: 66.4%
KildareAverage price: €253,685Qtr-on-qtr change: 5.3%Year-on-year change: 12.1%Change from trough: 61.7%
WicklowAverage price: €314,840Qtr-on-qtr change: 6.6%Year-on-year change: 11.2%Change from trough: 54.9%
WexfordAverage price: €197,539Qtr-on-qtr change: 5.7%Year-on-year change: 15.2%Change from trough: 58.1%
LongfordAverage price: €128,816
Qtr-on-qtr change: 10.2%Year-on-year change: 23.5%Change from trough: 52.9%
WestmeathAverage price: €184,024Qtr-on-qtr change: 6.1%
Year-on-year change: 15.7%Change from trough: 55.8%
OffalyAverage price: €170,566Qtr-on-qtr change: 5.2%
Year-on-year change: 13.2%Change from trough: 41.2%
LaoisAverage price: €164,307Qtr-on-qtr change: 4.4%
Year-on-year change: 11.8%Change from trough: 58.4%
KilkennyAverage price: €210,176Qtr-on-qtr change: 4.3%
Year-on-year change: 12.0%Change from trough: 58.8%
CarlowAverage price: €176,510Qtr-on-qtr change: 7.1%
Year-on-year change: 18.0%From trough: 50.8%
Dublin Commuter Counties West Leinster South-East Leinster
€400,000
€350,000
€300,000
€250,000
€200,000
€150,000
€100,000
€50,000
Average house price by area, 2006-2017.
Q12006
Q12007
Q12008
Q12009
Q12010
Q12011
Q12012
Q12013
Q12014
Q12015
Q12016
Q22017
How have house prices changed?
The Daft.ie House Price Report – 2017 Q2 | 14
Two thirds sell within 4 months64% percent of Leinster properties find a buyer
within four months - up from 58% a year ago.
Transaction volumes reach new highThere were 2,800 transactions in Leinster (excluding
Dublin) between January and March, the highest
first-quarter total since the start of the Price Register
in 2010.
Double-digit rises across the provinceSharp increases in prices between March and June
across Leinster mean that prices are between 11%
(Wicklow) and 24% (Longford) higher than a year ago.
Stock on market down year-on-yearThere were almost 5,500 properties for sale in
Leinster in June, higher than three months previously
(5,000) but lower than a year ago (5,900).

MunsterMunster prices, outside cities, rise sharply in second quarter
One year ago Previous quarter Current quarter
Proportion of properties marked as sale agreed and withdrawn, 2012-2017.
0% 10% 20% 30% 40% 50% 60% 70% 80% 90%
Within 6 months
Within 4 months
Within 2 months
How fast are properties in Munster selling?
15 | The Daft.ie House Price Report – 2017 Q2
TipperaryAverage prices: €162,956Qtr-on-qtr change: 5.6%Year-on-year change: 9.1%Change from trough: 28.1%
Limerick CityAverage prices: €177,199Qtr-on-qtr change: 1.7%Year-on-year change: 15.1%Change from trough: 49.2%
Waterford CountyAverage prices: €204,729Qtr-on-qtr change: 5.7%Year-on-year change: 11.9%Change from trough: 42.4%
Waterford CityAverage prices: €158,861Qtr-on-qtr change: 3.5%Year-on-year change: 14.5%Change from trough: 51.6%
ClareAverage prices: €165,498Qtr-on-qtr change: 4.8%
Year-on-year change: 9.5%Change from trough: 38.4%
Limerick CountyAverage prices: €170,866Qtr-on-qtr change: 7.0%
Year-on-year change: 12.0%Change from trough: 29.9%
KerryAverage prices: €179,683Qtr-on-qtr change: 5.3%
Year-on-year change: 6.4%Change from trough: 27.9%
Cork CountyAverage prices: €206,686Qtr-on-qtr change: 5.4%
Year-on-year change: 11.4%Change from trough: 44.3%
Cork CityAverage prices: €256,201Qtr-on-qtr change: -0.3%
Year-on-year change: 9.2%Change from trough: 56.0%
Dublin Commuter Counties West Leinster South-East Leinster
€400,000
€350,000
€300,000
€250,000
€200,000
€150,000
€100,000
€50,000
Average house price by area, 2006-2017.
Q12006
Q12007
Q12008
Q12009
Q12010
Q12011
Q12012
Q12013
Q12014
Q12015
Q12016
Q22017
How have house prices changed?
The Daft.ie House Price Report – 2017 Q2 | 16
Over half sell in 4 monthsOver half (54%) of all properties in Munster find a
buyer within four months, up slightly from a year ago
(50%).
Transaction volumes steadyThere were 2,600 transactions in Munster in the first
quarter of 2017, similar to the total for the same three
months in both 2015 and 2016.
Urban-rural trend reversesUnlike in previous quarters, where Munster’s three
cities saw the strongest quarterly prices increases,
between March and June, it was the rural parts of the
province that saw the biggest increases.
Limited supply persistsThere were 7,650 properties on the market in
Munster in June, up roughly 500 from three months
previously - but a thousand fewer than a year
previously.

Connacht/UlsterPrice increases cool in the region
One year ago Previous quarter Current quarter
Proportion of properties marked as sale agreed and withdrawn, 2012-2017.
0% 10% 20% 30% 40% 50% 60% 70% 80% 90%
Within 6 months
Within 4 months
Within 2 months
How fast are properties in Connacht/Ulster selling?
17 | The Daft.ie House Price Report – 2017 Q2
LeitrimAverage price: €123,884Qtr-on-qtr change: 2.3%Year-on-year change: 4.5%Change from trough: 44.2%
MonaghanAverage price: €160,559Qtr-on-qtr change: 3.5%Year-on-year change: 10.5%Change from trough: 40.7%
CavanAverage price: €149,132Qtr-on-qtr change: 4.6%Year-on-year change: 8.3%Change from trough: 45.2%
RoscommonAverage price: €129,668Qtr-on-qtr change: 1.2%Year-on-year change: 6.7%Change from trough: 41.5%
DonegalAverage price: €145,217Qtr-on-qtr change: 2.0%
Year-on-year change: 5.0%Change from trough: 27.8%
SligoAverage price: €133,887Qtr-on-qtr change: 5.8%
Year-on-year change: 13.8%Change from trough: 27.4%
MayoAverage price: €145,618Qtr-on-qtr change: 3.3%
Year-on-year change: 7.0%Change from trough: 30.9%
Galway CityAverage price: €268,535Qtr-on-qtr change: 1.2%
Year-on-year change: 13.4%Change from trough: 67.2%
Galway CountyAverage price: €182,310Qtr-on-qtr change: 4.5%
Year-on-year change: 8.5%Change from trough: 44.1%
Average house price by area, 2006-2017.
How have house prices changed?
Galway City Connacht Ulster
€50,000
€100,000
€150,000
€200,000
€250,000
€300,000
€350,000
€400,000
Q12006
Q12007
Q12008
Q12009
Q12010
Q12011
Q12012
Q12013
Q12014
Q12015
Q12016
Q22017
The Daft.ie House Price Report – 2017 Q2 | 18
Fewer than half sell in 4 monthsJust under half (48%) of all properties in Connacht-
Ulster find a buyer within four months, down
somewhat from a year ago (54%).
Recovery in transaction volumesThere were almost 1,750 transactions in Connacht-
Ulster in the first quarter of 2017, up from 1,670 in
the same period in 2016 - but still below the figure
for 2015 (1,900).
Limited supply persistsThere were just over 6,000 properties on the market
in Connacht-Ulster in June, up from 5,700 three
months previously - but well below the level a year
ago (6,900).
Return to single digit increasesIn late 2016, Connacht-Ulster had the fastest house
price growth in the country (12%, compared to 5%
in Dublin) - it now has the slowest (8%, and 12% in
Dublin).

Over the last number of years, Daft.ie has collected a vast amount of data on the Irish property market. Each year tens of thousands of properties for sale or rent are advertised on the site.
About the ReportThe goal of the Daft Report is to use this information to help all actors in the property market make informed decisions about buying and selling. In addition, because it is freely available, the Daft Report can help inform the media, the general public and policymakers about the latest developments in the property market.
This is the Daft.ie House Price Report, the partner to the Daft.ie Rental Report, which will be issuednext month. Together, they give house-hunters and investors more information to help them make their decisions. These twin reports mean that Daft is the only objective monitor of trends in both rental and sales markets on a quarterly basis, making the report an essential barometer for anyone with an interest in the Irish property market.
The Daft Report was first launched in 2005. It has already become the definitive barometer of the Irish rental market and is being used by the Central Bank, mortgage institutions, financial analysts and the general public alike. The Daft.ie House Price report is Ireland’s longest-running house price report, combining information from the Daft.ie archives with data from Ireland’s Residential Property Price Register.
Methodology and Sample SizeThe statistics are based on properties advertised on Daft.ie for a given period. The regressions used are hedonic price regressions, accounting for all available and measurable attributes of properties, with a Cooks Distance filter for outliers.
The average monthly sample size for sale properties is 5,000. Indices are based on standard methods, holding the mix of characteristics constant.
About Daft.ieDaft.ie is Ireland’s largest propertywebsite with over 2.5 million unique visitors generating over 228 million page impressions each month.
DisclaimerThe Daft.ie Report is prepared from information that we believe is collated with care, but we do not make any statement as to its accuracy or completeness. We reserve the right to vary our methodology and to edit or discontinue the indices, snapshots or analysis at any time for regulatory or other reasons. Persons seeking to place reliance on any information contained in this report for their own or third party commercial purposes do so at their own risk.
CreditsEconomic Analysis: Ronan LyonsMarketing and Communications: Martin ClancyLayout and Design: William Tector & Dara Gannon
19 | The Daft.ie House Price Report – 2017 Q2
Steal the Spotlight!The ultimate way to promote the launch of new builds
Stand out from the crowdwith unrivalled placement on Daft.ie’s homepage
Stay top of mindProminent agent brandingis guaranteed
Maximise interestin your property, drive more enquiries and instructions
Why you should build your brand on Daft.ie
• 85% of the property audience in Ireland are on Daft.ie
• 40% of people visiting Daft.ie would like to buy a property in the next 12 months
• 32% of people visiting Daft.ie already own a property
Source: Comscore and Sentiment Survey H2 2016.
For more information contact your account manager on: 01 421 8700

At Daft.ie our audienceare your customers.
More people view properties on Daft.ie than on any other property platform in Ireland.
No matter where people are in their life journey, they are visiting Daft.ie
to make their property dream a reality.
*Source: Google Analytics Jan 2017, Log Files Jan 2017, Sentiment Survey H2 2016
An extensive audience An active audience A focused audience
2.5mpeople visit
Daft.ie every month
40%seeking to buy within
12 months - active buyers
1000+property searches carried
out every minute
50%are searching
properties for sale
32%already own a property
- potential sellers
~8minutes spent
per visit
33%are searching
properties to rent
55%of our audience are
aged 35 years+
76%are returning
to Daft.ie
Audience Snapshot

Coming next:
The Daft.ie Rental Report ,2017 Q2.
The Daft.ie Rental Report will be published in August and will include a review of the performanceof Ireland’s rental market, plus all the usual indices, snapshots,trends and rental yield analysis, providing analysts, tenants, landlords, studentsand the public with the most up-to-date information on Ireland’s rental market.
All data is Copyright © Daft Media Limited. The information contained in this report may onlybe reproduced if the source is clearly credited. Please contact Daft.ie on 01-4218700 for further information.