The Climate in Africa: 2013 - · PDF filein ‘The Climate in Africa: 2013’,...
32
The Climate in Africa: 2013 WMO-No. 1147
Transcript of The Climate in Africa: 2013 - · PDF filein ‘The Climate in Africa: 2013’,...

The Climate in Africa:2013
WMO-No. 1147
WMO-No. 1147
© World Meteorological Organization, 2015
The right of publication in print, electronic and any other form and in any language is reserved by WMO. Short extracts from WMO publications may be reproduced without authorization, provided that the complete source is clearly indicated. Editorial correspondence and requests to publish, reproduce or translate this publication in part or in whole should be addressed to:
Chairperson, Publications BoardWorld Meteorological Organization (WMO)7 bis, avenue de la Paix Tel.: +41 (0) 22 730 84 03P.O. Box 2300 Fax: +41 (0) 22 730 80 40CH-1211 Geneva 2, Switzerland E-mail: [email protected]
ISBN 978-92-63-11147-0
NOTE
The designations employed in WMO publications and the presentation of material in this publication do not imply the expression of any opinion whatsoever on the part of WMO concerning the legal status of any country, territory, city or area, or of its authorities, or concerning the delimitation of its frontiers or boundaries.
The mention of specific companies or products does not imply that they are endorsed or recommended by WMO in preference to others of a similar nature which are not mentioned or advertised.
The findings, interpretations and conclusions expressed in WMO publications with named authors are those of the authors alone and do not necessarily reflect those of WMO or its Members.
Cover illustration: xxx
ContentsForeword . . . . . . . . . . . . . . . . . . . . . . . . . . . . . . . . . . . . . . . . . 3
Climate assessment: key continental features . . . . . . . . . . . . . . . . . . . 4
Temperature 4
Precipitation 5
Climate assessment: subregional features. . . . . . . . . . . . . . . . . . . . . . 7
Southern Africa 7
Temperature 7
Precipitation 7
South-West Indian Ocean Island Countries 9
Temperature 9
Precipitation 9
Central Africa 10
Temperature 10
Precipitation 10
Eastern Africa 10
Temperature 11
Precipitation 11
Western Africa 11
Temperature 11
Precipitation 12
Northern Africa 13
Temperature 13
Precipitation 14
Extreme weather and climate events in 2013 . . . . . . . . . . . . . . . . . . . . 16
Floods and heavy precipitation 17
Tropical cyclones and wind storms 22
Droughts, heat waves and fires 24
Other extreme events 26

3
In Africa in 2013, the critical weather and cli-mate trends of the last decades continued: it was one of the warmest years on the continent since at least 1950, with temperatures above average in most regions Precipitation at the continental scale was near average But several extreme events hit the region The floods that hit Mozambique in January were among the 10 most severe in the world that year, based on the number of deaths In contrast, the rains in Namibia and neighboring countries fell well below normal, leading to a severe drought
These are some of the findings addressed in ‘The Climate in Africa: 2013’, WMO’s first peer-reviewed statement on regional climate conditions Modeled on the global statements issued by WMO every year since 1993, ‘The Climate in Africa’ was produced by an African Task Team composed of well-regarded scientists and experts representing every subregion of the continent The work was conducted in consulta-tion with the African Centre of Meteorological Applications for Development (ACMAD)
WMO issues its authoritative annual climate statements (along with a decadal statement for 2001–2010) to provide data and information that make it possible to place current climate conditions in a historical context Recognizing that Africa is particularly vulnerable to climate variability and climate change, WMO has issued this supplementary statement to provide greater detail about each of Africa’s subregions
This regional statement provides further evi-dence that weather and climate services are vital for protecting life and property in Africa The need to inform decisions about disaster risk, agriculture, water resources, public health and other climate-sensitive sectors is the driving force behind the WMO-led and Norway-funded Global Framework for Climate Services (GFCS) Adaptation Programme in Africa A partner-ship among national governments and seven international agencies and research institutes, the Programme is increasing the resilience of
people who are most vulnerable to the impacts of weather and climate The Programme is further supported by the Regional Climate Outlook Forums established through WMO for Southern Africa, Central Africa, West Africa, Northern Africa, and the Greater Horn of Africa
‘The Climate in Africa: 2013’ is based on data-sets and information contributed by WMO Members and partners That information has been assessed in regional and subregional contexts Comparisons were made with climato-logical averages and records whenever possible and appropriate The report’s temperature assessment is based on the combination of the Global Historical Climatology Network and the Climate Anomaly Monitoring System (GHCN CAMS) datasets by the US National Oceanic and Atmospheric Administration, providing a high resolution 0 5° latitude x 0 5° longitude analysis of global land air surface tempera-tures from 1948 to near present Precipitation assessments are based on the analysis done by the Global Precipitation Climatology Centre Other data sets have also been used for addi-tional analysis National Meteorological and Hydrological Services of the WMO Regional Association I (Africa) were the main providers of the underlying observations and climate information
We welcome your feedback on this report and insights into how you have made use of it in your work
(M Jarraud) Secretary-General
Foreword

4
TEMPERATURE
At the global scale, the assessment of the annual mean surface air temperature indi-cated that 2013 tied with 2007 as the sixth warmest year since global records began in 1850, with a global land and ocean surface air temperature 0 50°C above the 1961–1990 average (source: WMO Statement on Status of the Global Climate 2013) For land-only
surface air temperature, a global anomaly of 0 85°C was recorded
Because the data with respect to in-situ surface air temperature across Africa is sparse, a one-year regional assessment for Africa could not be based on any of the three standard global surface air temperature data sets from NOAA-NCDC, NASA-GISS or HadCRUT4 Instead, the combination of the Global Historical Climatology Network and the Climate Anomaly Monitoring System (CAMS GHCN) by NOAA’s Earth System Research Laboratory was used to estimate surface air temperature patterns This is a high resolution (0 5°x0 5°) data set of observed and interpolated global land surface temperatures and precipitation from 1948 to near present (Fan et al 2008)
Within the uncertainties and respecting the cautions listed for that data set (see also box: Data gaps in Africa), Figure 1 indicates a pattern of positive surface air temperature anoma-lies over substantial areas of Africa in 2013, with Angola and Namibia reporting the largest positive anomalies With the same caution, a tentative assessment of surface air tempera-ture over land in Africa indicates that 2013 ranks among the five warmest years Figure 2
Figure 1. Temperature anomaly over Africa in 2013 with respect to 1961–1990; gridded data based on station observations. (Source: CAMS GHCN by NOAA-ESRL)
Figure 2. Temperature anomaly over Africa from 1950 to 2013 with respect to 1961–1990; gridded data based on station observations. (Source: CAMS by NOAA-ESRL)
1.5
1
0.5
0
–0.51950 1960 1970 1980 1990 2000 2010
Tem
per
atu
re a
no
mal
y (°
C)
35N
30N
25N
20N
15N
10N
5N
EQ
5S
10S
15S
20S
25S
30S
35S20W 10W 0 10E 20E 30E 40E 50E 60E
Climate assessment: key continental features
5
shows a time series of the annual surface air temperature anomalies over land in Africa since 1950 This series exhibits similar long- term positive anomalies observed globally since the mid-1970’s, with an acceleration of warming since the 1990’s The years 1998, 2005 and 2010 were the warmest years in Africa (up to 2013), fitting well with the temperature ranking globally (WMO Annual Statement on the Status of Global Climate in 2013)
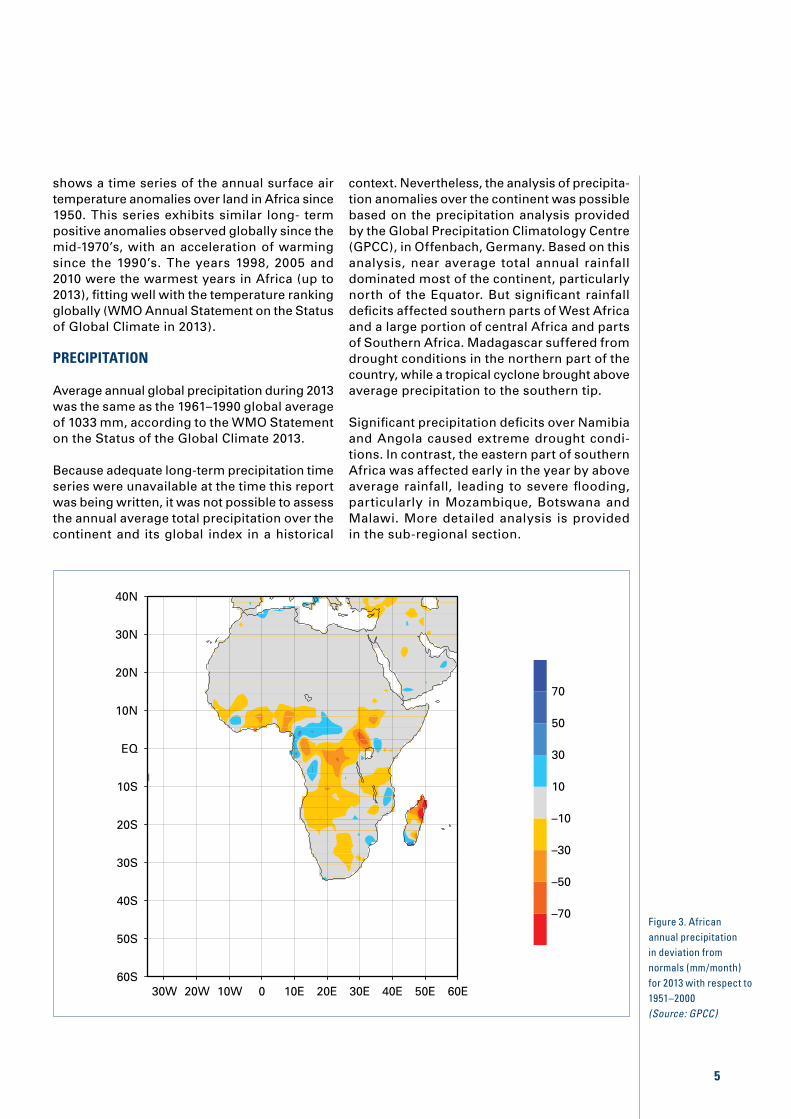
PRECIPITATION
Average annual global precipitation during 2013 was the same as the 1961–1990 global average of 1033 mm, according to the WMO Statement on the Status of the Global Climate 2013
Because adequate long-term precipitation time series were unavailable at the time this report was being written, it was not possible to assess the annual average total precipitation over the continent and its global index in a historical
context Nevertheless, the analysis of precipita-tion anomalies over the continent was possible based on the precipitation analysis provided by the Global Precipitation Climatology Centre (GPCC), in Offenbach, Germany Based on this analysis, near average total annual rainfall dominated most of the continent, particularly north of the Equator But significant rainfall deficits affected southern parts of West Africa and a large portion of central Africa and parts of Southern Africa Madagascar suffered from drought conditions in the northern part of the country, while a tropical cyclone brought above average precipitation to the southern tip
Significant precipitation deficits over Namibia and Angola caused extreme drought condi-tions In contrast, the eastern part of southern Africa was affected early in the year by above average rainfall, leading to severe flooding, particularly in Mozambique, Botswana and Malawi More detailed analysis is provided in the sub-regional section
Figure 3. African annual precipitation in deviation from normals (mm/month) for 2013 with respect to 1951–2000 (Source: GPCC)
40N
20W 10W 0 10E 20E 30E 40E 50E 60E30W
30N
20N
10N
EQ
10S
20S
30S
40S
50S
60S
70
50
30
10
–10
–50
–30
–70
6
Data Gaps in AfricaClimate observations are derived from numerous meteorological and related observational networks and systems that underpin applications such as weather and climate monitoring and forecasting, air pol-lution modeling and environmental impact assessments The WMO Integrated Global Observing System (WIGOS), together with the WMO Information System (WIS), serves as the basis for all Members and WMO Programmes to provide and have access to accurate, reliable and timely weather, climate, water and related environmental observations and products
Climate observations must meet high stan-dards defined by a number of important criteria First, climate observations need to account for the full range of elements that describe the climate system Second,
an observation at a particular time needs a reference climate against which it can be evaluated, that is, a reference climatologi-cal period must be selected In this regard, observations from stations that exist only for a short period (from days to a few years), or that relocate frequently, will generally have less value than observations from stations whose operations have been maintained to established standards over many years Third, a climate observation should be asso-ciated – either directly or indirectly – with a consistent set of data (metadata) describing the conditions in which climate observations were collected, which will provide users with information on how the observations can be interpreted and used
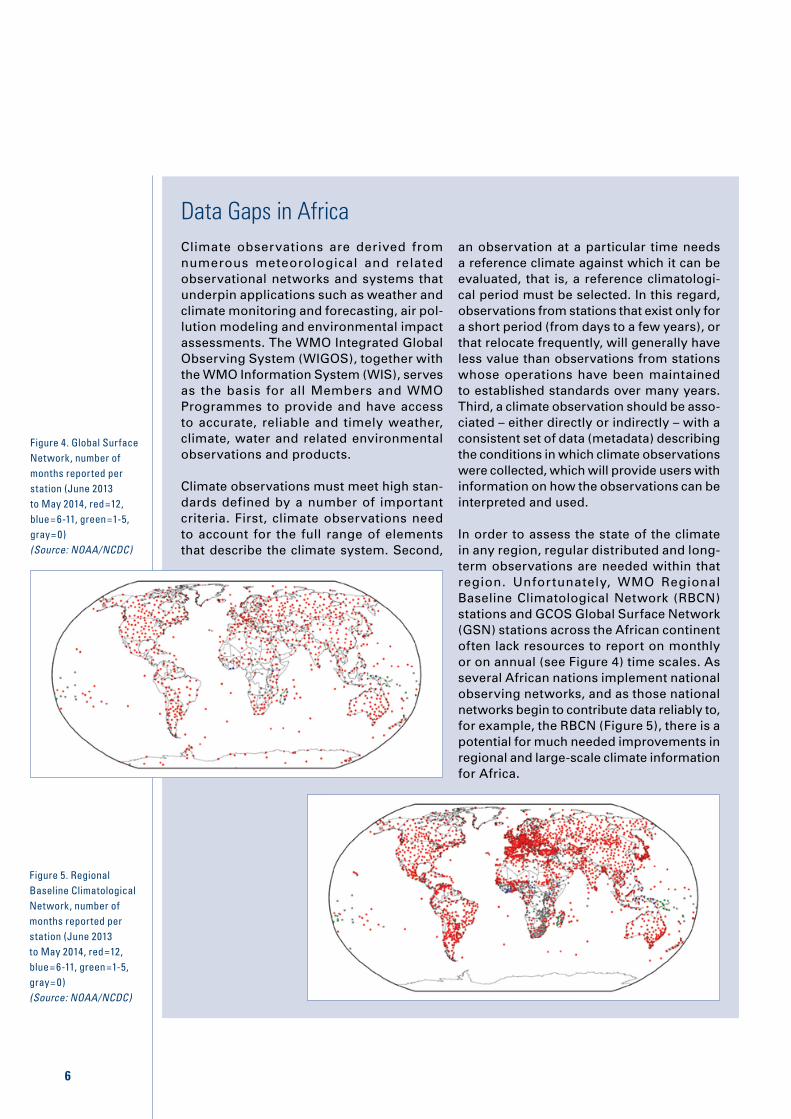
In order to assess the state of the climate in any region, regular distributed and long-term observations are needed within that region Unfortunately, WMO Regional Baseline Climatological Network (RBCN) stations and GCOS Global Surface Network (GSN) stations across the African continent often lack resources to report on monthly or on annual (see Figure 4) time scales As several African nations implement national observing networks, and as those national networks begin to contribute data reliably to, for example, the RBCN (Figure 5), there is a potential for much needed improvements in regional and large-scale climate information for Africa
Figure 4. Global Surface Network, number of months reported per station (June 2013 to May 2014, red=12, blue= 6-11, green=1-5, gray= 0) (Source: NOAA/NCDC)
Figure 5. Regional Baseline Climatological Network, number of months reported per station (June 2013 to May 2014, red=12, blue= 6-11, green=1-5, gray= 0) (Source: NOAA/NCDC)
7
Six subregions were considered in assessing climate features on subregional scale: Southern Africa, central Africa, western Africa, eastern Africa, northern Africa and south-west Indian Ocean island countries A survey was sent to all African countries and the feedback was used to summarize key features in each subregion
SOUTHERN AFRICA
The southern African subregion is characterized by tropical and subtropical climate, which is influenced by the long coastline from the Indian to the Atlantic Ocean The most influential cli-mate factors are ocean currents, the ITCZ and quasi-stationary high- pressure systems (St Helena High in the South Atlantic and Mascarene High in the Indian Ocean) The subregion is mainly characterized by a wet and hot season from October to March (summer) and a cool and dry season from April to September (winter)
TEMPERATURE
In the southern African subregion, warmer than average temperatures were recorded, in par-ticular in the western parts (see Figure 1) The highest temperature deviations were observed in parts of Namibia, Angola and Zambia, leading to a severe drought in Namibia and Angola
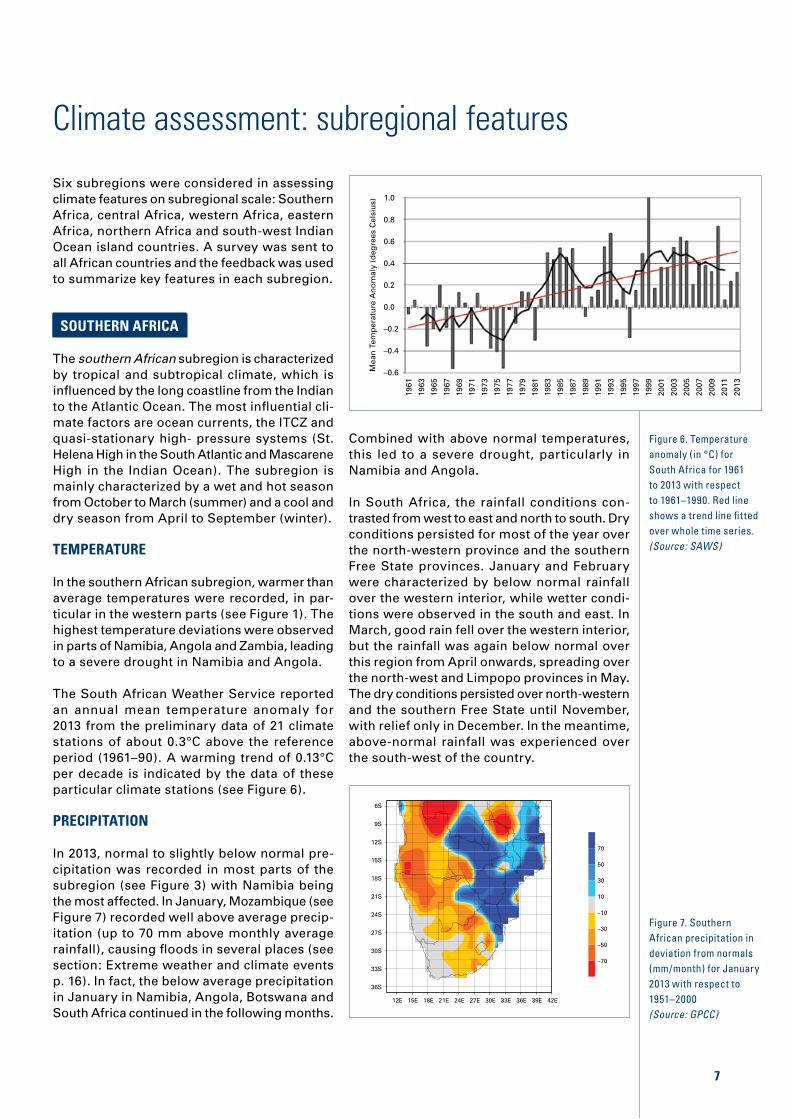
The South African Weather Service reported an annual mean temperature anomaly for 2013 from the preliminary data of 21 climate stations of about 0 3°C above the reference period (1961–90) A warming trend of 0 13°C per decade is indicated by the data of these particular climate stations (see Figure 6)
PRECIPITATION
In 2013, normal to slightly below normal pre-cipitation was recorded in most parts of the subregion (see Figure 3) with Namibia being the most affected In January, Mozambique (see Figure 7) recorded well above average precip-itation (up to 70 mm above monthly average rainfall), causing floods in several places (see section: Extreme weather and climate events p 16) In fact, the below average precipitation in January in Namibia, Angola, Botswana and South Africa continued in the following months
Combined with above normal temperatures, this led to a severe drought, particularly in Namibia and Angola
In South Africa, the rainfall conditions con-trasted from west to east and north to south Dry conditions persisted for most of the year over the north-western province and the southern Free State provinces January and February were characterized by below normal rainfall over the western interior, while wetter condi-tions were observed in the south and east In March, good rain fell over the western interior, but the rainfall was again below normal over this region from April onwards, spreading over the north-west and Limpopo provinces in May The dry conditions persisted over north-western and the southern Free State until November, with relief only in December In the meantime, above-normal rainfall was experienced over the south-west of the country
0.8
0.4
0.0
–0.4
1.0
0.6
0.2
–0.2
–0.6
1961
1963
1965
1967
1969
1971
1973
1975
1977
1979
1981
1983
1985
1987
1989
1991
1993
1995
1997
1999
2001
2003
2005
2007
2009
2011
2013
Mea
n T
emp
erat
ure
An
om
aly
(deg
rees
Cel
siu
s)
Figure 6. Temperature anomaly (in °C) for South Africa for 1961 to 2013 with respect to 1961–1990. Red line shows a trend line fitted over whole time series.(Source: SAWS)
Climate assessment: subregional features
6S
15E 18E 24E 27E 30E 36E 42E39E21E 33E12E
9S
12S
15S
18S
21S
24S
27S
30S
33S
36S
70
50
30
10
–10
–50
–30
–70
Figure 7. Southern African precipitation in deviation from normals (mm/month) for January 2013 with respect to 1951–2000 (Source: GPCC)

8
Extreme temperatures in the southern hemisphere in 2013The southern hemisphere recorded its third warmest year (after 2005 and 2009) with regard to land-only surface temperatures In South America, a warm October–December period contributed to Argentina’s second warmest year since records began in 1961, at 0 57°C above average, behind only the record warmth set the year before, in 2012 Many regions of the country had their warm-est December on record, due largely to the most significant heat wave in Argentina since February 1987 December 2013 was the warmest of any month for the capital city of Buenos Aires since records began in 1906 Argentina’s five warmest years on record have all occurred in the past eight years (since 2006)
In the South-west Pacific, Australia also observed its warmest year since national records began in 1910, at 1 20°C above aver-age and 0 17°C higher than the previous record warmest such period in 2005 January 2013 was the hottest month ever in the country Monthly maximum temperature anomalies reached +5°C in north-west New South Wales On January 7th, a new national area-averaged daily maximum temperature of 40 30°C was set The extreme warmth combined with a warmer-than-average December and February to give the country its hottest summer (December–February) on record Warmer-than-average temperatures continued through the year as Australia
observed its third warmest winter (June–August) on record, followed by its record warmest spring (September–November) Temperatures for September were 2 75°C above average, the highest monthly tempera-ture departure from average ever recorded in Australia The country recorded its all-time warmest 12-month period during September 2012–August 2013, only to see the record broken in the following two consecutive months, making November 2012–October 2013 the current warmest 12-month period on record
The anomalous warmth was also present during austral winter in New Zealand, which experienced its fourth warmest July and record warmest August These warm months contributed to the country’s warmest winter on record New Zealand recorded its third warmest year since its national records began in 1909
In southern Africa, most parts recorded above- to well-above normal temperatures in 2013 Angola, Namibia, and Zambia observed the highest anomalies By February, maximum temperatures in the central and north-western interior of South Africa were 3-4°C above the 1971–2000 normal Even in Cape Town, hikers had to be airlifted off Table Mountain because of dehydration caused by the extremely hot conditions (Sources: SAWS, Tokyo Climate Centre and NOAA-NCDC)

9
Figure 8. Percentage of normal precipitation over the Indian Ocean region for JJA 2013 with respect to 1951–2000 (Source: GPCC)
SOUTH-WEST INDIAN OCEAN ISLAND COUNTRIES
The south-west Indian Ocean island countries consist of many islands grouped into five countries, including Comoros, Madagascar,
Mauritius, Mayotte Island (France), La Réunion Island (France) and Seychelles The region has a warm and wet season from November to April and a cooler and dry season from May to October and is mainly influenced by the south-eastern trade winds
TEMPERATURE
Island National temperature anomaly (with respect to)
Precipitation: Percentage of normal (with respect to)
Madagascar +0 4°C (1971–2000) 98% (1981–2010)
La Réunion +0 45°C (1981–2010) 83% (1971–2000)
Mauritius +0 45°C (1971–2000) 102% (1971–2000)
Comoros +0 5°C (1971–2000) near average
All of the countries in this subregion experienced warmer than average conditions in 2013 accord-ing to the National Meteorological Services (see table above) The month of November was the warmest November since 1971 across all islands In La Réunion, it was the warmest November on record since 45 years In Seychelles, a positive monthly anomaly as high as +3°C was observed, and in Madagascar and Comoros, positive anom-alies up to +2°C were recorded
The National Meteorological Service of Madagascar recorded the third warmest year on record since 1971, with 2006 and 2010 being the warmest and 2013 being slightly warmer than 2012 The highest positive anomaly of about +0 8°C was observed in the eastern station of Sainte-Marie, in the north-western station of Antsohihy, and in the central highland station of Fianarantsoa During the January to March summer months, the mean seasonal tempera-tures were above normal in the northern areas of the island with the highest positive anomalies observed in Sainte-Marie (+1 3°C) and Antsohihy (+1 0°C) During the austral June to August winter months, the mean seasonal temperatures were above normal along the central western coast, and below normal along the north-eastern coast The highest positive anomaly was recorded at Morondava (+1 1°C) and the highest negative anomaly was recorded at Sambava (-0 8°C)
In La Réunion, 2013 was the sixth warmest year on record since 1971 as observed by Méteo
France Minimum temperatures were generally cooler than average for May to August, and maximum temperatures were above average for July to December
PRECIPITATION
Near normal precipitation was observed in most parts of the region during 2013 However, in Madagascar the mean annual rainfall was below normal in the north-eastern part and above normal at the southern tip (see Figure 3) The January to March total seasonal rainfall was below normal in the northern part of Madagascar and well above normal in the southern tip of the island, mainly due to Tropical Cyclone Haruna, which hit the southern part in February Mauritius recorded above nor-mal precipitation during JFM For La Réunion Island, January was the wettest month during the year, mainly due to the Tropical Cyclones Dumile and Felleng The climatologically dry June to August (JJA, see Figure 8) winter season was generally drier than normal across the whole region A severe drought affected the north-western part of Madagascar, La Réunion Island and Comoros, with amounts averaging about 50% and below compared to the 1951–2000 average
500
250
167
125
100
60
80
40
20
10S
42E 44E 46E 47E 49E 51E48E 50E 52E43E 45E41E
12S
14S
16S
18S
20S
22S
24S
26S
28S

10
CENTRAL AFRICA
Central Africa is one of the wettest parts of the continent and is influenced by the position of the Intertropical Convergence Zone (ITCZ) Three peak rainfall periods are considered for the region: MAM (March-April-May), JAS (July-August-September) and OND (October-November-December) The length of the rainy season varies from the coastal area (more than 8 months) to the dry desert area in the northern part of the subegion
TEMPERATURE
Much of central Africa experienced normal to above-normal temperatures during the year, with an anomalous warmth across southern Angola National Meteorological Services reported an anomaly of about +0 6 °C above the 1961–1990 reference period in Cameroon and an annual mean temperature of 25 9°C, which is about 0 9°C above the 1961–1990 average for Brazzaville, Congo
PRECIPITATION
The MAM season in central Africa was char-acterized by well-below average precipitation in Zambia and Uganda During the JAS wet season, well-below average precipitation was recorded over Gabon From October to November, well-above average rainfall was observed over western Gabon
EASTERN AFRICA
The subregion of eastern Africa covers the countries from Eritrea in the north to Tanzania in the south The subregion has a broad diver-sity of terrain and climate The two highest mountains in Africa, Mt Kilimanjaro and Mt Kenya, lie in East Africa, as well as one of the largest freshwater lakes on the planet, Lake Victoria The climate is typically equatorial with high temperatures year round and little seasonal variation, especially closer to the equator Rainfall in the region is highest in the mountains and lowest in the north It increases
Special Focus: Can the 2011 East African drought be attributed to human-induced climate change?
In early 2011, the Greater Horn of Africa was impacted by a severe drought, which consisted of the failure of two successive rainy seasons
A study performed by Lott et al (2013) assessed the short rainy (October-December) and long rainy season (March-June) in Eastern Africa in 2010 and 2011, respectively Therefore, the technique of event attribution has been applied using the observed sea surface temperatures (SSTs), and sea ice conditions with a state-of-the-art climate model
The two rainy seasons were simulated hundreds of times to produce possible dis-tributions of precipitation Simulations of the climate without human influences include
only natural forcings and an estimate of the change in the SST and the sea ice due to anthropogenic forcings subtracted from the observations
The results of this study show that the observed rainfall deficit for the 2010 short rainy season (October to December) was well within the probability distribution and, as widely reported, was particularly affected by La Niña However, the study suggested that the 2011 long rainy season (March- June) deficit was more probable when taking into account anthropogenic climate change factor
Further work is needed to understand the mechanisms involved and to address the uncertainties of this study more deeply
11
Figure 9. Temperature anomaly for Nigeria in 2013 with respect to 1981–2010(Source: Nigerian Meteorological Agency)
southwards Northern Somalia is one of the driest regions, with an average annual rainfall of 130 mm due to the rain shadow effect caused by the mountain ranges in the east The coast and the mountains in the south of the region typically receive more than 1200 mm a year There are two short rainy seasons: one around April-May-June (AMJ), and one in October-November-December (OND) Rainfall is strongly influenced by the Inter-tropical Convergence Zone (ITCZ) that streams low pressure around the equator Rainfall in the region is also affected by El Niño, and in years when this phenom-enon prevails, eastern Africa receives more rainfall, especially during the first rainy season of the year In contrast, if La Niña is prevailing, the southern parts of the subregion normally experience a drier-than-normal period between November and March
TEMPERATURE
Eastern Africa recorded near average tem-peratures during 2013 in most parts of the subregion Nevertheless, Kenya registered several breaking records in some locations during the year In fact, several daily maximum temperature records were broken in January, February and August, in many places, including Wajir, Mombasa, Mandera, and Dagoretti Corner (Nairobi) The average January temperature at Wajir was the highest recorded in the past half century
PRECIPITATION
Precipitation data in the region remain limited Heavy rainfall leading to floods was reported in mid-April in Ethiopia and in Kenya between March and May, and in South Sudan and Sudan in August, among others
WESTERN AFRICA
The western Africa subregion is influenced by the Inter-Tropical Divergence (ITD) Northwards, sub-Saharan and desert conditions are prevail-ing The rainy season in coastal areas in West Africa is generally observed from the end of April to July with a second and shorter rainy season in September and October Further inland towards the desert, only one rainy season from July to September is observed
TEMPERATURE
The year 2013 was characterized by mean tem-peratures close to or slightly above the average in most of the countries
In Côte d’Ivoire, as reported by the National Meteorological Service, an annual mean tem-perature anomaly of +0 8°C with respect to the 1961–1990 average was recorded for 2013
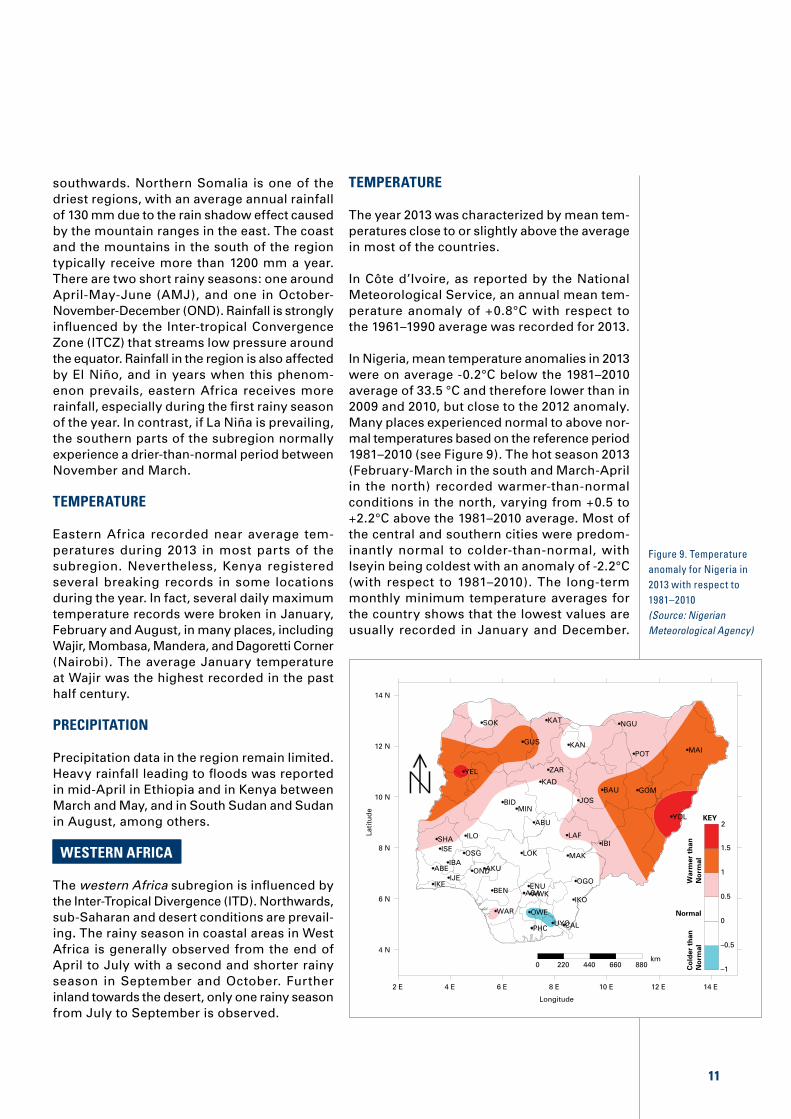
In Nigeria, mean temperature anomalies in 2013 were on average -0 2°C below the 1981–2010 average of 33 5 °C and therefore lower than in 2009 and 2010, but close to the 2012 anomaly Many places experienced normal to above nor-mal temperatures based on the reference period 1981–2010 (see Figure 9) The hot season 2013 (February-March in the south and March-April in the north) recorded warmer-than-normal conditions in the north, varying from +0 5 to +2 2°C above the 1981–2010 average Most of the central and southern cities were predom-inantly normal to colder-than-normal, with Iseyin being coldest with an anomaly of -2 2°C (with respect to 1981–2010) The long-term monthly minimum temperature averages for the country shows that the lowest values are usually recorded in January and December
2 E 4 E 6 E 8 E 10 E 12 E 14 E
4 N
6 N
8 N
10 N
12 N
14 N
ABE
ABU
AKU
ASAAWK
BAU
BID
BEN
CAL
ENU
GOM
GUS
IBA
IBI
IKE
IKO
ILO
IJE
ISE
JOS
KAD
KAN
KAT
LAF
LOK
MAI
MAK
MIN
NGU
OGOOND
OSG
OWE
PHC
POT
SHA
SOK
UYO
WAR
YEL
YOL
ZAR
–1
–0.5
0
0.5
1
1.5
KEY
0 220 440 660 880km
Normal
2
Longitude
War
mer
th
anN
orm
alC
old
er t
han
No
rmal
Lati
tud
e

12
This period can therefore be regarded as the cold season in Nigeria with December as the coldest month Colder than normal minimum temperature anomalies (-0 5 to -2 0°C) were recorded in places around the south-east and Delta region during December, with Owerri recording the highest negative value (-1 7°C) Most areas in the north and middle belt recorded minimum temperature departures above normal (+1 0 to +3 8°C), with the highest anomaly of +3 8°C over Yola and Lafia Kano recorded the highest negative anomaly (-3 8°C) during the cold season
Other country reports were received from the Gambia and Guinea In the Gambia, the national mean temperature was 27 9°C, with an anom-aly of +0 1°C above the 1981–2010 average In Guinea, the annual mean temperature for 2013 was 25 4°C, with an anomaly of +0 56°C compared to the 1981–2010 period
PRECIPITATION
The year 2013 was characterized by below-aver-age precipitation in the coastal areas of western Africa (see Figure 3) Well-above average pre-cipitation was recorded during some seasons, in particular from July to August in northern Mali (see Figure 10)
In Côte d’Ivoire, precipitation during the last 3 years (2011, 2012 and 2013) was near the average, with 13% below the 1961–1990 aver-age in 2013 In November rainfall exceeded the normal by 41% (reference period 1971–2000) The crop season 2013 was characterized by a late onset of rains from May to mid-July in the Sahel and Gulf of Guinea region, as reported by Agrhymet The onset of rains in 2013 was very late, compared to the period 1981–2010, in particular at the coast according to the evaluation done by the National Meteorological Service
In Nigeria, wetter-than-normal conditions were experienced in Bauchi, Kaduna, Katsina and Nguru in the north and Ogoja, Ikom, Uyo, Calabar, Benin and Ikeja in the south, causing floods in some areas Drier-than-normal con-ditions were experienced in and around Shaki, Iseyin, Abeokuta, Oshogbo, Yelwa, Gusau, Bida, Minna, Abuja, Ibi and Yola
The Little Dry Season (LDS in JAS), which describes the reduced rainfall between the two peak periods, was most pronounced in the south-west The signal of the LDS was first felt in the last week of July over Abeokuta, Ikeja, Oshogbo and Ibadan It lasted for three to four weeks over the area A normal growing season
was recorded, which led to a good farming year across the country Dry spell episodes were reported in most parts of the northern states shortly after onset of the rains, result-ing in the replanting of crops in these areas (Source: Nigerian Meteorological Agency)
Other country reports were received from Senegal, Guinea and the Gambia In Senegal, normal to above-normal annual precipitation was recorded In Guinea, the observed precipi-tation of 2178 mm was slightly above the 1981–2010 average of 2133 mm In the Gambia, total precipitation was 973 mm and 37% above the long-term mean of 709mm (with respect to 1981–2010)
Figure 10. Percentage of normal precipitation over western Africa in JJA 2013 (Source: GPCC)
24N
15W 10W 5W 0 5E 10E 15E 20E20W
40 60 80 100 125 167 250 50020
22N
20N
16N
18N
14N
12N
10N
8N
6N
4N
2N
EQ

13 13
Featured article: Western Africa Climate Assessment & Dataset (WACA&D)
There are two important tasks for the WMO Data Rescue (DARE) program, which are locat-ing and inventorying old climate records with useful Metadata and coordinating a collective approach for undertaking the subsequent steps in recovering and digitizing the records WMO efforts are targeting a collective DARE undertaking at regional and subregional levels to develop sustained effective initiatives, using regional infrastructure and new technolo-gies WMO Regional Climate Centres helped design regional and subregional Data Rescue initiatives Framing Data Rescue projects and activities in the context of the need for long-term high-quality climate data sets for climate services and for climate change assessment and adaptation was recommended by the Joint CCl/WCRP/JCOMM Expert Team on Climate Change Detection and Indices (ET-CCDI) and the CCl Task Team on Climate Data Rescue (CCl/TT-DARE)
To help accelerate Data Rescue, the ETCCDI and CCl/TT-DARE approach is being imple-mented based on a series of workshops to set up DARE initiatives addressing the rescue and digitization of climate data in the context of climate change assessment and adaptation So far this approach has led to a good progress in DARE, for example, the European Climate Assessment and Datasets (ECA&D) in Europe, the Mediterranean Data
Rescue initiative (MEDARE) in the greater Mediterranean Region, and the Southeast Asia Climate Assessment and Datasets (SACA&D) in South-East Asia All these initiatives constitute the subregional lay-ers of a more global initiative of climate assessment and climate data sets (ICA&D) being supported technically by Koninklijk Nederlands Meteorologisch Instituut (KNMI)
The International Workshop on Rescue and Digitization of Climate Records for countries in West Africa was one of this series of workshops The purpose was for NMHSs at subregional levels to work together to identify best mechanisms and practices to accelerate Data Rescue and to develop useful climate information for decision-making and climate assessment
The participants agreed to create a West Africa Climate Assessment and Data escue Initiative (WACA-DARE) and developed a road map with detailed specifications for short, medium and long term activities The initiative will be coordinated by the African Centre for Meteorological Applications for Development (ACMAD) under WMO auspices and CCl guidance WACA-DARE constitutes henceforth the West African component of the WMO sponsored International Climate Assessment and Data (ICA&D) sets
NORTHERN AFRICA
Northern Africa is characterized by a Mediter-ranean climate at the coast and a large desert area in the south, where temperatures are the hottest
TEMPERATURE
During 2013, above-normal temperatures pre-vailed over most of northern Africa, exceeding
by at least 1°C the 1961–1990 normal tempera-tures, except over the northern parts of the subregion (in Morocco and Algeria)
According to the National Meteorological Services in the region, Morocco had its 11th warmest year in 2013 Tunisia recorded the ninth warmest year Autumn and particularly spring were warmer than normal, with anomalies exceeding the 1961–1990 averages by more than 2°C over Libya and Tunisia
At the monthly timescale, March was warmer than normal over most parts of the region and October was very hot over Tunisia and most parts of Algeria with anomalies exceeding +4°C in many locations, while Egypt experienced below normal temperatures Spring temperature anomalies of 2 2°C above normal and October temperature anomalies of 4°C above average contributed to one of the ten warmest years in
Tunisia since 1950 In February, below-average temperatures over Tunisia, Algeria and the north of Morocco were recorded and led to cold waves in several locations
The Canary Island mean temperature in 2013 was 21 6ºC and +0 7ºC above the 1971–2000 average
PRECIPITATION
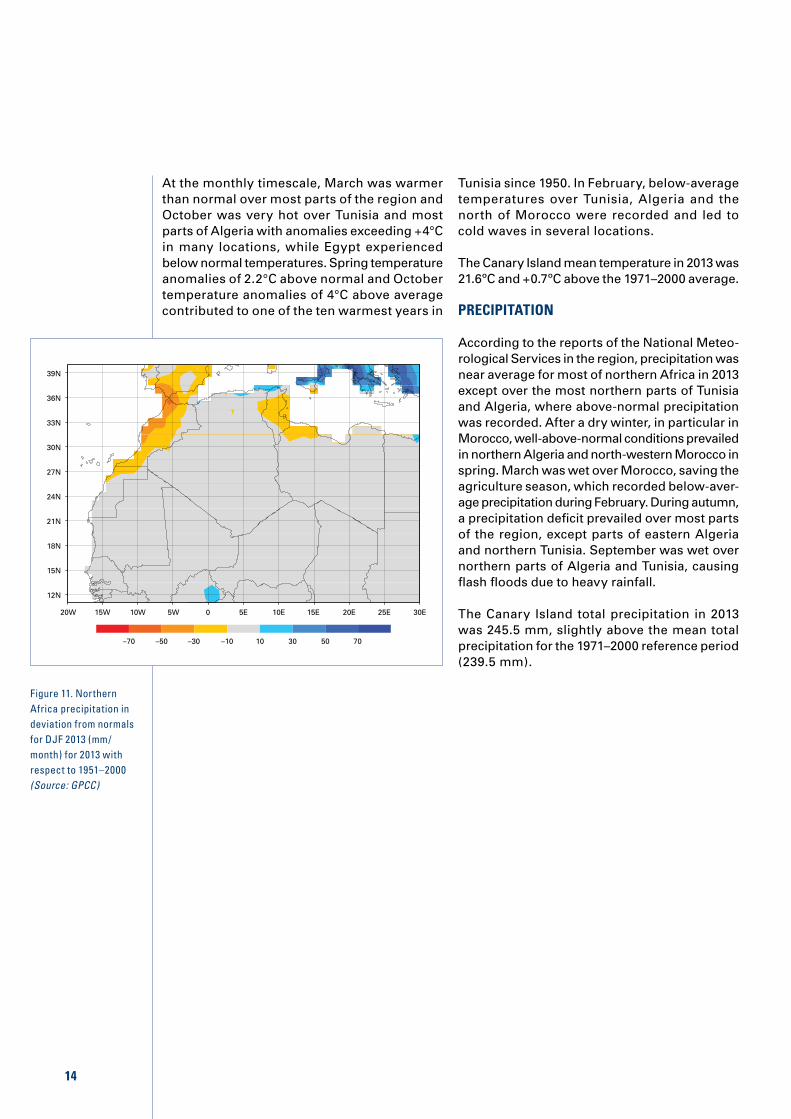
According to the reports of the National Meteo-rological Services in the region, precipitation was near average for most of northern Africa in 2013 except over the most northern parts of Tunisia and Algeria, where above-normal precipitation was recorded After a dry winter, in particular in Morocco, well-above-normal conditions prevailed in northern Algeria and north-western Morocco in spring March was wet over Morocco, saving the agriculture season, which recorded below-aver-age precipitation during February During autumn, a precipitation deficit prevailed over most parts of the region, except parts of eastern Algeria and northern Tunisia September was wet over northern parts of Algeria and Tunisia, causing flash floods due to heavy rainfall
The Canary Island total precipitation in 2013 was 245 5 mm, slightly above the mean total precipitation for the 1971–2000 reference period (239 5 mm)
14 14
Figure 11. Northern Africa precipitation in deviation from normals for DJF 2013 (mm/month) for 2013 with respect to 1951–2000 (Source: GPCC)
39N
15W 10W 5W 0 5E 10E 15E 20E 25E 30E20W
–70 –50 –30 –10 10 30 50 70
36N
33N
27N
30N
24N
21N
18N
15N
12N
15
Focus on: the Kilimanjaro Glacier
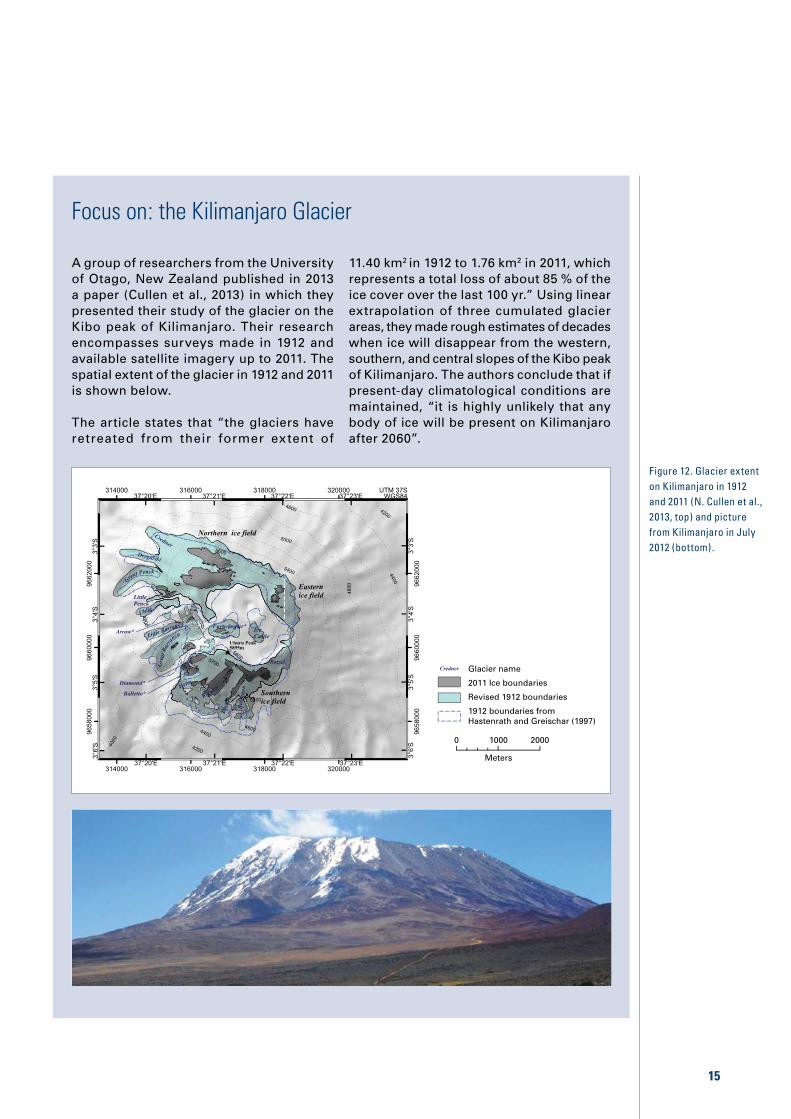
A group of researchers from the University of Otago, New Zealand published in 2013 a paper (Cullen et al , 2013) in which they presented their study of the glacier on the Kibo peak of Kilimanjaro Their research encompasses surveys made in 1912 and available satellite imagery up to 2011 The spatial extent of the glacier in 1912 and 2011 is shown below
The article states that “the glaciers have retreated from their former extent of
11 40 km2 in 1912 to 1 76 km2 in 2011, which represents a total loss of about 85 % of the ice cover over the last 100 yr ” Using linear extrapolation of three cumulated glacier areas, they made rough estimates of decades when ice will disappear from the western, southern, and central slopes of the Kibo peak of Kilimanjaro The authors conclude that if present-day climatological conditions are maintained, “it is highly unlikely that any body of ice will be present on Kilimanjaro after 2060”
Glacier name
2011 Ice boundaries
Revised 1912 boundaries
1912 boundaries fromHastenrath and Greischar (1997)
0 1000 2000
Meters
Figure 12. Glacier extent on Kilimanjaro in 1912 and 2011 (N. Cullen et al., 2013, top) and picture from Kilimanjaro in July 2012 (bottom).

16
According to the Annual Disaster Statistical Review 2013 published by the Centre for Research on the Epidemiology of Disasters (CRED), hydrological disasters represented 77 3% of occurrence of all natural disasters in Africa, followed by meteorological (13 6%) and climatological disasters (9 1%)
The number of victims (4 92 million) was below the annual average number of disaster victims (affected and killed) during 2003–2012 (30 1 million), mainly due to the low num-ber of victims of climatological disasters Hydrological disasters affected more than 1 5 million people The floods in South Sudan, Sudan, Mozambique, Niger and Senegal accounted for 71 % of hydrological disasters victims With more than 140 000 affected and
killed victims, the cyclone 3A in Somalia was the meteorological disaster with the most severe human impact
The estimation of natural disaster damages in Africa remains extremely challenging as impact data is often poorly reported or lack-ing In 2013, reported damages from natural disasters amounted to only one fifth of the annual average of the 2003–2012 period The damages reported include: Six main flood-ing events were recorded in 2013, including in Niger with US$ 64 million induced dam-ages, Kenya (US$ 36 million), Mozambique (US$ 30 million), Sudan (US$ 7 million), Uganda (US$ 3 1 million) and Ethiopia (US$ 2 2 mil-lion); one drought in Namibia (US$ 64 million); the Tropical Cyclone Haruna in Madagascar
17
Extreme weather and climate events in 2013
Tropical Storm Haruna19 February–1 MarchMaximum winds - 164 km/hHaruna made landfall in Madagascaron 22 February and vacillated for 7 days in Mozambique channel.
MaliHeavy rains between 9-12 August caused flooding in Mali's Kidal and Segou regions. On 28 August, torrential rains provoked flash floods in the capitalBamako.
SudanHeavy rains fell throughout much of Sudan between 1 and 4 of August,spawning significant flooding.
MozambiqueMozambique experienced severe flooding during 12−31 January that killed at least 113 people and displaced 185,000 residents.
Eastern AfricaHeavy rainfall during March−April led to flooding that damaged crops and displaced thousands of people throughout parts of southern Somalia and eastern Kenya.
TunisiaA record warm October with an anomaly of +4°C contributed to one of the warmest years forTunisia
LibyaTripoli suffered from flash floods during 30 November-6 December, after seeing some of the heaviest rainfall in 40 years.
Central African RepublicOn 4 March, severe wind storms ravaged several neighborhoods in Bangui and nearby Bimbo, causing extensive damage.
South AfricaTemperatures rose to 47.3°C on March 4th inVioolsdrif—the hottest March temperature recorded anywhere in Africa.
GhanaTemperatures on 6 March reached 43.0°Cin Navrongo, the hottest temperature ever measured in Ghana for any month.
Southern AfricaThe southern African countries of Botswana, Namibia, and Angola experienced a large rainfall deficit during much of 2013, causing one of the worst droughts in 30 years.
EgyptOn December 13, a cold snap led to snow in Cairo, Alexandria and Madinaty in Egypt for the first time in 112 years.
Figure 13. Selected extreme weather and climate events for Africa in 2013 (Source: NOAA-NCDC)
Cyclones MaximumWind Legend
> 251 km/h209−251 km/h178−208 km/h154−177 km/h
63−118 km/h119−153 km/h

17
(US$ 25 million) and one tropical depression in Seychelles (US$ 9 3 million)
FLOODS AND HEAVY PRECIPITATION
Heavy precipitation and floods were recorded in January, in particular in Mozambique, which ranks among the ten most severe flooding events globally in 2013 with regard to the num-ber of people killed (source EM-DAT/CRED) In July and August, floods were reported in Niger,
Nigeria, Mali and Sudan, with a total of more than 140 deaths Heavy precipitation and a prolonged precipitation season was reported in coastal parts of central Africa from Cameroon to the Democratic Republic of Congo
The table on the next pages shows a summary of the floods reported during 2013 If the source is not indicated, the information was retrieved from National Meteorological Service reports Impacts, if reported, can be found in the right column
Southern Africa
BotswanaBetween 16–23 January, heavy rains caused extensive flooding in the Central Province of Botswana
At least 842 families (4 210 persons) were affected The torrential rains destroyed homes, roads, flooded dams, fields and destroyed livestock and livelihoods (IFRC, 20 Feb 2013)
Malawi
Malawi recorded heavy rains from mid-December 2012 to mid-January 2013, resulting in flooding in several districts, with Mangochi district in the southern part being the most affected
Houses collapsed and roads were rendered impassable, livestock and crops were washed away A total of 16 370 people were affected Malawi faced acute food shortage, which exacerbated the situation for the flood-affected communities (IFRC, 30 Nov 2013)
Mozambique
On 12 January, the Mozambique authorities declared an orange alert due to heavy rains On 22 January, an institutional red alert was declared
At least 113 people were killed and over 185 000 people were temporarily displaced (UN Resident Coordinator, 20 Feb 2013)
Namibia
Heavy rains and rising river levels in the Zambezi River catchment since early January 2013 caused flooding in the Caprivi region
Community houses, infrastructure and crop fields were flooded Up to 2 500 families (11 000 people) were evacuated (IFRC, 16 Mar 2013)
Zambia
Heavy rain caused flooding in Zambia from 17 January to 13 February, with Mumbwa district in the central province being the most affected
Agricultural fields, infrastructure and property were damaged and destroyed Drinking water was contaminated by floodwaters About 1 800 people were affected (IFRC, 17 Apr 2013)
17

18
South-West Indian Ocean islands countries
ComorosRainfall with a peak of 392 mm in the region of Bambao-Hambou on 30 July. There were 1 063 people displaced
MadagascarHeavy precipitation affected the central and south-western part around 15 February.
Eight people died, and 2 146 were displaced or left homeless
MauritiusA 1h rainfall above 100 mm was recorded in a few places around Port Louis on 30 March.
There were eleven fatalities, along with flooded roads and underground parking areas
La Réunion Island
Rainfall above 150 mm in a short time was recorded at Fond du Sac on 13 February.
Houses and schools were flooded
Central Africa
Cameroon
In the night of 17/18 September, heavy rain caused the rupture of the dam along the Logone River at the town of Dougui, Kai Kai District in the Far North Region of Cameroon
Initial evacuations of people to the banks of the dam were required On 27 September, a second rupture in the dam started flooding the area and nearly 9 000 people were displaced (IFRC, 1 Oct 2013)
Central African Republic
On 3–4 September, heavy rains lasted for hours and caused flooding in several areas of the 3rd district of Bangui
Almost 33 000 people were affected, and 337 families had their houses damaged or destroyed Almost all wells and latrines in these areas were damaged by floodwaters (IFRC, 18 Sep 2013)
CongoExceptional 24h precipitation of 38,6 mm was recorded on 3 March and 8 November.
Mudslides and landslide engulfied dwelling houses and killed several people in certain neighborhoods of Brazzaville
Uganda
Heavy rains at the beginning of May caused the banks of the Nyamwamba river to burst, which resulted in flooding in western Uganda’s Kasese district
Eight people were confirmed dead, and over 25 000 were affected The flooding caused widespread destruction of houses, crops and facilities such as bridges, roads and power lines Major infrastructures such as a hospital and sewage treatment unit were damaged (IFRC, 17 May 2013)

19
Eastern Africa
EthiopiaHeavy rains in several areas caused flooding starting in mid-April.
More than 9 000 households were affected in the Somali region and more than 1 300 households in the Oromia region and SNNPR The floods caused displacement, damage to infrastructures and loss of livelihoods, including houses, water schemes, livestock, farmlands and food stocks (OCHA, 22 Apr 2013)
Kenya
Isolated torrential rainfall as part of the long rainy season caused flooding in several parts between the middle of March and May The worst affected areas included the Marsabit and Isiolo provinces, where heavy rains triggered floods
Damage to infrastructure and inaccessible roads were reported
Heavy rains induced floods in the southern Narok and northern Kajiado provinces and also caused flooding along the Tana River at the beginning of April.
Displacement of thousands of people during the first week of April was caused (FEWS, 10 Apr 2013)
A flood occurred in August in the Marigat District after the waters of Lake Baringo rose
More than 2 000 people were displaced (Kenya Daily Nation, 9 Aug 2013)
By the end of the season, more than 140 000 people were displaced and 96 deaths were recorded in Kenya. Almost 14 000 acres of arable farmland were destroyed. A large number of latrines collapsed and contaminated water sources. (IFRC, 14 Nov 2013)
Somalia
Seasonal rains started at the end of September and contributed to flooding in the Middle Shabelle region, where flooding had already started in mid-August due to rains in the Ethiopian highlands Heavy downpours in October and early November exacerbated the flooding in Jowhar district and parts of neighboring Balcad district
As many as 7 000 households in 28 villages were affected, as reported by FSNAU (OCHA, 17 Nov 2013)
South Sudan Heavy rains started at the beginning of August
Damage to houses, crops and basic infrastructure in several of South Sudan’s northern states was caused More than 150 000 people were in need of assistance (OCHA, 16 Oct 2013)
SudanHeavy rains fell throughout much of Sudan between 1 and 4 August, spawning significant flooding
There was extensive damage and loss of life in fifteen states, with Khartoum, Gezira, Blue Nile, River Nile, White Nile and Northern state being the most affected The Government estimated that 114 000 households were affected with at least 110 people injured and 76 people killed A total of 50 000 houses were completely destroyed, displacing a large part of the affected population (IFRC, 10 Oct 2013)
20
Western Africa
Benin
Heavy rains during the third quarter of 2013 led to the River Niger overflowing its banks, which caused flooding in the Malanville and Karimama districts
More than 3 000 houses were destroyed and 13 000 hectares of farmland were affected More than 10 000 people were displaced and more than 30 000 people were affected
Burkina Faso
Starting in August, severe floods were reported Est, Boucle de Mouhoun, Sahel and Hauts-Bassins were most affected
At least 751 homes and 6 712 people were affected (OCHA, 27 Aug 2013)
Côte d’Ivoire
From 17 to 25 November, a total of 184 5 mm of rain was recorded, with a peak of 72 5mm on 19 November in Abidjan The total precipitation in November for Abidjan was 294 mm, the highest value for November rain in the last 53 years (1961–2013)
Flood in Abidjan on 25 November caused serious disruption of traffic
Gambia (the) On 15 August, the Nemakunku area was affected by flash floods
One person’s life was lost and thousands were affected
Ghana
Severe rainstorms in Ghana’s Northern and Volta regions started in the first week of March 2013 and continued for two weeks
The ensuing floods resulted in the displacement of population and loss of property The Government declared the affected areas a disaster zone
On 8 April, severe rainstorms caused further flooding While the rainy season begins in March, heavy rains usually start in May
The flooding caused destruction of property and farmlands in Agona East district in the Central region, affecting at least 1 000 people (IFRC, 18 Apr 2013)
Guinea
On 14 November, the Tougué area experienced heavy rainfall with strong wind
Rain destroyed 7 000 hectares of rice field, with an estimated value of US$ 2 million
On 8 September, Saraboido (Koundara) experienced heavy rainfall with strong wind
Five people died
Mali
Heavy rains between 9–12 August caused flooding in Mali’s Kidal and Segou regions
Houses, latrines and fields were destroyed and around 11 300 people were affected (OCHA, 26 Aug 2013)
On 28 August, torrential rains provoked flash floods in the capital Bamako
There were 37 fatalities and at least 20 000 displaced people (OCHA, 11 Sep 2013)
Mauritania
Since early August 2013, heavy rains affected several regions with anomalies as high as 35 per cent above normal, The most affected regions were Tagant, Trarza, Inchiri and Nouakchott
Households, infrastructure and livelihoods were affected The floods affected 4 225 people, displaced 2 305, killed 8, and damaged over 500 homes (OCHA, 27 Sep 2013)

21
Niger
On 13 August, torrential rainfall resulted in heavy flooding all over Niger The central Maradi region was the most affected Other affected regions were Maradi, Tillabery, Dosso, Tahoua, Niamey and Zinder
Thirty-two deaths were recorded and more than 135 000 people were affected Houses collapsed Approximately 12 000 hectares of crops were flooded (IFRC, 6 Sep 2013, OCHA, 17 Sep 2013)
Starting in October, floods along the Komadougou river affected the Diffa Region
There were 5 400 people affected (OCHA, 15 Nov 2013)
Nigeria
Heavy rains prompted flash floods in the state of Kano on 9 August.
More than a thousand homes were destroyed
A 25h widespread rainfall on 22/23 September across the south-west hit the cities Benin, Ibadan, Ondo and Oshogbo
Many roads and houses were submerged The continuous rainfall killed people, damaged properties and wreaked havoc
2013 was a season with less negative impact due to floods in Nigeria. In the affected states, damage to infrastructure and loss of lives was marginal and not as high as during 2012. OCHA reported that 35 000 people and 2 217 farms were affected by floods during 2013. (OCHA 2013 Rainy Season Overview, 11 September 2013)
Senegal
Senegal experienced exceptionally high rainfall in late August, reaching as much as 230 mm in some areas Dakar, Fatick and Kaolack were the worst affected regions by the ensuing flash floods
Agriculture lands were submerged with water in Fatick and Kedougou
Togo
Rainfall of 173 3 mm on 15 August at Dapaong, which is the highest precipitation recorded since the establishment of the station in 1957
Fields were devastated, roads were broken, and bridges were damaged
22
Northern Africa
AlgeriaFlash floods were recorded on 9 October There were at least 7 fatalities
Canary Islands
Heavy precipitation on 11 December: 109 mm in Tenerife-Sud and 103 8 mm in Tenerife-airport of Los Rodeos in 24h
These were the station records at both stations for December
Libya
Tripoli suffered flash floods during 7 days from 30 November, after seeing some of the heaviest rainfall in 40 years
Sixteen people were killed, electricity and telecommunications were disrupted, and more than 400 houses were damaged
MoroccoHeavy precipitation during a 3h period on 17 September in Marrakesh
Two people were killed, 10 homes collapsed, and many districts were impassable
Tunisia & Algeria
On 19 September, floods hit eastern Tunisia and eastern Algeria A new 24h monthly record of 143 mm was recorded in Sfax, Tunisia, on 22 December
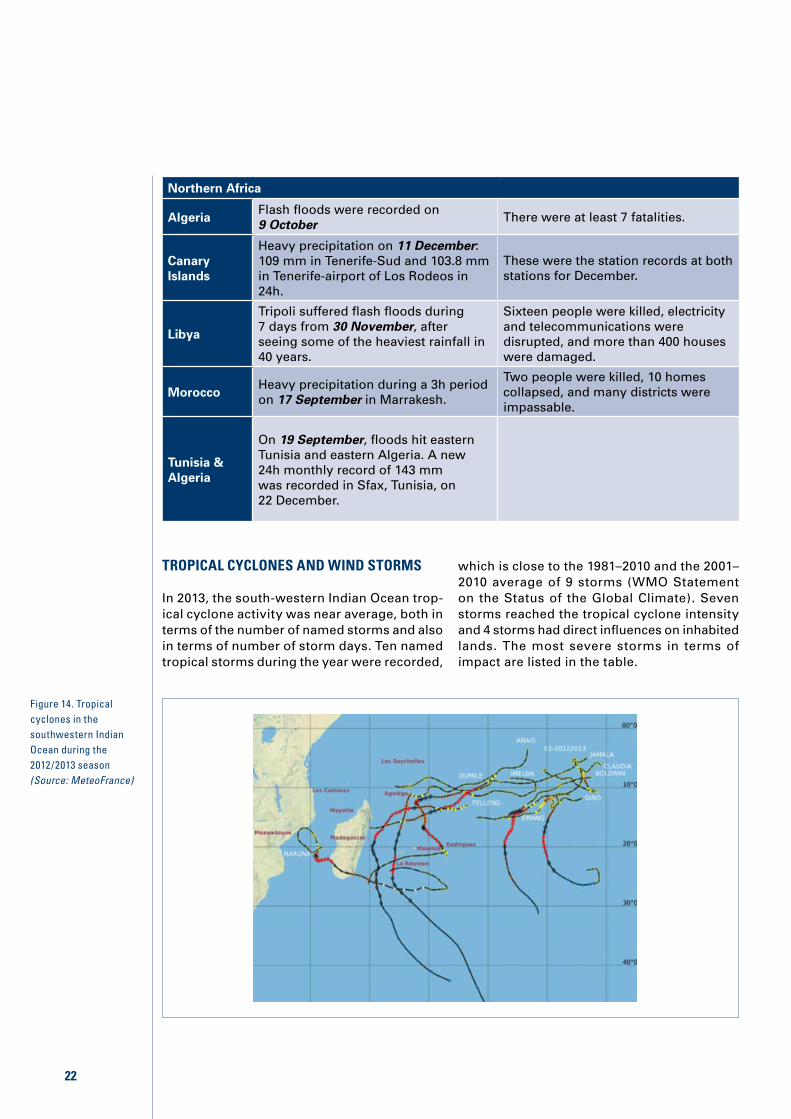
TROPICAL CYCLONES AND WIND STORMS
In 2013, the south-western Indian Ocean trop-ical cyclone activity was near average, both in terms of the number of named storms and also in terms of number of storm days Ten named tropical storms during the year were recorded,
which is close to the 1981–2010 and the 2001–2010 average of 9 storms (WMO Statement on the Status of the Global Climate) Seven storms reached the tropical cyclone intensity and 4 storms had direct influences on inhabited lands The most severe storms in terms of impact are listed in the table
Figure 14. Tropical cyclones in the southwestern Indian Ocean during the 2012/2013 season (Source: MeteoFrance)

23
Tropical Cyclone Dumile in La Réunion and Mauritius
TC Dumile cruised about 100 km from the western coast of La Réunion It brought 1 187 mm total rainfall in 48 hours at Commerson A maximum wind gust of 189 km/h was recorded at Maido (located in the highlands)
It caused little damage, primarily damage to agriculture, but it ended the 2012 drought
In Mauritius the highest gust recorded was 97 km/h; the maximum 24h rainfall was 104 mm
A few trees were uprooted, minor damage to houses was observed
Tropical Cyclone Felleng in Seychelles and Madagascar
On 27/28 January, the eastern coast of the Seychelles island Mahe was devastated by tropical depression Feleng and the island La Digue was severely affected
One thousand families were affected by floods and landslides There were 246 families displaced after their houses were either destroyed or damaged (IFRC, 23 May 2013)
TC Felleng moved southward near the east coast of Madagascar between 30 January and 2 February and brought torrential rain
Five people died and 964 were displaced (Resident Coordinator, 1 Feb 2013)
Tropical Cyclone Haruna in Madagascar and Mozambique
Maximum sustained winds of 164 km/h were recorded The powerful tropical category 2 cyclone made landfall in the south-west near Cape Saint-Vincent on 22 February, dumping more than 160 mm of rain in 24 hours Earlier, the strength of Haruna vacillated for seven days in the Mozambique Channel, bringing above-normal rainfall to the western coast of Madagascar More than 230% of normal rainfall was recorded between 10–20 February over the districts of Morombe and Taolagnaro
The cyclone caused 26 deaths and affected over 40 000 people (UNCT, 7 Mar 2013)
Tropical cyclone in Somalia
The State of Puntland in north-eastern Somalia was hit by a tropical cyclone on 10 November, which caused subsequent flash floods
Massive destruction resulted in the deaths of 162 people, displacement of tens of hundreds of nomads, decimation of approximately 1 million livestock and destruction of over 1 000 houses, according to Government statistics
Severe wind storm in the Central African Republic
On 4 March, a severe windstorm ravaged several neighborhoods in Bangui and nearby Bimbo, causing extensive damage The town of Bouar in the western part of the country experienced heavy rains accompanied by strong winds
The windstorm destroyed 1 006 houses and damaged 308 The storm affected 8 710 people, either leaving them homeless or destroying their belongings Up to 869 wells were polluted by debris and 914 latrines were destroyed (IFRC, 21 Mar 2013)
Severe wind storm in Guinea
A severe windstorm hit the coastal area around Boffa on 18 August A maximum wind speed of 32 m/s was recorded
Five persons were killed
24
DROUGHTS, HEAT WAVES AND FIRES
Droughts
In Namibia, a prolonged dry season resulted in severe drought and widespread crop failure across the country (Source: EM-DAT/CRED) Severe drought conditions lasted from January to August
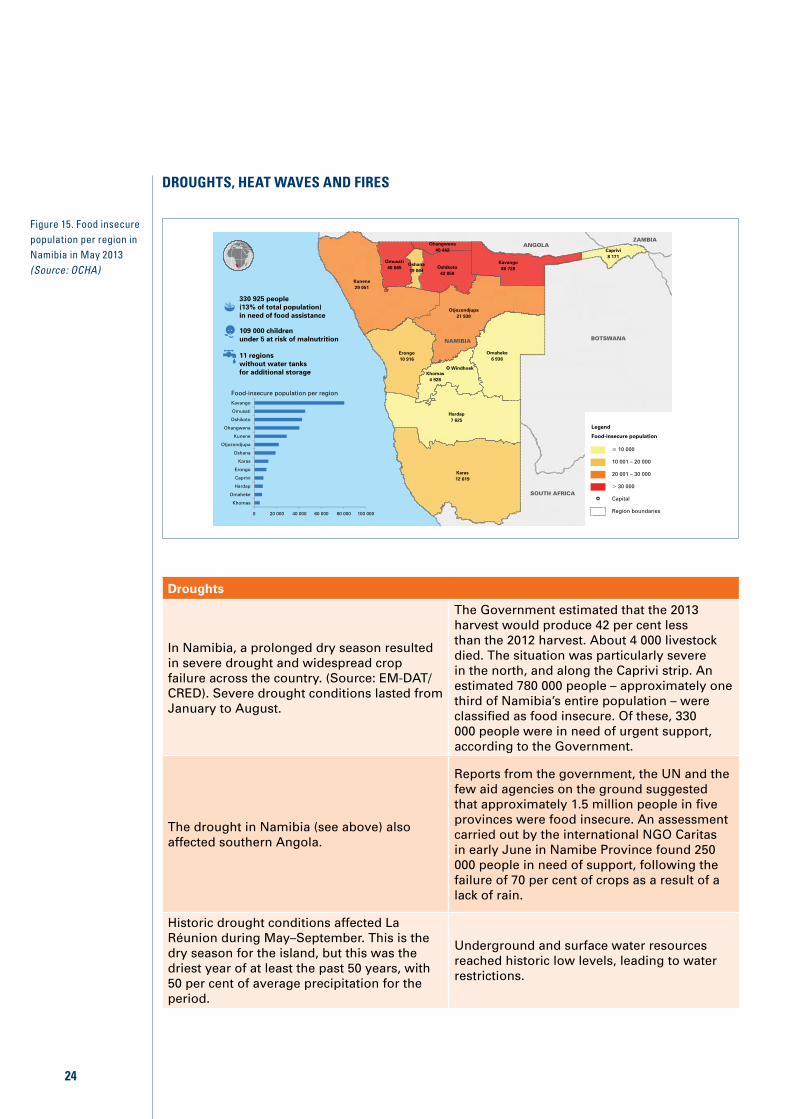
The Government estimated that the 2013 harvest would produce 42 per cent less than the 2012 harvest About 4 000 livestock died The situation was particularly severe in the north, and along the Caprivi strip An estimated 780 000 people – approximately one third of Namibia’s entire population – were classified as food insecure Of these, 330 000 people were in need of urgent support, according to the Government
The drought in Namibia (see above) also affected southern Angola
Reports from the government, the UN and the few aid agencies on the ground suggested that approximately 1 5 million people in five provinces were food insecure An assessment carried out by the international NGO Caritas in early June in Namibe Province found 250 000 people in need of support, following the failure of 70 per cent of crops as a result of a lack of rain
Historic drought conditions affected La Réunion during May–September This is the dry season for the island, but this was the driest year of at least the past 50 years, with 50 per cent of average precipitation for the period
Underground and surface water resources reached historic low levels, leading to water restrictions
Figure 15. Food insecure population per region in Namibia in May 2013 (Source: OCHA)
330 925 people(13% of total population)in need of food assistance
109 000 childrenunder 5 at risk of malnutrition
11 regionswithout water tanksfor additional storage
Food-insecure population per region
Kavango
Omusati
Oshikoto
Ohangwena
Kunene
Otjozondjupa
Oshana
Karas
Erongo
Caprivi
Hardap
Omaheke
Khomas
0 20 000 40 000 60 000 80 000 100 000
NAMIBIA
ANGOLAZAMBIA
BOTSWANA
SOUTH AFRICA
Kunene29 051
Ohangwena40 442
Omusati45 665
Oshana19 064
Oshikoto42 858
Kavango80 720
Caprivi8 171
Otjozondjupa21 930
Erongo10 916
Omaheke6 938
Khomas4 928
Hardap7 625
Karas12 619
Legend
Food-insecure population
� 10 000
10 001 – 20 000
20 001 – 30 000
� 30 000
Capital
Region boundaries
Windhoek
25
Extreme high temperature and heat waves
The temperature in Navrongo, Ghana reached 43 0°C on 6 March
It was the warmest temperature ever measured in Ghana for any month
Two heat waves hit southern Morocco in August with a daily maximum temperature anomaly of 10 4°C above normal
Fires burned 960 hectares of Argan trees
Extremely high temperatures in the range of 40°C and above were recorded in northern Nigeria from the third week of February to the first week of June Sokoto, Maiduguri, Yelwa and Gusau recorded the highest daily temperatures in excess of 43°C
The temperature in Vioolsdrif, South Africa soared to 47 3°C on 4 March This was the hottest March temperature ever measured anywhere in Africa
Fires
On 6 January, a fire outbreak in the village of Alloya in Benin was observed Dusty hot winds from the Sahara Desert worsened the situation (IFRC, 19 Jan 2013)
Hundreds of houses were destroyed and almost 3 000 people were displaced
The risk of fire increased as a result of the dry Harmattan wind that blew across Sierra Leone in January 2013 Several villages in the northern and southern provinces were affected by fire disasters between 2–28 January
Fire destroyed 279 houses and 450 families (2 257 individuals) were made homeless (IFRC, 19 Feb 2013)
Bush fires were recorded in Côte d’Ivoire during the dry season (November 2012 to February 2013) in the north of the country

26 26
OTHER EXTREME EVENTS
Dust haze
Two spells of thick dust haze engulfed Nigeria in February The first one (1–9 February) had widespread effect over most parts of the country, reaching as far as Ogoja, Obudu, Enugu, Port Harcourt and Abeokuta, reducing visibility to 300–1000 m The second one occurred from 16–18 February with a visibility between 400–800 m, affecting especially the Potiskum and Maiduguri axis Major dust spells occurred in December From 13–23 December, dust affected the north-eastern part of the country and areas in the south-west with visibility ranging between 300–1500 m The last spell of the year occurred from 30–31 December, affecting only the north-eastern axis, with visibility between 1000–1500 m
The outbreak of dust haze, which reduced horizontal visibility to 300 - 900 m affected most parts of the country Coastal cities also experienced visibility reduction to 200–900 m due to early morning fog These weather conditions disrupted flight operations at various airports, as flights were delayed, rescheduled or canceled
Extreme cold temperature and cold waves
On December 13, a cold snap led to snow and hail in St Catherine and other parts of Egypt
A minimum temperature of 5 7°C was observed at Eldoret Meteorological Station in the North Rift, Kenya on 16 July
This was the lowest minimum temperature recorded in July at the station over the past decade
In June 2013, minimum temperatures were about 1-2 °C below the 1971–2000 average over most of the western half of South Africa However, it should be noted that in some places over the eastern parts the minimum temperatures were 3-4°C above average

2726
Focus on Greenhouse Gas observations in Africa
Long-lived greenhouse gases have the strongest and the most certain warming effect on the climate According to the recent IPCC report, dramatic emission reductions are needed to keep the increase of global average temperature by 2100 below 2°C
CO2 is the most important long-lived green-house gas related to human activities In Africa, CO2 emissions from fossil fuels are pro-jected to increase substantially with economic development Tropical forests may serve as a source and a sink of CO2, depending on climate conditions Substantial CO2 emissions are associated with the deforestation process
Methane, the second most important long-lived greenhouse gas, is emitted from tropical wetlands and provides a substantial contribution to the global methane budget Tropical wetlands are very sensitive to cli-mate, so their emissions can substantially change the climate in the future Analysis of the observational data shows that recent renewed growth of the globally averaged methane is largely driven by emissions in the tropics and subtropics
Emission calculations using observations and inverse modeling are important as an inde-pendent check of the self-reported emissions on a national basis Ground-based obser-vations are essential for performing such emission verifications The use of the satellite
information, assimilated in the inverse model, did not bring substantial improvement of the emissions estimates and left the uncertainty at the level of 50% for Africa
Currently, 12 active stations are registered in WMO Region RA I in the GAW Station Information System (GAWSIS) Only five are situated on the African continent and only three, namely Assekrem, Algeria, Cape Point, South Africa and Gobabeb, Namibia, submitted data to the World Data Center for Greenhouse Gases (WDCGG) in 2012
General tendencies at these three stations correspond to the tendencies in global aver-ages, namely an increase in CO2 and CH4 mole fractions CH4 and CO2 mole fractions at the Southern Hemispheric stations are lower than global averages, while those at the Northern Hemispheric stations are higher than the global averages (for meth-ane) confirming the known inter-hemispheric gradient
As convincing statistics to assess the dis-tribution and variability of greenhouse gas concentration in Africa for 2012 are not available, it is important that greenhouse gas measurements are put in place and are maintained over the years Countries are encouraged to utilize the existing experience in the region (for example, of South Africa, Algeria and Kenya)
90°N
60°N
30°N
0°
30°S
60°S
90°S
0° 30°E 60°E 90°E 120°E 150°E 180° 150°W 120°W 90°W 60°W 30°W
Figure 16. Distribution of the fixed stations that contribute data to the WDCGG. The red dot denotes that the data from the station has been updated in the last 365 days. (Source: WDCGG)
28
Acryonyms
ACMAD African Centre of Meteorological Application for DevelopmentAgrhymet Regional Centre for Agrometeorology, Hydrology, MeteorologyCPC Climate Prediction CenterDJF December-January-FebruaryDRC Democratic Republic of the CongoEM-DAT/CRED Emergency Events Database of the Centre for Research on the Epidemiology
of DisastersESRL Earth Science Research Laboratory FEWS Famine Early Warning Systems NetworkFSNAU Food Security and Nutrition Analysis Unit - SomaliaGAW Global Atmosphere WatchGPCC Global Precipitation Climatology CentreIFRC International Federation of Red CrossITCZ Inter-tropical convergence zoneITD Inter-tropical divergenceJAS July-August-SeptemberJFM January-February-MarchJJA June-July-AugustKNMI Royal Netherlands Meteorological InstituteMAM March-April-MayNOAA National Oceanic and Atmospheric AdministrationNGO Non-governmental OrganizationOCHA United Nations Office for the Coordination of Humanitarian AffairsOND October-November-DecemberSAWS South African Weather ServiceSNNPR Southern Nations, Nationalities, and Peoples’ Region EthiopiaUN United NationsUNCT United Nations Country TeamWDCGG World Data Centre for Greenhouse GasesWMO World Meteorological Organization Data set used:
Temperature: The combination of the Global Historical Climatology Network and the Climate Anomaly Monitoring System (CAMS GHCN) by NOAA NCEP CPC is a high resolution (0 5°x0 5°) analyzed global land surface temperatures and precipitation from 1948 to near present (see http://www esrl noaa gov/psd/data/gridded/data ghcncams html)
Precipitation: http://gpcc dwd de
Bilbliography
N J Cullen et al (2013): A century of ice retreat on Kilimanjaro: the mapping reloaded - The Cryosphere, 7, 419–431, 2013, www the-cryosphere net/7/419/2013/ doi:10 5194/tc-7-419-2013
Fan, Y , and H van den Dool (2008), A global monthly land surface air temperature analysis for 1948-present, J. Geophys. Res., 113, D01103, doi:10 1029/2007JD008470
F C Lott, N Christidis, and P A Stott (2013), Can the 2011 East African drought be attributed to human-induced climate change?, Geophys. Res. Lett., 40, 1177–1181, doi:10 1002/grl 50235
29
C J R Williams, D R Kniveton, and R Layberry (2010), Idealized SST anomaly regional climate model experiments: A note of caution Progress in Physical Geography February 2010 34: 59-74, doi:10 1177/0309133309356738
WMO Statement on the Status of the Global Climate: http://www wmo int/pages/prog/wcp/wcdmp/statement php
Acknowledgements
This publication was issued in collaboration with WMO Members of RA I, the Tast Team on the African Climate and several international climate and meteorological institutions The scientific content was developed and reviewed by these international experts:
Members of the Task Team on the African Climate
Belachew Kebede Bayih National Meteorological Services Agency, EthiopiaMaimuna U Borno Nigerian Meteorological Agency, NigeriaAndre Kamga ACMAD, NigerCoulibaly Kolotioloma Direction de la Météorologie Nationale, Côte d’IvoireIsaias Gabriel António Raiva Instituto Nacional de Meteorologia, MozambiqueZo Andrianina Patrick Rakotomavo Direction Générale de la Météorologie, MadagascarRachid Sebbari Direction de la Météorologie Nationale, MoroccoSimplice Tchinda Tazo Direction de la Météorologie Nationale, Cameroon
Other experts
Tommaso Abrate WMOJessica Blunden NOAA, USADavid Carlson WMOPeer Hechler WMOAnna Pirani The Abdus Salam International Centre for Theoretical
Physics, ItalyVladimir Ryabinin WMODaniel Sighomnou WMOOksana Tarasova WMOWassila Mamadou Thiaw CPC, USABlair Trewin BoM, Australia
WMO Secretariat coordination
Omar Baddour Karolin Eichler

30
For more information, please contact:
World Meteorological Organization7 bis, avenue de la Paix – P.O. Box 2300 – CH 1211 Geneva 2 – Switzerland
Communications and Public Affairs Office
Tel.: +41 (0) 22 730 83 14/15 – Fax: +41 (0) 22 730 80 27
E-mail: [email protected]
www.wmo.int JN 1
4255
7