THE CHARCOAL TRANSITION - … charcoal...Charcoal produced using sustainably managed resources and...
184
THE CHARCOAL TRANSITION Greening the charcoal value chain to mitigate climate change and improve local livelihoods
Transcript of THE CHARCOAL TRANSITION - … charcoal...Charcoal produced using sustainably managed resources and...
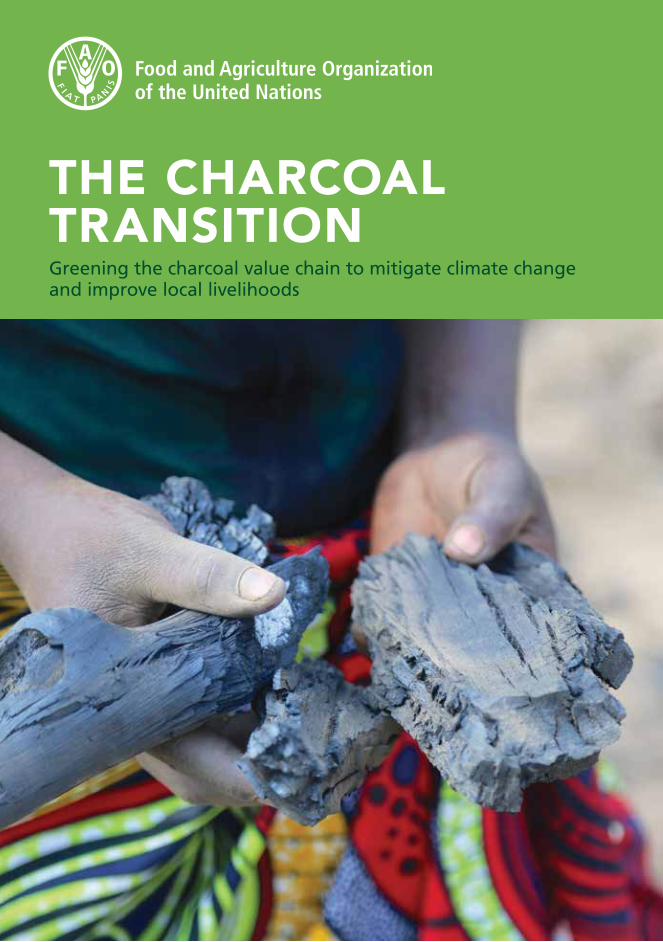
THE CHARCOAL TRANSITIONGreening the charcoal value chain to mitigate climate change and improve local livelihoods
FOOD AND AGRICULTURE ORGANIZATION OF THE UNITED NATIONSRome, 2017
THE CHARCOAL TRANSITIONGreening the charcoal value chain to mitigate climate change and improve local livelihoods
The designations employed and the presentation of material in this information product do not imply the expression of any opinion whatsoever on the part of the Food and Agriculture Organization of the United Nations (FAO) concerning the legal or development status of any country, territory, city or area or of its authorities, or concerning the delimitation of its frontiers or boundaries. The mention of specific companies or products of manufacturers, whether or not these have been patented, does not imply that these have been endorsed or recommended by FAO in preference to others of a similar nature that are not mentioned. The views expressed in this information product are those of the author(s) and do not necessarily reflect the views or policies of FAO. ISBN 978-92-5-109680-2 © FAO, 2017 FAO encourages the use, reproduction and dissemination of material in this information product. Except where otherwise indicated, material may be copied, downloaded and printed for private study, research and teaching purposes, or for use in non-commercial products or services, provided that appropriate acknowledgement of FAO as the source and copyright holder is given and that FAO’s endorsement of users’ views, products or services is not implied in any way. All requests for translation and adaptation rights, and for resale and other commercial use rights should be made via www.fao.org/contact-us/licence-request or addressed to [email protected]. FAO information products are available on the FAO website (www.fao.org/publications) and can be purchased through [email protected].
Recommended citation: FAO. 2017. The charcoal transition: greening the charcoal value chain to mitigate climate change and improve local livelihoods, by J. van Dam. Rome, Food and Agriculture Organization of the United Nations.
Cover photo: © CIFOR/M.Edliadi
iii
Contents
Foreword ..................................................................................................................viii
Acknowledgements .................................................................................................. ix
Acronyms and abbreviations ..................................................................................... x
Executive summary ............................................................................................ 1
1 Introduction ..................................................................................................111.1 Objective of this publication ............................................................................ 12
1.2 Methodology .................................................................................................... 12
1.3 Structure of this publication ............................................................................ 13
2 Charcoal production practices, consumption and impacts .......................172.1 Global trends in charcoal production and consumption ............................... 17
2.2 Production practices and technologies in the charcoal value chain ............. 23
2.3 The sustainability of the charcoal value chain: a quick assessment .............. 29
3 Greenhouse gas emissions in the charcoal value chain ........................... 373.1 Methodology for estimating emissions in the charcoal value chain ............. 38
3.2 Estimating the climate impacts of the full value chain .................................. 40
3.3 Emissions from sourcing wood in the charcoal value chain ........................... 42
3.4 Emissions from carbonization .......................................................................... 47
3.5 Emissions in transportation and distribution ................................................. 49
3.6 Emissions from end use .................................................................................... 50
3.7 Overview of greenhouse gas emissions in the charcoal value chain ............ 53
4 Technical interventions for a greener charcoal value chain ..................... 574.1 Sourcing wood for charcoal ............................................................................. 58
4.2 Carbonization ................................................................................................... 68
4.3 Transportation .................................................................................................. 73
4.4 End use .............................................................................................................. 73
4.5 The technological potential for climate-change mitigation through improvements in the charcoal value chain ....................................... 76
iv
5 Costs and benefits of greening the charcoal value chain .........................815.1 Cost and benefits of the charcoal value chain, business as usual ................. 82
5.2 Costs and benefits of interventions to green the charcoal value chain ....... 87
5.3 National-level costs and benefits of greening the charcoal value chain ...... 92
6 Policy options towards a climate-smart charcoal sector .......................... 956.1 Barriers and options for policy, legal, institutional and
regulatory frameworks .................................................................................... 97
6.2 Barriers and options for planning and decision-making processes ............ 105
6.3 Barriers and options for implementation, enforcement and compliance .... 108
7 Conclusions and recommendations ..........................................................115
Bibliography ....................................................................................................121
Annex AInformation on charcoal production and sustainability .......................................... 139
Annex B Information on kiln and stove efficiencies ................................................................ 145
Annex CInformation on greenhouse gas emissions in the charcoal value chain ...................151
Annex DInformation on socio-economic characteristics of the charcoal value chain ...........161
Annex ECase studies and lessons learned ............................................................................... 167
v
TablesS1 Technical interventions for cleaner and more efficient
charcoal production and use ............................................................................ 4
1 Kiln types and efficiencies found in the literature ....................................... 27
2 Global warming potential of various greenhouse gases ............................. 38
3 CO2 emissions (only) from wood energy compared with total emissions, 2010, by region ..................................................................... 41
4 Estimated greenhouse gas emissions from charcoal production used in various studies in the literature ....................................................... 41
5 Estimates of forest area needed to meet a charcoal demand of 68 500 tonnes in Kenya, various biomass stocking rates and two levels of kiln efficiency .................................................................... 44
6 Emission factors for charcoal carbonization .................................................. 48
7 Minimum, average and maximum emission values for carbonization ........ 49
8 Average, minimum and maximum ranges of cook-stove efficiency and greenhouse gas emissions obtained from the literature ...................... 51
9 Total greenhouse gas emissions for various cooking options and bioenergy sources ............................................................................................ 52
10 Greenhouse gas emissions from various cooking options ............................ 53
11 Modelled estimates of greenhouse gas emissions in the four main steps in the charcoal value chain .................................................. 53
12 Technical interventions for cleaner and more efficient charcoal production ........................................................................................ 58
13 Resulting carbon stock emission reductions from charcoal production relative to the baseline scenario after 30 years of management ................ 60
14 Key characteristics of species selected for plantations for charcoal production ....................................................................................................... 62
15 Global warming potential over the life cycle of the quantity of charcoal briquettes, charcoal and kerosene required to cook a standard traditional meal in Kenya ............................................................ 67
16 Factors influencing the adoption of improved kilns ..................................... 69
17 Determinants of choice of fuel and stove ..................................................... 74
18 Quantity of woodfuel needed to generate energy equivalent to that produced by 1 kg of liquified petroleum gas, by conversion and combustion technology ........................................................................... 75
19 Overview of impact categories from interventions at different stages of the charcoal value chain ................................................................. 76
vi
20 Summary of scenario parameters used to model estimates of potential greenhouse gas emission reductions in a green charcoal value chain, calculated for 1 MJ end use ....................................................... 77
21 Estimated foregone annual tax revenues from charcoal licensing and taxation .................................................................................................... 84
22 Estimates of the number of people involved in charcoal production and trade from the literature ......................................................................... 85
23 Overview of the costs and benefits of efficiency improvements in forest subsectors in Kenya, assuming a certain amount of upfront investment and a carbon price of US$5.6 per tonne of CO2e ...................... 93
24 Pillars and principles of a conceptual governance framework for the charcoal sector .......................................................................................... 96
25 Potential fiscal measures and economic incentives in the charcoal value chain ...................................................................................... 102
Figures1 Framework used in this publication to demonstrate the impacts
of the current charcoal value chain and to explain the interventions needed to move towards a green charcoal value chain and sector ............ 14
2 Woodfuel production (fuelwood and charcoal combined), worldwide and by region (Africa, Asia and South America), 1961–2015 .... 19
3 Wood charcoal production, worldwide and by region (Africa, Asia and South America), 1961–2015 ................................................ 20
4 Top ten charcoal producer countries, 2015 .................................................... 20
5 Relative proportion of deforestation and degradation drivers in three world regions .................................................................................... 30
6 Deforestation caused by charcoal production, and deforestation caused by other factors, 17 countries with the highest rates of deforestation globally .................................................................................... 31
7 The extent to which woodfuel demand exceeds regrowth ......................... 32
8 Assessment stages in the life cycle of a charcoal value chain ...................... 39
9 Emissions from charcoal production worldwide and by region .................. 42
10 Examples of possible reference land uses and scenarios for charcoal production and the impact on changes in carbon stocks ............. 45
11 Schematic overview of the potential impacts of climate change on wood-energy supply ................................................................................. 47
12 Estimated carbon losses for different scenarios and underlying assumptions .................................................................................. 54
13 Estimated greenhouse gas emissions from charcoal production in hot-tail and metal container kilns in Brazil ............................................... 72
vii
14 Modelled estimates of greenhouse gas reductions in the charcoal value chain for various scenarios and underlying assumptions ................... 78
15 Cooking and lighting energy as a share of household expenditure, various countries in Africa .............................................................................. 86
16 Detailed cost distribution for artisanal, semi-industrial and industrial models of charcoal production ..................................................... 90
17 Charcoal price projections per 80–100 kg bag .............................................. 91
18 Pillars of governance that affect the charcoal value chain and required technological improvements ........................................................... 96
19 Enforcement and regulations for promoting sustainable wood energy .................................................................................................. 109
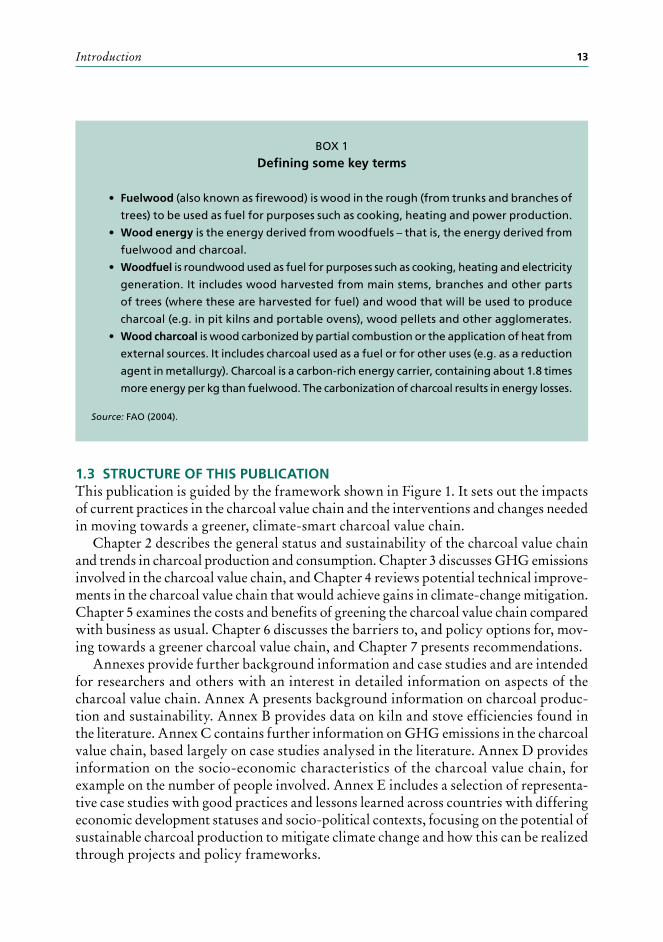
Boxes1 Defining some key terms ................................................................................ 13
2 Alternative energy sources ............................................................................. 18
3 Parameters that influence maximum annual removals in a sustainably managed forest .................................................................... 25
4 The impact of low kiln efficiencies on the amount of wood required ....... 28
5 Demonstrably renewable woody biomass and non-renewable woody biomass ................................................................................................ 46
6 Example of planning and inventory of wood extraction for charcoal production ........................................................................................ 59
7 Examples of successful forest plantation programmes ................................ 61
8 Waste residues in the United Republic of Tanzania ...................................... 64
9 Examples of trees outside forests and agroforestry practices ..................... 65
10 Case study of net present value of charcoal production .............................. 86
11 Examples where afforestation and reforestation activities have provided new income ............................................................................ 88
12 Experiences and lessons learned from charcoal bans ................................... 98
13 Policy actions for using nationally appropriate mitigation actions for a sustainable charcoal value chain ........................................................... 99
14 Greenhouse gas emission reduction targets for the wood-energy sector in Burkina Faso ........................................................... 103
15 An example of community-based forest management in woodfuel production .................................................................................... 105
16 Impact of tax evasion and corruption on the charcoal value chain ............111
viii
Foreword
In 2015, countries took decisive steps to pave the way for a better and more sustainable future by adopting the 2030 Agenda for Sustainable Development and the Paris Agreement on climate change. These bold, ambitious agreements require countries, organizations and every one of us to give more consideration to the future of our planet and to leave no one behind, particularly the poorest and most marginalized.
FAO has prioritized climate change and the implementation of the Sustainable Development Goals (SDGs) and is working closely with countries in their efforts to achieve these goals. Ensuring access to affordable, reliable, sustainable and modern energy – one of the 17 SDGs – is crucial as an estimated 3 billion people still lack access to clean fuels and technologies for cooking.
Charcoal has been an important source of energy for centuries and remains so today; projections indicate that demand will continue to increase, especially in Africa. In many countries, however, a lack of regulation means that the charcoal sector is inefficient and can have locally and nationally significant adverse impacts on forests. Globally, the woodfuel sector is a substantial emitter of greenhouse gases, estimated at up to 7 percent of total anthropogenic emissions.
Charcoal produced using sustainably managed resources and improved technologies, on the other hand, can be a low net emitter of greenhouse gases, with the potential to reduce emissions by more than 80 percent along the charcoal value chain, thereby helping to mitigate climate change. A greener charcoal value chain can also increase access to cleaner energy, reduce health risks associated with rudimentary stoves and generate sustainable income for poor rural people.
This report is both timely and urgently needed. Based on a comprehensive analysis of the latest data and empirical evidence, it sets out a transformational pathway for greening the charcoal value chain, thereby supporting sustainable livelihoods and providing energy security, especially for the world’s poor. Targeting the entire chain – sourcing, production, transport, distribution and use – is a key to success.
The report presents policy options for creating a climate-smart charcoal sector, such as developing national policy frameworks for the sustainable management of the charcoal value chain; reforming land tenure and increasing resource access to attract new investments in a greener, healthier charcoal value chain; and making the charcoal value chain a specific component of nationally determined contributions to the mitigation of climate change.
Eva Müller Director, Forestry Policy and Resources Division
ix
Acknowledgements
This publication was prepared by Jinke van Dam in collaboration with Janske van Eijck and Jolien Schure, under the overall coordination and technical guidance of Zuzhang Xia, FAO Forestry Officer (Wood Energy). The senior management team of the Forestry Policy and Resources Division, FAO Forestry Department, provided general parameters for the publication’s content and supervised its development.
Experts associated with the partner organizations in an informal contact group on wood energy made invaluable contributions to the publication, from the concept note to various drafts. Special thanks are due to the following colleagues: Christopher Martius and Rosa Maria Roman-Cuesta at the Centre for International Forestry Research; Cornelia Ehlers and Dorothea Otremba at Deutsche Gesellschaft für Internationale Zusammenarbeit; Denis Gautier and Emilien Dubiez at the French Agricultural Research Centre for International Development; George Akwah Neba at the International Union for Conservation of Nature; Henry Neufeldt, Mary Njenga and Phosiso Sola at the World Agroforestry Centre; Miyuki Iiyama at the Japan International Research Center for Agricultural Sciences; Robert Bailis at the Stockholm Environment Institute; and Jean-Yves Garnier, former head of the Energy Data Centre at the International Energy Agency.
The report benefited considerably from the inputs of the following FAO colleagues: Fritjof Boerstler, Jeffrey Campbell, Peter Csoka, Marc Dumas-Johansen, Maina Kibata, Min Kim, Andrey Kushlin, Arvydas Lebedys, Eva Müller, Mats Nordberg and Andreas Thulstrup.
Many thanks to Alastair Sarre for editing, Kate Ferrucci for graphic design and layout, and Patricia Tendi for supporting editorial production.
x
Acronyms and abbreviations
AEDE Agence pour l’Energie Domestique et l’EnvironnementAGB above-ground biomassBGB below-ground biomassCDM Clean Development Mechanismcm centimetre(s)CO carbon monoxideCO2 carbon dioxideCO2e CO2 equivalentCH4 methaneEJ exajoule(s)€ euro(s) FAO Food and Agriculture Organization of the United NationsFLEGT forest law enforcement, governance and trade GHG greenhouse gasGIZ Deutsche Gesellschaft für Internationale Zusammenarbeit Gt gigatonne(s)GWP global warming potentialha hectare(s)INDC intended nationally determined contributionKES Kenyan shilling(s)kg kilogram(s)kWh kilowatt-hour(s)LCA life-cycle assessmentLPG liquefied petroleum gasm3 cubic metre(s)MAI mean annual incrementMJ megajoule(s)Mt megatonne(s)Mtoe million tonnes of oil equivalentMW megawatt(s)MWh megawatt-hour(s)N2O nitrous oxideNAMA nationally appropriate mitigation actionNDC nationally determined contributionNMHC non-methane hydrocarbonPM particulate matter
xi
REDD+ reducing emissions from deforestation and forest degradation RVI Reboisement Villageois IndividuelSSA sub-Saharan Africat tonne(s)TJ terajoule(s)TWh terawatt-hour(s)UNCCD United Nations Convention to Combat DesertificationUNFCCC United Nations Framework Convention on Climate ChangeUS$ United States dollar(s)VERT Village Exploitant Rationnellement son TerroirXAF Central African CFA franc(s)
© IM
AG
EBR
OK
ER / A
LAM
Y
1
Executive summary
KEY POINTS• About half the wood extracted worldwide from forests is used to produce
energy, mostly for cooking and heating. Of all the wood used as fuel worldwide, about 17 percent is converted to charcoal.
• Global charcoal production is expected to continue increasing in coming decades. The charcoal sector, which is largely informal, generates income for more than 40 million people, but a lack of regulation means that it promotes inefficiency and governments forgo billions of dollars in revenue.
• An estimated 1–2.4 Gt CO2e of greenhouse gases are emitted annually in the production and use of fuelwood and charcoal, which is 2–7 percent of global anthropogenic emissions. These emissions are due largely to unsustainable forest management and inefficient charcoal manufacture and woodfuel combustion.
• The greening of the charcoal value chain has considerable potential for reducing greenhouse gas emissions on a global scale. It can be done at all stages of the value chain, especially in wood sourcing and carbonization but also in transport, distribution and end-use efficiency.
• Five actions needed for the greening of the charcoal value chain are:1. Simultaneously initiating multiple interventions for reducing greenhouse
gas emissions, targeting the entire charcoal value chain.2. Increasing the financial viability of a green charcoal value chain by
reforming tenure, increasing legal access to land and resources, providing evidence-based evaluations of the benefits of the charcoal sector for national economies, putting a fair price on wood resources, incentivizing sustainable practices, and attracting investment for a transition to a green charcoal chain.
3. Developing comprehensive national policy frameworks for the sustainable management of the charcoal value chain and integrating charcoal into wider efforts across sectors to mitigate climate change, including by making the charcoal value chain a specific component of nationally determined contributions.
4. Supporting national governments and other stakeholders in their efforts to green their charcoal value chains through research and the provision of reliable data.
5. Disseminating the lessons learned from pilot projects, success stories and research that take into account the entire charcoal value chain.
The charcoal transition2
Fuelwood and charcoal are important sources of energy for households and small industries in developing countries. More than 2.4 billion people – about one-third of the world’s population – still rely on the traditional use of woodfuel for cooking, and many small enterprises use fuelwood and charcoal as the main energy carriers for purposes such as baking, tea processing and brickmaking. An estimated 50 percent of the wood extracted from forests worldwide is used as fuelwood and charcoal.
Charcoal production in particular has risen in recent decades as demand has grown among urban populations and enterprises. Where demand is high, mainly in sub-Saharan Africa (SSA) but also in Southeast Asia and South America, unsustainable wood harvesting and charcoal production contribute to forest degradation and deforestation and to greenhouse gas (GHG) emissions along the charcoal value chain, especially when charcoal is produced using inefficient technologies. Charcoal produced using sustainably managed resources and improved technologies, however, is a low net emitter of GHGs, thereby helping mitigate climate change while also increasing access to energy and food and providing income-generating opportunities.
World leaders have affirmed the urgency of climate-change mitigation in the 2015 Paris Agreement, and many new commitments to reduce GHG emissions – expressed in nationally determined contributions (NDCs) – refer to forestry and land-use measures. Opportunities for emission reductions in the charcoal sector are not well reflected in NDCs, however, and the potential role of the charcoal value chain in mitigating climate change – and how to realize this potential – is poorly understood.
A green charcoal value chain is the efficient and sustainable sourcing, production, transport, distribution and use of charcoal, resulting in improved human well-being and social equity and reducing environmental risks and ecological scarcities. It is low-carbon, resource-efficient, produced from sustainably sourced wood, and socially inclusive.
This report provides knowledge on existing charcoal production and use, GHG emissions along the charcoal value chain, technologies for increasing the efficiency of charcoal production and use, the costs and benefits of greening the charcoal value chain, and policy options for a climate-smart charcoal sector. It assesses the potential contributions of a green charcoal value chain to climate-change mitigation and improved livelihoods with the aim of informing policy-makers and other stakeholders. Annexes present a range of data on charcoal production and use and are intended for researchers and others with an interest in detailed information on aspects of the charcoal value chain.
THE CHARCOAL VALUE CHAINThe charcoal value chain involves the collection or cutting of wood at the source (e.g. forests, woodlands, shrublands, agroforestry systems and woodlots, and from wood-processing operations), the carbonization of wood in kilns, the transportation, trade and distribution of charcoal, and consumption by households or enterprises.
The use of sustainably sourced wood for charcoal production is generally low. Most of the charcoal consumed in low-income countries is manufactured (i.e. carbonized) using simple technologies with low efficiencies (10–22 percent). On the consumption
Executive summary 3
side, the use of traditional stoves with low energy efficiency prevails. The extent to which charcoal production drives deforestation is not fully quantified and varies greatly among and within countries; it depends on the production method, the intensity of harvest and the regenerative capacity of the wood source, the availability of alternative wood sources, and the impacts of other deforestation drivers, such as agriculture.
Unsustainable charcoal production causes net GHG emissions and affects natural resources such as forests, water, biodiversity and soils. Charcoal production and consumption can have negative impacts on the respiratory health of people, but it also provides incomes, livelihoods and energy security.
GREENHOUSE GAS EMISSIONS FROM THE CHARCOAL VALUE CHAINIt is estimated that traditional wood energy (fuelwood and charcoal) emits 1–2.4 Gt of carbon dioxide equivalent (CO2e) per year, which is 2–7 percent of total anthropogenic GHG emissions; SSA accounts for one-third of GHG emissions from wood energy. The high level of uncertainty around the GHG emissions associated with wood energy reflects the wide range of underlying assumptions on wood regeneration rates and charcoal consumption.
GHG emissions are generated at various stages of the charcoal value chain, with the sustainability of wood harvesting and the efficiency of charcoal production technologies the greatest determinants of overall GHG emissions. In very inefficient operations, the emission of GHGs in charcoal production (including due to forest degradation and deforestation) can be as high as 9 kg CO2e per kg charcoal produced.
Given increasing demand for charcoal, a continuation of unsustainable charcoal production and use can be expected to exacerbate climate change, which, in turn, could affect the health and productivity of forests and woodlands and thereby reduce future wood-energy supplies in many places of the world. In the absence of realistic and renewable alternatives to charcoal in the near future, greening the charcoal value chain is essential for mitigating climate change while maintaining the access of households to renewable energy.
INTERVENTIONS IN THE CHARCOAL VALUE CHAIN TO MITIGATE CLIMATE CHANGE A greener charcoal sector can reduce GHG emissions throughout its value chain and play an important role in national low-carbon growth strategies. Seven key technical interventions can help reduce GHG emissions at various stages of the charcoal value chain (Table S1).
Wood sourcingThe sustainable production of wood almost fully avoids net GHG emissions, and replacing unsustainable wood with sustainably managed resources, therefore, can substantially reduce overall GHG emissions in the charcoal value chain. Multiple options are available, such as sustainable forest management; sustainable community-managed woodfuel plantations; integrated food and energy systems; agroforestry and
The charcoal transition4
urban forestry; and the optimal use of biomass residues and waste streams. Demand for sustainable charcoal production can provide opportunities for afforestation and reforestation. Further efficiencies can be gained by reducing charcoal waste, such as by transforming charcoal dust into briquettes.
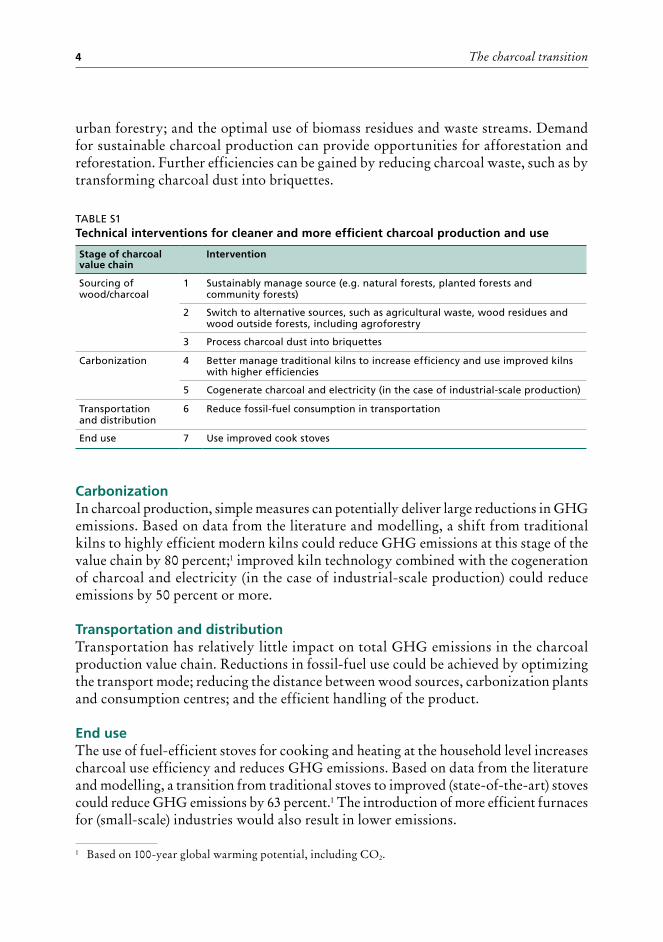
TABLE S1Technical interventions for cleaner and more efficient charcoal production and use
Stage of charcoal value chain
Intervention
Sourcing of wood/charcoal
1 Sustainably manage source (e.g. natural forests, planted forests and community forests)
2 Switch to alternative sources, such as agricultural waste, wood residues and wood outside forests, including agroforestry
3 Process charcoal dust into briquettes
Carbonization 4 Better manage traditional kilns to increase efficiency and use improved kilns with higher efficiencies
5 Cogenerate charcoal and electricity (in the case of industrial-scale production)
Transportation and distribution
6 Reduce fossil-fuel consumption in transportation
End use 7 Use improved cook stoves
CarbonizationIn charcoal production, simple measures can potentially deliver large reductions in GHG emissions. Based on data from the literature and modelling, a shift from traditional kilns to highly efficient modern kilns could reduce GHG emissions at this stage of the value chain by 80 percent;1 improved kiln technology combined with the cogeneration of charcoal and electricity (in the case of industrial-scale production) could reduce emissions by 50 percent or more.
Transportation and distributionTransportation has relatively little impact on total GHG emissions in the charcoal production value chain. Reductions in fossil-fuel use could be achieved by optimizing the transport mode; reducing the distance between wood sources, carbonization plants and consumption centres; and the efficient handling of the product.
End useThe use of fuel-efficient stoves for cooking and heating at the household level increases charcoal use efficiency and reduces GHG emissions. Based on data from the literature and modelling, a transition from traditional stoves to improved (state-of-the-art) stoves could reduce GHG emissions by 63 percent.1 The introduction of more efficient furnaces for (small-scale) industries would also result in lower emissions.
1 Based on 100-year global warming potential, including CO2.
Executive summary 5
The climate-change mitigation impacts of a greener charcoal value chain can be optimized by the simultaneous introduction of multiple interventions, and the impacts will be especially high when interventions contribute to biomass regrowth. Modelled scenarios for miombo woodlands, for example, indicate that the introduction of multiple interventions could reduce GHG emissions in the overall charcoal value chain from 2.4 kg CO2e per megajoule (MJ) end use to 0.4 kg CO2e per MJ end use, and to 0.3 kg CO2e per MJ end use when biomass regrowth is considered – a reduction of 86 percent.2
Despite this potential and the efforts made so far, the uptake of interventions to green the charcoal value chain is relatively low and largely project-based. Substantial efforts are required to create an enabling environment for the scaling up of interventions, including the introduction of favourable policies and the creation of an attractive investment climate for a green charcoal sector.
ECONOMIC COSTS AND BENEFITS OF GREENING THE CHARCOAL VALUE CHAIN The charcoal sector has considerable economic value (for example, an estimated US$650 million and US$1.6 billion annually for the United Republic of Tanzania and Kenya, respectively), and there are opportunities for generating revenues – for example through taxation and licensing fees – that could be partly reinvested to create a more sustainable charcoal value chain, including by encouraging forest restoration and sustain-able charcoal sourcing. At present, however, dedicated wood resources for sustainable charcoal production are rarely considered economically viable due to the undervaluing of resources and their consequent overharvesting and unsustainable management and inefficiencies in carbonization and end use. At the national level, the charcoal sector is characterized by lost revenue opportunities in the form of foregone taxation and licensing fees and by hidden costs associated with environmental and human-health externalities.
The financial viability of greening the charcoal value chain compared with business as usual requires that a price is placed on (currently often open-access) resources and that sufficient economic incentives are in place for sustainably managing those and other wood resources; sustainably managed forests may be too expensive when de facto open-access sources of wood are also available. The use of waste wood from timber production will become more viable as the price of charcoal increases. The change from traditional to improved kilns and the more effective management of traditional kilns requires investment but will also generate higher charcoal outputs per tonne of feedstock. The use of improved stoves for cooking and heating is most cost-effective in places where charcoal (and alternative energy) prices are high.
The greening of the charcoal sector would increase the sustainability of income for the more than 40 million people globally involved in commercial fuelwood and charcoal production. African countries could potentially reinvest US$1.5 billion–3.9 billion in
2 Based on 100-year global warming potential. Note that results are illustrative; they are based on a scenario involving many underlying assumptions and should not be used to define the climate-change mitigation impacts of different options.
The charcoal transition6
greening the charcoal value chain from annual revenues they currently forego because of the sector’s informality. Countries could also attract climate-change-related funds for avoided deforestation and GHG emissions, including by using their NDCs to provide long-term policy signals and developing pipelines of viable projects. Another less visible but important benefit of a greener charcoal sector is a reduction in the cost of health care and environmental remediation, especially in the longer term.
The transition from unsustainable to sustainable sourcing and from informal to formal institutions can impose costs on the charcoal value chain, such as those associated with sustainable resource management. The transition will require the transfer of capacity and knowledge on efficient carbonization and end-use practices and technologies. A cost–benefit analysis in Kenya, for example, estimated that a transition to efficient charcoal production would require an investment of US$15.6 million per year (excluding upfront costs). On the other hand, it would generate US$20.7 million in benefits and therefore would have an overall positive economic impact.
POLICY OPTIONS FOR A CLIMATE-SMART CHARCOAL SECTOR The charcoal value chain operates in a multilayered, multisectoral regulatory environ-ment. Appropriate government policies are required to attract the investments needed to introduce improved charcoal-production technologies at scale, within the overall context of national forest, energy and land-use planning.
Given that charcoal consumption is expected to increase in some countries in coming decades, charcoal – and its integration into development, energy, environment, land-use and food-security strategies – must be afforded high priority in national development agendas. A long-term policy vision is required to both improve the sustainability of the charcoal value chain and diversify and democratize clean-energy options to reduce pressure on forests caused by soaring charcoal demand. The coherence of charcoal policies with globally recognized principles and regimes increases the legitimacy and effectiveness of the sector and helps align it with other national efforts. Developing countries with high levels of charcoal use should consider options for greening the charcoal value chain in their NDCs and development strategies.
The greening of the charcoal value chain will require enabling policies related to incentives, benefit distribution, the sustainable management of wood resources, land-use planning, landscape management, and a green economy. Differentiated taxation can incentivize the sustainable sourcing and production of charcoal, and revenues from fees and licences can be reinvested in technological improvements. Subsidies can cover start-up costs and encourage producers and end users to transition to more efficient technologies. International financial mechanisms linked to climate-change mitigation, such as the Clean Development Mechanism and reducing emissions from deforestation and forest degradation (known as REDD+), can provide additional financial incentives.
Improved forest law enforcement and governance can help increase government revenue collection and investments in sustainable forest management and efficient wood conversion technologies. Providing local people with greater tenure security can increase their willingness and ability to invest in sustainable approaches. Transferring
Executive summary 7
responsibilities and financial and human resources to local authorities can help in the introduction of sustainable forest management and charcoal production.
Certification initiatives can guide the implementation of a sustainable charcoal value chain and help in monitoring. Policies can be put in place to encourage the involvement of private-sector actors in disseminating improved technologies and establishing marketing systems for sustainable products.
Planning and decision-making processes for charcoal governance will benefit from the participation of all stakeholders – government, the private sector, producers and consumers. Transparency in revenue streams and the accountability of all actors are crucial for optimizing the contributions of the charcoal sector to national economies and local communities. A sound institutional framework – including organizations of forest managers, tree-growers, charcoal processors and traders – is needed to coordinate initiatives to develop a sustainable charcoal value chain and to clarify the mandates of stakeholders. The development of such a framework requires strong collaboration among stakeholders, sectors and levels of government.
The reform of the charcoal value chain should encourage strong relationships among key stakeholders and should be sensitive to the risk of corruption and the exclusion of minorities. Policies for regulating and improving the value chain must ensure that measures are taken to secure and protect the energy access rights of those who lack other options.
RECOMMENDATIONS FOR GREENING THE CHARCOAL VALUE CHAIN1. Promote multiple simultaneous interventions at scale across the entire value chain
to substantially reduce GHG emissions. 2. Ensure the financial viability of a green charcoal value chain by improving tenure
arrangements and legal access to resources for growing and purchasing wood and other biomass for charcoal production, generating evidence-based assessments of the benefits of a green charcoal value chain for national economies, putting a fair price on wood resources, incentivizing sustainable practices, and attracting investments for the transition to a green charcoal value chain.
3. Develop comprehensive national policy frameworks for the sustainable management of the charcoal value chain and integrate charcoal into wider efforts across sectors to mitigate climate change, including by making the charcoal value chain a specific component of NDCs.
4. Support national governments and other stakeholders in their efforts to green the charcoal value chain by contributing to research in the following areas:• systematic life-cycle assessments of the charcoal value chain in the main
charcoal-producing countries;• systematic data on GHG emissions in the various stages of the charcoal value
chain;• the role of charcoal production in deforestation and forest degradation,
including in combination with other deforestation and forest degradation drivers in the vicinity of cities; and

The charcoal transition8
• the socio-economic and environmental outcomes and trade-offs of a green charcoal value chain at the local, subnational, national and regional levels.
5. Disseminate the lessons learned from pilot projects, success stories and research that take into account the entire charcoal value chain.
© M
IKE G
OLD
WA
TER / A
LAM
Y
11
1 Introduction
KEY POINTS• About half the wood extracted worldwide from forests is used to produce
energy, mostly for cooking and heating. Of all the wood used as fuel worldwide, about 17 percent is converted to charcoal.
• Unsustainable and inefficient charcoal production causes significant GHG emissions, and the greening of the charcoal value chain therefore has considerable potential for reducing GHG emissions on a global scale.
• This report uses a literature review, desk studies, life-cycle assessment and consultations with experts to assess the potential of a green charcoal value chain for mitigating climate change, and it makes recommendations for the attention of policy-makers and other stakeholders.
About half the wood extracted worldwide from forests is used to produce energy, mostly for cooking and heating in developing countries but also for electricity generation in industrialized countries. The share of energy use from harvested wood is as high as 90 percent in Africa and more than 60 percent in Asia. Of all the wood used as fuel worldwide, an estimated 17 percent is converted to charcoal (FAO, 2016a). Charcoal production is on the rise due to increasing demand in urban centres and by enterprises and in the absence of accessible alternative energy sources. Unsustainable wood harvest-ing and charcoal production cause forest degradation and deforestation, as well as the emission of greenhouse gases (GHGs) along the charcoal value chain (AFREA, 2011). Charcoal produced using sustainably managed resources and improved technologies, however, is a low net emitter of GHGs, thereby helping mitigate climate change while also increasing access to energy and food and providing income-generating opportunities (Iiyama et al., 2014b; Schure, Levang and Wiersum, 2014).
World leaders have confirmed the urgency of climate-change mitigation in the 2015 Paris Agreement, and many new commitments to reduce GHG emissions, expressed through nationally determined contributions (NDCs),3 refer to forestry and land-use measures. Opportunities for emission reductions in the charcoal sector are not well reflected in NDCs, however (Bervoets et al., 2016; FAO, 2016b). There is a gap in
3 At the 19th Conference of the Parties to the UNFCCC, countries were invited to begin the formulation of country-specific intended nationally determined contributions (INDCs), which were submitted to the 21st Conference of the Parties in Paris in December 2015. INDCs outline countries’ intended contributions to the goal of keeping the increase in average global temperature below 2 °C in accordance with the Paris Agreement (Bervoets et al., 2016). Many INDCs had been updated into NDCs by the end of 2016.
The charcoal transition12
understanding on the potential contributions of the charcoal value chain to climate-change mitigation and how and under what conditions this potential can be realized. Assessing the impacts on GHG emissions of improvements in the charcoal value chain, and how such improvements could be realized in the context of individual countries, is essential for informed policy development and implementation in the forest and energy sectors.
1.1 OBJECTIVE OF THIS PUBLICATIONThis publication focuses on the potential contributions of a green charcoal value chain to climate-change mitigation and improved livelihoods with the aim of informing policy-makers and other stakeholders. More specifically, the publication addresses the following questions:
• What are the impacts on climate change of the existing charcoal value chain, regionally and worldwide?
• What GHG emission reductions could be achieved by increasing the sustainability of the charcoal value chain, and how could these be delivered?
• What are the key barriers to increasing the sustainability of the charcoal value chain, and what actions are required to develop a climate-smart charcoal sector?
A green charcoal chain is the efficient and sustainable sourcing, production, transport, distribution and use of charcoal, resulting in improved human well-being and social equity and significantly reducing environmental risks and ecological scarcities. It is low-carbon, resource-efficient, produced from sustainably sourced wood, and socially inclusive.
Source: Adapted from UNEP (2010).
1.2 METHODOLOGYThis report synthesizes the results of a literature review, desk studies, a life-cycle assessment (LCA) of the charcoal value chain based on existing data, and interviews and consultations with experts, practitioners and policy-makers.
Some reference materials do not differentiate between “fuelwood” and “charcoal” and refer to “woodfuel” or “wood energy” more generally; this report, however, distinguishes between fuelwood and charcoal where data allow. The focus is on the charcoal value chain in developing countries worldwide, but most case studies and examples are derived from sub-Saharan Africa (SSA).4 Box 1 defines some of the key terms used in this report.
4 This report may refer to data for “Africa”, in conformity with the source documents cited. As a geograph-ical unit, Africa may include north African countries, where charcoal production and consumption is minimal. Most of the production and consumption of charcoal in “Africa”, therefore, may be considered to take place in SSA.
Introduction 13
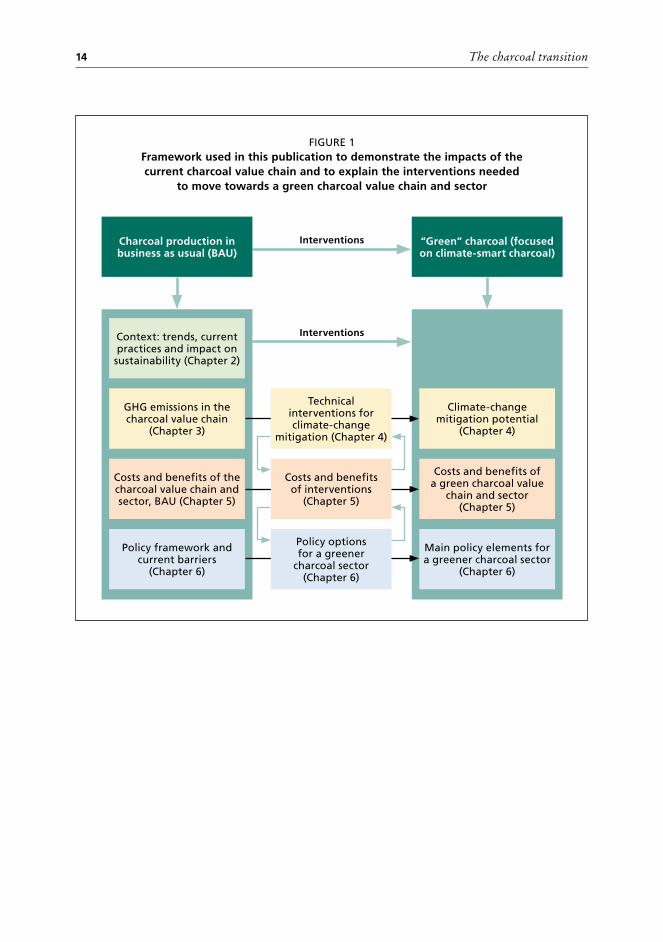
1.3 STRUCTURE OF THIS PUBLICATIONThis publication is guided by the framework shown in Figure 1. It sets out the impacts of current practices in the charcoal value chain and the interventions and changes needed in moving towards a greener, climate-smart charcoal value chain.
Chapter 2 describes the general status and sustainability of the charcoal value chain and trends in charcoal production and consumption. Chapter 3 discusses GHG emissions involved in the charcoal value chain, and Chapter 4 reviews potential technical improve-ments in the charcoal value chain that would achieve gains in climate-change mitigation. Chapter 5 examines the costs and benefits of greening the charcoal value chain compared with business as usual. Chapter 6 discusses the barriers to, and policy options for, mov-ing towards a greener charcoal value chain, and Chapter 7 presents recommendations.
Annexes provide further background information and case studies and are intended for researchers and others with an interest in detailed information on aspects of the charcoal value chain. Annex A presents background information on charcoal produc-tion and sustainability. Annex B provides data on kiln and stove efficiencies found in the literature. Annex C contains further information on GHG emissions in the charcoal value chain, based largely on case studies analysed in the literature. Annex D provides information on the socio-economic characteristics of the charcoal value chain, for example on the number of people involved. Annex E includes a selection of representa-tive case studies with good practices and lessons learned across countries with differing economic development statuses and socio-political contexts, focusing on the potential of sustainable charcoal production to mitigate climate change and how this can be realized through projects and policy frameworks.
BOX 1
Defining some key terms
• Fuelwood (also known as firewood) is wood in the rough (from trunks and branches of
trees) to be used as fuel for purposes such as cooking, heating and power production.
• Wood energy is the energy derived from woodfuels – that is, the energy derived from
fuelwood and charcoal.
• Woodfuel is roundwood used as fuel for purposes such as cooking, heating and electricity
generation. It includes wood harvested from main stems, branches and other parts
of trees (where these are harvested for fuel) and wood that will be used to produce
charcoal (e.g. in pit kilns and portable ovens), wood pellets and other agglomerates.
• Wood charcoal is wood carbonized by partial combustion or the application of heat from
external sources. It includes charcoal used as a fuel or for other uses (e.g. as a reduction
agent in metallurgy). Charcoal is a carbon-rich energy carrier, containing about 1.8 times
more energy per kg than fuelwood. The carbonization of charcoal results in energy losses.
Source: FAO (2004).
The charcoal transition14
FIGURE 1Framework used in this publication to demonstrate the impacts of the current charcoal value chain and to explain the interventions needed
to move towards a green charcoal value chain and sector
Interventions
Interventions
Charcoal production in business as usual (BAU)
Context: trends, current practices and impact on sustainability (Chapter 2)
GHG emissions in the charcoal value chain
(Chapter 3)
Costs and benefits of the charcoal value chain and sector, BAU (Chapter 5)
Policy framework and current barriers
(Chapter 6)
“Green” charcoal (focused on climate-smart charcoal)
Climate-change mitigation potential
(Chapter 4)
Costs and benefits of a green charcoal value
chain and sector (Chapter 5)
Main policy elements for a greener charcoal sector
(Chapter 6)
Technical interventions for climate-change
mitigation (Chapter 4)
Costs and benefits of interventions
(Chapter 5)
Policy options for a greener
charcoal sector (Chapter 6)
© R
EUTER
S / ALA
MY
17
2 Charcoal production practices, consumption and impacts
KEY POINTS• Global charcoal production will continue to increase in coming decades due
to population growth, poverty, urbanization and the relatively high prices of alternate energy sources for cooking.
• Africa produces 62 percent of global charcoal production, mostly in SSA. In many developing countries, particularly in SSA, wood for charcoal production is sourced mainly from natural forests and woodlands, and only a small volume is produced sustainably.
• A range of charcoal production practices and technologies exist, with differing resource-use efficiencies and implications for sustainability. Most charcoal consumed in low-income countries, however, is produced using simple technologies with low efficiency, resulting in substantial losses of wood and energy.
• In combination with land conversion for agriculture, particularly in the vicinity of urban areas, wood extraction for charcoal can be a primary cause of deforestation, especially in SSA.
• The charcoal sector in most developing countries is informal. Among other things, this means that many involved in the value chain have no negotiating power and are often exploited.
• Although generally associated with negative environmental outcomes, the charcoal sector contributes to the livelihoods and energy and food security of millions of people.
• Because unsustainable practices prevail, there exists good potential to green the charcoal value chain and thereby generate multiple benefits for local livelihoods and the environment.
2.1 GLOBAL TRENDS IN CHARCOAL PRODUCTION AND CONSUMPTION
Charcoal in the total energy mixCountries use a variety of primary energy sources (e.g. fossil fuels, wind, hydropower, solar and biomass) in different proportions to meet their energy needs, either for direct use or to produce secondary energy (e.g. electricity or liquefied petroleum gas – LPG) (Box 2). The fuel choices of end users are determined by factors such as affordability, reliability and compatibility with traditional practices; this is especially true for cooking energy.
The charcoal transition18
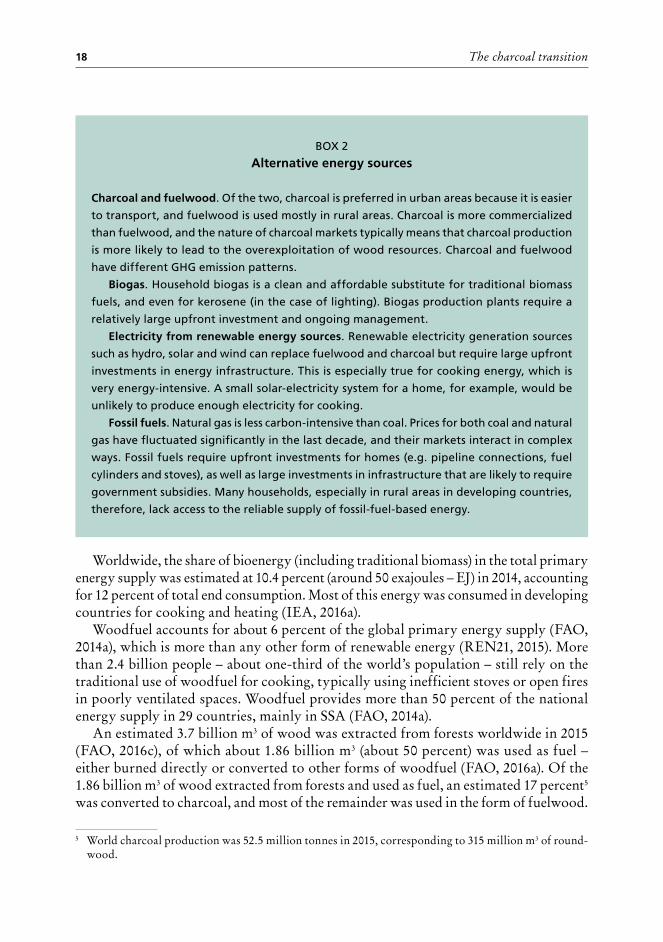
Worldwide, the share of bioenergy (including traditional biomass) in the total primary energy supply was estimated at 10.4 percent (around 50 exajoules – EJ) in 2014, accounting for 12 percent of total end consumption. Most of this energy was consumed in developing countries for cooking and heating (IEA, 2016a).
Woodfuel accounts for about 6 percent of the global primary energy supply (FAO, 2014a), which is more than any other form of renewable energy (REN21, 2015). More than 2.4 billion people – about one-third of the world’s population – still rely on the traditional use of woodfuel for cooking, typically using inefficient stoves or open fires in poorly ventilated spaces. Woodfuel provides more than 50 percent of the national energy supply in 29 countries, mainly in SSA (FAO, 2014a).
An estimated 3.7 billion m3 of wood was extracted from forests worldwide in 2015 (FAO, 2016c), of which about 1.86 billion m3 (about 50 percent) was used as fuel – either burned directly or converted to other forms of woodfuel (FAO, 2016a). Of the 1.86 billion m3 of wood extracted from forests and used as fuel, an estimated 17 percent5
was converted to charcoal, and most of the remainder was used in the form of fuelwood.
BOX 2
Alternative energy sources
Charcoal and fuelwood. Of the two, charcoal is preferred in urban areas because it is easier
to transport, and fuelwood is used mostly in rural areas. Charcoal is more commercialized
than fuelwood, and the nature of charcoal markets typically means that charcoal production
is more likely to lead to the overexploitation of wood resources. Charcoal and fuelwood
have different GHG emission patterns.
Biogas. Household biogas is a clean and affordable substitute for traditional biomass
fuels, and even for kerosene (in the case of lighting). Biogas production plants require a
relatively large upfront investment and ongoing management.
Electricity from renewable energy sources. Renewable electricity generation sources
such as hydro, solar and wind can replace fuelwood and charcoal but require large upfront
investments in energy infrastructure. This is especially true for cooking energy, which is
very energy-intensive. A small solar-electricity system for a home, for example, would be
unlikely to produce enough electricity for cooking.
Fossil fuels. Natural gas is less carbon-intensive than coal. Prices for both coal and natural
gas have fluctuated significantly in the last decade, and their markets interact in complex
ways. Fossil fuels require upfront investments for homes (e.g. pipeline connections, fuel
cylinders and stoves), as well as large investments in infrastructure that are likely to require
government subsidies. Many households, especially in rural areas in developing countries,
therefore, lack access to the reliable supply of fossil-fuel-based energy.
5 World charcoal production was 52.5 million tonnes in 2015, corresponding to 315 million m3 of round-wood.
Charcoal production practices, consumption and impacts 19
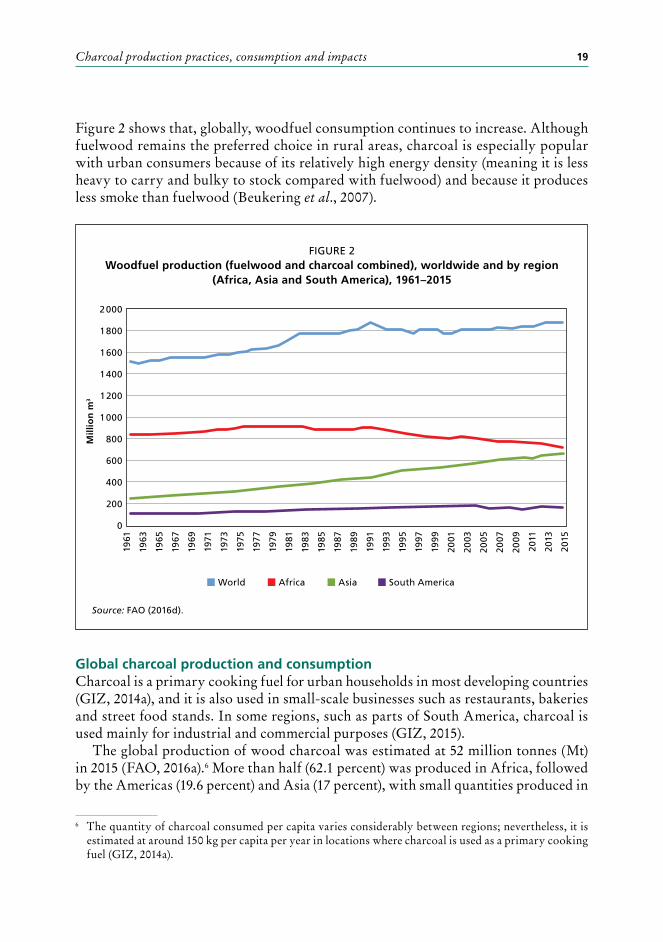
Figure 2 shows that, globally, woodfuel consumption continues to increase. Although fuelwood remains the preferred choice in rural areas, charcoal is especially popular with urban consumers because of its relatively high energy density (meaning it is less heavy to carry and bulky to stock compared with fuelwood) and because it produces less smoke than fuelwood (Beukering et al., 2007).
Global charcoal production and consumptionCharcoal is a primary cooking fuel for urban households in most developing countries (GIZ, 2014a), and it is also used in small-scale businesses such as restaurants, bakeries and street food stands. In some regions, such as parts of South America, charcoal is used mainly for industrial and commercial purposes (GIZ, 2015).
The global production of wood charcoal was estimated at 52 million tonnes (Mt) in 2015 (FAO, 2016a).6 More than half (62.1 percent) was produced in Africa, followed by the Americas (19.6 percent) and Asia (17 percent), with small quantities produced in
FIGURE 2Woodfuel production (fuelwood and charcoal combined), worldwide and by region
(Africa, Asia and South America), 1961–2015
Source: FAO (2016d).
6 The quantity of charcoal consumed per capita varies considerably between regions; nevertheless, it is estimated at around 150 kg per capita per year in locations where charcoal is used as a primary cooking fuel (GIZ, 2014a).
0
2 000
1 800
1 400
1 600
1 000
800
600
400
200
1961
1965
1975
1985
1995
1971
1981
1991
2001
2013
2005
2009
1963
1969
1979
1989
1999
1967
1977
1987
1997
1973
1983
1993
2003
2015
2007
2011
1 200
World AsiaAfrica South America
Mill
ion
m3
Xia Zuzhang
Text Box
Asia
Xia Zuzhang
Text Box
Africa
Xia Zuzhang
Text Box
World
Xia Zuzhang
Text Box
South Ameria
The charcoal transition20
FIGURE 3Wood charcoal production, worldwide and by region (Africa, Asia and South America),
1961–2015
FIGURE 4Top ten charcoal producer countries, 2015
Source: FAO (2016a).
Source: FAO (2016d).
World AsiaAfrica South America
0
60
50
30
40
10
1961
1965
1975
1985
1995
1971
1981
1991
2001
2013
2005
2009
1963
1969
1979
1989
1999
1967
1977
1987
1997
1973
1983
1993
2003
2015
2007
2011
20Mill
ion
to
nn
es
0
6
7
5
3
4
1
2Mill
ion
to
nn
es
Bra
zil
Nig
eria
Eth
iop
ia
Ind
ia
Dem
ocr
atic
R
epu
blic
of
the
Co
ng
o
Gh
ana
Un
ited
Rep
ub
lic
of
Tan
zan
ia
Ch
ina
Mad
agas
car
Thai
lan
d
Charcoal production practices, consumption and impacts 21
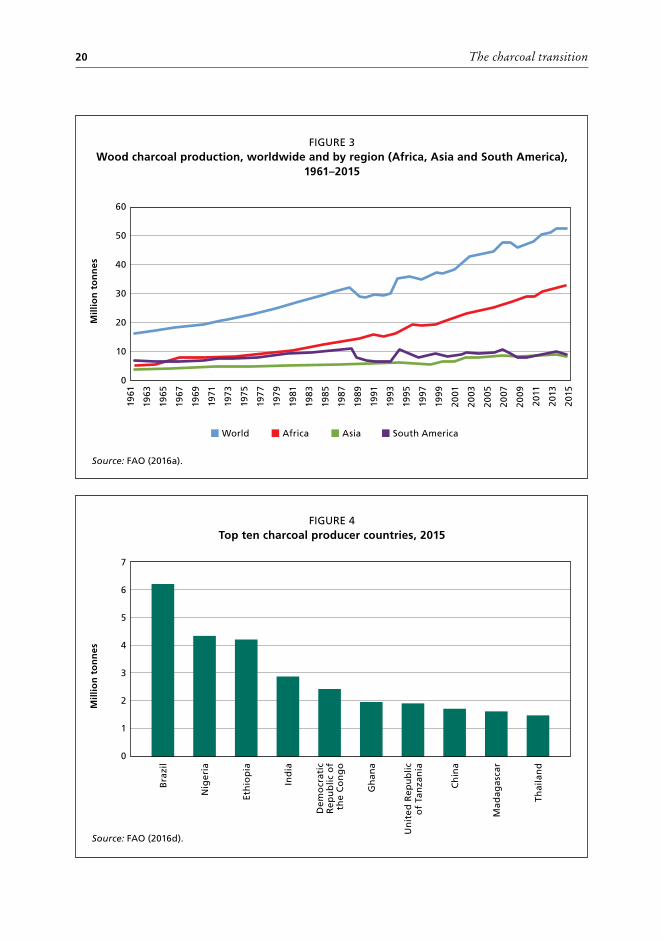
Europe (1.2 percent) and Oceania (0.1 percent) (FAO, 2016d). FAO data indicate a clear trend of increasing global charcoal production – production increased by 19 percent in the ten years to 2015 and by 46 percent in the last 20 years (FAO, 2016a); most of the increase was in Africa (Figure 3). In 2015, the world’s top ten charcoal-producing countries were (in descending order) Brazil, Nigeria, Ethiopia, India, the Democratic Republic of the Congo, Ghana, the United Republic of Tanzania, China, Madagascar and Thailand (Figure 4).
The demand for charcoal is expected to continue to grow in coming decades, especially in Africa. This continued growth is driven by the triple effect of population growth, urbanization (including changes in housing and habits), and the relative prices of alternative energy sources for cooking and heating. The lack of available, accessible or affordable alternative fuels, especially in low-income countries, contributes to a dependence on charcoal (GIZ, 2014a). The degree and intensity of dependence, and of drivers of this, vary regionally, as discussed below.
Regional trends Africa. Primary energy consumption in Africa was 739 million tonnes of oil equivalent (Mtoe) in 2012, of which north African countries accounted for 23 percent. Energy demand in SSA has increased by 50 percent since 2000 (to 570 Mtoe in 2012) but still accounts for only 4 percent of the world total (IEA, 2014).
Bioenergy is dominant in the energy mix in SSA, contributing more than 60 percent of total energy use. Coal is the second-largest component after bioenergy, attributable largely to South Africa.7 Nigeria is the largest consumer of natural gas, although this source represents just 9 percent of that country’s domestic demand. Gabon and Côte d’Ivoire rely more heavily on gas but consume smaller absolute volumes (IEA, 2014). The consumption of LPG in Africa is highly concentrated in north African countries (GIZ, 2014a).
Overall, modern renewables (i.e. hydro, solar, wind, geothermal and modern bioenergy) account for less than 2 percent of the SSA energy mix, although the percentage is significantly higher in some countries (IEA, 2014). Animal dung plays a minor role in the energy mix in SSA but is locally important in Ethiopia, Lesotho, Niger and Senegal. The share of biogas in the energy mix is still very low in SSA.
Two-thirds of all households in Africa rely on woodfuel (largely involving the traditional use of biomass), and wood energy accounts for 27 percent of the continent’s total primary energy supply (FAO, 2014). In several SSA countries, wood energy comprises 90 percent of the household energy mix (DIE, 2016). Of all regions worldwide, SSA has the highest per-capita woodfuel consumption (Bervoets et al., 2016), at 0.69 m3 per year (in 2011), compared with 0.27 m3 per year worldwide (Iiyama et al., 2014b).
Africa produced 32.4 Mt of charcoal in 2015 (62 percent of global world production), 42 percent of which was in eastern Africa, 32 percent in western Africa, 12.2 percent in central Africa, 9.8 percent in northern Africa and 3.4 percent in southern Africa (FAO, 2016a). The production of both charcoal and fuelwood is increasing steadily in Africa
7 Coal accounts for around 70 percent of primary consumption in South Africa (IEA, 2014).
The charcoal transition22
(FAO, 2016d). About 20 percent of the total wood energy harvest is processed into charcoal before final consumption; in some countries, the share of primary wood energy offtake converted to charcoal could be as high as 40–50 percent (Bailis et al., 2004).
In addition to population growth, rapid urbanization is driving charcoal demand (Ghilardi, Mwampamba and Dutt, 2013), with most urban residents in SSA using charcoal when available; for example, 95 percent of Liberia’s urban population uses charcoal (Jones, 2015). In the United Republic of Tanzania, about 85 percent of the urban population relies on charcoal for household cooking or as an energy input to small and medium-sized enterprises (GCF, 2014). Dar es Salaam, the United Republic of Tanzania’s largest city, accounted for more than 50 percent of all charcoal consumed in the country at the end of last century (Beukering et al., 2007).8 Two types of urban household that use charcoal as the primary cooking fuel can be distinguished in SSA: the urban charcoal-dependent poor; and middle-to-high-income charcoal users (World Bank, 2014). Uncertainties around the availability of, and the high cost of, LPG in Uganda, for example, mean that many better-off urban households use charcoal cook stoves as back-ups (UNDP, 2013).
Charcoal consumption outpaced population growth in SSA in 1961–2014 (Bailis et al., 2016). A survey in Kenya estimated that national charcoal consumption grew by 5 percent per year in 2004–2013, which was higher than the rate of urbanization (Iiyama et al., 2014a) and the overall rate of population growth (2.7 percent) over the same period (Iiyama et al., 2013). Charcoal consumption in Uganda in 2013 increased at close to the rate of urban growth of 6 percent per year (Ekeh, Fangmeier and Müller, 2014). In Dar es Salaam, United Republic of Tanzania, it was observed that a 1 percent increase in urbanization could lead to an increase of up to 14 percent in charcoal consumption (Hosier and Kipondya, 1993). GIZ (2014a) estimated that 4–10 percent of consumers in SSA switch from fuelwood to charcoal per year.
Charcoal use has increased substantially in Côte d’Ivoire in recent years due to urbanization and a decrease in subsidies for LPG (UNDP, 2014a).
Charcoal consumption is expected to grow in SSA in coming decades, especially given that the percentage of Africans living in urban areas is projected to grow from 36 percent in 2010 to 50 percent by 2030 (World Bank, 2014). IEA (2010) predicted that the number of people in SSA relying on traditional uses of biomass for energy would increase to 918 million by 2030. Charcoal demand in Africa is expected to grow at a higher rate than fuelwood demand, almost doubling by 2030 (compared with 2010), with a projected annual growth of 3 percent (GEF, 2013).
Asia. Of the world’s regions, Asia is the largest producer and consumer of coal, led by China and India. Southeast Asia’s energy consumption has increased rapidly, from 386 Mtoe in 2000 to 594 Mtoe in 2013, with fossil fuels meeting about three-quarters of this (IEA, 2015). Nevertheless, modern renewables such as hydro, geothermal, wind
8 Dar es Salaam used 471 000 tonnes of charcoal per year in 1997–2000, and in Mozambique the urban area of Maputo used about 130 000 tonnes of charcoal per year. Kampala, Uganda, has been reported as consuming 200 000–230 000 tonnes of charcoal per year (Seidel, 2008).
Charcoal production practices, consumption and impacts 23
and solar are making inroads into Asia’s energy mix (IEA, 2015). China’s domestic biogas programme, for example, had reached around 100 million people by 2012, supplying one-quarter of rural households with biogas digesters (Xia, 2013). IEA (2015) predicted, however, that the overall contribution of renewables to the total energy mix in Southeast Asia would decrease slightly to 2040 due to the decreasing traditional use of biomass.
Asia has experienced a 19 percent decrease in fuelwood production since 1990, which, among other factors, can be attributed to increased income and urbanization and greater access to alternative energy sources (FAO, 2009). Annual charcoal production in the region increased by 56 percent from 1990 to 2015, reaching 8.8 Mt. In Asia, India, China, Thailand, Indonesia and the Philippines are the major charcoal producers, with charcoal production increasing in recent years in all these countries except China (FAO, 2016d). Charcoal is mostly used in Asia for cooking by small food vendors and by households in urban and peri-urban areas.
Latin America. Fossil fuels comprised around 74 percent to primary energy needs in Latin America in 2010, with oil contributing 40 percent and natural gas 30 percent. Hydroelectricity contributed 8 percent, other non-fossil fuels such as wind and solar 4 percent, and wood about 7 percent (IADB, 2012).
Charcoal production is stable in Latin America, although there are strong short-term fluctuations. The region produced 8.9 Mt of charcoal in 2015 (FAO, 2016d). Brazil is the world’s largest producer of charcoal, producing 6.2 Mt in 2015, which was 12 percent of global production (FAO, 2016d).
Latin America is second to Africa in total and per-capita charcoal use (FAO, 2010). The region’s charcoal consumption patterns differ from those in Africa, however, with industries consuming a large proportion (Bailis et al., 2013). In Brazil, more than 90 percent of wood-based charcoal is used in the industrial sector, with the metallurgical industry consuming more than 80 percent (GIZ, 2015); fluctuations in charcoal demand in the metallurgical industry, therefore, have major impacts on the region’s charcoal production. In other countries in Latin America, charcoal is mostly used in the food industry and by households.
2.2 PRODUCTION PRACTICES AND TECHNOLOGIES IN THE CHARCOAL VALUE CHAINThe charcoal value chain involves the collection or cutting of wood at the source (e.g. forests, woodlands, shrublands, agroforestry systems and woodlots, or from wood-processing operations), the carbonization of wood in kilns, the distribution and trade of charcoal, and consumption by households or enterprises. Numerous actors are involved directly in the charcoal value chain at various stages: resource owners, wood collectors, charcoal producers, transporters and traders (wholesalers and retailers), consumers and end users. At each stage in the value chain, the capacity and willingness of actors to adopt new management practices and technologies have implications for sustainability.
The charcoal transition24
Sourcing of raw materials Woodfuel can be produced in a wide range of forest and agricultural systems, including tree plantations, agroforestry, trees outside forests and natural forests (GIZ, 2015). The manner in which wood is produced for energy depends on climatic conditions, vegeta-tion cover, local demand, infrastructure, the available workforce and its management skills, and, crucially, land ownership and land-use rights.
Of the estimated 8 million hectares of woodfuel plantations worldwide, 6.7 million hectares are in Asia, mostly China and India. In Latin America, Brazil is increasingly turning to eucalypt plantations to meet its demand for industrial charcoal (GIZ, 2015).
In SSA, less than 5 percent of woodfuel comes from dedicated planted areas (Gazull and Gautier, 2015). Rwanda – where almost all wood for charcoal comes from woodlots in smallholder plots – is an exceptional case: it is claimed that virtually no illegal charcoal production activities affecting natural forests occur in the country (Drigo et al., 2013; World Bank, 2012a).
In SSA, the bulk of woodfuel is extracted from uncontrolled and unmanaged natural forests and woodlands (Gazull and Gautier, 2015), in which natural regeneration is the main source of recovery (Chidumayo and Gumbo, 2013). Wood harvesting for charcoal production in natural forests and woodlands occurs in the region in the following main ways (AFREA, 2011; Hofstad, Kohlin and Namaalwa, 2009):
• when woody stands are converted to other land uses (e.g. unreserved natural forests or village woodlands are cleared for agriculture);
• when wood is removed specifically for charcoal production (e.g. from woodlands on village land); and
• as a by-product of wood extraction for other purposes, such as timber production.Treefelling for charcoal production in SSA varies along a continuum, from clearfelling
to selective cutting (Chidumayo and Gumbo, 2013). In clearfelling, almost all species are used. In eastern and southern Africa, clearfelling – at least at small spatial scales – for charcoal production appears to be more prevalent than selective cutting. In Mozambique, charcoal production in dry forests is characterized by a clearfelling system because almost all species are used (Chidumayo and Gumbo, 2013). Beukering et al. (2007) noted clearfelling in the United Republic of Tanzania, mainly for agricultural purposes.
Swami, Teixeira and Lehmann (2009) concluded that, in the Brazilian Amazon, there was no selection of species for charcoal production; rather, it was a by-product of agricultural clearing (Chidumayo and Gumbo, 2013).
In selective cutting systems, charcoal producers usually prefer the large-scale felling of hardwood species, which provide charcoal of good quality with high calorific value (Kattel, 2015; Iiyama et al., 2014b). In African drylands, acacias, for example, are considered to produce good-quality charcoal (Oduor, Ngugi and Gathui, 2012)9 and are widely used for charcoal production due to their availability (KFS, 2013). In Burkina Faso and Togo, 50–76 percent of the biomass is removed in selective cutting for charcoal
9 For example, acacia charcoal has a caloric value of 8 000 kcal per kg compared with 6 900 and 6 500–7 000 kcal per kg for bamboo and teak charcoal, respectively (Friederich, 2016).
Charcoal production practices, consumption and impacts 25
(Chidumayo and Gumbo, 2013). Charcoal production in Uganda and the United Republic of Tanzania is characterized by selective harvesting systems based on size and species (Shively et al., 2010; Namaalwa, Hofstad and Sankhayan, 2009). Where hardwood species are not readily available or accessible, other tree species with lower calorific values are also used for carbonization (Beukering et al., 2007); charcoal made from softwood species is mostly considered to be of inferior quality, however.
Trees used for charcoal production in SSA are cut with axes, machetes or chainsaws, often by “stumping” that leaves behind the basal portion of the trunk. These are generally large trees (diameter at breast height greater than 20 cm), thereby enabling charcoal producers to build charcoal kilns with one or two trees and reducing the wood transportation effort. When insufficient large-diameter trees are available, smaller trees (diameter at breast height greater than 4 cm) can be used, and small branches (less than 2 cm in diameter) can be used as fuel for kilns and as kiln spacers and fuelwood (Okello, O’Conner and Young, 2001).
Charcoal can be considered a main product when the wood of a tree is used primarily for charcoal production. It can be considered a by-product when the wood is produced primarily as part of a clearing process for agricultural production (for example) or for timber production. Chapter 3 addresses the implications for GHG emissions of clearfelling for charcoal, and the underlying drivers of this.
The volume of wood that can be removed sustainably from forests and woodlands (also known as the mean annual increment – MAI; Box 3) depends on, among other things, the harvesting method used, the time between harvests, and the fraction of biomass removed during harvesting. In general, the quantity of wood used for charcoal production obtained from sustainably managed sources is still low in SSA, and harvesting is often opportunistic rather than based on long-term management plans (Bailis et al., 2013; see below).
BOX 3
Parameters that influence maximum annual removals in a sustainably managed forest
Regeneration is an important parameter in determining the area of forest needed to meet
charcoal demand. Mwampamba (2007) suggested that the volume of woody biomass removed
in harvests can be regrown in as little as 15 years in the United Republic of Tanzania, depend-
ing on soils, climate and other factors and whether regeneration is given an opportunity
to occur. The recovery periods for forests and woodlands in various African countries cited
in the literature range from 9 to 30 years. Often, however, the recovery period required
is extended by heavy grazing and uncontrolled burning (Chidumayo and Gumbo, 2013).
The rate of forest regeneration on kiln sites following charcoal production differs from
that of surrounding areas, with the impacts of soil digging and extreme heat associated
with kilns potentially delaying forest recovery for decades; because of the very slow rate
Box 3 continues on next page
The charcoal transition26
After treefelling, the trunk and main branches are further cut into appropriately sized logs and piled to form a kiln for carbonization into charcoal. Small-sized canopy branches are rarely used in charcoal production, resulting in large amounts of wood waste on sites. When the wood has been cut and collected, it is often laid out in the sun to reduce the moisture content from around 50 percent to 18–20 percent. When demand is high, however, charcoal-makers often omit this step, resulting in a loss of efficiency in the process.
CarbonizationCarbonization is initiated by heating a pile of wood under low oxygen conditions in a closed space, such as a kiln, with the limited supply of air triggering endothermic and exothermic reactions. High temperatures induce the absorption of heat, which leads to the decomposition of biomass, separating it into volatile gases, vapour and solid char. The charcoal production efficiency of a kiln is typically defined as the ratio (expressed as a percentage) of charcoal produced to all wood inputs on a dry-weight basis (also known as the wood-to-charcoal conversion rate). Carbon yield10 is the mass of carbon in the charcoal relative to the initial mass of carbon in the wood, disregarding energy inputs in the carbonization process. The efficiency of carbonization and the quality of the charcoal are dependent on factors such as (GIZ, 2014a; KFS, 2013):
• the type of kiln and its specifications – whether open-pit, earthen or steel cylinder, or retort;
• the moisture content of the wood. In traditional carbonization processes, a certain among of high-quality wood is burned to evaporate water from the charcoal wood, but the drier the biomass, the less energy required to do this;
of regeneration, deforestation on kiln sites can be regarded as permanent (Chidumayo and
Gumbo, 2013). Kiln sites, however, usually comprise only a small fraction of the harvested
area: Chidumayo and Gumbo (2013) reported it at 5 percent of the harvested area in miombo
woodlands, but this would vary considerably depending on forest type and other factors.
The mean annual increment (MAI) is the average annual rate of wood or biomass
growth over a growth cycle of a forest; its value depends on species, site productivity and
the management regime (Makundi and Sathaye, 2004). Harvesting at a rate that exceeds
the MAI will, over time, lead to forest degradation and ultimately deforestation. Malimbwi
et al. (undated) noted a highly variable MAI among miombo ecosystems. MAIs in Africa cited
in the literature are in the range of 0.04–3.15 tonnes per hectare for natural vegetation;
4–10 tonnes per hectare in agroforestry systems; and 3.3–15 tonnes per hectare in plantations.
Box 3 continued
10 High kiln temperatures or long residence times yield charcoal with a higher fraction of fixed carbon and lower content of volatile matter, which lowers the mass of the product but does not necessarily reduce the thermodynamic efficiency of the process. Thus, conversion efficiencies are hard to interpret without information about the extent of carbonization (carbon yield) (Bailis, 2009).
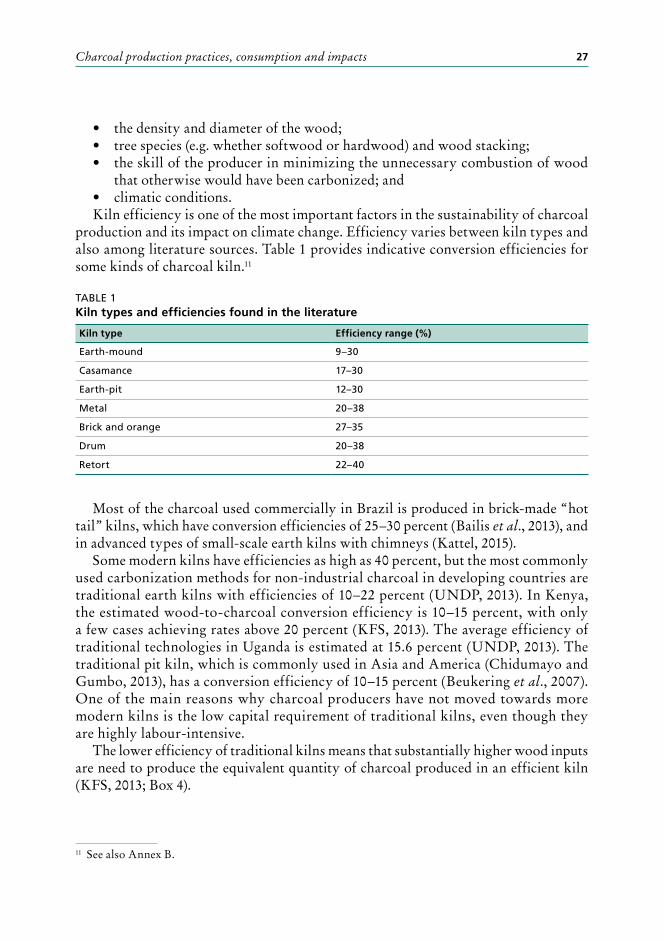
Charcoal production practices, consumption and impacts 27
• the density and diameter of the wood;• tree species (e.g. whether softwood or hardwood) and wood stacking;• the skill of the producer in minimizing the unnecessary combustion of wood
that otherwise would have been carbonized; and• climatic conditions.Kiln efficiency is one of the most important factors in the sustainability of charcoal
production and its impact on climate change. Efficiency varies between kiln types and also among literature sources. Table 1 provides indicative conversion efficiencies for some kinds of charcoal kiln.11
TABLE 1Kiln types and efficiencies found in the literature
Kiln type Efficiency range (%)
Earth-mound 9–30
Casamance 17–30
Earth-pit 12–30
Metal 20–38
Brick and orange 27–35
Drum 20–38
Retort 22–40
Most of the charcoal used commercially in Brazil is produced in brick-made “hot tail” kilns, which have conversion efficiencies of 25–30 percent (Bailis et al., 2013), and in advanced types of small-scale earth kilns with chimneys (Kattel, 2015).
Some modern kilns have efficiencies as high as 40 percent, but the most commonly used carbonization methods for non-industrial charcoal in developing countries are traditional earth kilns with efficiencies of 10–22 percent (UNDP, 2013). In Kenya, the estimated wood-to-charcoal conversion efficiency is 10–15 percent, with only a few cases achieving rates above 20 percent (KFS, 2013). The average efficiency of traditional technologies in Uganda is estimated at 15.6 percent (UNDP, 2013). The traditional pit kiln, which is commonly used in Asia and America (Chidumayo and Gumbo, 2013), has a conversion efficiency of 10–15 percent (Beukering et al., 2007). One of the main reasons why charcoal producers have not moved towards more modern kilns is the low capital requirement of traditional kilns, even though they are highly labour-intensive.
The lower efficiency of traditional kilns means that substantially higher wood inputs are need to produce the equivalent quantity of charcoal produced in an efficient kiln (KFS, 2013; Box 4).
11 See also Annex B.
The charcoal transition28
Transport and distributionWhen the charcoal has cooled after the carbonization process, it is packed into bags and transported to local and regional markets, where it is sold to households and businesses. Market channels for urban supply vary from direct sales by producers to consumers to indirect chains involving intermediaries or wholesalers and retailers, who then sell to consumers.
Because charcoal is produced in rural areas but mainly used in cities, transport is an essential component of the value chain. Although transportation distances vary by location, they are generally increasing as nearby forests are depleted (Schure, Levang and Wiersum, 2014). For example, the outer limit of charcoal production around Dar es Salaam in the United Republic of Tanzania increased by 2 km per year between 1991 and 2005 (Sjølie, 2012).
The bulk of charcoal is transported by truck; for shorter distances, however, animals, bicycles and push-carts may be used,12 and water-based transport might be employed where the necessary natural features and infrastructure exist (Seidel, 2008). As transportation distances increase, transporters tend to change their means, for example from bicycles to old pick-up trucks, to minibuses.
Charcoal losses in the transportation and distribution stages of the value chain can be significant (Bailis, Ezzati and Kammen, 2005a). In Kenya, charcoal dust comprises 10–15 percent of charcoal in the supply chain; it is mainly found at selling sites where it is unloaded and handled (Mugo et al., 2007). UNDP (2013) identified a loss of charcoal in the form of charcoal dust in Uganda of 5–15 percent at production sites and 5–20 percent at retail areas due to transportation and improper storage; Rousset et al. (2011) noted that sometimes more than 20 percent (by weight) of charcoal is lost in Brazil.
BOX 4
The impact of low kiln efficiencies on the amount of wood required
Some modern kilns require only 3 kg of wood to produce 1 kg of charcoal, whereas a tradi-
tional kiln might require up to 12 kg. Also, to produce 1 kg of charcoal with a specific energy
content of 30 MJ per kg, 3.3–10 kg of fuelwood are required, which would otherwise have a
total energy content of 53–160 MJ per kg (when burning wood directly as fuel). Therefore,
by using charcoal instead of fuelwood, up to six times the energy contained in the original
fuelwood may have been lost (GIZ, 2014a), thus increasing pressure on forests (Sjølie, 2012).
12 A survey of charcoal transporters in Nairobi County, Kenya, showed that 10 percent used bicycles, 30 percent used carts and 70 used lorries or canters (KFS, 2013). In the United Republic of Tanzania, almost all charcoal is transported to the main cities by truck or bicycle. In Dar es Salaam, trucks transport more than 80 percent of the daily charcoal flow, and bicycles account for 10 percent (Beukering et al., 2007).
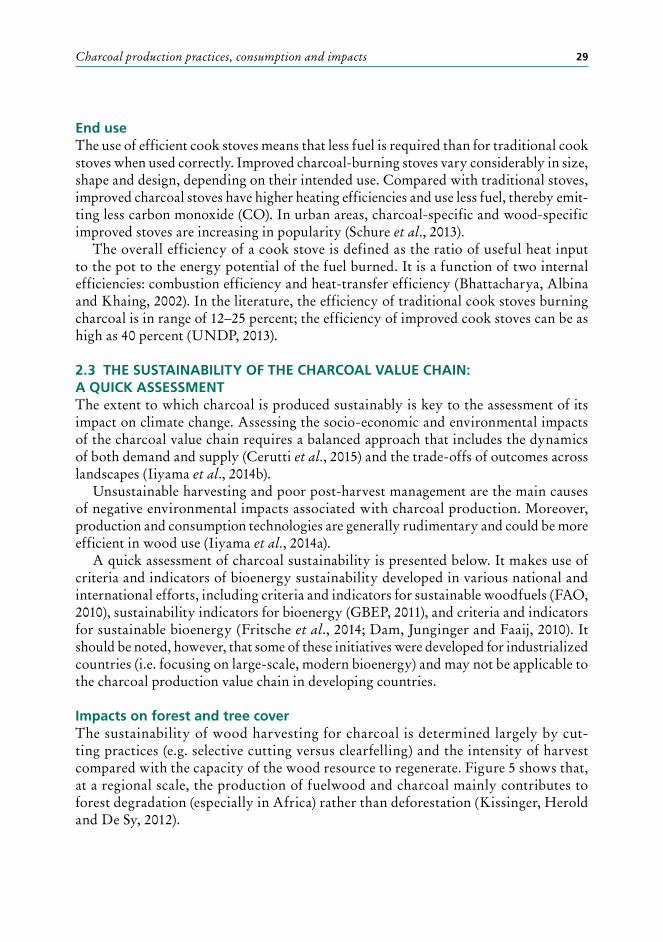
Charcoal production practices, consumption and impacts 29
End useThe use of efficient cook stoves means that less fuel is required than for traditional cook stoves when used correctly. Improved charcoal-burning stoves vary considerably in size, shape and design, depending on their intended use. Compared with traditional stoves, improved charcoal stoves have higher heating efficiencies and use less fuel, thereby emit-ting less carbon monoxide (CO). In urban areas, charcoal-specific and wood-specific improved stoves are increasing in popularity (Schure et al., 2013).
The overall efficiency of a cook stove is defined as the ratio of useful heat input to the pot to the energy potential of the fuel burned. It is a function of two internal efficiencies: combustion efficiency and heat-transfer efficiency (Bhattacharya, Albina and Khaing, 2002). In the literature, the efficiency of traditional cook stoves burning charcoal is in range of 12–25 percent; the efficiency of improved cook stoves can be as high as 40 percent (UNDP, 2013).
2.3 THE SUSTAINABILITY OF THE CHARCOAL VALUE CHAIN: A QUICK ASSESSMENT The extent to which charcoal is produced sustainably is key to the assessment of its impact on climate change. Assessing the socio-economic and environmental impacts of the charcoal value chain requires a balanced approach that includes the dynamics of both demand and supply (Cerutti et al., 2015) and the trade-offs of outcomes across landscapes (Iiyama et al., 2014b).
Unsustainable harvesting and poor post-harvest management are the main causes of negative environmental impacts associated with charcoal production. Moreover, production and consumption technologies are generally rudimentary and could be more efficient in wood use (Iiyama et al., 2014a).
A quick assessment of charcoal sustainability is presented below. It makes use of criteria and indicators of bioenergy sustainability developed in various national and international efforts, including criteria and indicators for sustainable woodfuels (FAO, 2010), sustainability indicators for bioenergy (GBEP, 2011), and criteria and indicators for sustainable bioenergy (Fritsche et al., 2014; Dam, Junginger and Faaij, 2010). It should be noted, however, that some of these initiatives were developed for industrialized countries (i.e. focusing on large-scale, modern bioenergy) and may not be applicable to the charcoal production value chain in developing countries.
Impacts on forest and tree cover The sustainability of wood harvesting for charcoal is determined largely by cut-ting practices (e.g. selective cutting versus clearfelling) and the intensity of harvest compared with the capacity of the wood resource to regenerate. Figure 5 shows that, at a regional scale, the production of fuelwood and charcoal mainly contributes to forest degradation (especially in Africa) rather than deforestation (Kissinger, Herold and De Sy, 2012).
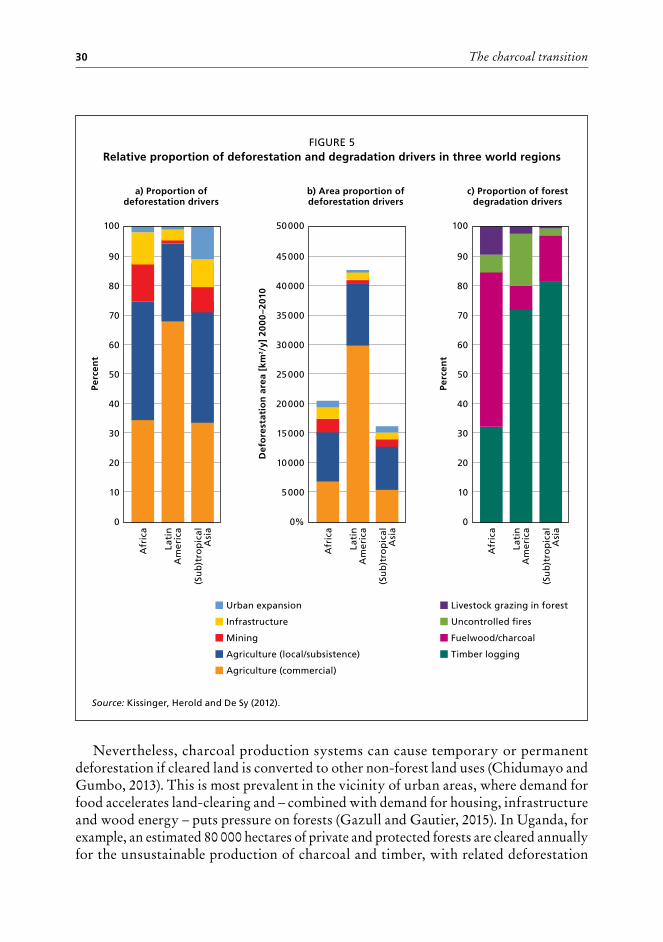
The charcoal transition30
Nevertheless, charcoal production systems can cause temporary or permanent deforestation if cleared land is converted to other non-forest land uses (Chidumayo and Gumbo, 2013). This is most prevalent in the vicinity of urban areas, where demand for food accelerates land-clearing and – combined with demand for housing, infrastructure and wood energy – puts pressure on forests (Gazull and Gautier, 2015). In Uganda, for example, an estimated 80 000 hectares of private and protected forests are cleared annually for the unsustainable production of charcoal and timber, with related deforestation
FIGURE 5Relative proportion of deforestation and degradation drivers in three world regions
Source: Kissinger, Herold and De Sy (2012).
0 00%
60 6030 000
70 7035 000
80 8040 000
90 9045 000
100 10050 000
50 5025 000
30 3015 000
40 4020 000
10 105 000
20 2010 000
Perc
ent
Perc
ent
Def
ore
stat
ion
are
a [k
m2 /
y] 2
00
0–2
010
Afr
ica
Afr
ica
Afr
ica
Lati
n
Am
eric
a
Lati
n
Am
eric
a
Lati
n
Am
eric
a
(Su
b)t
rop
ical
A
sia
(Su
b)t
rop
ical
A
sia
(Su
b)t
rop
ical
A
sia
Urban expansion
Mining
Agriculture (commercial)
Infrastructure
Agriculture (local/subsistence)
Livestock grazing in forest
Fuelwood/charcoal
Uncontrolled fires
Timber logging
a) Proportion of deforestation drivers
b) Area proportion of deforestation drivers
c) Proportion of forest degradation drivers
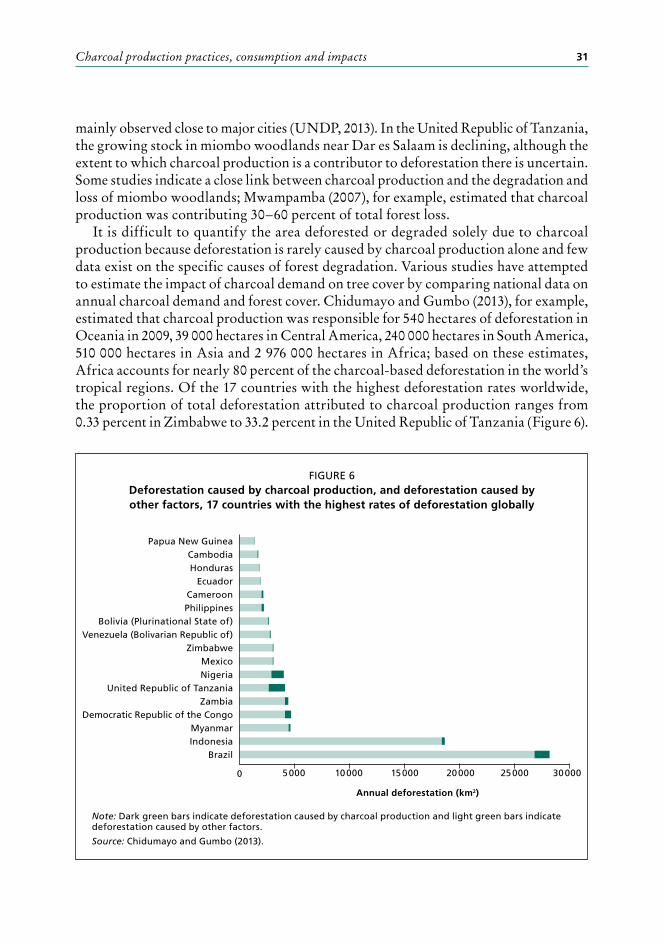
Charcoal production practices, consumption and impacts 31
mainly observed close to major cities (UNDP, 2013). In the United Republic of Tanzania, the growing stock in miombo woodlands near Dar es Salaam is declining, although the extent to which charcoal production is a contributor to deforestation there is uncertain. Some studies indicate a close link between charcoal production and the degradation and loss of miombo woodlands; Mwampamba (2007), for example, estimated that charcoal production was contributing 30–60 percent of total forest loss.
It is difficult to quantify the area deforested or degraded solely due to charcoal production because deforestation is rarely caused by charcoal production alone and few data exist on the specific causes of forest degradation. Various studies have attempted to estimate the impact of charcoal demand on tree cover by comparing national data on annual charcoal demand and forest cover. Chidumayo and Gumbo (2013), for example, estimated that charcoal production was responsible for 540 hectares of deforestation in Oceania in 2009, 39 000 hectares in Central America, 240 000 hectares in South America, 510 000 hectares in Asia and 2 976 000 hectares in Africa; based on these estimates, Africa accounts for nearly 80 percent of the charcoal-based deforestation in the world’s tropical regions. Of the 17 countries with the highest deforestation rates worldwide, the proportion of total deforestation attributed to charcoal production ranges from 0.33 percent in Zimbabwe to 33.2 percent in the United Republic of Tanzania (Figure 6).
FIGURE 6Deforestation caused by charcoal production, and deforestation caused by other factors, 17 countries with the highest rates of deforestation globally
Note: Dark green bars indicate deforestation caused by charcoal production and light green bars indicate deforestation caused by other factors.
Source: Chidumayo and Gumbo (2013).
0
Annual deforestation (km2)
Papua New GuineaCambodiaHonduras
Ecuador
Nigeria
Cameroon
United Republic of Tanzania
Philippines
Zambia
Bolivia (Plurinational State of)
Democratic Republic of the Congo
Venezuela (Bolivarian Republic of)
Myanmar
Zimbabwe
Indonesia
Mexico
Brazil
30 00025 00020 00015 00010 0005 000
The charcoal transition32
Bailis et al. (2015) assessed pantropical woodfuel supply and demand and calculated the degree to which woodfuel demand exceeds regrowth, based on various scenarios. They estimated that 27–34 percent of the woodfuel harvest was unsustainable, with around 275 million people living in “hotspots” (Figure 7).13 Hotspots encompassed about 4 percent of the pantropics; 60 percent of this area was in Asia, 34 percent was in Africa and 6 percent was in Latin America (Bailis et al., 2015).
Impacts on climate changeThe impacts of woodfuel on climate arise from the GHG emissions caused by unsustain-able wood harvesting (mainly CO2) and incomplete combustion (methane – CH4 – and black carbon).14 Inefficient charcoal production technologies and unsustainable wood harvesting are likely to be the main contributors to GHG emissions in the charcoal
13 Bailis et al. (2015) defined hotspots as regions in which the expected fraction of non-renewable biomass exceeds 50 percent and where most woodfuel harvested is therefore unsustainable.
14 Black carbon influences climate by absorbing light and reducing the reflectivity of snow and ice, as well as through interactions with clouds (Bervoets et al., 2016).
FIGURE 7The extent to which woodfuel demand exceeds regrowth
Note: Shading indicates the fraction of non-renewable biomass estimated in subnational units resulting from direct woodfuel harvesting, under one scenario.
0–9
51–60
21–30
71–80
41–50
91–10010–20
61–70
31–40
81–90
Charcoal production practices, consumption and impacts 33
value chain (World Bank, 2012a). When sustainably produced, however, charcoal is a renewable energy source, and regenerating forests and trees capture carbon from the atmosphere. The impacts of charcoal production on climate change are discussed further in Chapter 3.
Impacts on biodiversityDeforestation and forest degradation may both cause biodiversity loss because of the reduction of habitats and their fragmentation, as well as the loss of crucial ecosystem functions. The selective extraction of woody species for charcoal production may also lead to changes in species composition in forests and woodlands, with undesirable ecological consequences (Butz, 2013). For example, Ndegwa et al. (2016) cited a trend of lower values of tree species richness, evenness and Shannon diversity15 in unprotected woodlands in Kenya subject to charcoal production. The reliance of the Brazilian charcoal sector on monocultural plantations (rather than natural forests) may also have negative impacts on biodiversity and hydrological regimes (Bailis et al., 2013).
Impacts on water and soilCharcoal production can affect soils at two levels of intensity. There may be intense impacts at kiln sites because of the extreme heat generated during the carbonization process and the digging involved in constructing pits and the use of soil to cover the wood pile (Chidumayo, 1994). Lower-intensity soil impacts may occur in areas surrounding kilns where wood is harvested; these are similar to the impacts of wood harvesting for any purpose and are related to the intensity of harvesting and the methodology used (Chidumayo and Gumbo, 2013). Intensive wood harvesting for charcoal that reduces forest cover could have significant secondary impacts on soils and watersheds (Beukering et al., 2007). Deforestation and forest degradation may reduce soil fertility and river flows, increase river sedimentation, and decrease the infiltration of water into the soil (Butz, 2013).
On the other hand, the addition of biochar16 to soils can have positive effects on soil properties such as nutrient availability, microbial activity and carbon stocks (Hernandez-Soriano et al., 2016). The use of biochar to improve soils is limited in SSA; increasing the practice would require overcoming various financial, socio-economic and technical constraints (Gwenzi et al., 2015).
Impacts on socio-economic outcomesPoverty, a lack of employment, hierarchical power structures in communities, and limited livelihood options are important factors in charcoal production (Gumbo et al., 2013; Hautdidier and Gautier, 2005). On the other hand, charcoal production contributes
15 The Shannon diversity index is commonly used to characterize species diversity in ecosystems.16 Biochar is defined by Verheijen et al. (2010) as charcoal for which, owing to its inherent properties,
scientific consensus exists that its application to soil at a specific site is expected to sustainably sequester carbon and concurrently improve soil functions.
The charcoal transition34
to meeting urban energy demands and supports many rural livelihoods (Iiyama et al., 2014b). Some of the key socio-economic impacts on charcoal value chain stakeholders are discussed below.
Gender. Women generally play important roles in the charcoal value chain but earn less than their male counterparts (GIZ, 2015; Butz, 2013: Sola and Gumbo, 2014; Jones, 2015). This is mainly because the participation of women is at the beginning and end of the value chain and rarely in the middle, where profits are concentrated (Ingram et al., 2016). Moreover, women and children are disproportionally affected by the health impacts of charcoal production (see below) because of their primary roles in household cooking.
Health. The smoke produced by woodfuel poses a considerable health risk, especially indoors. Charcoal use provides public health benefits compared with fuelwood, especially if cleaner-burning cooking fuels such as kerosene, LPG and natural gas are unavailable or unaffordable (GIZ, 2015). Studies indicate that households using charcoal stoves typically have particulate matter (PM10) concentrations of about 500 micrograms per m3, and households using wood in open fires have PM10 concentrations of more than 3 000 micrograms per m3 (Bailis et al., 2004). The World Bank (2009) found that a complete transition from fuelwood to charcoal would reduce the incidence of acute respiratory infections by 65 percent, although traditional charcoal stoves still pose a health threat because they emit more CO (Maes and Verbist, 2012).
Little is known about the health impacts of the wood extraction and carbonization stages of the value chain. Charcoal producers working in close proximity to high-temperature kilns may be exposed to toxic gaseous compounds with a risk of poisoning and disease (Jones, 2015), and they may also be at risk of injury.
Energy security. The uninterrupted availability of energy sources at an affordable price is a key aim of national energy security. In the long term, energy security requires timely investments to supply energy in line with economic development and environmental needs; in the short term, it focuses on the ability of the energy system to react promptly to sudden changes in the supply–demand balance. Woodfuel has several advantages, such as wide distribution and local availability; low cash costs and good affordability; high potential for renewability and conversion to cleaner fuels; and ease of transportation and storage as a commodity. It can therefore constitute an important component of national energy security, particularly for those billions of people without adequate access to modern and commercial energy services and the millions of people facing natural or humanitarian crises. A shift in primary cooking energy among the majority of woodfuel-dependent people in developing countries – currently numbering more than 2 billion – from locally available, renewable woodfuel to commercial fossil fuels would impose huge pressure on the supply chain and greatly increase the risk of supply interruptions. Wood energy can therefore be a strategic option for countries to increase their energy security (GIZ, 2014b).
The greatest concentration of energy poverty is in SSA, where 65 percent of the population lacks access to electricity; worldwide, an estimated 1.2 billion people – 16 percent of the global population – lacked access to electricity in 2014. Sustainable
Charcoal production practices, consumption and impacts 35
Development Goal 7,17 which aims to achieve universal access to energy by 2030, is ambitious, therefore (IEA, 2016b). Demand for wood energy is projected to increase in coming decades, especially in SSA.
Food security. When sufficient woodfuel is available, many households in regions at high risk of food insecurity mostly use charcoal or fuelwood for cooking, to boil drinking water for sanitary purposes, and for processing and preserving food. When woodfuel is less available, households may be compelled to increase woodfuel collection time, eat less-nutritious meals with reduced cooking times, and drink unsafe water.
Employment. Charcoal production provides employment opportunities for an immense and diverse network of stakeholders along the value chain, in both rural and urban areas (Zulu and Richardson, 2013; Ghilardi, Mwampamba and Dutt, 2013). Charcoal production mainly takes place in the informal sector, however, and the jobs it generates, therefore, are often informal.
Income generation. Cash income from charcoal production and trade helps diversify household incomes and pay for basic needs such as food, medical care and school fees (Zulu and Richardson, 2013). In many households, part of the revenue earned from charcoal is invested in other activities, such as agriculture (Schure, Levang and Wiersum, 2014). A study in Uganda, for example, found that the involvement of households in charcoal production reduced the likelihood they would fall below the poverty line by about 14 percent (AFREA, 2011).
Social inclusiveness. The informal nature of the charcoal sector in SSA means that many in the value chain have no “voice” in decisions that affect them. Charcoal producers are generally the least empowered stakeholders in the sector (World Bank, 2010; Schure et al., 2013); they have little negotiating power, are regularly exploited by intermediaries to keep prices low, and receive little of the value of the final sale price of charcoal.18
Charcoal produced in local communities does not always benefit those communities or the local area (GCF, 2014). If there is a lack of community management, or urban traders wield disproportionate power, the benefits generated by charcoal production may bypass communities, thereby acting to widen income inequality and causing ecological depletion (IIED, 2016).
17 Sustainable Development Goal 7 is to ensure access to affordable, reliable, sustainable and modern energy for all.
18 For example, charcoal producers in Malawi capture just 20 percent of the final value of the product. Where land is formally owned, landowners in Kenya often receive trivial amounts (0–3 percent of the final value) from the unregulated (or informally regulated) charcoal trade (Mwampamba, Owen and Pigath, 2013).
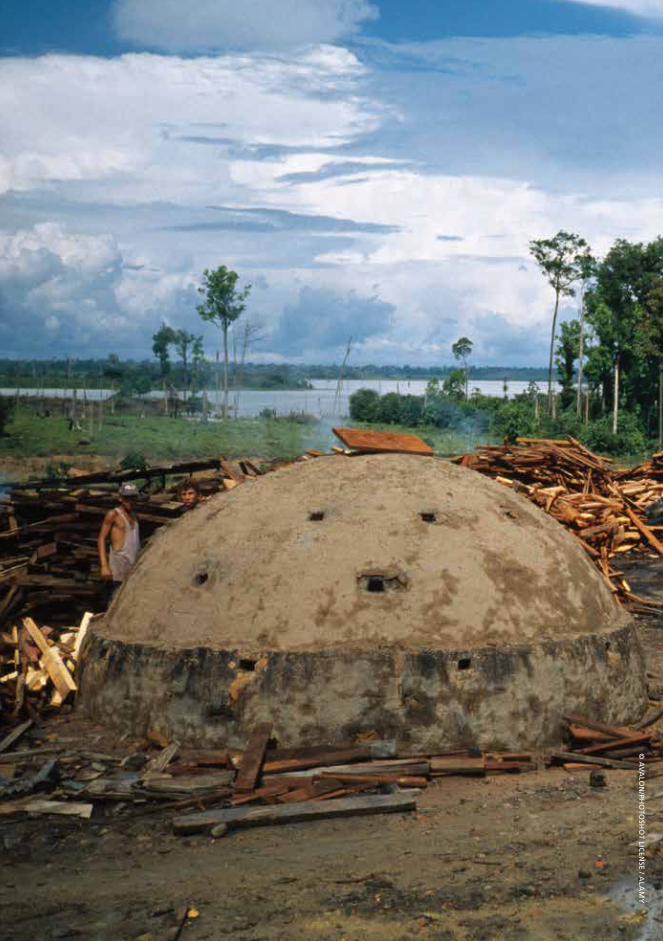
© A
VA
LON
/PHO
TOSH
OT LIC
ENSE / A
LAM
Y
37
3 Greenhouse gas emissions in the charcoal value chain
KEY POINTS• An estimated 1–2.4 Gt CO2e of GHG emissions are emitted annually in the
production and use of fuelwood and charcoal, which is 2–7 percent of global anthropogenic emissions.
• According to modelling, 1.4–4.4 kg of CO2e is emitted in the charcoal value chain per MJ end use (excluding transport).
• On average, 29–61 percent of emissions from the charcoal value chain arise in wood sourcing, 28–61 percent are generated in carbonization, 9–18 percent are caused by end use, and emissions during transportation and distribution are very small. These percentages are estimated using a number of assumptions and should be interpreted with care.
• Carbon losses in above-ground biomass due to wood sourcing for charcoal production are estimated in the range of 0–94 tonnes of CO2e per hectare in a modelled case (zero emissions assumes a sustainable scenario in which the wood resource regrows at the rate at which it is harvested).
• The low efficiency of traditional charcoal kilns means unnecessary energy losses, excess wood use and substantial GHG emissions. Maximum values of emissions estimated in models and found in the literature are in the range of 5.7–9.0 kg CO2e per kg charcoal produced.
• Transport contributes only a small proportion of total GHG emissions in the charcoal value chain – estimated (in one study) at 1.6 g CO2e per MJ delivered to the pot. Losses of charcoal during transportation mean that more wood input is required to meet the same charcoal demand.
• The end-use phase (using traditional stoves) contributes an estimated 336–901 g CO2e per MJ delivered.
• The wide range of estimates of GHG emissions indicates a need for more systematic studies on the impacts of the charcoal value chain on sustainability and GHG emissions. More research is also needed to clarify the link between charcoal production and use and deforestation and forest degradation.
Climate impacts arise from the emission of gases with positive climate forcing effects. GHGs remain in the atmosphere for varying amounts of time, ranging from a few to thousands of years. The lifetimes of the “well-mixed” GHGs (CO2, CH4, nitrous oxide – N2O, and chlorofluorocarbons) are long enough that they are relatively homogeneously
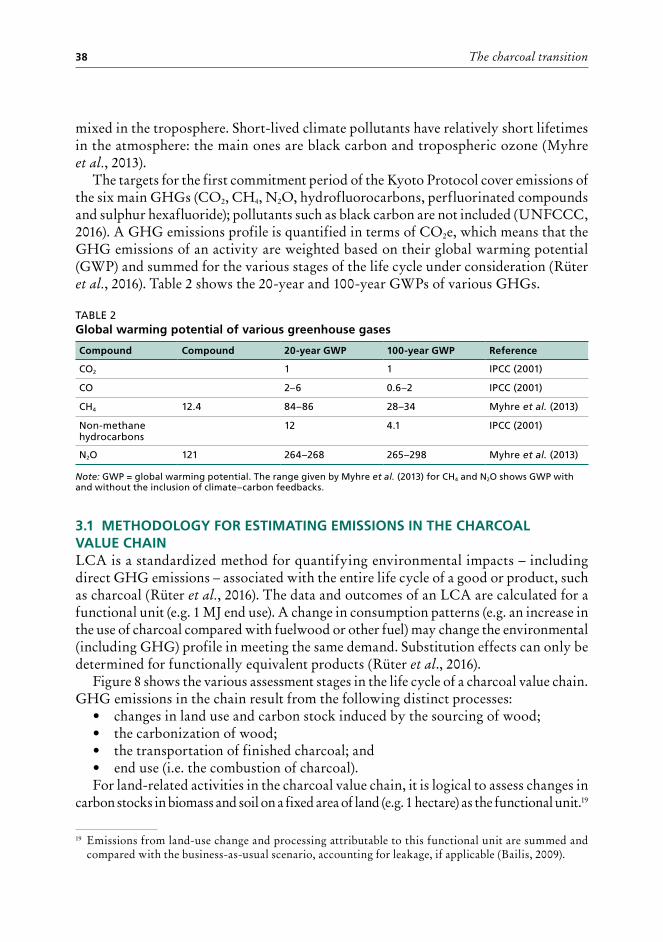
The charcoal transition38
mixed in the troposphere. Short-lived climate pollutants have relatively short lifetimes in the atmosphere: the main ones are black carbon and tropospheric ozone (Myhre et al., 2013).
The targets for the first commitment period of the Kyoto Protocol cover emissions of the six main GHGs (CO2, CH4, N2O, hydrofluorocarbons, perfluorinated compounds and sulphur hexafluoride); pollutants such as black carbon are not included (UNFCCC, 2016). A GHG emissions profile is quantified in terms of CO2e, which means that the GHG emissions of an activity are weighted based on their global warming potential (GWP) and summed for the various stages of the life cycle under consideration (Rüter et al., 2016). Table 2 shows the 20-year and 100-year GWPs of various GHGs.
TABLE 2Global warming potential of various greenhouse gases
Compound Compound 20-year GWP 100-year GWP Reference
CO2 1 1 IPCC (2001)
CO 2–6 0.6–2 IPCC (2001)
CH4 12.4 84–86 28–34 Myhre et al. (2013)
Non-methane hydrocarbons
12 4.1 IPCC (2001)
N2O 121 264–268 265–298 Myhre et al. (2013)
Note: GWP = global warming potential. The range given by Myhre et al. (2013) for CH4 and N2O shows GWP with and without the inclusion of climate–carbon feedbacks.
3.1 METHODOLOGY FOR ESTIMATING EMISSIONS IN THE CHARCOAL VALUE CHAIN LCA is a standardized method for quantifying environmental impacts – including direct GHG emissions – associated with the entire life cycle of a good or product, such as charcoal (Rüter et al., 2016). The data and outcomes of an LCA are calculated for a functional unit (e.g. 1 MJ end use). A change in consumption patterns (e.g. an increase in the use of charcoal compared with fuelwood or other fuel) may change the environmental (including GHG) profile in meeting the same demand. Substitution effects can only be determined for functionally equivalent products (Rüter et al., 2016).
Figure 8 shows the various assessment stages in the life cycle of a charcoal value chain. GHG emissions in the chain result from the following distinct processes:
• changes in land use and carbon stock induced by the sourcing of wood; • the carbonization of wood;• the transportation of finished charcoal; and• end use (i.e. the combustion of charcoal). For land-related activities in the charcoal value chain, it is logical to assess changes in
carbon stocks in biomass and soil on a fixed area of land (e.g. 1 hectare) as the functional unit.19
19 Emissions from land-use change and processing attributable to this functional unit are summed and compared with the business-as-usual scenario, accounting for leakage, if applicable (Bailis, 2009).
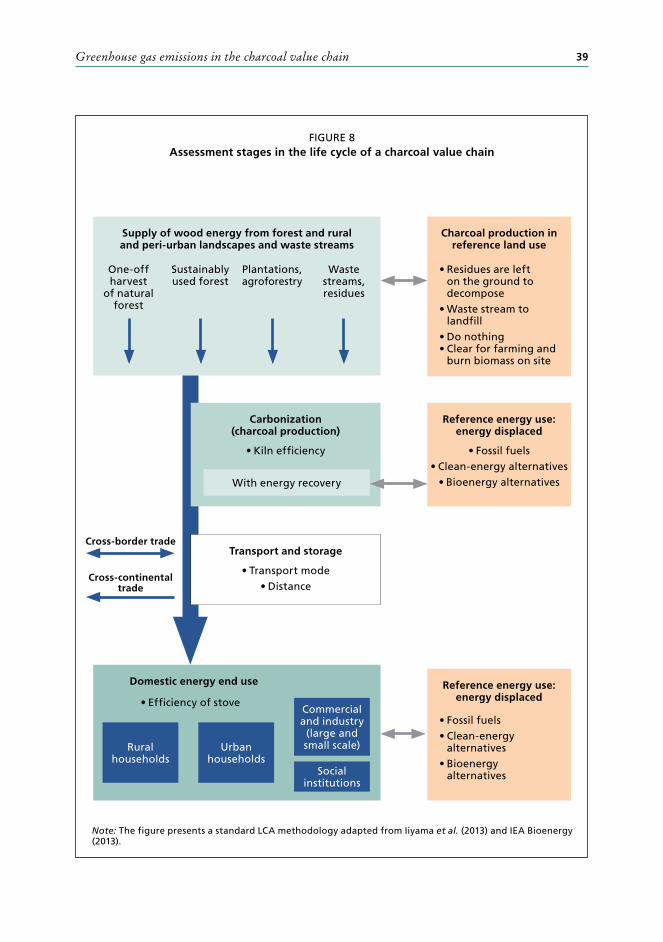
Greenhouse gas emissions in the charcoal value chain 39
FIGURE 8Assessment stages in the life cycle of a charcoal value chain
Note: The figure presents a standard LCA methodology adapted from Iiyama et al. (2013) and IEA Bioenergy (2013).
Cross-border trade
Cross-continental trade
Supply of wood energy from forest and rural and peri-urban landscapes and waste streams
Domestic energy end use
Charcoal production in reference land use
Reference energy use: energy displaced
• Fossil fuels• Clean-energy alternatives
• Bioenergy alternatives
Reference energy use: energy displaced
One-off harvest
of natural forest
Rural households
Urban households
Social institutions
Commercial and industry
(large and small scale)
Sustainably used forest
Plantations, agroforestry
Waste streams, residues
• Residues are left on the ground to decompose
• Waste stream to landfill
• Do nothing• Clear for farming and
burn biomass on site
• Fossil fuels• Clean-energy
alternatives• Bioenergy
alternatives
• Efficiency of stove
Carbonization (charcoal production)
• Kiln efficiency
With energy recovery
Transport and storage
• Transport mode• Distance
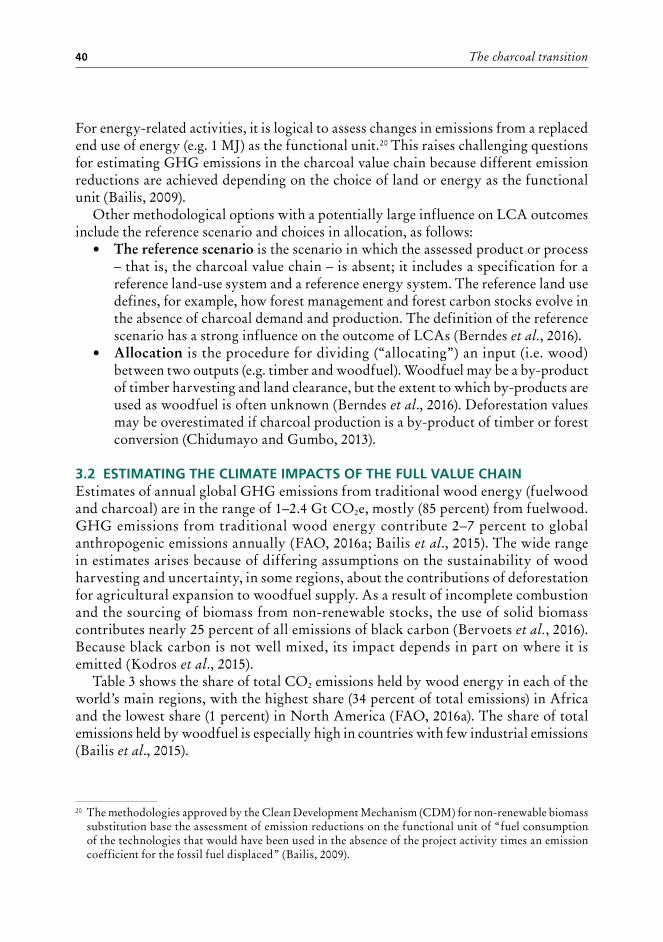
The charcoal transition40
For energy-related activities, it is logical to assess changes in emissions from a replaced end use of energy (e.g. 1 MJ) as the functional unit.20 This raises challenging questions for estimating GHG emissions in the charcoal value chain because different emission reductions are achieved depending on the choice of land or energy as the functional unit (Bailis, 2009).
Other methodological options with a potentially large influence on LCA outcomes include the reference scenario and choices in allocation, as follows:
• The reference scenario is the scenario in which the assessed product or process – that is, the charcoal value chain – is absent; it includes a specification for a reference land-use system and a reference energy system. The reference land use defines, for example, how forest management and forest carbon stocks evolve in the absence of charcoal demand and production. The definition of the reference scenario has a strong influence on the outcome of LCAs (Berndes et al., 2016).
• Allocation is the procedure for dividing (“allocating”) an input (i.e. wood) between two outputs (e.g. timber and woodfuel). Woodfuel may be a by-product of timber harvesting and land clearance, but the extent to which by-products are used as woodfuel is often unknown (Berndes et al., 2016). Deforestation values may be overestimated if charcoal production is a by-product of timber or forest conversion (Chidumayo and Gumbo, 2013).
3.2 ESTIMATING THE CLIMATE IMPACTS OF THE FULL VALUE CHAIN Estimates of annual global GHG emissions from traditional wood energy (fuelwood and charcoal) are in the range of 1–2.4 Gt CO2e, mostly (85 percent) from fuelwood. GHG emissions from traditional wood energy contribute 2–7 percent to global anthropogenic emissions annually (FAO, 2016a; Bailis et al., 2015). The wide range in estimates arises because of differing assumptions on the sustainability of wood harvesting and uncertainty, in some regions, about the contributions of deforestation for agricultural expansion to woodfuel supply. As a result of incomplete combustion and the sourcing of biomass from non-renewable stocks, the use of solid biomass contributes nearly 25 percent of all emissions of black carbon (Bervoets et al., 2016). Because black carbon is not well mixed, its impact depends in part on where it is emitted (Kodros et al., 2015).
Table 3 shows the share of total CO2 emissions held by wood energy in each of the world’s main regions, with the highest share (34 percent of total emissions) in Africa and the lowest share (1 percent) in North America (FAO, 2016a). The share of total emissions held by woodfuel is especially high in countries with few industrial emissions (Bailis et al., 2015).
20 The methodologies approved by the Clean Development Mechanism (CDM) for non-renewable biomass substitution base the assessment of emission reductions on the functional unit of “fuel consumption of the technologies that would have been used in the absence of the project activity times an emission coefficient for the fossil fuel displaced” (Bailis, 2009).
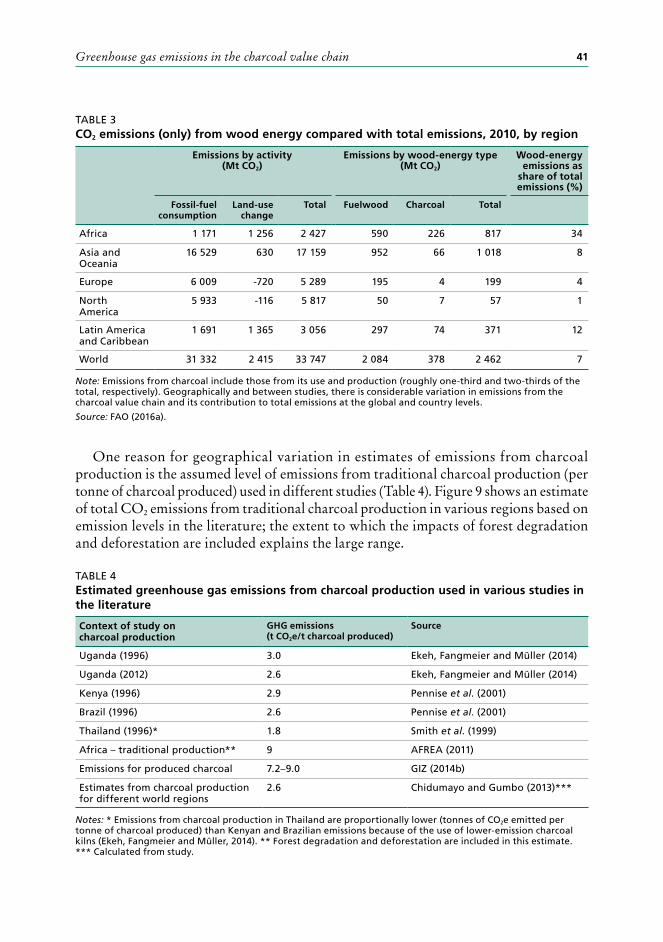
Greenhouse gas emissions in the charcoal value chain 41
TABLE 3CO2 emissions (only) from wood energy compared with total emissions, 2010, by region
Emissions by activity (Mt CO2)
Emissions by wood-energy type (Mt CO2)
Wood-energy emissions as
share of total emissions (%)
Fossil-fuel consumption
Land-use change
Total Fuelwood Charcoal Total
Africa 1 171 1 256 2 427 590 226 817 34
Asia and Oceania
16 529 630 17 159 952 66 1 018 8
Europe 6 009 -720 5 289 195 4 199 4
North America
5 933 -116 5 817 50 7 57 1
Latin America and Caribbean
1 691 1 365 3 056 297 74 371 12
World 31 332 2 415 33 747 2 084 378 2 462 7
Note: Emissions from charcoal include those from its use and production (roughly one-third and two-thirds of the total, respectively). Geographically and between studies, there is considerable variation in emissions from the charcoal value chain and its contribution to total emissions at the global and country levels.
Source: FAO (2016a).
One reason for geographical variation in estimates of emissions from charcoal production is the assumed level of emissions from traditional charcoal production (per tonne of charcoal produced) used in different studies (Table 4). Figure 9 shows an estimate of total CO2 emissions from traditional charcoal production in various regions based on emission levels in the literature; the extent to which the impacts of forest degradation and deforestation are included explains the large range.
TABLE 4Estimated greenhouse gas emissions from charcoal production used in various studies in the literature
Context of study on charcoal production
GHG emissions (t CO2e/t charcoal produced)
Source
Uganda (1996) 3.0 Ekeh, Fangmeier and Müller (2014)
Uganda (2012) 2.6 Ekeh, Fangmeier and Müller (2014)
Kenya (1996) 2.9 Pennise et al. (2001)
Brazil (1996) 2.6 Pennise et al. (2001)
Thailand (1996)* 1.8 Smith et al. (1999)
Africa – traditional production** 9 AFREA (2011)
Emissions for produced charcoal 7.2–9.0 GIZ (2014b)
Estimates from charcoal production for different world regions
2.6 Chidumayo and Gumbo (2013)***
Notes: * Emissions from charcoal production in Thailand are proportionally lower (tonnes of CO2e emitted per tonne of charcoal produced) than Kenyan and Brazilian emissions because of the use of lower-emission charcoal kilns (Ekeh, Fangmeier and Müller, 2014). ** Forest degradation and deforestation are included in this estimate. *** Calculated from study.
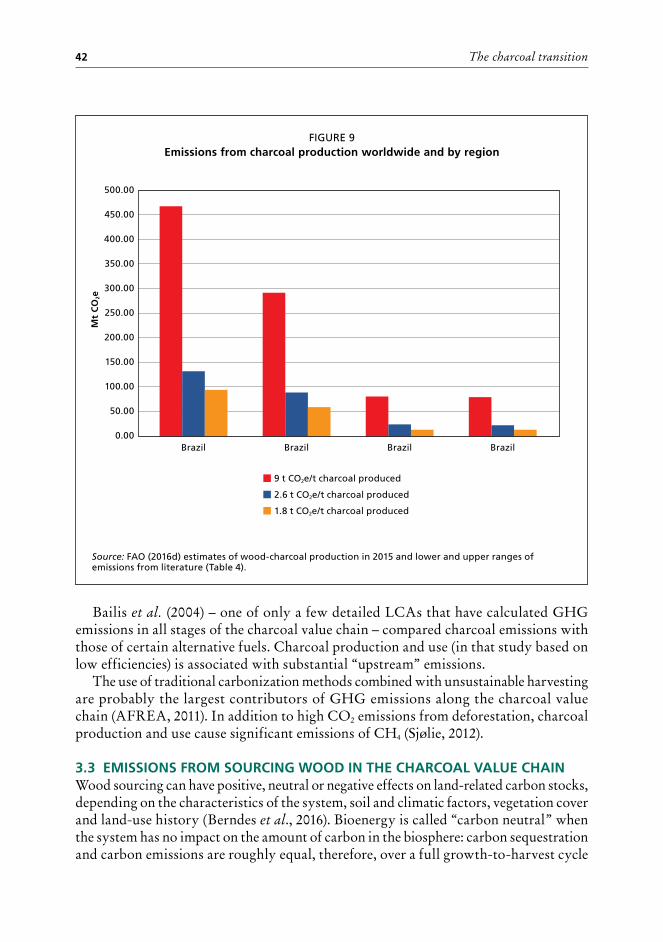
The charcoal transition42
Bailis et al. (2004) – one of only a few detailed LCAs that have calculated GHG emissions in all stages of the charcoal value chain – compared charcoal emissions with those of certain alternative fuels. Charcoal production and use (in that study based on low efficiencies) is associated with substantial “upstream” emissions.
The use of traditional carbonization methods combined with unsustainable harvesting are probably the largest contributors of GHG emissions along the charcoal value chain (AFREA, 2011). In addition to high CO2 emissions from deforestation, charcoal production and use cause significant emissions of CH4 (Sjølie, 2012).
3.3 EMISSIONS FROM SOURCING WOOD IN THE CHARCOAL VALUE CHAINWood sourcing can have positive, neutral or negative effects on land-related carbon stocks, depending on the characteristics of the system, soil and climatic factors, vegetation cover and land-use history (Berndes et al., 2016). Bioenergy is called “carbon neutral” when the system has no impact on the amount of carbon in the biosphere: carbon sequestration and carbon emissions are roughly equal, therefore, over a full growth-to-harvest cycle
FIGURE 9Emissions from charcoal production worldwide and by region
Source: FAO (2016d) estimates of wood-charcoal production in 2015 and lower and upper ranges of emissions from literature (Table 4).
0.00
300.00
350.00
450.00
400.00
500.00
250.00
150.00
200.00
50.00
100.00
Brazil Brazil Brazil Brazil
9 t CO2e/t charcoal produced
1.8 t CO2e/t charcoal produced
2.6 t CO2e/t charcoal produced
Mt
CO
2e
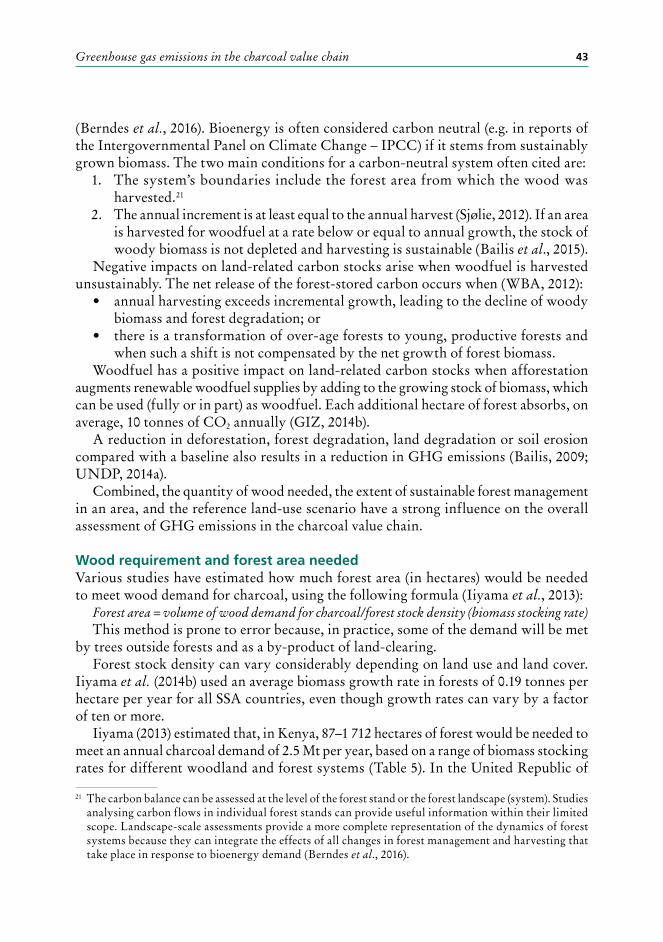
Greenhouse gas emissions in the charcoal value chain 43
(Berndes et al., 2016). Bioenergy is often considered carbon neutral (e.g. in reports of the Intergovernmental Panel on Climate Change – IPCC) if it stems from sustainably grown biomass. The two main conditions for a carbon-neutral system often cited are:
1. The system’s boundaries include the forest area from which the wood was harvested.21
2. The annual increment is at least equal to the annual harvest (Sjølie, 2012). If an area is harvested for woodfuel at a rate below or equal to annual growth, the stock of woody biomass is not depleted and harvesting is sustainable (Bailis et al., 2015).
Negative impacts on land-related carbon stocks arise when woodfuel is harvested unsustainably. The net release of the forest-stored carbon occurs when (WBA, 2012):
• annual harvesting exceeds incremental growth, leading to the decline of woody biomass and forest degradation; or
• there is a transformation of over-age forests to young, productive forests and when such a shift is not compensated by the net growth of forest biomass.
Woodfuel has a positive impact on land-related carbon stocks when afforestation augments renewable woodfuel supplies by adding to the growing stock of biomass, which can be used (fully or in part) as woodfuel. Each additional hectare of forest absorbs, on average, 10 tonnes of CO2 annually (GIZ, 2014b).
A reduction in deforestation, forest degradation, land degradation or soil erosion compared with a baseline also results in a reduction in GHG emissions (Bailis, 2009; UNDP, 2014a).
Combined, the quantity of wood needed, the extent of sustainable forest management in an area, and the reference land-use scenario have a strong influence on the overall assessment of GHG emissions in the charcoal value chain.
Wood requirement and forest area neededVarious studies have estimated how much forest area (in hectares) would be needed to meet wood demand for charcoal, using the following formula (Iiyama et al., 2013):
Forest area = volume of wood demand for charcoal/forest stock density (biomass stocking rate)This method is prone to error because, in practice, some of the demand will be met
by trees outside forests and as a by-product of land-clearing. Forest stock density can vary considerably depending on land use and land cover.
Iiyama et al. (2014b) used an average biomass growth rate in forests of 0.19 tonnes per hectare per year for all SSA countries, even though growth rates can vary by a factor of ten or more.
Iiyama (2013) estimated that, in Kenya, 87–1 712 hectares of forest would be needed to meet an annual charcoal demand of 2.5 Mt per year, based on a range of biomass stocking rates for different woodland and forest systems (Table 5). In the United Republic of
21 The carbon balance can be assessed at the level of the forest stand or the forest landscape (system). Studies analysing carbon flows in individual forest stands can provide useful information within their limited scope. Landscape-scale assessments provide a more complete representation of the dynamics of forest systems because they can integrate the effects of all changes in forest management and harvesting that take place in response to bioenergy demand (Berndes et al., 2016).
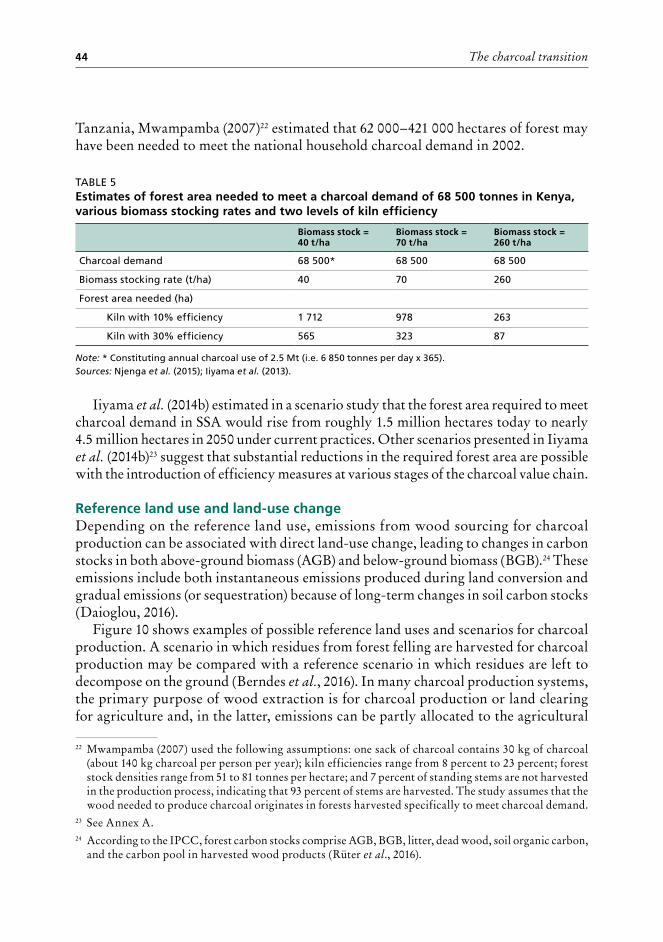
The charcoal transition44
Tanzania, Mwampamba (2007)22 estimated that 62 000–421 000 hectares of forest may have been needed to meet the national household charcoal demand in 2002.
TABLE 5Estimates of forest area needed to meet a charcoal demand of 68 500 tonnes in Kenya, various biomass stocking rates and two levels of kiln efficiency
Biomass stock = 40 t/ha
Biomass stock = 70 t/ha
Biomass stock = 260 t/ha
Charcoal demand 68 500* 68 500 68 500
Biomass stocking rate (t/ha) 40 70 260
Forest area needed (ha)
Kiln with 10% efficiency 1 712 978 263
Kiln with 30% efficiency 565 323 87
Note: * Constituting annual charcoal use of 2.5 Mt (i.e. 6 850 tonnes per day x 365).Sources: Njenga et al. (2015); Iiyama et al. (2013).
Iiyama et al. (2014b) estimated in a scenario study that the forest area required to meet charcoal demand in SSA would rise from roughly 1.5 million hectares today to nearly 4.5 million hectares in 2050 under current practices. Other scenarios presented in Iiyama et al. (2014b)23 suggest that substantial reductions in the required forest area are possible with the introduction of efficiency measures at various stages of the charcoal value chain.
Reference land use and land-use changeDepending on the reference land use, emissions from wood sourcing for charcoal production can be associated with direct land-use change, leading to changes in carbon stocks in both above-ground biomass (AGB) and below-ground biomass (BGB).24 These emissions include both instantaneous emissions produced during land conversion and gradual emissions (or sequestration) because of long-term changes in soil carbon stocks (Daioglou, 2016).
Figure 10 shows examples of possible reference land uses and scenarios for charcoal production. A scenario in which residues from forest felling are harvested for charcoal production may be compared with a reference scenario in which residues are left to decompose on the ground (Berndes et al., 2016). In many charcoal production systems, the primary purpose of wood extraction is for charcoal production or land clearing for agriculture and, in the latter, emissions can be partly allocated to the agricultural
22 Mwampamba (2007) used the following assumptions: one sack of charcoal contains 30 kg of charcoal (about 140 kg charcoal per person per year); kiln efficiencies range from 8 percent to 23 percent; forest stock densities range from 51 to 81 tonnes per hectare; and 7 percent of standing stems are not harvested in the production process, indicating that 93 percent of stems are harvested. The study assumes that the wood needed to produce charcoal originates in forests harvested specifically to meet charcoal demand.
23 See Annex A.24 According to the IPCC, forest carbon stocks comprise AGB, BGB, litter, dead wood, soil organic carbon,
and the carbon pool in harvested wood products (Rüter et al., 2016).
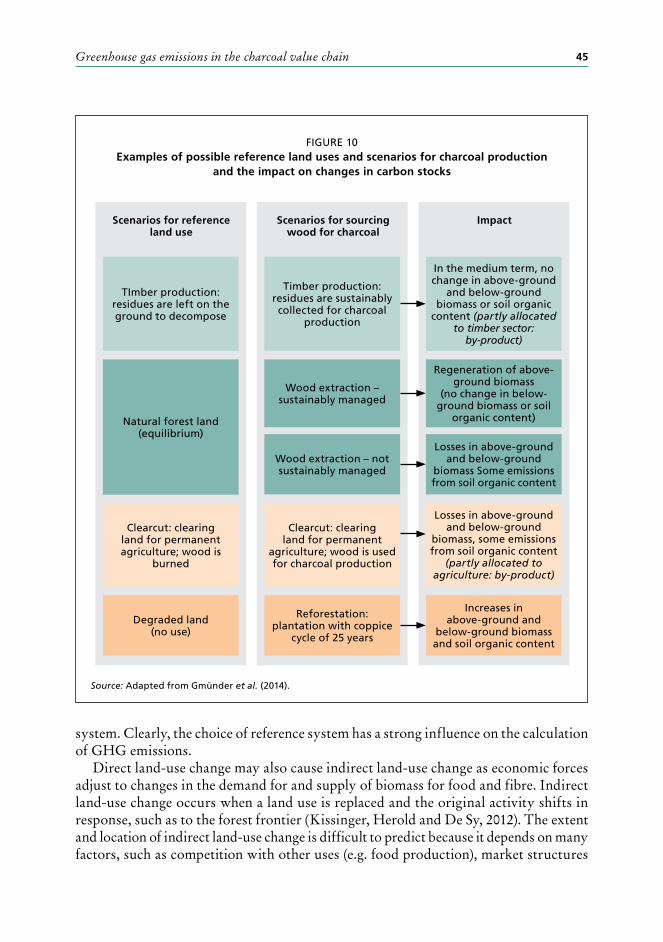
Greenhouse gas emissions in the charcoal value chain 45
system. Clearly, the choice of reference system has a strong influence on the calculation of GHG emissions.
Direct land-use change may also cause indirect land-use change as economic forces adjust to changes in the demand for and supply of biomass for food and fibre. Indirect land-use change occurs when a land use is replaced and the original activity shifts in response, such as to the forest frontier (Kissinger, Herold and De Sy, 2012). The extent and location of indirect land-use change is difficult to predict because it depends on many factors, such as competition with other uses (e.g. food production), market structures
FIGURE 10Examples of possible reference land uses and scenarios for charcoal production
and the impact on changes in carbon stocks
Clearcut: clearing land for permanent agriculture; wood is
burned
Clearcut: clearing land for permanent
agriculture; wood is used for charcoal production
Losses in above-ground and below-ground
biomass, some emissions from soil organic content
(partly allocated to agriculture: by-product)
Degraded land (no use)
Reforestation: plantation with coppice
cycle of 25 years
Increases in above-ground and
below-ground biomass and soil organic content
Scenarios for sourcing wood for charcoal
Scenarios for reference land use
Impact
Natural forest land (equilibrium)
Wood extraction –sustainably managed
Wood extraction – not sustainably managed
Regeneration of above-ground biomass
(no change in below-ground biomass or soil
organic content)
Losses in above-ground and below-ground
biomass Some emissions from soil organic content
Source: Adapted from Gmünder et al. (2014).
TImber production: residues are left on the ground to decompose
Timber production: residues are sustainably collected for charcoal
production
In the medium term, no change in above-ground
and below-ground biomass or soil organic
content (partly allocated to timber sector:
by-product)
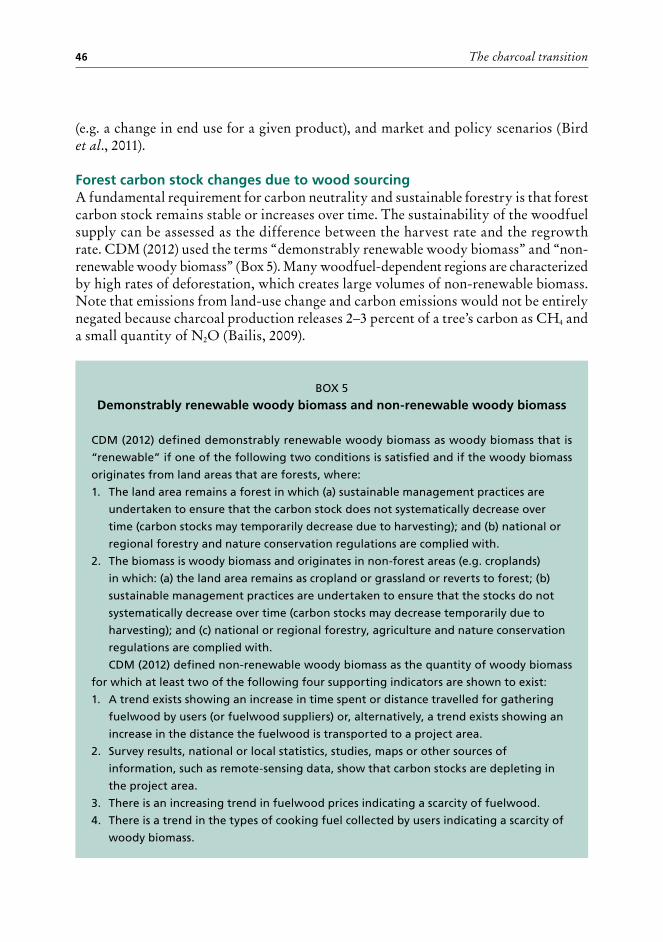
The charcoal transition46
(e.g. a change in end use for a given product), and market and policy scenarios (Bird et al., 2011).
Forest carbon stock changes due to wood sourcing A fundamental requirement for carbon neutrality and sustainable forestry is that forest carbon stock remains stable or increases over time. The sustainability of the woodfuel supply can be assessed as the difference between the harvest rate and the regrowth rate. CDM (2012) used the terms “demonstrably renewable woody biomass” and “non-renewable woody biomass” (Box 5). Many woodfuel-dependent regions are characterized by high rates of deforestation, which creates large volumes of non-renewable biomass. Note that emissions from land-use change and carbon emissions would not be entirely negated because charcoal production releases 2–3 percent of a tree’s carbon as CH4 and a small quantity of N2O (Bailis, 2009).
BOX 5
Demonstrably renewable woody biomass and non-renewable woody biomass
CDM (2012) defined demonstrably renewable woody biomass as woody biomass that is
“renewable” if one of the following two conditions is satisfied and if the woody biomass
originates from land areas that are forests, where:
1. The land area remains a forest in which (a) sustainable management practices are
undertaken to ensure that the carbon stock does not systematically decrease over
time (carbon stocks may temporarily decrease due to harvesting); and (b) national or
regional forestry and nature conservation regulations are complied with.
2. The biomass is woody biomass and originates in non-forest areas (e.g. croplands)
in which: (a) the land area remains as cropland or grassland or reverts to forest; (b)
sustainable management practices are undertaken to ensure that the stocks do not
systematically decrease over time (carbon stocks may decrease temporarily due to
harvesting); and (c) national or regional forestry, agriculture and nature conservation
regulations are complied with.
CDM (2012) defined non-renewable woody biomass as the quantity of woody biomass
for which at least two of the following four supporting indicators are shown to exist:
1. A trend exists showing an increase in time spent or distance travelled for gathering
fuelwood by users (or fuelwood suppliers) or, alternatively, a trend exists showing an
increase in the distance the fuelwood is transported to a project area.
2. Survey results, national or local statistics, studies, maps or other sources of
information, such as remote-sensing data, show that carbon stocks are depleting in
the project area.
3. There is an increasing trend in fuelwood prices indicating a scarcity of fuelwood.
4. There is a trend in the types of cooking fuel collected by users indicating a scarcity of
woody biomass.
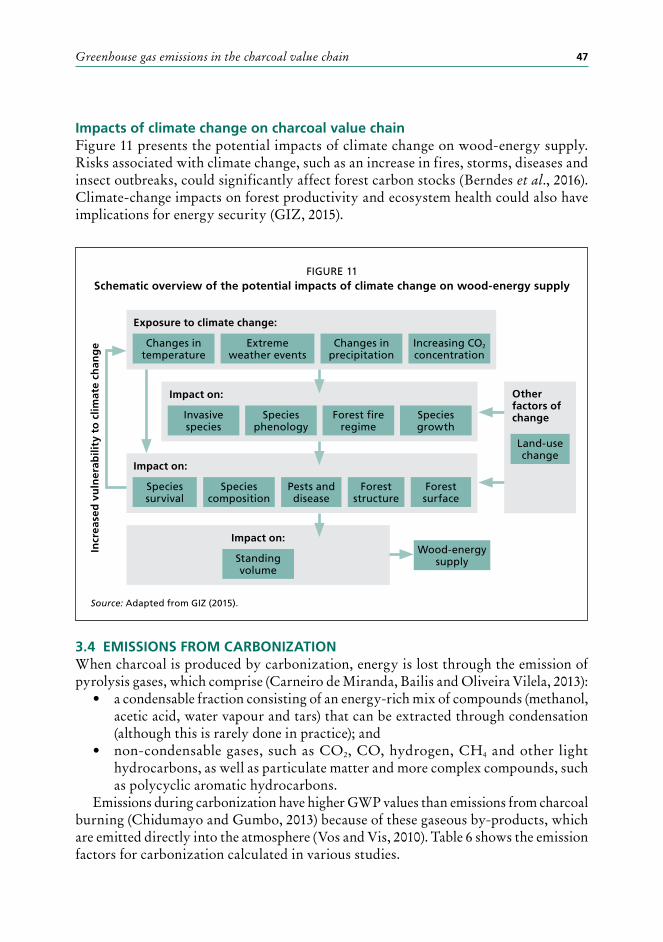
Greenhouse gas emissions in the charcoal value chain 47
Impacts of climate change on charcoal value chainFigure 11 presents the potential impacts of climate change on wood-energy supply. Risks associated with climate change, such as an increase in fires, storms, diseases and insect outbreaks, could significantly affect forest carbon stocks (Berndes et al., 2016). Climate-change impacts on forest productivity and ecosystem health could also have implications for energy security (GIZ, 2015).
3.4 EMISSIONS FROM CARBONIZATIONWhen charcoal is produced by carbonization, energy is lost through the emission of pyrolysis gases, which comprise (Carneiro de Miranda, Bailis and Oliveira Vilela, 2013):
• a condensable fraction consisting of an energy-rich mix of compounds (methanol, acetic acid, water vapour and tars) that can be extracted through condensation (although this is rarely done in practice); and
• non-condensable gases, such as CO2, CO, hydrogen, CH4 and other light hydrocarbons, as well as particulate matter and more complex compounds, such as polycyclic aromatic hydrocarbons.
Emissions during carbonization have higher GWP values than emissions from charcoal burning (Chidumayo and Gumbo, 2013) because of these gaseous by-products, which are emitted directly into the atmosphere (Vos and Vis, 2010). Table 6 shows the emission factors for carbonization calculated in various studies.
FIGURE 11Schematic overview of the potential impacts of climate change on wood-energy supply
Source: Adapted from GIZ (2015).
Standing volume
Wood-energy supply
Incr
ease
d v
uln
erab
ility
to
clim
ate
chan
ge Changes in
temperatureChanges in
precipitationIncreasing CO2 concentration
Extreme weather events
Exposure to climate change:
Species survival
Pests and disease
Forest structure
Forest surface
Species composition
Impact on:
Invasive species
Forest fire regime
Species growth
Species phenology
Impact on:
Impact on:
Land-use change
Other factors of change
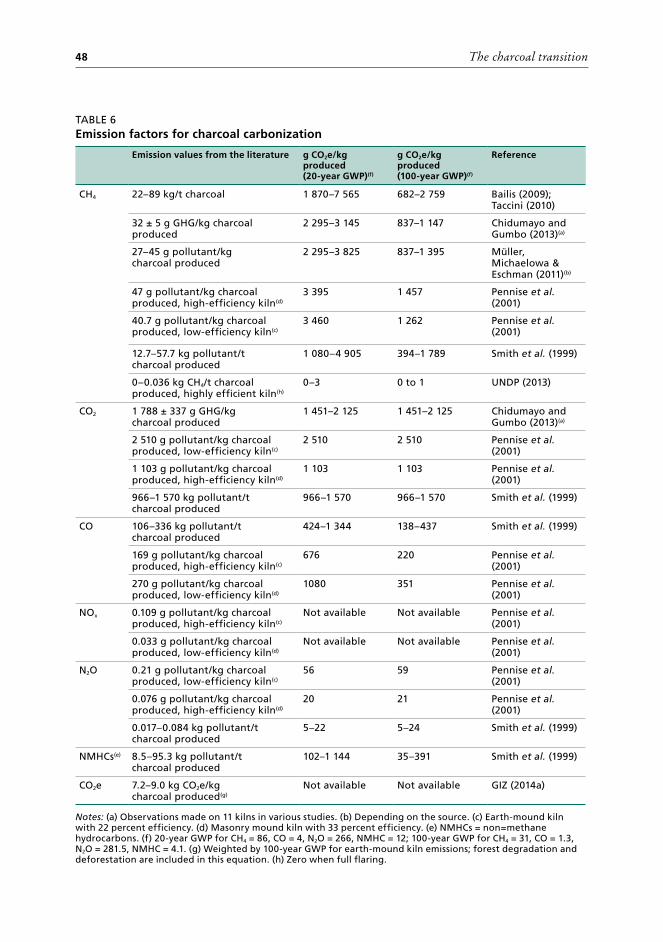
The charcoal transition48
TABLE 6Emission factors for charcoal carbonization
Emission values from the literature g CO2e/kg produced (20-year GWP)(f)
g CO2e/kg produced (100-year GWP)(f)
Reference
CH4 22–89 kg/t charcoal 1 870–7 565 682–2 759 Bailis (2009); Taccini (2010)
32 ± 5 g GHG/kg charcoal produced
2 295–3 145 837–1 147 Chidumayo and Gumbo (2013)(a)
27–45 g pollutant/kg charcoal produced
2 295–3 825 837–1 395 Müller, Michaelowa & Eschman (2011)(b)
47 g pollutant/kg charcoal produced, high-efficiency kiln(d)
3 395 1 457 Pennise et al. (2001)
40.7 g pollutant/kg charcoal produced, low-efficiency kiln(c)
3 460 1 262 Pennise et al. (2001)
12.7–57.7 kg pollutant/t charcoal produced
1 080–4 905 394–1 789 Smith et al. (1999)
0–0.036 kg CH4/t charcoal produced, highly efficient kiln(h)
0–3 0 to 1 UNDP (2013)
CO2 1 788 ± 337 g GHG/kg charcoal produced
1 451–2 125 1 451–2 125 Chidumayo and Gumbo (2013)(a)
2 510 g pollutant/kg charcoal produced, low-efficiency kiln(c)
2 510 2 510 Pennise et al. (2001)
1 103 g pollutant/kg charcoal produced, high-efficiency kiln(d)
1 103 1 103 Pennise et al. (2001)
966–1 570 kg pollutant/t charcoal produced
966–1 570 966–1 570 Smith et al. (1999)
CO 106–336 kg pollutant/t charcoal produced
424–1 344 138–437 Smith et al. (1999)
169 g pollutant/kg charcoal produced, high-efficiency kiln(c)
676 220 Pennise et al. (2001)
270 g pollutant/kg charcoal produced, low-efficiency kiln(d)
1080 351 Pennise et al. (2001)
NOx 0.109 g pollutant/kg charcoal produced, high-efficiency kiln(c)
Not available Not available Pennise et al. (2001)
0.033 g pollutant/kg charcoal produced, low-efficiency kiln(d)
Not available Not available Pennise et al. (2001)
N2O 0.21 g pollutant/kg charcoal produced, low-efficiency kiln(c)
56 59 Pennise et al. (2001)
0.076 g pollutant/kg charcoal produced, high-efficiency kiln(d)
20 21 Pennise et al. (2001)
0.017–0.084 kg pollutant/t charcoal produced
5–22 5–24 Smith et al. (1999)
NMHCs(e) 8.5–95.3 kg pollutant/t charcoal produced
102–1 144 35–391 Smith et al. (1999)
CO2e 7.2–9.0 kg CO2e/kg charcoal produced(g)
Not available Not available GIZ (2014a)
Notes: (a) Observations made on 11 kilns in various studies. (b) Depending on the source. (c) Earth-mound kiln with 22 percent efficiency. (d) Masonry mound kiln with 33 percent efficiency. (e) NMHCs = non=methane hydrocarbons. (f) 20-year GWP for CH4 = 86, CO = 4, N2O = 266, NMHC = 12; 100-year GWP for CH4 = 31, CO = 1.3, N2O = 281.5, NMHC = 4.1. (g) Weighted by 100-year GWP for earth-mound kiln emissions; forest degradation and deforestation are included in this equation. (h) Zero when full flaring.

Greenhouse gas emissions in the charcoal value chain 49
TABLE 7Minimum, average and maximum emission values for carbonization
Gas 20-year global warming potential 100-year global warming potential
Minimum < Average < Maximum Minimum < Average < Maximum
(g CO2e/kg charcoal produced) (g CO2e/kg charcoal produced)
CH4 0 3 783 7 565 0 1 380 2 759
CO2 966 1 546 2 125 966 1 546 2 125
CO 424 752 1 080 138 245 351
N2O 5 31 56 5 32 59
Non-methane hydrocarbons (NMHCs)
102 623 1 144 35 213 391
CO2e 1 497 6 734 11 970 1 144 3 415 5 685
CO2e (excl. CO2) 531 5 188 9 845 178 1 869 3 560
Notes: 20-year GWP for CH4 = 86; CO = 4; N2O = 266; NMHCs = 12. 100-year GWP for CH4 = 31; CO = 1.3; N2O = 281.5; NMHCs = 4.1. Due to assumption of full flaring, CH4 is zero under minimum emission values. NMHCs based on only one value.
Table 7 shows emission levels for carbonization found in the literature, with a range of 1 497–11 970 g of CO2e per kg of charcoal produced based on a 20-year GWP, and 1 144–5 685 g of CO2e per kg of charcoal produced based on a 100-year GWP, including CO2 emissions from wood; the wide range is explained partly by differences in the underlying assumptions and methodologies (e.g. the timeframe GWP used). Kattel (2015) mentioned, for example, that emissions from carbonization depend on the technology used, the temperature developed during pyrolysis, and the moisture content of the wood.
Table 6 and Table 7 show that emissions from carbonization decrease and impacts (e.g. forest degradation) decline when more efficient kilns are used and operators have the required skills (e.g. to optimize moisture content).
3.5 EMISSIONS IN TRANSPORTATION AND DISTRIBUTIONTransportation contributes to GHG emissions in the combustion of transportation fuel. Parameters such as the mode of transport, the fuel used, distance (and whether one-way or return load), and losses during transportation all influence the level of GHG emissions, as follows:
• The mode of transport determines the fuel used. Beukering et al. (2007) found that the trucks used for charcoal transportation in the United Republic of Tanzania were mostly old and caused excessive emissions due to partial fuel combustion. Alternative modes of transport, such as bicycles, may be used over shorter distances.
• The transportation distance defines the quantity of fuel used in transporting charcoal from production areas to consumption centres. Distances between rural-supply and urban-demand zones may increase as wood resources become depleted (Minang et al., 2015).
The charcoal transition50
• Whether trucks return to production locations empty or bearing other loads is a factor.25 Ekeh, Fangmeier and Müller (2014) observed that most trucks delivering charcoal to Kampala returned empty to production areas, meaning that emissions arising from the return trip would also be assigned to charcoal production.
• Charcoal losses during transportation have an impact on the total mass balance of the charcoal value chain because less charcoal is available for combustion. This contributes indirectly to higher GHG emissions in the charcoal value chain.
LCAs by Bailis et al. (2004) and Gmünder et al. (2014) demonstrated that transportation plays a minor role in the total GHG emissions in the charcoal value chain. In Kenya, for example, Bailis et al. (2004)26 estimated that transportation by heavy-duty trucks emitted about 1.6 g CO2e per MJ delivered to the pot, compared with 174.1 g CO2e per MJ for the production phase.
3.6 EMISSIONS FROM END USEIn optimal conditions, the by-products of biomass combustion comprise water vapour and CO2 almost entirely. Water vapour is quickly incorporated in the hydrological cycle and has no measurable warming effect, and CO2 can be absorbed by new plant growth through photosynthesis. Thus, if biomass is harvested sustainably so that its stocks are not depleted in the long term and if it is burned under ideal combustion conditions, it is effectively GHG-neutral (Bailis et al., 2003).
Simple stove technologies, however, result in incomplete and inefficient combustion and thus emit health-damaging pollutants and potent GHGs such as CO, N2O, CH4 and polycyclic aromatic hydrocarbons (Bhattacharya, Albina and Khaing, 2002). Products of incomplete combustion are a major source of indoor air pollution, and some of these compounds also contribute to global climate change (Ekeh, Fangmeier and Müller, 2014; Bailis, Ezzati and Kammen, 2003).
Fuelwood-burning in cook stoves releases black carbon as part of visible smoke, mainly due to incomplete combustion (AFREA, 2011). Black carbon may contribute to climate change, although there is uncertainty about its net impact (AFREA, 2011).
Various studies have analysed emissions from the combustion of charcoal in traditional stoves, often in comparison with alternative stoves or fuels. Bailis, Ezzati and Kammen (2003) quantified emissions from several charcoal and wood stoves commonly used by an agropastoral community in Kenya and compared these with other case studies (e.g. Brocard et al., 1996). An important difference between the study by Bailis, Ezzati and Kammen (2003) and those by Bhattacharya and Salam (2002) and Hofstad, Kohlin and Namaalwa (2009) was that it used a 20-year GWP rather than a 100-year GWP, resulting in higher values for charcoal and woodfuel, especially compared with other fuels. Hofstad, Kohlin and Namaalwa (2009) and Bhattacharya and Salam (2002) estimated GHG emissions from
25 Emissions for a two-way trip compared with a one-way trip would double the GHGs attributable to the transportation phase (Ekeh, Fangmeier and Müller, 2014).
26 Bailis et al. (2004) included emissions for transportation based on United States Environment Protection Agency emission factors for heavy-duty diesel trucks, adjusted to reflect the age and condition of the vehicles used to transport charcoal in Kenya.
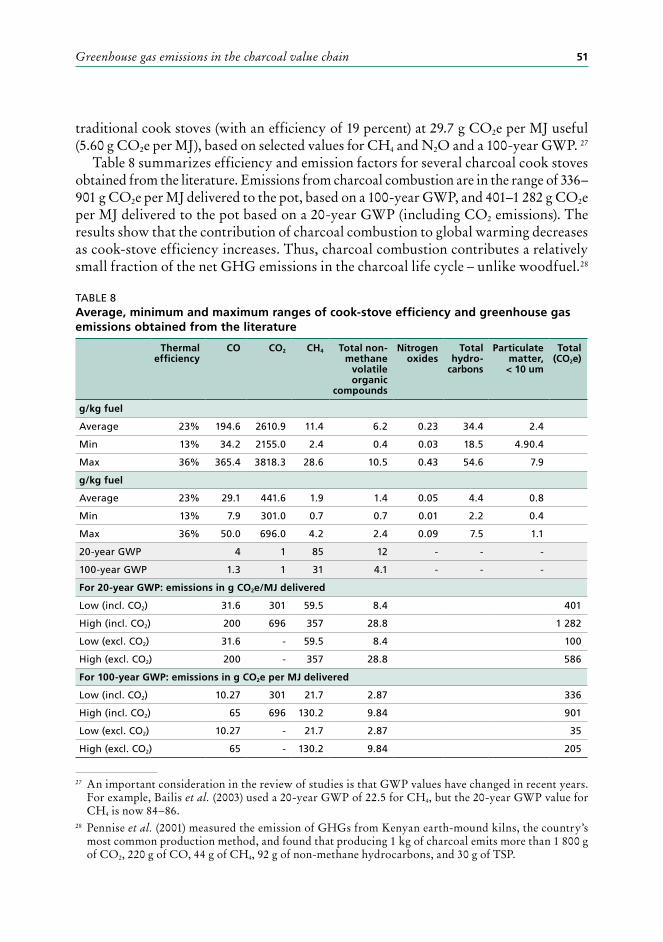
Greenhouse gas emissions in the charcoal value chain 51
traditional cook stoves (with an efficiency of 19 percent) at 29.7 g CO2e per MJ useful (5.60 g CO2e per MJ), based on selected values for CH4 and N2O and a 100-year GWP. 27
Table 8 summarizes efficiency and emission factors for several charcoal cook stoves obtained from the literature. Emissions from charcoal combustion are in the range of 336–901 g CO2e per MJ delivered to the pot, based on a 100-year GWP, and 401–1 282 g CO2e per MJ delivered to the pot based on a 20-year GWP (including CO2 emissions). The results show that the contribution of charcoal combustion to global warming decreases as cook-stove efficiency increases. Thus, charcoal combustion contributes a relatively small fraction of the net GHG emissions in the charcoal life cycle – unlike woodfuel.28
TABLE 8Average, minimum and maximum ranges of cook-stove efficiency and greenhouse gas emissions obtained from the literature
Thermal efficiency
CO CO2 CH4 Total non-methane
volatile organic
compounds
Nitrogen oxides
Total hydro-
carbons
Particulate matter, < 10 um
Total (CO2e)
g/kg fuel
Average 23% 194.6 2610.9 11.4 6.2 0.23 34.4 2.4
Min 13% 34.2 2155.0 2.4 0.4 0.03 18.5 4.90.4
Max 36% 365.4 3818.3 28.6 10.5 0.43 54.6 7.9
g/kg fuel
Average 23% 29.1 441.6 1.9 1.4 0.05 4.4 0.8
Min 13% 7.9 301.0 0.7 0.7 0.01 2.2 0.4
Max 36% 50.0 696.0 4.2 2.4 0.09 7.5 1.1
20-year GWP 4 1 85 12 - - -
100-year GWP 1.3 1 31 4.1 - - -
For 20-year GWP: emissions in g CO2e/MJ delivered
Low (incl. CO2) 31.6 301 59.5 8.4 401
High (incl. CO2) 200 696 357 28.8 1 282
Low (excl. CO2) 31.6 - 59.5 8.4 100
High (excl. CO2) 200 - 357 28.8 586
For 100-year GWP: emissions in g CO2e per MJ delivered
Low (incl. CO2) 10.27 301 21.7 2.87 336
High (incl. CO2) 65 696 130.2 9.84 901
Low (excl. CO2) 10.27 - 21.7 2.87 35
High (excl. CO2) 65 - 130.2 9.84 205
27 An important consideration in the review of studies is that GWP values have changed in recent years. For example, Bailis et al. (2003) used a 20-year GWP of 22.5 for CH4, but the 20-year GWP value for CH4 is now 84–86.
28 Pennise et al. (2001) measured the emission of GHGs from Kenyan earth-mound kilns, the country’s most common production method, and found that producing 1 kg of charcoal emits more than 1 800 g of CO2, 220 g of CO, 44 g of CH4, 92 g of non-methane hydrocarbons, and 30 g of TSP.
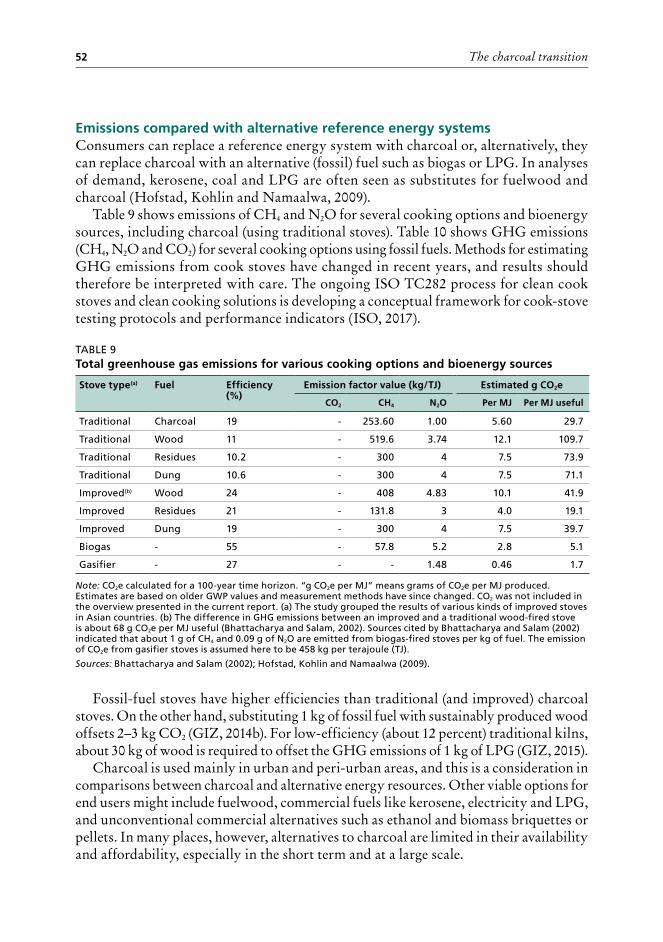
The charcoal transition52
Emissions compared with alternative reference energy systemsConsumers can replace a reference energy system with charcoal or, alternatively, they can replace charcoal with an alternative (fossil) fuel such as biogas or LPG. In analyses of demand, kerosene, coal and LPG are often seen as substitutes for fuelwood and charcoal (Hofstad, Kohlin and Namaalwa, 2009).
Table 9 shows emissions of CH4 and N2O for several cooking options and bioenergy sources, including charcoal (using traditional stoves). Table 10 shows GHG emissions (CH4, N2O and CO2) for several cooking options using fossil fuels. Methods for estimating GHG emissions from cook stoves have changed in recent years, and results should therefore be interpreted with care. The ongoing ISO TC282 process for clean cook stoves and clean cooking solutions is developing a conceptual framework for cook-stove testing protocols and performance indicators (ISO, 2017).
TABLE 9Total greenhouse gas emissions for various cooking options and bioenergy sources
Stove type(a) Fuel Efficiency (%)
Emission factor value (kg/TJ) Estimated g CO2e
CO2 CH4 N2O Per MJ Per MJ useful
Traditional Charcoal 19 - 253.60 1.00 5.60 29.7
Traditional Wood 11 - 519.6 3.74 12.1 109.7
Traditional Residues 10.2 - 300 4 7.5 73.9
Traditional Dung 10.6 - 300 4 7.5 71.1
Improved(b) Wood 24 - 408 4.83 10.1 41.9
Improved Residues 21 - 131.8 3 4.0 19.1
Improved Dung 19 - 300 4 7.5 39.7
Biogas - 55 - 57.8 5.2 2.8 5.1
Gasifier - 27 - - 1.48 0.46 1.7
Note: CO2e calculated for a 100-year time horizon. “g CO2e per MJ” means grams of CO2e per MJ produced. Estimates are based on older GWP values and measurement methods have since changed. CO2 was not included in the overview presented in the current report. (a) The study grouped the results of various kinds of improved stoves in Asian countries. (b) The difference in GHG emissions between an improved and a traditional wood-fired stove is about 68 g CO2e per MJ useful (Bhattacharya and Salam, 2002). Sources cited by Bhattacharya and Salam (2002) indicated that about 1 g of CH4 and 0.09 g of N2O are emitted from biogas-fired stoves per kg of fuel. The emission of CO2e from gasifier stoves is assumed here to be 458 kg per terajoule (TJ).
Sources: Bhattacharya and Salam (2002); Hofstad, Kohlin and Namaalwa (2009).
Fossil-fuel stoves have higher efficiencies than traditional (and improved) charcoal stoves. On the other hand, substituting 1 kg of fossil fuel with sustainably produced wood offsets 2–3 kg CO2 (GIZ, 2014b). For low-efficiency (about 12 percent) traditional kilns, about 30 kg of wood is required to offset the GHG emissions of 1 kg of LPG (GIZ, 2015).
Charcoal is used mainly in urban and peri-urban areas, and this is a consideration in comparisons between charcoal and alternative energy resources. Other viable options for end users might include fuelwood, commercial fuels like kerosene, electricity and LPG, and unconventional commercial alternatives such as ethanol and biomass briquettes or pellets. In many places, however, alternatives to charcoal are limited in their availability and affordability, especially in the short term and at a large scale.
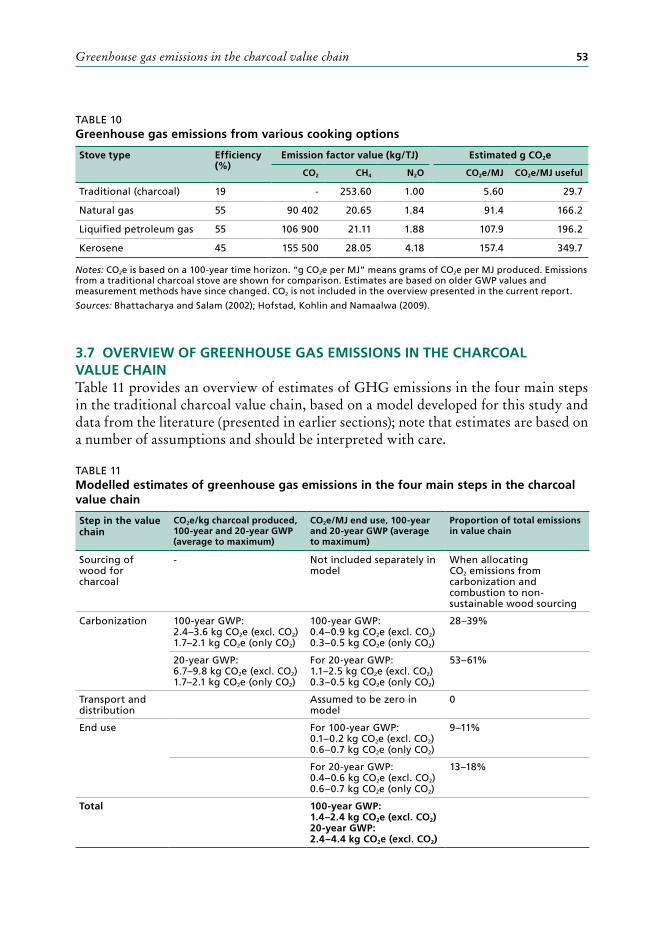
Greenhouse gas emissions in the charcoal value chain 53
TABLE 10Greenhouse gas emissions from various cooking options
Stove type Efficiency (%)
Emission factor value (kg/TJ) Estimated g CO2e
CO2 CH4 N2O CO2e/MJ CO2e/MJ useful
Traditional (charcoal) 19 - 253.60 1.00 5.60 29.7
Natural gas 55 90 402 20.65 1.84 91.4 166.2
Liquified petroleum gas 55 106 900 21.11 1.88 107.9 196.2
Kerosene 45 155 500 28.05 4.18 157.4 349.7
Notes: CO2e is based on a 100-year time horizon. “g CO2e per MJ” means grams of CO2e per MJ produced. Emissions from a traditional charcoal stove are shown for comparison. Estimates are based on older GWP values and measurement methods have since changed. CO2 is not included in the overview presented in the current report.
Sources: Bhattacharya and Salam (2002); Hofstad, Kohlin and Namaalwa (2009).
3.7 OVERVIEW OF GREENHOUSE GAS EMISSIONS IN THE CHARCOAL VALUE CHAINTable 11 provides an overview of estimates of GHG emissions in the four main steps in the traditional charcoal value chain, based on a model developed for this study and data from the literature (presented in earlier sections); note that estimates are based on a number of assumptions and should be interpreted with care.
TABLE 11Modelled estimates of greenhouse gas emissions in the four main steps in the charcoal value chain
Step in the value chain
CO2e/kg charcoal produced, 100-year and 20-year GWP (average to maximum)
CO2e/MJ end use, 100-year and 20-year GWP (average to maximum)
Proportion of total emissions in value chain
Sourcing of wood for charcoal
- Not included separately in model
When allocating CO2 emissions from carbonization and combustion to non-sustainable wood sourcing
Carbonization 100-year GWP: 2.4–3.6 kg CO2e (excl. CO2) 1.7–2.1 kg CO2e (only CO2)
100-year GWP: 0.4–0.9 kg CO2e (excl. CO2) 0.3–0.5 kg CO2e (only CO2)
28–39%
20-year GWP: 6.7–9.8 kg CO2e (excl. CO2) 1.7–2.1 kg CO2e (only CO2)
For 20-year GWP: 1.1–2.5 kg CO2e (excl. CO2) 0.3–0.5 kg CO2e (only CO2)
53–61%
Transport and distribution
Assumed to be zero in model
0
End use For 100-year GWP: 0.1–0.2 kg CO2e (excl. CO2) 0.6–0.7 kg CO2e (only CO2)
9–11%
For 20-year GWP: 0.4–0.6 kg CO2e (excl. CO2) 0.6–0.7 kg CO2e (only CO2)
13–18%
Total 100-year GWP: 1.4–2.4 kg CO2e (excl. CO2) 20-year GWP: 2.4–4.4 kg CO2e (excl. CO2)
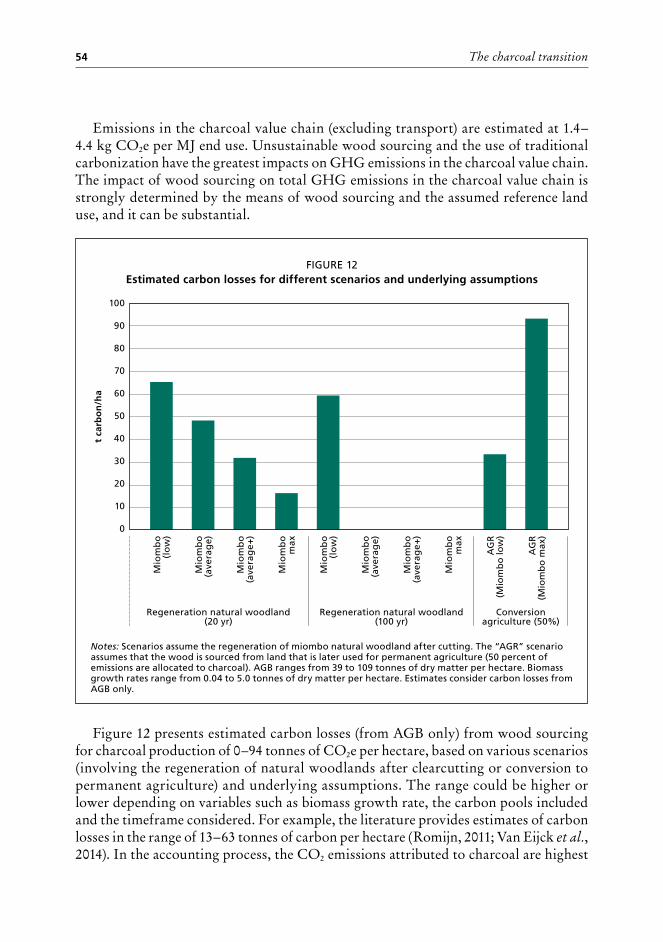
The charcoal transition54
Emissions in the charcoal value chain (excluding transport) are estimated at 1.4–4.4 kg CO2e per MJ end use. Unsustainable wood sourcing and the use of traditional carbonization have the greatest impacts on GHG emissions in the charcoal value chain. The impact of wood sourcing on total GHG emissions in the charcoal value chain is strongly determined by the means of wood sourcing and the assumed reference land use, and it can be substantial.
Figure 12 presents estimated carbon losses (from AGB only) from wood sourcing for charcoal production of 0–94 tonnes of CO2e per hectare, based on various scenarios (involving the regeneration of natural woodlands after clearcutting or conversion to permanent agriculture) and underlying assumptions. The range could be higher or lower depending on variables such as biomass growth rate, the carbon pools included and the timeframe considered. For example, the literature provides estimates of carbon losses in the range of 13–63 tonnes of carbon per hectare (Romijn, 2011; Van Eijck et al., 2014). In the accounting process, the CO2 emissions attributed to charcoal are highest
FIGURE 12Estimated carbon losses for different scenarios and underlying assumptions
Notes: Scenarios assume the regeneration of miombo natural woodland after cutting. The “AGR” scenario assumes that the wood is sourced from land that is later used for permanent agriculture (50 percent of emissions are allocated to charcoal). AGB ranges from 39 to 109 tonnes of dry matter per hectare. Biomass growth rates range from 0.04 to 5.0 tonnes of dry matter per hectare. Estimates consider carbon losses from AGB only.
0
60
70
80
90
100
50
30
40
10
20
Mio
mb
o
(lo
w)
Mio
mb
o
(ave
rag
e)
Mio
mb
o
(ave
rag
e+)
Mio
mb
o
max
Mio
mb
o
(lo
w)
Mio
mb
o
(ave
rag
e)
Mio
mb
o
(ave
rag
e+)
Mio
mb
o
max
AG
R
(Mio
mb
o lo
w)
AG
R
(Mio
mb
o m
ax)
Regeneration natural woodland (20 yr)
Regeneration natural woodland (100 yr)
Conversion agriculture (50%)
t ca
rbo
n/h
a

Greenhouse gas emissions in the charcoal value chain 55
if an area is deforested for charcoal and therefore (part of) the emissions are allocated to charcoal production.
Estimates of GHG emissions in the various stages of the charcoal value chain clearly have a wide range, and methodological decisions therefore have a strong influence on values. An important research need is to obtain better data to reduce uncertainties and enable more precise estimates of GHG emissions in charcoal production (with and without the impact of unsustainable wood sourcing).
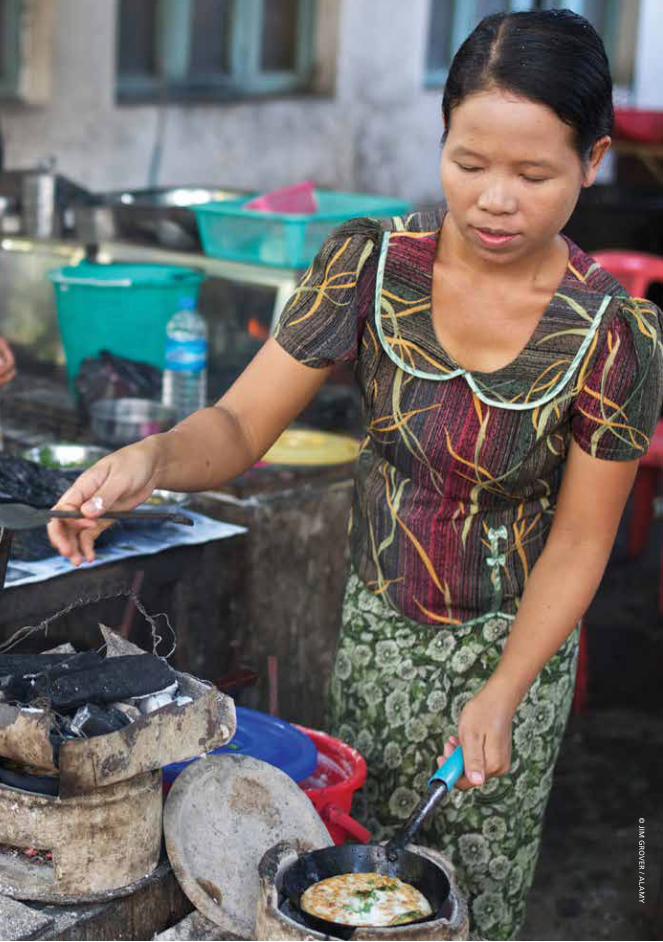
© JIM
GR
OV
ER / A
LAM
Y
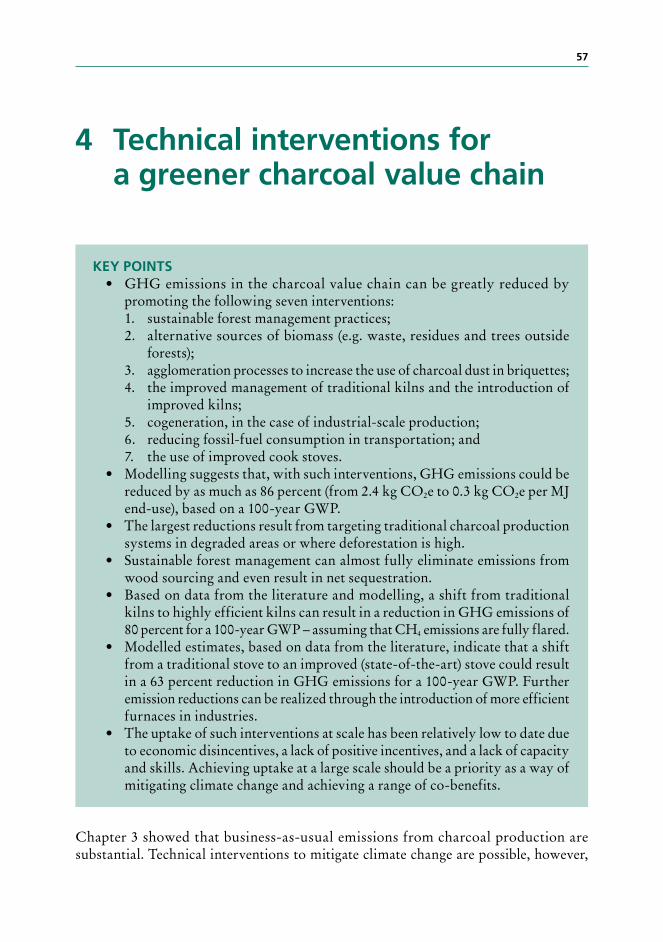
57
4 Technical interventions for a greener charcoal value chain
KEY POINTS• GHG emissions in the charcoal value chain can be greatly reduced by
promoting the following seven interventions:1. sustainable forest management practices;2. alternative sources of biomass (e.g. waste, residues and trees outside
forests);3. agglomeration processes to increase the use of charcoal dust in briquettes;4. the improved management of traditional kilns and the introduction of
improved kilns;5. cogeneration, in the case of industrial-scale production; 6. reducing fossil-fuel consumption in transportation; and7. the use of improved cook stoves.
• Modelling suggests that, with such interventions, GHG emissions could be reduced by as much as 86 percent (from 2.4 kg CO2e to 0.3 kg CO2e per MJ end-use), based on a 100-year GWP.
• The largest reductions result from targeting traditional charcoal production systems in degraded areas or where deforestation is high.
• Sustainable forest management can almost fully eliminate emissions from wood sourcing and even result in net sequestration.
• Based on data from the literature and modelling, a shift from traditional kilns to highly efficient kilns can result in a reduction in GHG emissions of 80 percent for a 100-year GWP – assuming that CH4 emissions are fully flared.
• Modelled estimates, based on data from the literature, indicate that a shift from a traditional stove to an improved (state-of-the-art) stove could result in a 63 percent reduction in GHG emissions for a 100-year GWP. Further emission reductions can be realized through the introduction of more efficient furnaces in industries.
• The uptake of such interventions at scale has been relatively low to date due to economic disincentives, a lack of positive incentives, and a lack of capacity and skills. Achieving uptake at a large scale should be a priority as a way of mitigating climate change and achieving a range of co-benefits.
Chapter 3 showed that business-as-usual emissions from charcoal production are substantial. Technical interventions to mitigate climate change are possible, however,
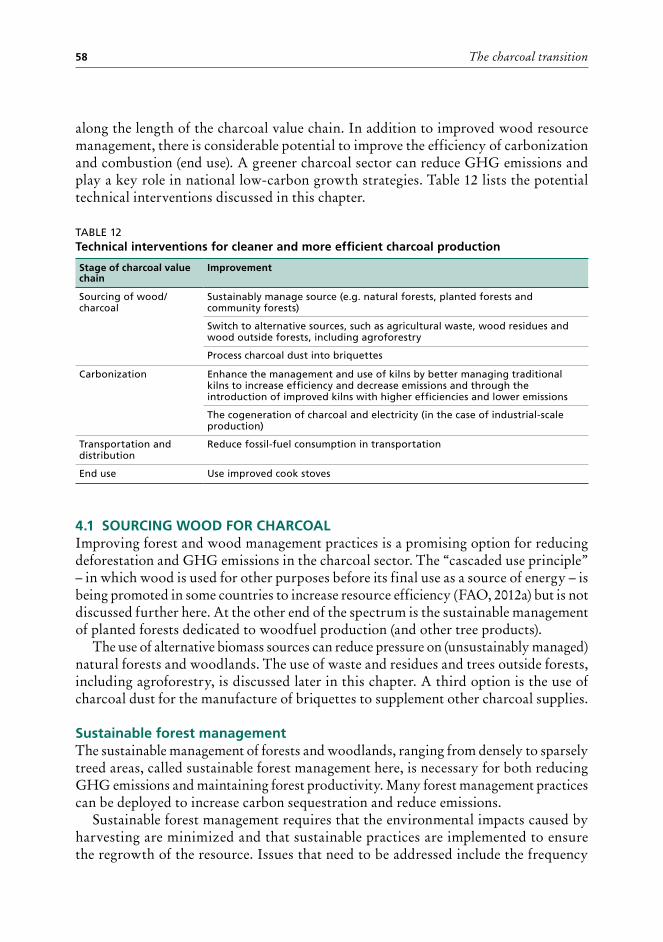
The charcoal transition58
along the length of the charcoal value chain. In addition to improved wood resource management, there is considerable potential to improve the efficiency of carbonization and combustion (end use). A greener charcoal sector can reduce GHG emissions and play a key role in national low-carbon growth strategies. Table 12 lists the potential technical interventions discussed in this chapter.
TABLE 12Technical interventions for cleaner and more efficient charcoal production
Stage of charcoal value chain
Improvement
Sourcing of wood/charcoal
Sustainably manage source (e.g. natural forests, planted forests and community forests)
Switch to alternative sources, such as agricultural waste, wood residues and wood outside forests, including agroforestry
Process charcoal dust into briquettes
Carbonization Enhance the management and use of kilns by better managing traditional kilns to increase efficiency and decrease emissions and through the introduction of improved kilns with higher efficiencies and lower emissions
The cogeneration of charcoal and electricity (in the case of industrial-scale production)
Transportation and distribution
Reduce fossil-fuel consumption in transportation
End use Use improved cook stoves
4.1 SOURCING WOOD FOR CHARCOAL Improving forest and wood management practices is a promising option for reducing deforestation and GHG emissions in the charcoal sector. The “cascaded use principle” – in which wood is used for other purposes before its final use as a source of energy – is being promoted in some countries to increase resource efficiency (FAO, 2012a) but is not discussed further here. At the other end of the spectrum is the sustainable management of planted forests dedicated to woodfuel production (and other tree products).
The use of alternative biomass sources can reduce pressure on (unsustainably managed) natural forests and woodlands. The use of waste and residues and trees outside forests, including agroforestry, is discussed later in this chapter. A third option is the use of charcoal dust for the manufacture of briquettes to supplement other charcoal supplies.
Sustainable forest management The sustainable management of forests and woodlands, ranging from densely to sparsely treed areas, called sustainable forest management here, is necessary for both reducing GHG emissions and maintaining forest productivity. Many forest management practices can be deployed to increase carbon sequestration and reduce emissions.
Sustainable forest management requires that the environmental impacts caused by harvesting are minimized and that sustainable practices are implemented to ensure the regrowth of the resource. Issues that need to be addressed include the frequency
Technical interventions for a greener charcoal value chain 59
of harvesting (the “felling cycle”) and its intensity, the rotation length (in the case of monocyclic forest management systems), and the conservation of soil and biodiversity (FAO, 2016a; Bailis, 2009).
Low-impact harvesting requires pre-harvest inventories and planning to ensure that wood extraction causes minimal damage to soils and retained vegetation and that, overall, the volume of wood extracted annually is less than or equal to the annual sustainable yield of the resource (FAO, 2016a; Box 6). Increasing the length of the felling cycle has the potential to increase carbon sequestration and storage in forests; old forest stands, for example, have relatively high carbon density, and younger stands have a larger carbon sink capacity (FAO, 2016a). Post-harvest management (e.g. the restoration of log landings), the regeneration strategy, and (in cases where wood harvesting for charcoal is a by-product of land clearing) the intensity of land use after clearing29 all affect the rate and trajectory of forest recovery in terms of both species and biomass accumulation.
Ideally, forest management practices would be applied to increase the sustainable yield of a given forest area. Experimental studies in Tanzanian drylands, for example, suggest that rotational woodlot systems using fast-growing nitrogen-fixing tree species have the potential to produce 20–50 tonnes of wood per hectare in a five-year period (Kimaro et al., 2007).30 Okello, O’Conner and Young (2001) indicated yields of 18 tonnes per hectare of wood for charcoal using a coppice management system for acacia species based
29 A study in Puerto Rico found that sites previously used for charcoal production, as evidenced by the presence of charcoal pits, required shorter recovery periods than those used for settlement and agriculture (Chidumayo and Chumbo, 2013).
30 The MAI of these woodlots (4–10 tonnes per hectare per year) is far higher than MAIs reported for natural or minimally managed vegetation in the region (Kimaro et al., 2007).
BOX 6
Example of planning and inventory of wood extraction for charcoal production
A patch of forest can be segregated into sections in accordance with the annual volume of
wood required, the charcoal production capacity (e.g. of a kiln) and the time required for
the resource to regenerate to a state that is ready for harvesting (i.e. the rotation length).
An Adam kiln has the capacity to produce about 50 tonnes of charcoal annually with an
efficiency of 30–40 percent; it therefore would use 125–165 tonnes of wood per year. The
forest area for feeding this kiln would be divided into sections, each of which is capable
of producing 165 tonnes of wood over the rotation. If the rotation length is ten years (e.g.
in a fast-growing eucalypt plantation), then ten forest sections would be created, each of
which would be harvested once every ten years and then replanted. Such a system would
ensure a sustainable wood supply for the kiln and discourage permanent deforestation.
Source: Based on UNDP (2013).
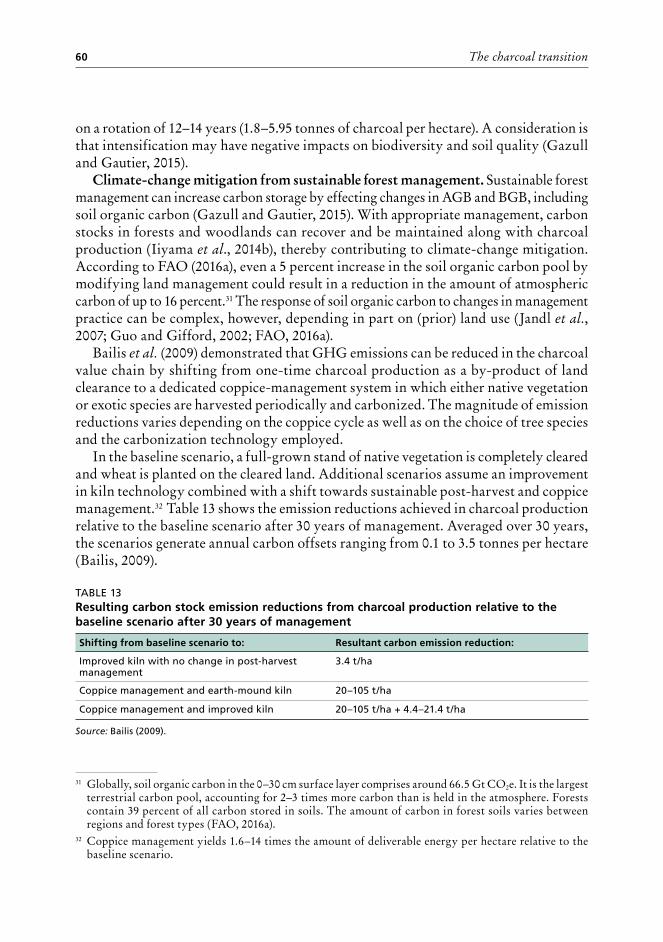
The charcoal transition60
on a rotation of 12–14 years (1.8–5.95 tonnes of charcoal per hectare). A consideration is that intensification may have negative impacts on biodiversity and soil quality (Gazull and Gautier, 2015).
Climate-change mitigation from sustainable forest management. Sustainable forest management can increase carbon storage by effecting changes in AGB and BGB, including soil organic carbon (Gazull and Gautier, 2015). With appropriate management, carbon stocks in forests and woodlands can recover and be maintained along with charcoal production (Iiyama et al., 2014b), thereby contributing to climate-change mitigation. According to FAO (2016a), even a 5 percent increase in the soil organic carbon pool by modifying land management could result in a reduction in the amount of atmospheric carbon of up to 16 percent.31 The response of soil organic carbon to changes in management practice can be complex, however, depending in part on (prior) land use (Jandl et al., 2007; Guo and Gifford, 2002; FAO, 2016a).
Bailis et al. (2009) demonstrated that GHG emissions can be reduced in the charcoal value chain by shifting from one-time charcoal production as a by-product of land clearance to a dedicated coppice-management system in which either native vegetation or exotic species are harvested periodically and carbonized. The magnitude of emission reductions varies depending on the coppice cycle as well as on the choice of tree species and the carbonization technology employed.
In the baseline scenario, a full-grown stand of native vegetation is completely cleared and wheat is planted on the cleared land. Additional scenarios assume an improvement in kiln technology combined with a shift towards sustainable post-harvest and coppice management.32 Table 13 shows the emission reductions achieved in charcoal production relative to the baseline scenario after 30 years of management. Averaged over 30 years, the scenarios generate annual carbon offsets ranging from 0.1 to 3.5 tonnes per hectare (Bailis, 2009).
TABLE 13Resulting carbon stock emission reductions from charcoal production relative to the baseline scenario after 30 years of management
Shifting from baseline scenario to: Resultant carbon emission reduction:
Improved kiln with no change in post-harvest management
3.4 t/ha
Coppice management and earth-mound kiln 20–105 t/ha
Coppice management and improved kiln 20–105 t/ha + 4.4–21.4 t/ha
Source: Bailis (2009).
31 Globally, soil organic carbon in the 0–30 cm surface layer comprises around 66.5 Gt CO2e. It is the largest terrestrial carbon pool, accounting for 2–3 times more carbon than is held in the atmosphere. Forests contain 39 percent of all carbon stored in soils. The amount of carbon in forest soils varies between regions and forest types (FAO, 2016a).
32 Coppice management yields 1.6–14 times the amount of deliverable energy per hectare relative to the baseline scenario.
Technical interventions for a greener charcoal value chain 61
Forest plantations for woodfuelThe intensive exploitation of sustainably managed forest plantations aimed at fuel production can be a way of increasing the availability of sustainable wood in an area and thereby reducing pressure on natural forests and woodlands and restoring degraded lands.
To fully capture the value of using plantations for charcoal production from sustainably sourced wood, the conversion of natural forests should be avoided. Even if a natural forest is degraded, it is preferable to improve its productivity through enrichment planting rather than convert it to a plantation or woodlot (AFREA, 2011). Plantations should be established on already deforested lands (AFREA, 2011).
Zomer et al. (2008) estimated the area of land in developing countries with potential for afforestation worldwide at 750 million hectares (although lower and higher estimates exist).33 South America accounts for an estimated 46 percent of this area and SSA for 27 percent (GIZ, 2014b).
There is an estimated 8 million hectares of woodfuel plantations worldwide, of which 6.7 million hectares are in Asia (GIZ, 2015). Less than 5 percent of woodfuel in SSA is derived from dedicated planted areas (Gazull and Gautier, 2015), but GIZ (2014b) projected that the importance of forest plantations will increase over time. For a range of reasons, such as poor management, economic trade-offs and a lack of know-how, many state and community-level plantations established in the 1970s failed in Africa (GIZ, 2015; Gazull and Gautier, 2015), but plantations (especially those owned by individuals) have increased in importance since the 1990s as a source of woodfuel in SSA (Gazull and Gautier, 2015). Intensive forest use for woodfuel production is being pursued in SSA (see Chapter 5); Box 7 presents examples of successful forest plantation programmes.
33 Benítez et al. (2007) indicated that 2 600–3 500 million hectares could be reforested. Zomer et al. (2008) identified 749 million hectares as biophysically suitable for reforestation and which met CDM afforestation/reforestation eligibility criteria. Thomson et al. (2007) conservatively estimated the potential reforestable area at 570 million hectares, which could sequester 120 Gt of carbon (440 Gt CO2) of above-ground carbon (assuming natural forest regeneration), but land-use change could reduce the amount stored to 80 Gt of carbon (294 Gt CO2) over the present century.
BOX 7
Examples of successful forest plantation programmes
• Brazil has more than 4 million hectares of large-scale eucalypt plantations to produce
charcoal (GIZ, 2015), managed on a five-year rotation (Bailis et al., 2013).
• Experiences in family-run plantations in the Democratic Republic of the Congo show that
a balance between natural forests and designated plantations is efficient and equitable
(Gazull and Gautier, 2015).
• In Madagascar, an individual-based reforestation scheme from 2002 to 2014 had pro-
duced, by 2010, an afforested area of 6 500 hectares in 57 villages and a sustainable
supply of wood for more than 80 000 urban woodfuel consumers, and it had avoided
the deforestation of 49 000 hectares of natural forests (GIZ, 2014b).
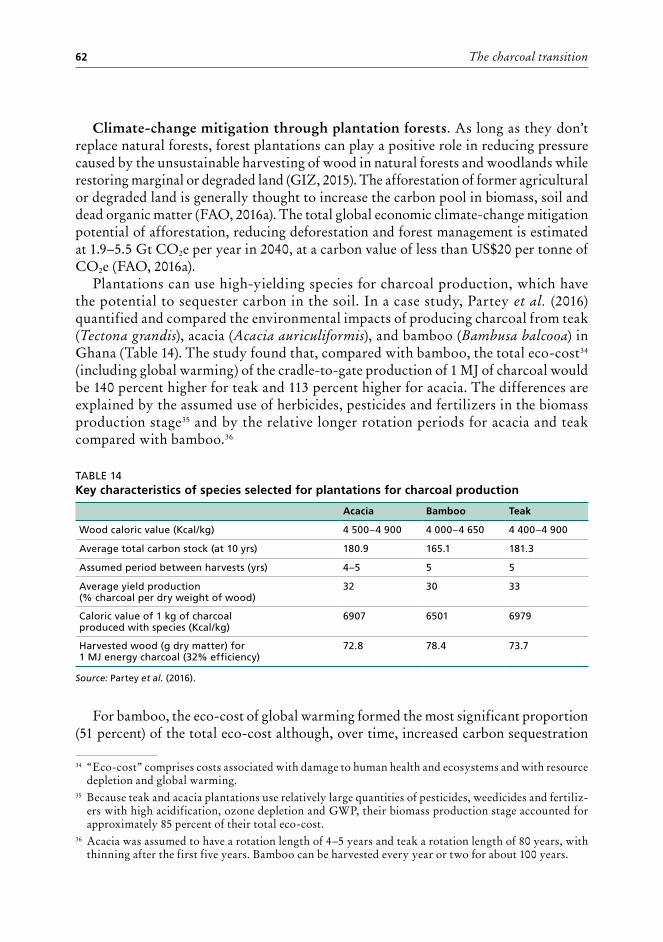
The charcoal transition62
Climate-change mitigation through plantation forests. As long as they don’t replace natural forests, forest plantations can play a positive role in reducing pressure caused by the unsustainable harvesting of wood in natural forests and woodlands while restoring marginal or degraded land (GIZ, 2015). The afforestation of former agricultural or degraded land is generally thought to increase the carbon pool in biomass, soil and dead organic matter (FAO, 2016a). The total global economic climate-change mitigation potential of afforestation, reducing deforestation and forest management is estimated at 1.9–5.5 Gt CO2e per year in 2040, at a carbon value of less than US$20 per tonne of CO2e (FAO, 2016a).
Plantations can use high-yielding species for charcoal production, which have the potential to sequester carbon in the soil. In a case study, Partey et al. (2016) quantified and compared the environmental impacts of producing charcoal from teak (Tectona grandis), acacia (Acacia auriculiformis), and bamboo (Bambusa balcooa) in Ghana (Table 14). The study found that, compared with bamboo, the total eco-cost34 (including global warming) of the cradle-to-gate production of 1 MJ of charcoal would be 140 percent higher for teak and 113 percent higher for acacia. The differences are explained by the assumed use of herbicides, pesticides and fertilizers in the biomass production stage35 and by the relative longer rotation periods for acacia and teak compared with bamboo.36
TABLE 14Key characteristics of species selected for plantations for charcoal production
Acacia Bamboo Teak
Wood caloric value (Kcal/kg) 4 500–4 900 4 000–4 650 4 400–4 900
Average total carbon stock (at 10 yrs) 180.9 165.1 181.3
Assumed period between harvests (yrs) 4–5 5 5
Average yield production (% charcoal per dry weight of wood)
32 30 33
Caloric value of 1 kg of charcoal produced with species (Kcal/kg)
6907 6501 6979
Harvested wood (g dry matter) for 1 MJ energy charcoal (32% efficiency)
72.8 78.4 73.7
Source: Partey et al. (2016).
For bamboo, the eco-cost of global warming formed the most significant proportion (51 percent) of the total eco-cost although, over time, increased carbon sequestration
34 “Eco-cost” comprises costs associated with damage to human health and ecosystems and with resource depletion and global warming.
35 Because teak and acacia plantations use relatively large quantities of pesticides, weedicides and fertiliz-ers with high acidification, ozone depletion and GWP, their biomass production stage accounted for approximately 85 percent of their total eco-cost.
36 Acacia was assumed to have a rotation length of 4–5 years and teak a rotation length of 80 years, with thinning after the first five years. Bamboo can be harvested every year or two for about 100 years.
Technical interventions for a greener charcoal value chain 63
could offset the carbon footprint of charcoal production using bamboo.37 All three species could offset their carbon footprints over time, but the extent would vary according to physiology and management (Partey et al., 2016).
Switch to alternative sources: residues and wasteSwitching to biomass residues and waste as the source of charcoal production could substantially reduce pressure on a country’s wood resources and reduce land-use-based emissions (UNDP, 2013). Such residues and waste may comprise:
• by-products from forest industry processes (e.g. sawdust, bark and black liquor);• primary forest residues (e.g. tops and branches) from existing silvicultural
operations such as salvage logging; and• agricultural residues.Estimates of the global energy potential of residues (agricultural and forestry combined)
in 2050 are in the range of 15–280 EJprim per year (Diaoglou, 2016), and analyses indicate that the potential energy supply from wood residues is considerable in developing countries. Especially in Africa, residues from the timber industry – comprising logging companies, sawmills, veneer and panel factories, etc. – are still a largely untapped resource (GIZ, 2015). In many parts of the tropics, wood industries waste huge volumes of wood that could provide raw material for bioenergy (Hofstad, Kohlin and Namaalwa, 2009); estimates for SSA indicate that as much as 1 000 Mt could theoretically be generated annually in the forest sector (Dasappa, 2011).38 The World Bank (2008) found that the effective average residue-recovery rate for logging operations in SSA was 0.134 tonnes of residue per tonne of roundwood produced.
GIZ (2015) estimated that the residues of just one sawmill in the Democratic Republic of the Congo could satisfy the annual demand for charcoal of around 29 000 people. In Cameroon, the timber industry generates residues of 2 million m3 annually (Owen, van der Plas and Sepp, 2013), and a study of logging operations in central Africa estimated that around 67 percent of wood residues were recoverable (Dramé, 2007).
Agricultural wastes can be used to produce charcoal or briquettes. Dasappa (2011) estimated that up to 140 Mt of waste from cereal stalks and husks is generated annually in SSA. For example, an estimated 1.7 Mt of available agricultural waste is generated each year in Uganda (compared with the 4.0 Mt of wood consumed to produce charcoal in 2006; UNDP, 2013).
Access to, and the recoverability of, forest and wood-processing residues in SSA may be constrained by the region’s poor transport infrastructure (World Bank, 2008). An important requirement for exploiting the full potential of residues in the region, therefore, is to provide the economic and logistical conditions needed to mobilize the resource.
37 The rate of carbon sequestration in a four-year-old bamboo plantation for charcoal production is esti-mated at about 400 kg of carbon per hectare per year. This is about four times the values estimated for teak and acacia.
38 Calculated by using a fraction of woodfuel production in total roundwood production for the SSA region.
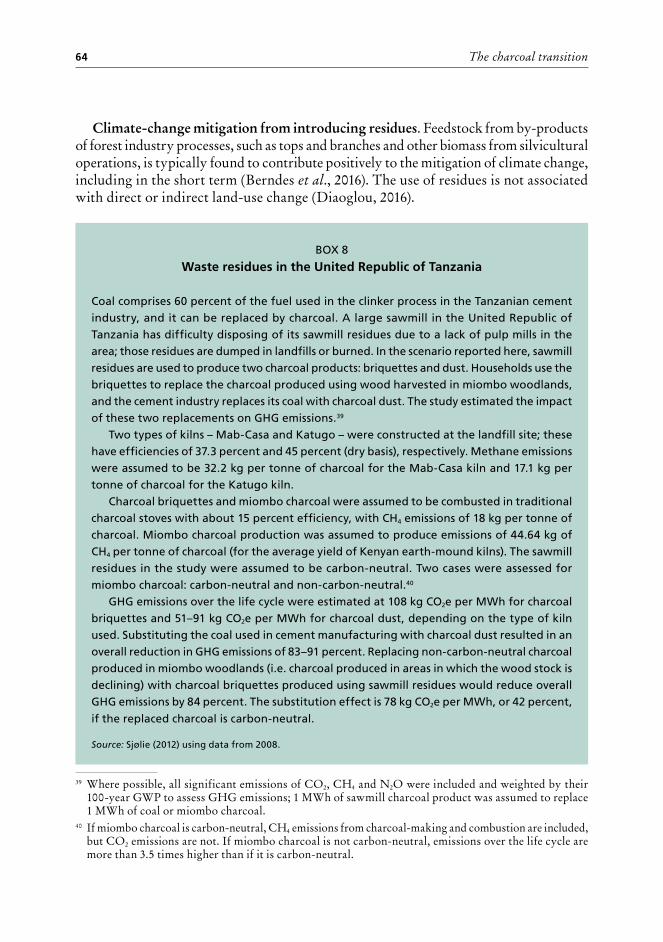
The charcoal transition64
Climate-change mitigation from introducing residues. Feedstock from by-products of forest industry processes, such as tops and branches and other biomass from silvicultural operations, is typically found to contribute positively to the mitigation of climate change, including in the short term (Berndes et al., 2016). The use of residues is not associated with direct or indirect land-use change (Diaoglou, 2016).
BOX 8
Waste residues in the United Republic of Tanzania
Coal comprises 60 percent of the fuel used in the clinker process in the Tanzanian cement industry, and it can be replaced by charcoal. A large sawmill in the United Republic of Tanzania has difficulty disposing of its sawmill residues due to a lack of pulp mills in the area; those residues are dumped in landfills or burned. In the scenario reported here, sawmill residues are used to produce two charcoal products: briquettes and dust. Households use the briquettes to replace the charcoal produced using wood harvested in miombo woodlands, and the cement industry replaces its coal with charcoal dust. The study estimated the impact of these two replacements on GHG emissions.39
Two types of kilns – Mab-Casa and Katugo – were constructed at the landfill site; these have efficiencies of 37.3 percent and 45 percent (dry basis), respectively. Methane emissions were assumed to be 32.2 kg per tonne of charcoal for the Mab-Casa kiln and 17.1 kg per tonne of charcoal for the Katugo kiln.
Charcoal briquettes and miombo charcoal were assumed to be combusted in traditional charcoal stoves with about 15 percent efficiency, with CH4 emissions of 18 kg per tonne of charcoal. Miombo charcoal production was assumed to produce emissions of 44.64 kg of CH4 per tonne of charcoal (for the average yield of Kenyan earth-mound kilns). The sawmill residues in the study were assumed to be carbon-neutral. Two cases were assessed for miombo charcoal: carbon-neutral and non-carbon-neutral.40
GHG emissions over the life cycle were estimated at 108 kg CO2e per MWh for charcoal briquettes and 51–91 kg CO2e per MWh for charcoal dust, depending on the type of kiln used. Substituting the coal used in cement manufacturing with charcoal dust resulted in an overall reduction in GHG emissions of 83–91 percent. Replacing non-carbon-neutral charcoal produced in miombo woodlands (i.e. charcoal produced in areas in which the wood stock is declining) with charcoal briquettes produced using sawmill residues would reduce overall GHG emissions by 84 percent. The substitution effect is 78 kg CO2e per MWh, or 42 percent,
if the replaced charcoal is carbon-neutral.
Source: Sjølie (2012) using data from 2008.
39 Where possible, all significant emissions of CO2, CH4 and N2O were included and weighted by their 100-year GWP to assess GHG emissions; 1 MWh of sawmill charcoal product was assumed to replace 1 MWh of coal or miombo charcoal.
40 If miombo charcoal is carbon-neutral, CH4 emissions from charcoal-making and combustion are included, but CO2 emissions are not. If miombo charcoal is not carbon-neutral, emissions over the life cycle are more than 3.5 times higher than if it is carbon-neutral.
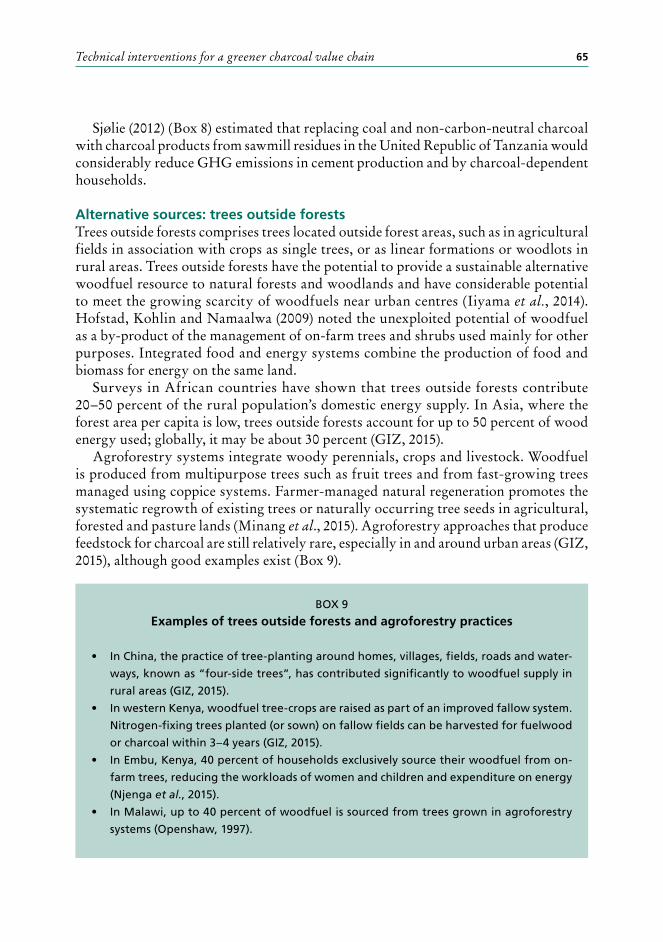
Technical interventions for a greener charcoal value chain 65
Sjølie (2012) (Box 8) estimated that replacing coal and non-carbon-neutral charcoal with charcoal products from sawmill residues in the United Republic of Tanzania would considerably reduce GHG emissions in cement production and by charcoal-dependent households.
Alternative sources: trees outside forests Trees outside forests comprises trees located outside forest areas, such as in agricultural fields in association with crops as single trees, or as linear formations or woodlots in rural areas. Trees outside forests have the potential to provide a sustainable alternative woodfuel resource to natural forests and woodlands and have considerable potential to meet the growing scarcity of woodfuels near urban centres (Iiyama et al., 2014). Hofstad, Kohlin and Namaalwa (2009) noted the unexploited potential of woodfuel as a by-product of the management of on-farm trees and shrubs used mainly for other purposes. Integrated food and energy systems combine the production of food and biomass for energy on the same land.
Surveys in African countries have shown that trees outside forests contribute 20–50 percent of the rural population’s domestic energy supply. In Asia, where the forest area per capita is low, trees outside forests account for up to 50 percent of wood energy used; globally, it may be about 30 percent (GIZ, 2015).
Agroforestry systems integrate woody perennials, crops and livestock. Woodfuel is produced from multipurpose trees such as fruit trees and from fast-growing trees managed using coppice systems. Farmer-managed natural regeneration promotes the systematic regrowth of existing trees or naturally occurring tree seeds in agricultural, forested and pasture lands (Minang et al., 2015). Agroforestry approaches that produce feedstock for charcoal are still relatively rare, especially in and around urban areas (GIZ, 2015), although good examples exist (Box 9).
BOX 9
Examples of trees outside forests and agroforestry practices
• In China, the practice of tree-planting around homes, villages, fields, roads and water-
ways, known as “four-side trees”, has contributed significantly to woodfuel supply in
rural areas (GIZ, 2015).
• In western Kenya, woodfuel tree-crops are raised as part of an improved fallow system.
Nitrogen-fixing trees planted (or sown) on fallow fields can be harvested for fuelwood
or charcoal within 3–4 years (GIZ, 2015).
• In Embu, Kenya, 40 percent of households exclusively source their woodfuel from on-
farm trees, reducing the workloads of women and children and expenditure on energy
(Njenga et al., 2015).
• In Malawi, up to 40 percent of woodfuel is sourced from trees grown in agroforestry
systems (Openshaw, 1997).
The charcoal transition66
A promising agroforestry technology is the use of rotational woodlots featuring fast-growing nitrogen-fixing tree species, which can produce good-quality wood for charcoal as well as fodder for livestock. Such woodlots allow farmers to interplant with food crops without reducing yields in the first two years, and yields may even improve following wood harvest (Kimaro et al., 2007).
Climate-change mitigation impacts of agroforestry. Agroforestry systems sequester carbon in vegetation and possibly soils. The more extensive use of the land for agricultural production may reduce the need for shifting cultivation, a driver of deforestation (Makundi and Sathaye, 2004).
The 8 000-hectare Mampu acacia plantation – the largest plantation for urban woodfuel supply in the Democratic Republic of the Congo – combines agroforestry with a system of rotational tree-planting. Total charcoal production is 8 000–12 000 tonnes per year, in addition to the production of agricultural crops. It is estimated that the plantation has a permanent carbon stock of 40 000–60 000 tonnes (SNV, 2013).
The wood products produced in agroforestry can substitute for similar products harvested unsustainably in natural forests (Makundi and Sathaye, 2004). Iiyama et al. (2014) suggested that, if widely adopted with improved kilns and stoves, agroforestry could significantly reduce wood-harvesting pressure on forests by sustainably supplying trees from farms, especially when higher wood productivities are realized.41
Alternative sources: briquettesCharcoal transportation and distribution produces quantities of charcoal in the form of dust. Briquettes can be made from charcoal dust in combination with by-products from agriculture42 (UNDP, 2014a) or timber production (e.g. sawdust) (Mwampamba et al., 2013). Briquettes of different sizes can be made, depending on the end use (UNDP, 2014a) and used as a supplement or alternative to fuelwood and charcoal. An agglomeration process is used to manufacture charcoal briquettes, which can be deployed either before carbonization (to form biomass briquettes to be carbonized) or after carbonization (to agglomerate charcoal particles into briquettes) (UNDP, 2013).
Charcoal briquettes have different physical and combustion properties to conventional wood charcoal. For example, they tend to have lower energy content and more volatile matter; combustion equipment must be retrofitted or redesigned, therefore, to burn briquettes efficiently (Mwampamba et al., 2013). The combustion properties of briquettes – such as calorific value, moisture content, volatile matter and ash content, and the emission of gases and particles – are influenced by the type and amount of raw materials (Njenga et al., 2013). For example, charcoal briquettes made from charcoal dust (80 percent) and soil (20 percent) burn longer than wood charcoal. Cooking with charcoal briquettes is 9 and 15 times cheaper than cooking with charcoal and kerosene, respectively.
41 Iiyama et al. (2014) mentioned an MAI of 4–10 tonnes per hectare per year in agroforestry systems.42 Charcoal dust lacks plasticity and therefore needs the addition of a sticking or agglomerating material
to enable the formation of briquettes (Rousset et al., 2011).
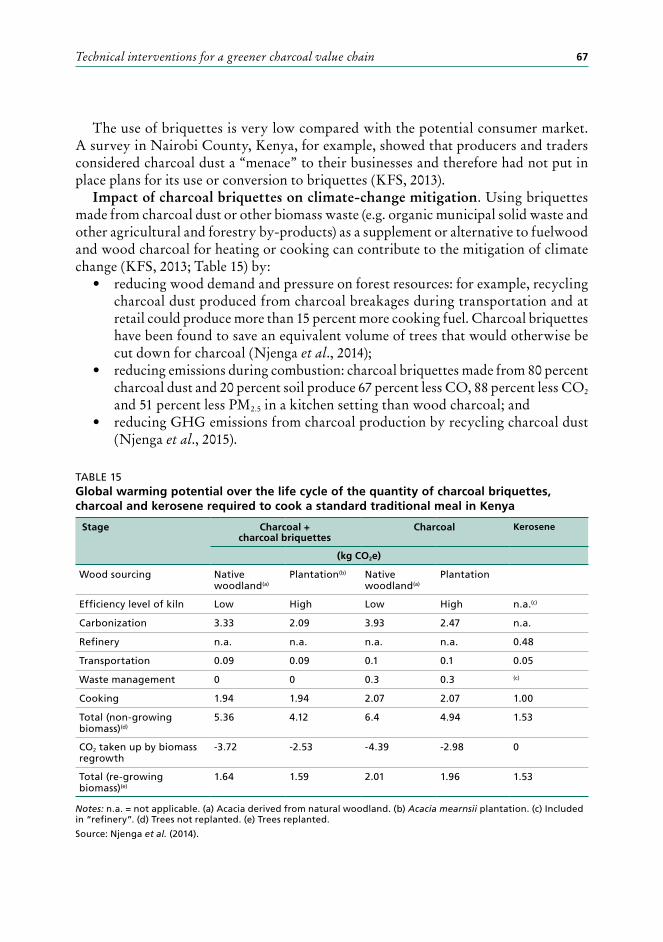
Technical interventions for a greener charcoal value chain 67
The use of briquettes is very low compared with the potential consumer market. A survey in Nairobi County, Kenya, for example, showed that producers and traders considered charcoal dust a “menace” to their businesses and therefore had not put in place plans for its use or conversion to briquettes (KFS, 2013).
Impact of charcoal briquettes on climate-change mitigation. Using briquettes made from charcoal dust or other biomass waste (e.g. organic municipal solid waste and other agricultural and forestry by-products) as a supplement or alternative to fuelwood and wood charcoal for heating or cooking can contribute to the mitigation of climate change (KFS, 2013; Table 15) by:
• reducing wood demand and pressure on forest resources: for example, recycling charcoal dust produced from charcoal breakages during transportation and at retail could produce more than 15 percent more cooking fuel. Charcoal briquettes have been found to save an equivalent volume of trees that would otherwise be cut down for charcoal (Njenga et al., 2014);
• reducing emissions during combustion: charcoal briquettes made from 80 percent charcoal dust and 20 percent soil produce 67 percent less CO, 88 percent less CO2 and 51 percent less PM2.5 in a kitchen setting than wood charcoal; and
• reducing GHG emissions from charcoal production by recycling charcoal dust (Njenga et al., 2015).
TABLE 15Global warming potential over the life cycle of the quantity of charcoal briquettes, charcoal and kerosene required to cook a standard traditional meal in Kenya
Stage Charcoal + charcoal briquettes
Charcoal Kerosene
(kg CO2e)
Wood sourcing Native woodland(a)
Plantation(b) Native woodland(a)
Plantation
Efficiency level of kiln Low High Low High n.a.(c)
Carbonization 3.33 2.09 3.93 2.47 n.a.
Refinery n.a. n.a. n.a. n.a. 0.48
Transportation 0.09 0.09 0.1 0.1 0.05
Waste management 0 0 0.3 0.3 (c)
Cooking 1.94 1.94 2.07 2.07 1.00
Total (non-growing biomass)(d)
5.36 4.12 6.4 4.94 1.53
CO2 taken up by biomass regrowth
-3.72 -2.53 -4.39 -2.98 0
Total (re-growing biomass)(e)
1.64 1.59 2.01 1.96 1.53
Notes: n.a. = not applicable. (a) Acacia derived from natural woodland. (b) Acacia mearnsii plantation. (c) Included in “refinery”. (d) Trees not replanted. (e) Trees replanted.
Source: Njenga et al. (2014).
The charcoal transition68
In Brazil, an LCA was conducted on charcoal briquettes produced from charcoal dust combined with starch (Rousset et al., 2011);43 the dust is produced during the production of charcoal sourced from sustainably managed planted eucalypt forests or from the steel industry. The assessment showed that more than 90 percent of sequestered carbon was due to biomass production for charcoal and the remainder was due to starch biomass production. An estimated 4 kg CO2e was sequestered per kg of briquette produced, due primarily to the use of a renewable raw material (charcoal dust) from sustainably managed eucalypt plantations.
UNEP (2014) estimated that a company in Abidjan, Côte d’Ivoire, producing briquettes from wood and agricultural waste collected locally could produce sufficient briquettes to avoid harvesting 4 800 hectares of forest per year, reducing CO2 emissions by more than 100 000 tonnes per year at full capacity.
4.2 CARBONIZATION In many developing countries, the efficiency of charcoal carbonization is well below the technological potential, and substantial GHG emission reductions could be realized. Bailis, Ezzati and Kammen (2003) estimated that roughly 70 percent of non-CO2 GHG emissions from charcoal production and use occur during the carbonization process, and modelling performed for the present report (see Chapter 3) indicates that carbonization contributes 73–82 percent of total non-CO2 emissions in the charcoal value chain.44
The potential for reducing GHG emissions in the carbonization process and increasing energy conversion efficiency, and the climate benefits that could be realized through cogeneration (in the case of industrial production), are discussed below.
Better management of traditional kilns and use of improved kilns The efficiency of traditional kilns is only 10–22 percent. Improving the management of such traditional kilns, or introducing improved kilns, can result in efficiencies as high as 30–40 percent (and potentially even higher), and less-variable yields (UNDP, 2013). Improved kiln conversion technologies can be classified broadly into the following five categories (GIZ, 2015): 1) earth kilns; 2) metal kilns; 3) brick kilns; 4) cement or masonry kilns; and 5) retort kilns.
Earth and metal kilns are considered to be mobile, while the other kiln types are stationary. Stationary kilns are used mostly in areas with substantial wood resources because the raw material must be collected and transported to the kiln. Stationary kilns are therefore particularly suitable for wood-energy plantations (GIZ, 2015).
Attempts have been made to “modernize” traditional pit kilns and surface earth-mound kilns. Earth kilns have the potential to increase recovery rates from 10 percent
43 The study assumed that 1 kg of briquettes (in terms of energy content) would be delivered to a port on the Atlantic coast of the United States of America or the nearest port in Europe. The dust (with a relative humidity up to 90 percent) is transported by truck from the production areas and stored in silos. It is screened, homogenized, milled and further dried. The starch used is extracted from babaçu pulp in the Amazon region as a by-product of the babaçu nut-based activated charcoal industry (Rousset et al., 2011).
44 Based on 100-year GWP. Values are for the maximum and average scenarios and exclude CO2 emissions.
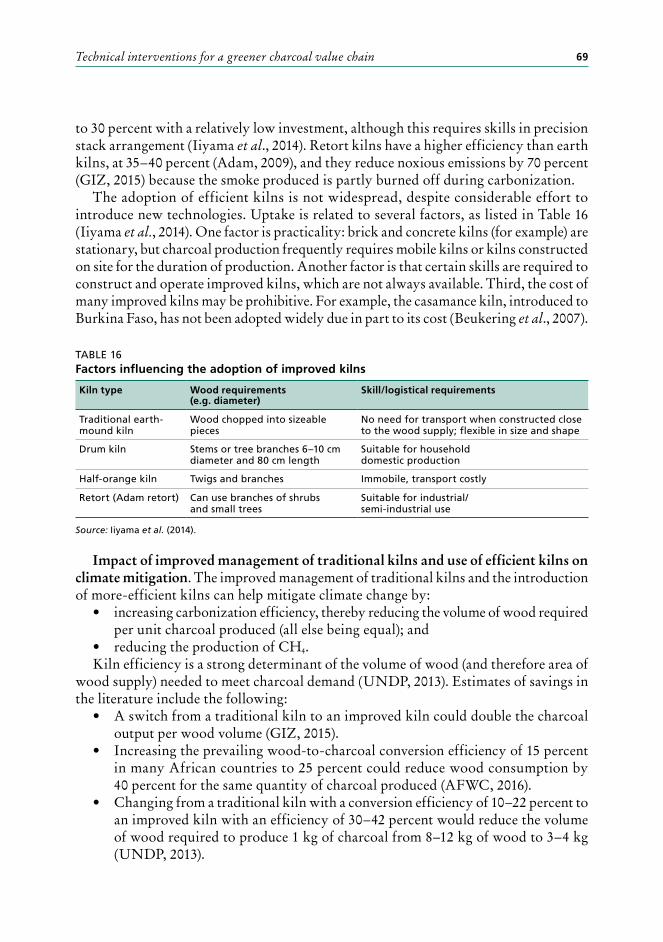
Technical interventions for a greener charcoal value chain 69
to 30 percent with a relatively low investment, although this requires skills in precision stack arrangement (Iiyama et al., 2014). Retort kilns have a higher efficiency than earth kilns, at 35–40 percent (Adam, 2009), and they reduce noxious emissions by 70 percent (GIZ, 2015) because the smoke produced is partly burned off during carbonization.
The adoption of efficient kilns is not widespread, despite considerable effort to introduce new technologies. Uptake is related to several factors, as listed in Table 16 (Iiyama et al., 2014). One factor is practicality: brick and concrete kilns (for example) are stationary, but charcoal production frequently requires mobile kilns or kilns constructed on site for the duration of production. Another factor is that certain skills are required to construct and operate improved kilns, which are not always available. Third, the cost of many improved kilns may be prohibitive. For example, the casamance kiln, introduced to Burkina Faso, has not been adopted widely due in part to its cost (Beukering et al., 2007).
TABLE 16Factors influencing the adoption of improved kilns
Kiln type Wood requirements (e.g. diameter)
Skill/logistical requirements
Traditional earth-mound kiln
Wood chopped into sizeable pieces
No need for transport when constructed close to the wood supply; flexible in size and shape
Drum kiln Stems or tree branches 6–10 cm diameter and 80 cm length
Suitable for household domestic production
Half-orange kiln Twigs and branches Immobile, transport costly
Retort (Adam retort) Can use branches of shrubs and small trees
Suitable for industrial/ semi-industrial use
Source: Iiyama et al. (2014).
Impact of improved management of traditional kilns and use of efficient kilns on climate mitigation. The improved management of traditional kilns and the introduction of more-efficient kilns can help mitigate climate change by:
• increasing carbonization efficiency, thereby reducing the volume of wood required per unit charcoal produced (all else being equal); and
• reducing the production of CH4. Kiln efficiency is a strong determinant of the volume of wood (and therefore area of
wood supply) needed to meet charcoal demand (UNDP, 2013). Estimates of savings in the literature include the following:
• A switch from a traditional kiln to an improved kiln could double the charcoal output per wood volume (GIZ, 2015).
• Increasing the prevailing wood-to-charcoal conversion efficiency of 15 percent in many African countries to 25 percent could reduce wood consumption by 40 percent for the same quantity of charcoal produced (AFWC, 2016).
• Changing from a traditional kiln with a conversion efficiency of 10–22 percent to an improved kiln with an efficiency of 30–42 percent would reduce the volume of wood required to produce 1 kg of charcoal from 8–12 kg of wood to 3–4 kg (UNDP, 2013).
The charcoal transition70
Given the large and increasing demand for charcoal, efficiency improvements in charcoal carbonization have significant potential to reduce wood demand. Such improvements are also important for alternative sources of biomass (e.g. wastes and by-products) because supply is limited; it is essential to use such resources efficiently to displace the quantity of baseline charcoal produced from wood (UNDP, 2013).
The use of improved industrial charcoal kilns can reduce CH4 emissions resulting from carbonization, with or without energy recovery (UNDP, 2013). Methane emissions can be fully avoided when pyrolysis gases are fully captured and combusted. Retort kilns avoid CH4 emissions by recycling flue gases that would otherwise be emitted into the atmosphere (GIZ, 2015). Semi-industrial kilns typically produce about 10 percent fewer CH4 emissions than traditional kilns (GIZ, 2014a; AFREA, 2011).
Bailis et al. (2005a) estimated that shifting from traditional to improved kilns would reduce GHG emissions by 22 percent if trees were harvested sustainably. The relative effect of introducing improved kilns on reducing GHG emissions is larger (55 percent) when trees are harvested non-sustainably because this also leads to a reduction of CO2 emissions from deforestation.
Njenga et al. (2014) and AFREA (2011) differentiated emission levels (expressed as CO2e) between traditional and improved kilns based on studies by (among others) Pennise et al. (2001) and Bailis et al. (2004). Industrial kilns emit 50 g CH4 per kg charcoal produced compared with 700 g per kg charcoal produced by traditional kilns.
A comparison of CH4 emissions from traditional kilns and improved kilns in Brazil showed a negative correlation between charcoal yield and CH4 emissions (UNFCCC, 2006).
Table 6 shows the range of emission values for carbonization found in the literature. A shift from traditional kilns (maximum values) to highly efficient kilns (minimum values) could result in a reduction of 4 541 g CO2e per kg charcoal produced (an 80 percent reduction) for a 100-year GWP and a reduction of 3 382 g CO2e per kg charcoal produced (a 95 percent reduction) when CO2 is excluded.
In addition to specific LCAs, various regional and country studies have measured the impact of introducing improved kiln technologies on GHG emissions. For example:
• The World Bank (2008) estimated CH4 emission reductions in SSA resulting from the replacement of traditional charcoal-making facilities with high-efficiency, low-emission retorts, based on the CDM framework and CDM project facilities. The implementation of these facilities would reduce carbon emissions by slightly more than 25 Mt CO2e in the production of about 20 Mt of charcoal.45
• Ekeh, Fangmeier and Müller (2014) studied GHG emissions from charcoal production, transportation and use in Kampala, Uganda, including an analysis
45 Some 2 031 CDM project activities were organized in SSA, and it was assumed that each would consist of 150 Adam retort facilities. In addition, eight small-scale CDM projects could be implemented. Assumptions were as follows: in the baseline scenario, a minimum charcoal yield of 250 kg can be obtained from about 1 200 kg wood. The Adam retort has a yield of 250 kg of charcoal from 650 kg of wood (dry basis). Each CDM project activity contains a minimum of 150 Adam retorts, with a total capacity of 9 855 tonnes of charcoal per year (World Bank, 2008).
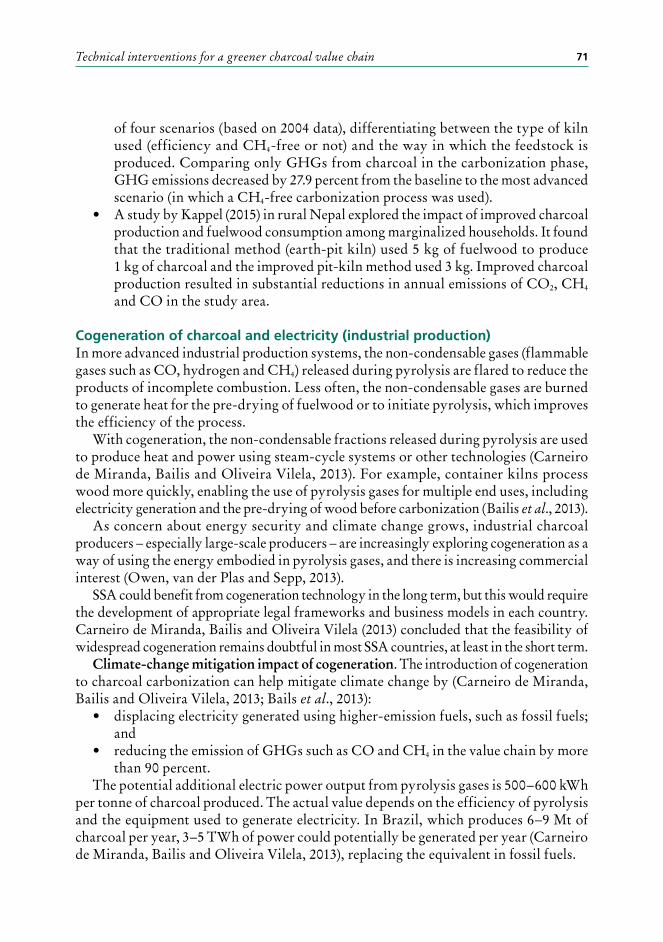
Technical interventions for a greener charcoal value chain 71
of four scenarios (based on 2004 data), differentiating between the type of kiln used (efficiency and CH4-free or not) and the way in which the feedstock is produced. Comparing only GHGs from charcoal in the carbonization phase, GHG emissions decreased by 27.9 percent from the baseline to the most advanced scenario (in which a CH4-free carbonization process was used).
• A study by Kappel (2015) in rural Nepal explored the impact of improved charcoal production and fuelwood consumption among marginalized households. It found that the traditional method (earth-pit kiln) used 5 kg of fuelwood to produce 1 kg of charcoal and the improved pit-kiln method used 3 kg. Improved charcoal production resulted in substantial reductions in annual emissions of CO2, CH4 and CO in the study area.
Cogeneration of charcoal and electricity (industrial production)In more advanced industrial production systems, the non-condensable gases (flammable gases such as CO, hydrogen and CH4) released during pyrolysis are flared to reduce the products of incomplete combustion. Less often, the non-condensable gases are burned to generate heat for the pre-drying of fuelwood or to initiate pyrolysis, which improves the efficiency of the process.
With cogeneration, the non-condensable fractions released during pyrolysis are used to produce heat and power using steam-cycle systems or other technologies (Carneiro de Miranda, Bailis and Oliveira Vilela, 2013). For example, container kilns process wood more quickly, enabling the use of pyrolysis gases for multiple end uses, including electricity generation and the pre-drying of wood before carbonization (Bailis et al., 2013).
As concern about energy security and climate change grows, industrial charcoal producers – especially large-scale producers – are increasingly exploring cogeneration as a way of using the energy embodied in pyrolysis gases, and there is increasing commercial interest (Owen, van der Plas and Sepp, 2013).
SSA could benefit from cogeneration technology in the long term, but this would require the development of appropriate legal frameworks and business models in each country. Carneiro de Miranda, Bailis and Oliveira Vilela (2013) concluded that the feasibility of widespread cogeneration remains doubtful in most SSA countries, at least in the short term.
Climate-change mitigation impact of cogeneration. The introduction of cogeneration to charcoal carbonization can help mitigate climate change by (Carneiro de Miranda, Bailis and Oliveira Vilela, 2013; Bails et al., 2013):
• displacing electricity generated using higher-emission fuels, such as fossil fuels; and
• reducing the emission of GHGs such as CO and CH4 in the value chain by more than 90 percent.
The potential additional electric power output from pyrolysis gases is 500–600 kWh per tonne of charcoal produced. The actual value depends on the efficiency of pyrolysis and the equipment used to generate electricity. In Brazil, which produces 6–9 Mt of charcoal per year, 3–5 TWh of power could potentially be generated per year (Carneiro de Miranda, Bailis and Oliveira Vilela, 2013), replacing the equivalent in fossil fuels.
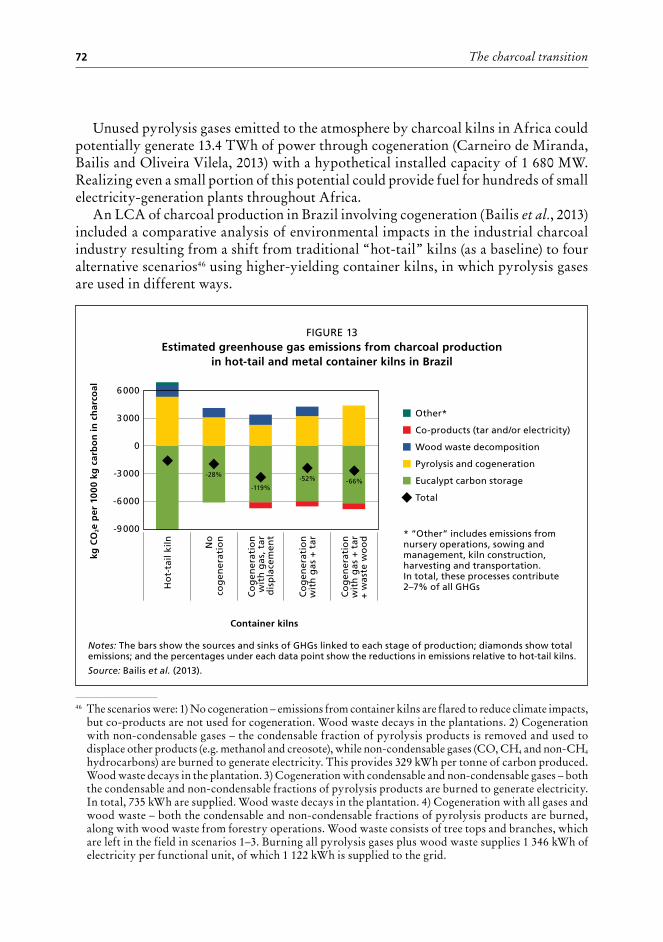
The charcoal transition72
Unused pyrolysis gases emitted to the atmosphere by charcoal kilns in Africa could potentially generate 13.4 TWh of power through cogeneration (Carneiro de Miranda, Bailis and Oliveira Vilela, 2013) with a hypothetical installed capacity of 1 680 MW. Realizing even a small portion of this potential could provide fuel for hundreds of small electricity-generation plants throughout Africa.
An LCA of charcoal production in Brazil involving cogeneration (Bailis et al., 2013) included a comparative analysis of environmental impacts in the industrial charcoal industry resulting from a shift from traditional “hot-tail” kilns (as a baseline) to four alternative scenarios46 using higher-yielding container kilns, in which pyrolysis gases are used in different ways.
46 The scenarios were: 1) No cogeneration – emissions from container kilns are flared to reduce climate impacts, but co-products are not used for cogeneration. Wood waste decays in the plantations. 2) Cogeneration with non-condensable gases – the condensable fraction of pyrolysis products is removed and used to displace other products (e.g. methanol and creosote), while non-condensable gases (CO, CH4 and non-CH4
hydrocarbons) are burned to generate electricity. This provides 329 kWh per tonne of carbon produced. Wood waste decays in the plantation. 3) Cogeneration with condensable and non-condensable gases – both the condensable and non-condensable fractions of pyrolysis products are burned to generate electricity. In total, 735 kWh are supplied. Wood waste decays in the plantation. 4) Cogeneration with all gases and wood waste – both the condensable and non-condensable fractions of pyrolysis products are burned, along with wood waste from forestry operations. Wood waste consists of tree tops and branches, which are left in the field in scenarios 1–3. Burning all pyrolysis gases plus wood waste supplies 1 346 kWh of electricity per functional unit, of which 1 122 kWh is supplied to the grid.
FIGURE 13Estimated greenhouse gas emissions from charcoal production
in hot-tail and metal container kilns in Brazil
Notes: The bars show the sources and sinks of GHGs linked to each stage of production; diamonds show total emissions; and the percentages under each data point show the reductions in emissions relative to hot-tail kilns.
Source: Bailis et al. (2013).
-9 000
6 000
0
3 000
-6 000
-3 000
kg C
O2e
per
10
00
kg c
arb
on
in
ch
arco
al
Ho
t-ta
il ki
ln No
co
gen
erat
ion
Co
gen
erat
ion
w
ith
gas
, tar
d
isp
lace
men
t
Co
gen
erat
ion
w
ith
gas
+ t
ar
Co
gen
erat
ion
w
ith
gas
+ t
ar
+ w
aste
wo
od
Other*
Pyrolysis and cogeneration
Wood waste decomposition
Total
Co-products (tar and/or electricity)
Eucalypt carbon storage
* “Other” includes emissions from nursery operations, sowing and management, kiln construction, harvesting and transportation. In total, these processes contribute 2–7% of all GHGs
-28%
-119%-52% -66%
Container kilns
Technical interventions for a greener charcoal value chain 73
Figure 13 shows that charcoal produced in metal container kilns with additional cogeneration capability could reduce the carbon footprint of conventional charcoal production (without cogeneration) in Brazil by more than 50 percent. GHG emission reductions are in the range of 28–119 percent (negative emissions are achieved by substituting fossil fuels), depending on the use of specific co-products.
4.3 TRANSPORTATIONThe technical potential to reduce GHG emissions during transportation is fairly low because this stage in the value chain makes a relatively small contribution to total GHG emissions.
Reducing fossil-fuel consumption and charcoal lossesThe introduction of cleaner modes of transport that use lower quantities of fossil fuels or more environmentally friendly fuels can reduce emissions from transportation and handling. The better organization of charcoal transportation to urban centres (e.g. by ensuring return loads and maintaining strategic collection points) can increase transport efficiency and therefore reduce fuel consumption.
The development of sustainable wood sources near urban centres would reduce transport distances and therefore the consumption of fuel in the transport phase (Minang et al., 2015; Gazull and Gautier, 2015).
Reducing the loss of charcoal during transportation would indirectly reduce GHG emissions from the charcoal value chain by increasing the availability of charcoal fines for the manufacture of briquettes.
4.4 END USETraditional stoves for heating and cooking at the household level are typically inefficient and generate considerable indoor air pollution, which can be deleterious to human health. Improved cook stoves have been deployed in many countries in attempts to improve cooking and heating efficiency and reduce indoor pollution in domestic households.
Although not discussed in detail in this publication, efficiency improvements could also be realized in (small-scale) industries through the introduction of improved furnaces with higher efficiencies and lower emissions. A case study of the large-scale steel industry showed that the injection of pulverized particles of charcoal to replace coal resulted in a reduction in CO2 emissions of 18–40 percent (Feliciano-Bruzual, 2014). Emissions of CO2 in China would be reduced by 37 Mt per year if all furnaces were as efficient as the largest currently in operation (IETD, 2017).
Shift towards improved stoves with higher efficienciesCharcoal can be burned cleanly and safely if prepared properly and used correctly in efficient appliances. Improved cook stoves tend to be convex in shape and insulated on all sides. Because of their insulation, they require less charcoal to generate an equivalent amount of useful heat, and they retain heat for longer (Beukering et al., 2007).
Various programmes and projects have been introduced with the aim of improving the energy efficiency of charcoal cook stoves and to reduce charcoal consumption (UNDP,
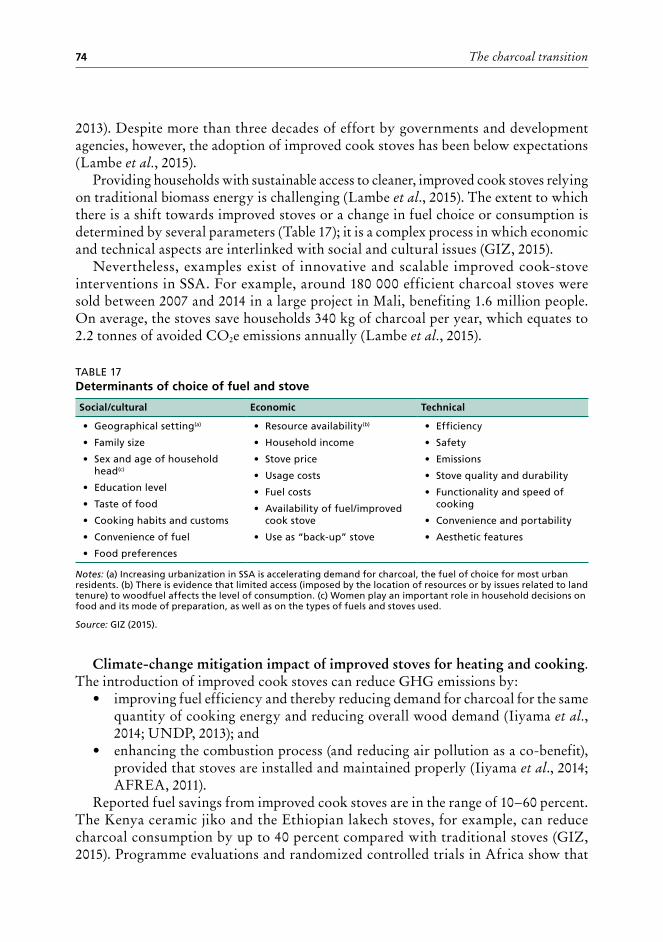
The charcoal transition74
2013). Despite more than three decades of effort by governments and development agencies, however, the adoption of improved cook stoves has been below expectations (Lambe et al., 2015).
Providing households with sustainable access to cleaner, improved cook stoves relying on traditional biomass energy is challenging (Lambe et al., 2015). The extent to which there is a shift towards improved stoves or a change in fuel choice or consumption is determined by several parameters (Table 17); it is a complex process in which economic and technical aspects are interlinked with social and cultural issues (GIZ, 2015).
Nevertheless, examples exist of innovative and scalable improved cook-stove interventions in SSA. For example, around 180 000 efficient charcoal stoves were sold between 2007 and 2014 in a large project in Mali, benefiting 1.6 million people. On average, the stoves save households 340 kg of charcoal per year, which equates to 2.2 tonnes of avoided CO2e emissions annually (Lambe et al., 2015).
TABLE 17Determinants of choice of fuel and stove
Social/cultural Economic Technical
• Geographical setting(a)
• Family size
• Sex and age of household head(c)
• Education level
• Taste of food
• Cooking habits and customs
• Convenience of fuel
• Food preferences
• Resource availability(b)
• Household income
• Stove price
• Usage costs
• Fuel costs
• Availability of fuel/improved cook stove
• Use as “back-up” stove
• Efficiency
• Safety
• Emissions
• Stove quality and durability
• Functionality and speed of cooking
• Convenience and portability
• Aesthetic features
Notes: (a) Increasing urbanization in SSA is accelerating demand for charcoal, the fuel of choice for most urban residents. (b) There is evidence that limited access (imposed by the location of resources or by issues related to land tenure) to woodfuel affects the level of consumption. (c) Women play an important role in household decisions on food and its mode of preparation, as well as on the types of fuels and stoves used.
Source: GIZ (2015).
Climate-change mitigation impact of improved stoves for heating and cooking. The introduction of improved cook stoves can reduce GHG emissions by:
• improving fuel efficiency and thereby reducing demand for charcoal for the same quantity of cooking energy and reducing overall wood demand (Iiyama et al., 2014; UNDP, 2013); and
• enhancing the combustion process (and reducing air pollution as a co-benefit), provided that stoves are installed and maintained properly (Iiyama et al., 2014; AFREA, 2011).
Reported fuel savings from improved cook stoves are in the range of 10–60 percent. The Kenya ceramic jiko and the Ethiopian lakech stoves, for example, can reduce charcoal consumption by up to 40 percent compared with traditional stoves (GIZ, 2015). Programme evaluations and randomized controlled trials in Africa show that
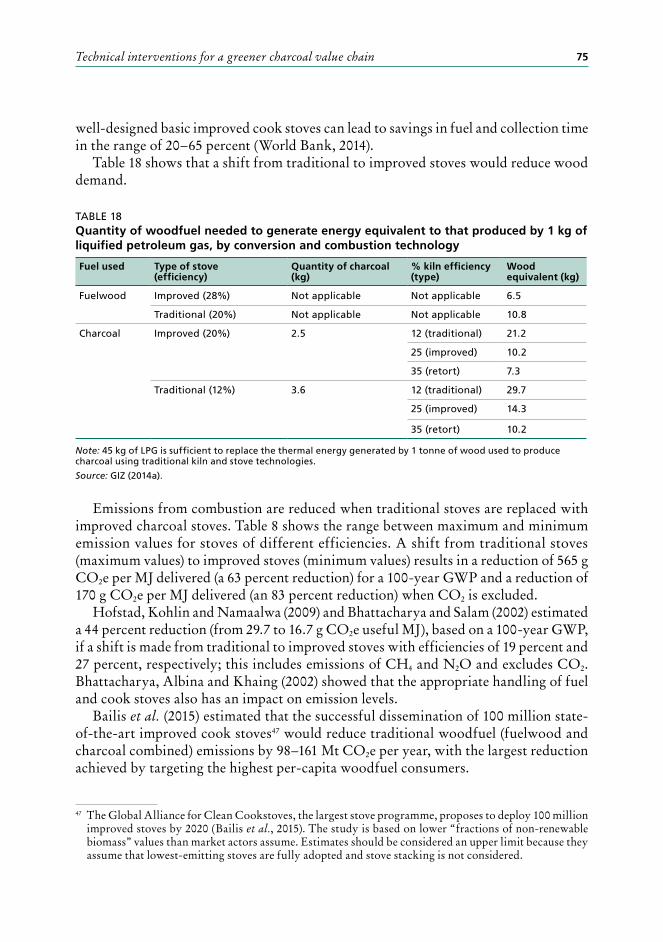
Technical interventions for a greener charcoal value chain 75
well-designed basic improved cook stoves can lead to savings in fuel and collection time in the range of 20–65 percent (World Bank, 2014).
Table 18 shows that a shift from traditional to improved stoves would reduce wood demand.
TABLE 18Quantity of woodfuel needed to generate energy equivalent to that produced by 1 kg of liquified petroleum gas, by conversion and combustion technology
Fuel used Type of stove (efficiency)
Quantity of charcoal (kg)
% kiln efficiency (type)
Wood equivalent (kg)
Fuelwood Improved (28%) Not applicable Not applicable 6.5
Traditional (20%) Not applicable Not applicable 10.8
Charcoal Improved (20%) 2.5 12 (traditional) 21.2
25 (improved) 10.2
35 (retort) 7.3
Traditional (12%) 3.6 12 (traditional) 29.7
25 (improved) 14.3
35 (retort) 10.2
Note: 45 kg of LPG is sufficient to replace the thermal energy generated by 1 tonne of wood used to produce charcoal using traditional kiln and stove technologies.
Source: GIZ (2014a).
Emissions from combustion are reduced when traditional stoves are replaced with improved charcoal stoves. Table 8 shows the range between maximum and minimum emission values for stoves of different efficiencies. A shift from traditional stoves (maximum values) to improved stoves (minimum values) results in a reduction of 565 g CO2e per MJ delivered (a 63 percent reduction) for a 100-year GWP and a reduction of 170 g CO2e per MJ delivered (an 83 percent reduction) when CO2 is excluded.
Hofstad, Kohlin and Namaalwa (2009) and Bhattacharya and Salam (2002) estimated a 44 percent reduction (from 29.7 to 16.7 g CO2e useful MJ), based on a 100-year GWP, if a shift is made from traditional to improved stoves with efficiencies of 19 percent and 27 percent, respectively; this includes emissions of CH4 and N2O and excludes CO2. Bhattacharya, Albina and Khaing (2002) showed that the appropriate handling of fuel and cook stoves also has an impact on emission levels.
Bailis et al. (2015) estimated that the successful dissemination of 100 million state-of-the-art improved cook stoves47 would reduce traditional woodfuel (fuelwood and charcoal combined) emissions by 98–161 Mt CO2e per year, with the largest reduction achieved by targeting the highest per-capita woodfuel consumers.
47 The Global Alliance for Clean Cookstoves, the largest stove programme, proposes to deploy 100 million improved stoves by 2020 (Bailis et al., 2015). The study is based on lower “fractions of non-renewable biomass” values than market actors assume. Estimates should be considered an upper limit because they assume that lowest-emitting stoves are fully adopted and stove stacking is not considered.
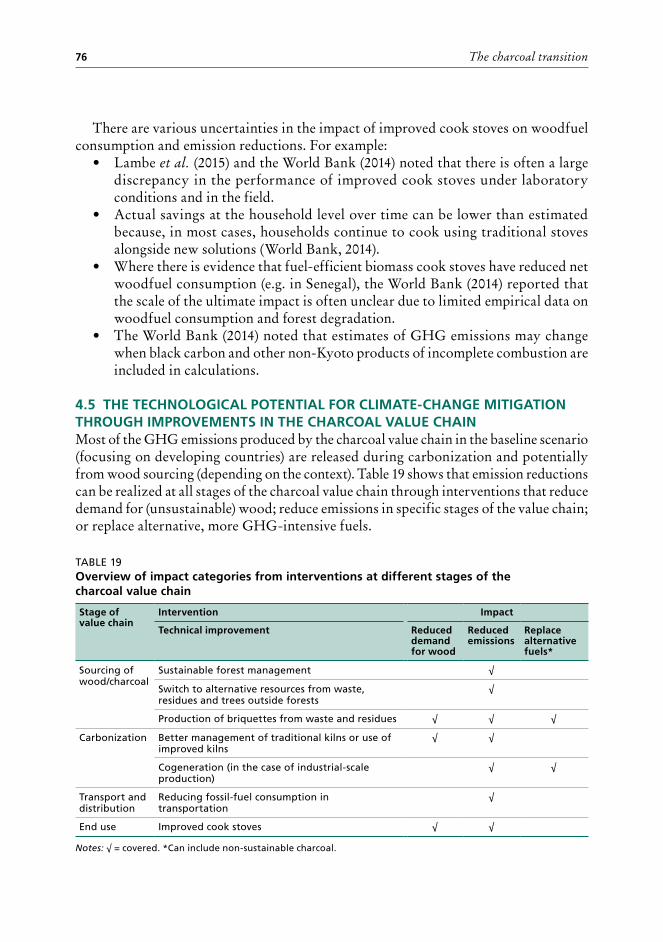
The charcoal transition76
There are various uncertainties in the impact of improved cook stoves on woodfuel consumption and emission reductions. For example:
• Lambe et al. (2015) and the World Bank (2014) noted that there is often a large discrepancy in the performance of improved cook stoves under laboratory conditions and in the field.
• Actual savings at the household level over time can be lower than estimated because, in most cases, households continue to cook using traditional stoves alongside new solutions (World Bank, 2014).
• Where there is evidence that fuel-efficient biomass cook stoves have reduced net woodfuel consumption (e.g. in Senegal), the World Bank (2014) reported that the scale of the ultimate impact is often unclear due to limited empirical data on woodfuel consumption and forest degradation.
• The World Bank (2014) noted that estimates of GHG emissions may change when black carbon and other non-Kyoto products of incomplete combustion are included in calculations.
4.5 THE TECHNOLOGICAL POTENTIAL FOR CLIMATE-CHANGE MITIGATION THROUGH IMPROVEMENTS IN THE CHARCOAL VALUE CHAINMost of the GHG emissions produced by the charcoal value chain in the baseline scenario (focusing on developing countries) are released during carbonization and potentially from wood sourcing (depending on the context). Table 19 shows that emission reductions can be realized at all stages of the charcoal value chain through interventions that reduce demand for (unsustainable) wood; reduce emissions in specific stages of the value chain; or replace alternative, more GHG-intensive fuels.
TABLE 19Overview of impact categories from interventions at different stages of the charcoal value chain
Stage of value chain
Intervention Impact
Technical improvement Reduced demand for wood
Reduced emissions
Replace alternative fuels*
Sourcing of wood/charcoal
Sustainable forest management √
Switch to alternative resources from waste, residues and trees outside forests
√
Production of briquettes from waste and residues √ √ √
Carbonization Better management of traditional kilns or use of improved kilns
√ √
Cogeneration (in the case of industrial-scale production)
√ √
Transport and distribution
Reducing fossil-fuel consumption in transportation
√
End use Improved cook stoves √ √
Notes: √ = covered. *Can include non-sustainable charcoal.
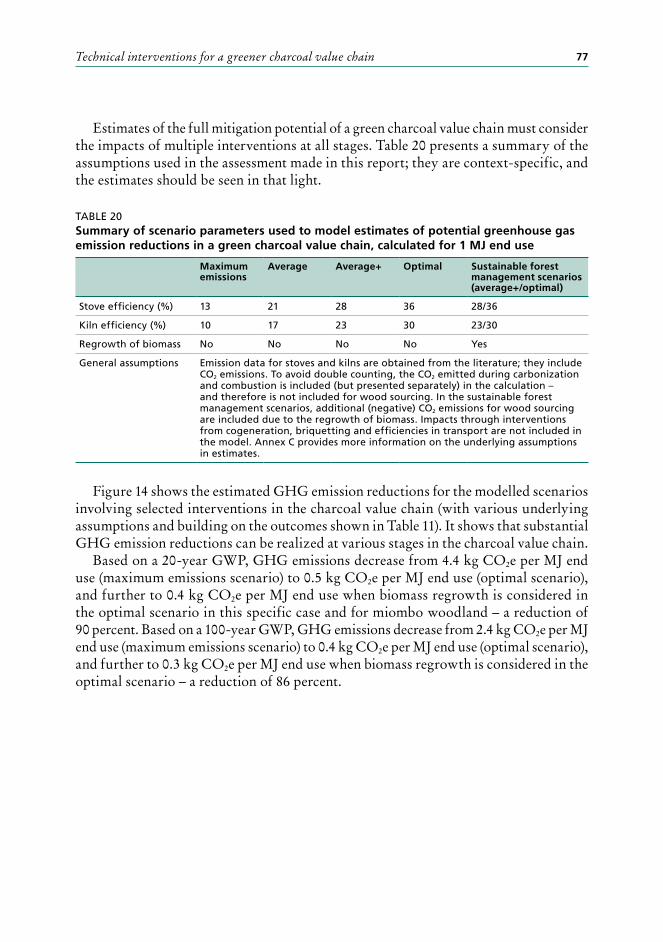
Technical interventions for a greener charcoal value chain 77
Estimates of the full mitigation potential of a green charcoal value chain must consider the impacts of multiple interventions at all stages. Table 20 presents a summary of the assumptions used in the assessment made in this report; they are context-specific, and the estimates should be seen in that light.
TABLE 20Summary of scenario parameters used to model estimates of potential greenhouse gas emission reductions in a green charcoal value chain, calculated for 1 MJ end use
Maximum emissions
Average Average+ Optimal Sustainable forest management scenarios (average+/optimal)
Stove efficiency (%) 13 21 28 36 28/36
Kiln efficiency (%) 10 17 23 30 23/30
Regrowth of biomass No No No No Yes
General assumptions Emission data for stoves and kilns are obtained from the literature; they include CO2 emissions. To avoid double counting, the CO2 emitted during carbonization and combustion is included (but presented separately) in the calculation – and therefore is not included for wood sourcing. In the sustainable forest management scenarios, additional (negative) CO2 emissions for wood sourcing are included due to the regrowth of biomass. Impacts through interventions from cogeneration, briquetting and efficiencies in transport are not included in the model. Annex C provides more information on the underlying assumptions in estimates.
Figure 14 shows the estimated GHG emission reductions for the modelled scenarios involving selected interventions in the charcoal value chain (with various underlying assumptions and building on the outcomes shown in Table 11). It shows that substantial GHG emission reductions can be realized at various stages in the charcoal value chain.
Based on a 20-year GWP, GHG emissions decrease from 4.4 kg CO2e per MJ end use (maximum emissions scenario) to 0.5 kg CO2e per MJ end use (optimal scenario), and further to 0.4 kg CO2e per MJ end use when biomass regrowth is considered in the optimal scenario in this specific case and for miombo woodland – a reduction of 90 percent. Based on a 100-year GWP, GHG emissions decrease from 2.4 kg CO2e per MJ end use (maximum emissions scenario) to 0.4 kg CO2e per MJ end use (optimal scenario), and further to 0.3 kg CO2e per MJ end use when biomass regrowth is considered in the optimal scenario – a reduction of 86 percent.
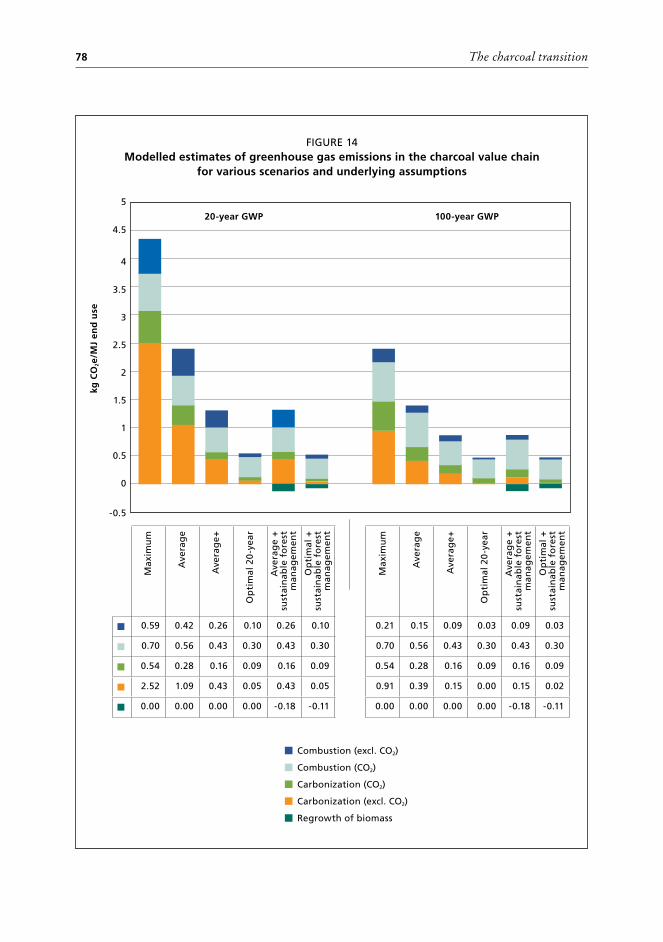
The charcoal transition78
FIGURE 14Modelled estimates of greenhouse gas emissions in the charcoal value chain
for various scenarios and underlying assumptions
0
3
3.5
4
4.5
5
2.5
1.5
2
0.5
-0.5
1
kg C
O2e
/MJ
end
use
20-year GWP 100-year GWP
Max
imu
m
Ave
rag
e
Ave
rag
e+
Op
tim
al 2
0-y
ear
Ave
rag
e +
su
stai
nab
le f
ore
st
man
agem
ent
Op
tim
al +
su
stai
nab
le f
ore
st
man
agem
ent
0.59 0.42 0.26 0.10 0.26 0.10
0.70 0.56 0.43 0.30 0.43 0.30
0.54 0.28 0.16 0.09 0.16 0.09
2.52 1.09 0.43 0.05 0.43 0.05
0.00 0.00 0.00 0.00 -0.18 -0.11
Max
imu
m
Ave
rag
e
Ave
rag
e+
Op
tim
al 2
0-y
ear
Ave
rag
e +
su
stai
nab
le f
ore
st
man
agem
ent
Op
tim
al +
su
stai
nab
le f
ore
st
man
agem
ent
0.21 0.15 0.09 0.03 0.09 0.03
0.70 0.56 0.43 0.30 0.43 0.30
0.54 0.28 0.16 0.09 0.16 0.09
0.91 0.39 0.15 0.00 0.15 0.02
0.00 0.00 0.00 0.00 -0.18 -0.11
Combustion (excl. CO2)
Carbonization (excl. CO2)
Carbonization (CO2)
Combustion (CO2)
Regrowth of biomass
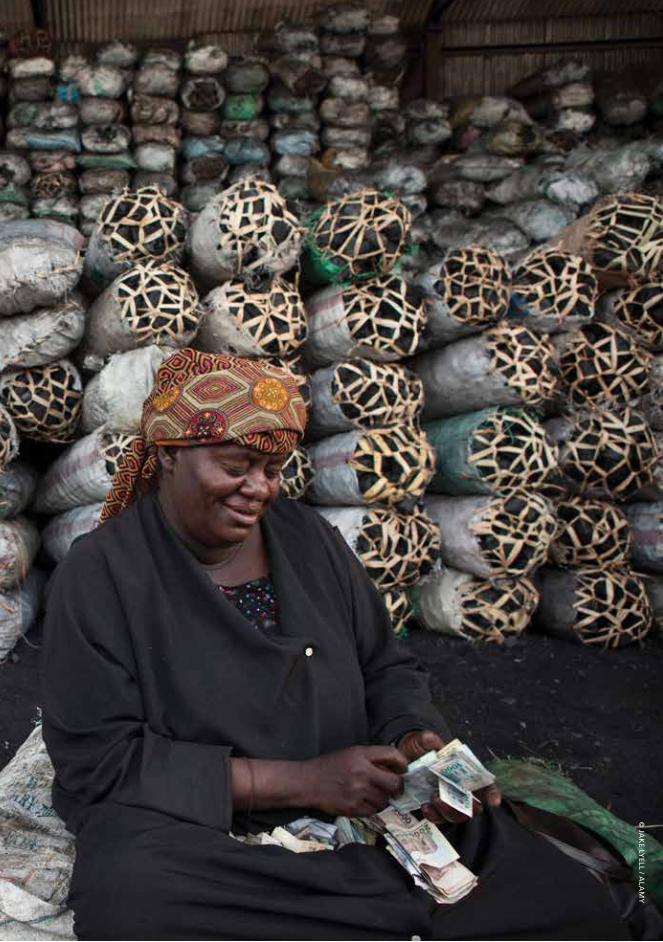
© JA
KE LY
ELL / ALA
MY
81
5 Costs and benefits of greening the charcoal value chain
KEY POINTS• The charcoal sector provides millions of people with access to affordable
energy, as well as cash revenue for more than 40 million participants in the charcoal value chain.
• Sustainable charcoal production is often economically unviable due to the undervaluation of resources and inefficiencies in carbonization and end use.
• The informality and lack of enforcement in the charcoal value chain mean that governments forego millions of dollars in taxes and licensing fees and incur costs due to environmental and health externalities.
• A shift towards a greener charcoal value chain would likely result in an increase in charcoal production costs and in changes to costs and benefits – and their distribution – throughout the value chain.
• A transition from unsustainable to sustainable wood sourcing and efficient carbonization and end use and from informal to formal institutions would impose high transaction costs on the charcoal value chain, primarily in establishing and enforcing sustainable forest management and transferring capacity, knowledge and technologies.
• Investments are needed to compensate part of these costs, especially in the start-up phase.
• At a national level, the benefits of greening the charcoal sector include increased government revenues and more sustainable income for those involved in commercial charcoal production and sale.
• African countries could potentially reinvest US$1.5 billion–US$3.9 billion in greening the charcoal value chain using annual revenues currently foregone due to the informality of the sector.
• Greening the charcoal sector could generate revenues from climate funds for avoiding GHG emissions and sequestering carbon.
The interventions proposed in Chapter 4 aim to increase the sustainability of the charcoal value chain and reduce GHG emissions. Realizing the potential at a large scale requires supportive economic conditions and incentives in the charcoal sector. This chapter addresses the economic context and characteristics of the largely informal charcoal value chain and the economic costs and benefits of interventions designed to green the value chain.
The charcoal transition82
5.1 COST AND BENEFITS OF THE CHARCOAL VALUE CHAIN, BUSINESS AS USUALThis section focuses on the baseline costs and benefits of the charcoal value chain, highlighting the hidden costs in the business-as-usual approach due to mismanagement at the various steps of the value chain.
Costs and benefits of the charcoal value chainIn many cases, the distribution of costs and benefits in the business-as-usual charcoal value chain does not adequately reflect the value of resources and labour inputs. Generally, a large part of the revenue goes to “connectors” in the value chain (e.g. middlemen, transporters and wholesalers), a relatively small portion goes to charcoal producers, and virtually nothing goes to the management of forests and trees (UNDP, 2014a).
The often-unregulated production of charcoal does not create an enabling environment for investments in improved methods and technologies for wood extraction and carbonization (AFREA, 2011). Two main factors distort markets and the value chain to the point where sustainable production is economically unviable (Owen, van der Plas and Sepp, 2013; AFREA, 2011):
1. free access to forest resources, and market prices that do not reflect the full cost of resource management; and
2. a lack of regulation of woodfuel production and trade.The perception of “free” wood arises because most costs are treated as economic
externalities or because there is a lack of exclusiveness in access to tree resources under prevailing tenure arrangements (Iiyama et al., 2016). The “free” nature of available resources undermines efforts by producers to invest in long-term sustainable forest management and to create plantations and woodlots (AFREA, 2011). The failure to capture the real economic value of trees renders the economics of sustainable tree-growing – in which planting and maintenance costs must be paid – unviable in the face of competition with open-access resources (GIZ, 2015).
The sourcing of “free” wood also undermines efforts by producers to invest in efficiency savings through improved conversion technologies. Therefore, charcoal is still mostly produced using traditional kiln techniques (AFREA, 2011); when wood resources on a piece of land are exhausted, production shifts to new supply locations, resulting in a constant expansion of the charcoal catchment area. Dwindling supply, coupled with increasing distances, inevitably leads to price increases for urban households (Iiyama et al., 2014b).
In many countries, licences and levies on charcoal production (often collected during transport) are largely evaded because of a lack of regulation or enforcement (GIZ, 2015). Often, taxes are calculated based on the number of bags of produced charcoal, irrespective of the amount of raw material used, and there is insufficient control at harvesting and production sites, leading to widespread wastage and reducing the incentive for charcoal producers to invest in improved technologies (GIZ, 2015). Corruption and irregularities at checkpoints and roadsides enable many traders to evade formal taxes (DIE, 2016). Mwampamba (2007), for example, found that less than
Costs and benefits of greening the charcoal value chain 83
40 percent of taxes owing on charcoal transportation were collected in the United Republic of Tanzania.
Charcoal dealers operating in formal value chains often face high formal transaction costs; hence, they generate lower profits and higher prices than those operating informally (DIE, 2016), undermining legal compliance (AFREA, 2011). The tax system in Burkina Faso, for example, may be seen as punishing producers who operate sustainably because illegal collectors do not pay tax (SNV, 2013). Unofficial “fees” (i.e. bribes) may also be collected: in Côte d’Ivoire, for example, charcoal trade officially requires only a transport permit, but enforcement officials collect unofficial fees en route, significantly increasing the cost of transporting charcoal (UNDP, 2014a).
From the perspective of end users, the relative affordability and immediate cooking costs of various energy options are often more important than relative fuel savings (World Bank, 2014). Charcoal is the preferred option in many households because it is cheaper than kerosene, LPG and electricity in most cities and available in small quantities that can be purchased daily (GIZ, 2014a).48
The dissemination of improved stoves often fails because low charcoal prices reduce the incentive for uptake (GIZ, 2015). Another reason for low adoption rates might be that improved stoves are too expensive, particularly for poorer urban households, and need to be replaced frequently (Hofstad, Kohlin and Namaalwa, 2009).
Economic costs and benefits of the charcoal sector in sub-Saharan Africa, business as usualAlthough woodfuel is produced mainly by the informal sector in SSA, it is a major economic activity (Gazull and Gautier, 2015) that is important in many national econo-mies. AFREA (2011) estimated that the charcoal industry in SSA was worth more than US$8 billion in 2007 and that its economic value may exceed US$12 billion by 2030. The charcoal sector in the United Republic of Tanzania contributes an estimated US$650 mil-lion per year to the country’s economy (World Bank, 2010); a recent survey in Kenya (KFS, 2013) estimated that the country’s charcoal sector represented an economic value of US$1.6 billion.
The financial value of the wood-based bioenergy sector in national economies is likely underestimated (GIZ, 2014b) because official data are lacking in many countries (AFWC, 2016). The informality of the charcoal sector combined with cost and price distortions in its value chain produces various hidden costs and missed benefits at a national and regional scale. These include:
• missed state revenues – foregone taxes and licensing fees;• informal income and employment;• economic efficiency losses (expenditures); and• hidden costs due to environmental and health externalities.
48 In addition to the characteristics of the value chain, (relative) charcoal consumer prices may be influenced by short- and long-term factors such as LPG price fluctuations, kerosene price fluctuations, consumer inflation, population growth and urbanization trends (Iiyama et al., 2013).
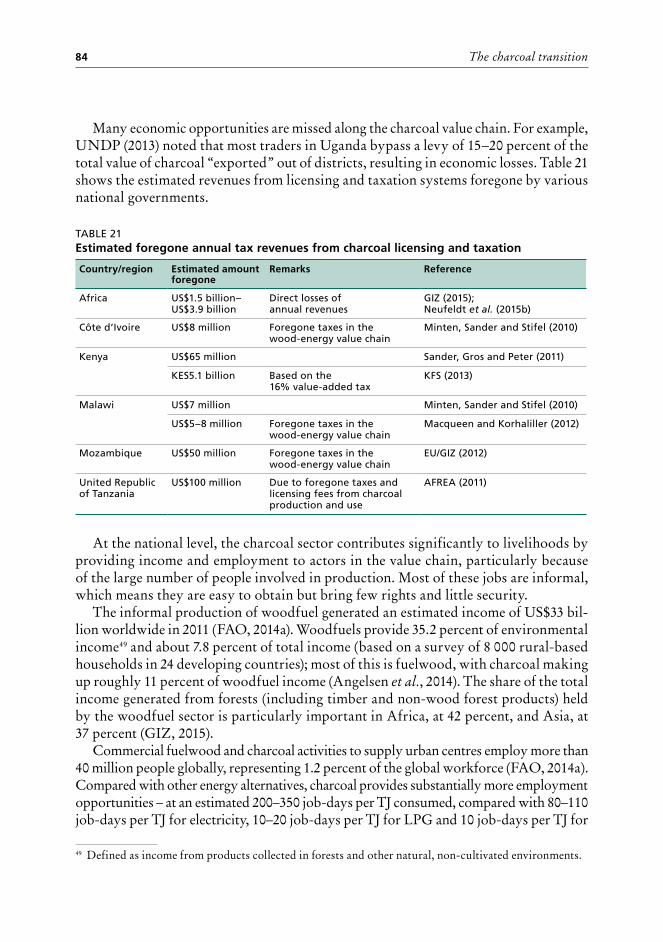
The charcoal transition84
Many economic opportunities are missed along the charcoal value chain. For example, UNDP (2013) noted that most traders in Uganda bypass a levy of 15–20 percent of the total value of charcoal “exported” out of districts, resulting in economic losses. Table 21 shows the estimated revenues from licensing and taxation systems foregone by various national governments.
TABLE 21Estimated foregone annual tax revenues from charcoal licensing and taxation
Country/region Estimated amount foregone
Remarks Reference
Africa US$1.5 billion–US$3.9 billion
Direct losses of annual revenues
GIZ (2015); Neufeldt et al. (2015b)
Côte d’Ivoire US$8 million Foregone taxes in the wood-energy value chain
Minten, Sander and Stifel (2010)
Kenya US$65 million Sander, Gros and Peter (2011)
KES5.1 billion Based on the 16% value-added tax
KFS (2013)
Malawi US$7 million Minten, Sander and Stifel (2010)
US$5–8 million Foregone taxes in the wood-energy value chain
Macqueen and Korhaliller (2012)
Mozambique US$50 million Foregone taxes in the wood-energy value chain
EU/GIZ (2012)
United Republic of Tanzania
US$100 million Due to foregone taxes and licensing fees from charcoal production and use
AFREA (2011)
At the national level, the charcoal sector contributes significantly to livelihoods by providing income and employment to actors in the value chain, particularly because of the large number of people involved in production. Most of these jobs are informal, which means they are easy to obtain but bring few rights and little security.
The informal production of woodfuel generated an estimated income of US$33 bil-lion worldwide in 2011 (FAO, 2014a). Woodfuels provide 35.2 percent of environmental income49 and about 7.8 percent of total income (based on a survey of 8 000 rural-based households in 24 developing countries); most of this is fuelwood, with charcoal making up roughly 11 percent of woodfuel income (Angelsen et al., 2014). The share of the total income generated from forests (including timber and non-wood forest products) held by the woodfuel sector is particularly important in Africa, at 42 percent, and Asia, at 37 percent (GIZ, 2015).
Commercial fuelwood and charcoal activities to supply urban centres employ more than 40 million people globally, representing 1.2 percent of the global workforce (FAO, 2014a). Compared with other energy alternatives, charcoal provides substantially more employment opportunities – at an estimated 200–350 job-days per TJ consumed, compared with 80–110 job-days per TJ for electricity, 10–20 job-days per TJ for LPG and 10 job-days per TJ for
49 Defined as income from products collected in forests and other natural, non-cultivated environments.
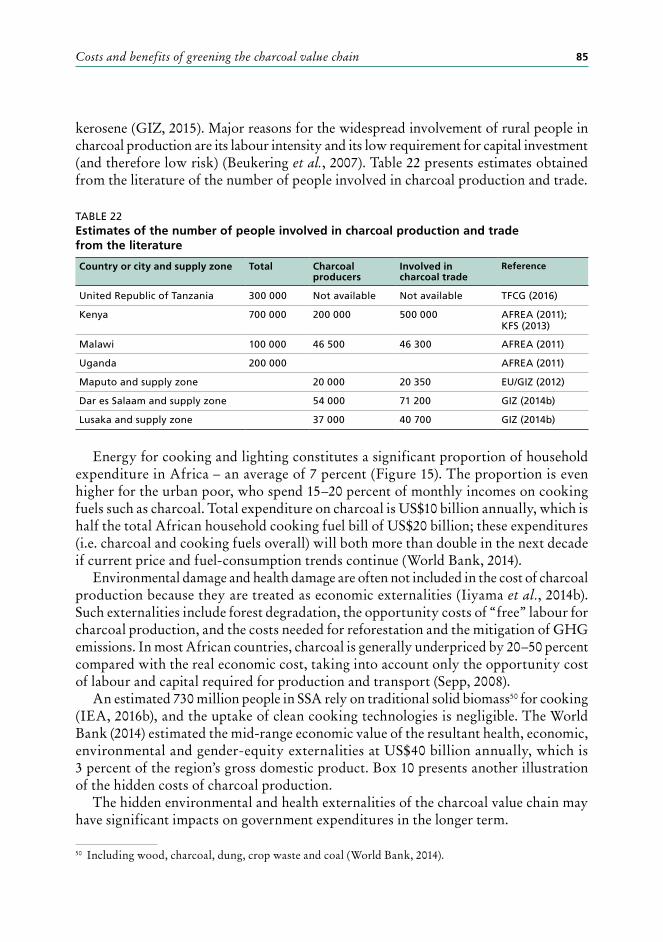
Costs and benefits of greening the charcoal value chain 85
kerosene (GIZ, 2015). Major reasons for the widespread involvement of rural people in charcoal production are its labour intensity and its low requirement for capital investment (and therefore low risk) (Beukering et al., 2007). Table 22 presents estimates obtained from the literature of the number of people involved in charcoal production and trade.
TABLE 22Estimates of the number of people involved in charcoal production and trade from the literature
Country or city and supply zone Total Charcoal producers
Involved in charcoal trade
Reference
United Republic of Tanzania 300 000 Not available Not available TFCG (2016)
Kenya 700 000 200 000 500 000 AFREA (2011); KFS (2013)
Malawi 100 000 46 500 46 300 AFREA (2011)
Uganda 200 000 AFREA (2011)
Maputo and supply zone 20 000 20 350 EU/GIZ (2012)
Dar es Salaam and supply zone 54 000 71 200 GIZ (2014b)
Lusaka and supply zone 37 000 40 700 GIZ (2014b)
Energy for cooking and lighting constitutes a significant proportion of household expenditure in Africa – an average of 7 percent (Figure 15). The proportion is even higher for the urban poor, who spend 15–20 percent of monthly incomes on cooking fuels such as charcoal. Total expenditure on charcoal is US$10 billion annually, which is half the total African household cooking fuel bill of US$20 billion; these expenditures (i.e. charcoal and cooking fuels overall) will both more than double in the next decade if current price and fuel-consumption trends continue (World Bank, 2014).
Environmental damage and health damage are often not included in the cost of charcoal production because they are treated as economic externalities (Iiyama et al., 2014b). Such externalities include forest degradation, the opportunity costs of “free” labour for charcoal production, and the costs needed for reforestation and the mitigation of GHG emissions. In most African countries, charcoal is generally underpriced by 20–50 percent compared with the real economic cost, taking into account only the opportunity cost of labour and capital required for production and transport (Sepp, 2008).
An estimated 730 million people in SSA rely on traditional solid biomass50 for cooking (IEA, 2016b), and the uptake of clean cooking technologies is negligible. The World Bank (2014) estimated the mid-range economic value of the resultant health, economic, environmental and gender-equity externalities at US$40 billion annually, which is 3 percent of the region’s gross domestic product. Box 10 presents another illustration of the hidden costs of charcoal production.
The hidden environmental and health externalities of the charcoal value chain may have significant impacts on government expenditures in the longer term.
50 Including wood, charcoal, dung, crop waste and coal (World Bank, 2014).
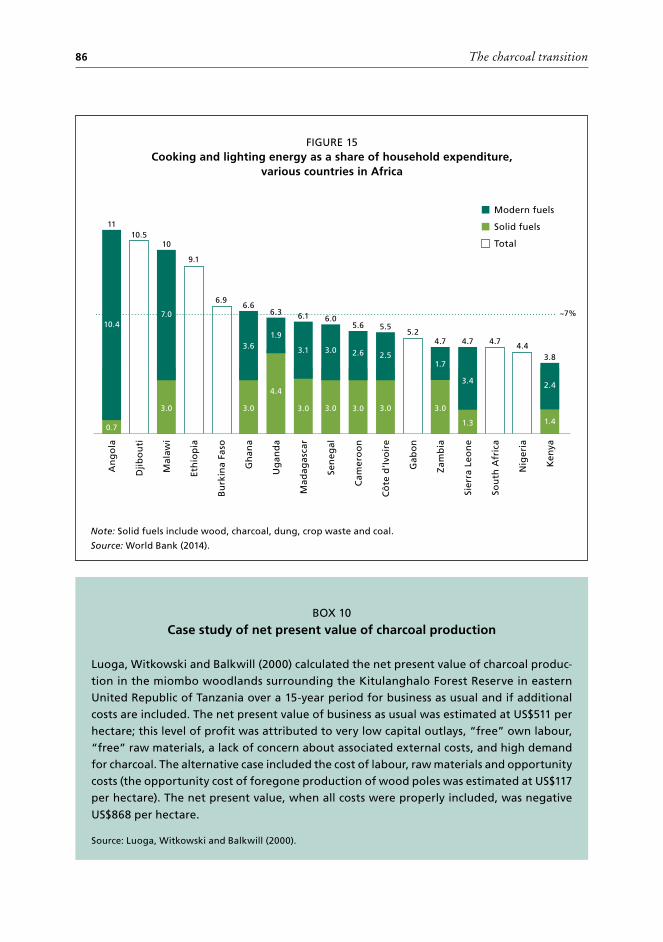
The charcoal transition86
FIGURE 15Cooking and lighting energy as a share of household expenditure,
various countries in Africa
Note: Solid fuels include wood, charcoal, dung, crop waste and coal.
Source: World Bank (2014).
BOX 10
Case study of net present value of charcoal production
Luoga, Witkowski and Balkwill (2000) calculated the net present value of charcoal produc-tion in the miombo woodlands surrounding the Kitulanghalo Forest Reserve in eastern United Republic of Tanzania over a 15-year period for business as usual and if additional costs are included. The net present value of business as usual was estimated at US$511 per hectare; this level of profit was attributed to very low capital outlays, “free” own labour, “free” raw materials, a lack of concern about associated external costs, and high demand for charcoal. The alternative case included the cost of labour, raw materials and opportunity costs (the opportunity cost of foregone production of wood poles was estimated at US$117 per hectare). The net present value, when all costs were properly included, was negative
US$868 per hectare.
Source: Luoga, Witkowski and Balkwill (2000).
An
go
la
10.4
11
0.7
Djib
ou
ti
10.5
Mal
awi
7.0
10
3.0
Eth
iop
ia
9.1
Cô
te d
’Ivo
ire
2.5
5.5
3.0
Bu
rkin
a Fa
so
6.9
Gab
on
5.2
Gh
ana
3.6
6.6
3.0
Zam
bia
1.7
4.7
3.0
Ug
and
a
1.9
6.3
4.4
Sier
ra L
eon
e
3.4
4.7
1.3
Mad
agas
car
3.1
6.1
3.0
Sou
th A
fric
a
4.7Se
neg
al
3.0
6.0
3.0
Nig
eria
4.4C
amer
oo
n2.6
5.6
3.0
Ken
ya
2.4
3.8
1.4
Modern fuels
Total
Solid fuels
~7%
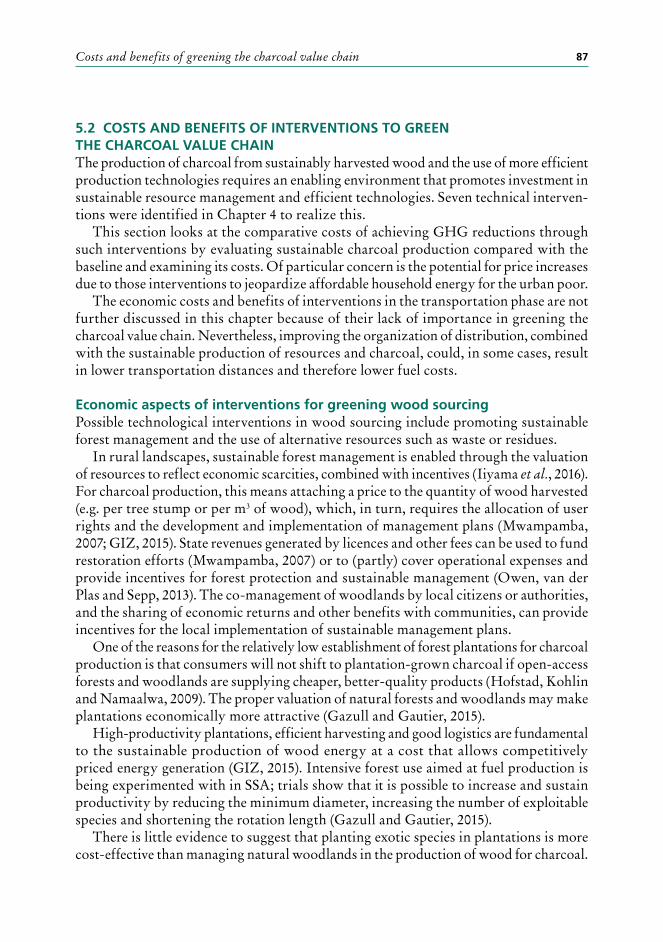
Costs and benefits of greening the charcoal value chain 87
5.2 COSTS AND BENEFITS OF INTERVENTIONS TO GREEN THE CHARCOAL VALUE CHAINThe production of charcoal from sustainably harvested wood and the use of more efficient production technologies requires an enabling environment that promotes investment in sustainable resource management and efficient technologies. Seven technical interven-tions were identified in Chapter 4 to realize this.
This section looks at the comparative costs of achieving GHG reductions through such interventions by evaluating sustainable charcoal production compared with the baseline and examining its costs. Of particular concern is the potential for price increases due to those interventions to jeopardize affordable household energy for the urban poor.
The economic costs and benefits of interventions in the transportation phase are not further discussed in this chapter because of their lack of importance in greening the charcoal value chain. Nevertheless, improving the organization of distribution, combined with the sustainable production of resources and charcoal, could, in some cases, result in lower transportation distances and therefore lower fuel costs.
Economic aspects of interventions for greening wood sourcing Possible technological interventions in wood sourcing include promoting sustainable forest management and the use of alternative resources such as waste or residues.
In rural landscapes, sustainable forest management is enabled through the valuation of resources to reflect economic scarcities, combined with incentives (Iiyama et al., 2016). For charcoal production, this means attaching a price to the quantity of wood harvested (e.g. per tree stump or per m3 of wood), which, in turn, requires the allocation of user rights and the development and implementation of management plans (Mwampamba, 2007; GIZ, 2015). State revenues generated by licences and other fees can be used to fund restoration efforts (Mwampamba, 2007) or to (partly) cover operational expenses and provide incentives for forest protection and sustainable management (Owen, van der Plas and Sepp, 2013). The co-management of woodlands by local citizens or authorities, and the sharing of economic returns and other benefits with communities, can provide incentives for the local implementation of sustainable management plans.
One of the reasons for the relatively low establishment of forest plantations for charcoal production is that consumers will not shift to plantation-grown charcoal if open-access forests and woodlands are supplying cheaper, better-quality products (Hofstad, Kohlin and Namaalwa, 2009). The proper valuation of natural forests and woodlands may make plantations economically more attractive (Gazull and Gautier, 2015).
High-productivity plantations, efficient harvesting and good logistics are fundamental to the sustainable production of wood energy at a cost that allows competitively priced energy generation (GIZ, 2015). Intensive forest use aimed at fuel production is being experimented with in SSA; trials show that it is possible to increase and sustain productivity by reducing the minimum diameter, increasing the number of exploitable species and shortening the rotation length (Gazull and Gautier, 2015).
There is little evidence to suggest that planting exotic species in plantations is more cost-effective than managing natural woodlands in the production of wood for charcoal.
The charcoal transition88
Given the tendency for woodlands to regenerate naturally post-harvesting, protecting woodland areas from deforestation requires less labour and fewer inputs than plantation management (TFCS, 2016). According to Mwampamba (2007), assisted regeneration should be preferred to plantations because it requires lower capital costs and less maintenance and promotes the restoration of indigenous ecosystems.
Economic return plays a crucial part in determining the success of afforestation and reforestation efforts on (marginal) lands.51 Areas with insecure land tenure are less attractive for carbon finance investments (FAO, 2016a). Significant subsidies (e.g. €200–300 per hectare for reforestation in Madagascar) may be required to provide sufficient incentive for reforestation initiatives; this is true for any investment in natural forest management (GIZ, 2014b). However, reforestation can provide new income from the production of woodfuel, particularly when it restores previously degraded land (Box 11).
Interventions to use alternative resources such as waste or residues in the charcoal sector to replace charcoal from natural forests have been relatively unsuccessful to date because of low wood-energy prices. In Cameroon, the total cost of transforming sawmill residues into charcoal between 2011 and 2013 in one project was €230 000 for a total production of 129 tonnes of charcoal, of which only 96 tonnes were sold (Annex E contains more information on this case study). Among other reasons, the lack of sales was due to the cheaper price of illegally produced charcoal.
BOX 11
Examples where afforestation and reforestation activities have provided new income
• In Madagascar, the afforestation of 6 500 hectares in 57 villages (under a project) pro-
vided villagers with, on average, a 20 percent increase in income (GIZ, 2014b).
• In Paraguay, a project implementing sustainable forest management on 8 000 hectares,
including 3 500 hectares of reforested land, achieved growth rates in fast-growing
plantations of up to 20 m3 per hectare per year. An estimated 90 percent of families
became self-sufficient in wood energy, resulting in additional family income of about
€500 per year (GIZ, 2014b).
• In Rwanda, raising woodfuel prices led to a self-sustained turnaround in which tea farmers
invested in private plantations, especially on marginal lands, based on secure land and
user rights. Studies confirmed that the profitability of small-scale eucalypt plantations
was 47 percent higher than tea plantations (GIZ, 2015).
51 In addition to land price, other variables determining the economic feasibility of afforestation and reforestation include the opportunity cost and productive capacity of land, establishment and mainte-nance costs, harvesting and transport costs (including road construction and maintenance), the growth performance of the species selected, wood prices over time, discount rates or risk levels, carbon price, and the rate of carbon sequestration (FAO, 2016a).
Costs and benefits of greening the charcoal value chain 89
Given generally low prices for charcoal, the production of charcoal from wood residues is generally viable only for timber enterprises in and around consumer markets (GIZ, 2015); for others, the cost of transport (combined with losses during transport) is prohibitive. The economic potential of wood residues increases with increasing charcoal prices.
It is possible that the prices of alternative resources will increase with increasing demand. In Swaziland and South Africa, for example, prices for waste wood doubled in four years, driven partly by domestic demand for biomass energy (GEF, 2013). This provides a financial incentive to improve waste management and attain more efficiency along the entire value chain – from forest operations to consumption by end users (GIZ, 2015).
The economic potential of briquettes manufactured from charcoal dust also increases as the price of charcoal increases (Ghilardi, Mwampamba and Dutt, 2013).52 The cost of briquetting ranges from US$4.4 to US$20 per tonne of charcoal, depending on whether briquetting takes place before or after carbonization. The cost of manufacture is low compared with the final charcoal price: for example, charcoal briquettes in Kampala, Uganda, generate revenues of about US$380 per tonne but briquetting costs only US$10 per tonne (UNDP, 2013).
Economic aspects of interventions for greening carbonization Possible technological improvements in carbonization include the use of efficient kilns and cogeneration (in the case of industrial-scale production). Advanced technologies become more competitive as wood sources become higher-priced, leading to greater efficiencies in the value chain (Owen, van der Plas and Sepp, 2013). The use of efficient kilns means the more efficient use of wood, potentially doubling charcoal outputs (Adams, 2009), thereby improving the economics of sustainable forest management.
The use of higher-efficiency kilns requires investment by charcoal producers, but it increases outputs and requires less labour input, meaning that producers have more time for other income-generating activities (UNDP, 2014a).53
High-yielding, low-emission charcoal factories have higher investment costs than old-fashioned brick or steel kilns or retorts. In many cases, however, the improved yield (3–4 kg of wood per 1 kg of charcoal) compensates for the higher investment in places with sufficient wood or where transportation is available, and lower emissions are therefore a no-cost bonus (World Bank, 2008).
Cogeneration during carbonization for large-scale industrial production creates additional value. Heat generated from pyrolysis gases can be used in the production process itself; if produced in excess, it can also be used to generate electricity and (if a feed-in system exists) fed into the electricity grid to earn additional revenue. Cogeneration involves high investment costs and requires expertise. Carneiro de Miranda, Bailis
52 Ghilardi, Mwampamba and Dutt (2013) found that the success of interventions in the charcoal sector to replace lump charcoal from natural forests with charcoal briquettes from forestry biomass wastes was low in most cases.
53 For example, improved charcoal production technology in 77 blacksmith households in Sindhupalchowk District, Nepal, led to a 40– 51 percent decrease in fuelwood consumption, saving time among the black-smiths for use in more productive activities (Kattel, 2015).
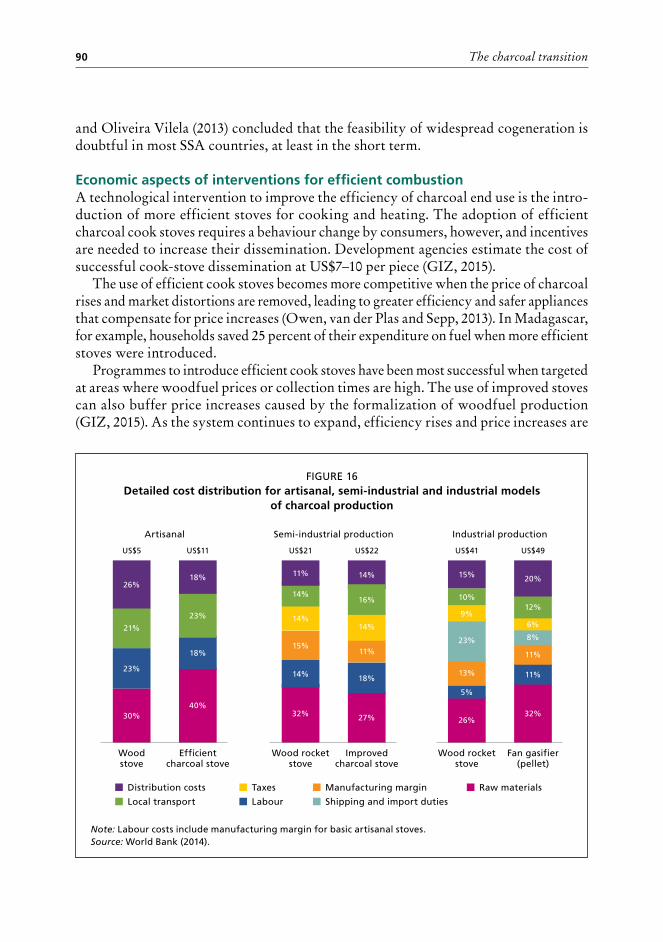
The charcoal transition90
and Oliveira Vilela (2013) concluded that the feasibility of widespread cogeneration is doubtful in most SSA countries, at least in the short term.
Economic aspects of interventions for efficient combustionA technological intervention to improve the efficiency of charcoal end use is the intro-duction of more efficient stoves for cooking and heating. The adoption of efficient charcoal cook stoves requires a behaviour change by consumers, however, and incentives are needed to increase their dissemination. Development agencies estimate the cost of successful cook-stove dissemination at US$7–10 per piece (GIZ, 2015).
The use of efficient cook stoves becomes more competitive when the price of charcoal rises and market distortions are removed, leading to greater efficiency and safer appliances that compensate for price increases (Owen, van der Plas and Sepp, 2013). In Madagascar, for example, households saved 25 percent of their expenditure on fuel when more efficient stoves were introduced.
Programmes to introduce efficient cook stoves have been most successful when targeted at areas where woodfuel prices or collection times are high. The use of improved stoves can also buffer price increases caused by the formalization of woodfuel production (GIZ, 2015). As the system continues to expand, efficiency rises and price increases are
FIGURE 16Detailed cost distribution for artisanal, semi-industrial and industrial models
of charcoal production
Note: Labour costs include manufacturing margin for basic artisanal stoves.Source: World Bank (2014).
Distribution costs Taxes Manufacturing margin Raw materials
Local transport Labour Shipping and import duties
Wood stove
US$5
30%
23%
21%
26%
Wood rocket stove
US$21
32%
15%
14%
Wood rocket stove
US$41
26%
5%
13%
23%
9%
10%
15%
Efficient charcoal stove
US$11
40%
18%
Improved charcoal stove
US$22
27%
11%
18%
14%
14%
Fan gasifier (pellet)
US$49
32%
11%
11%
8%
6%
12%
20%
Artisanal Semi-industrial production Industrial production
23%
18%
14%
14%
11%
16%
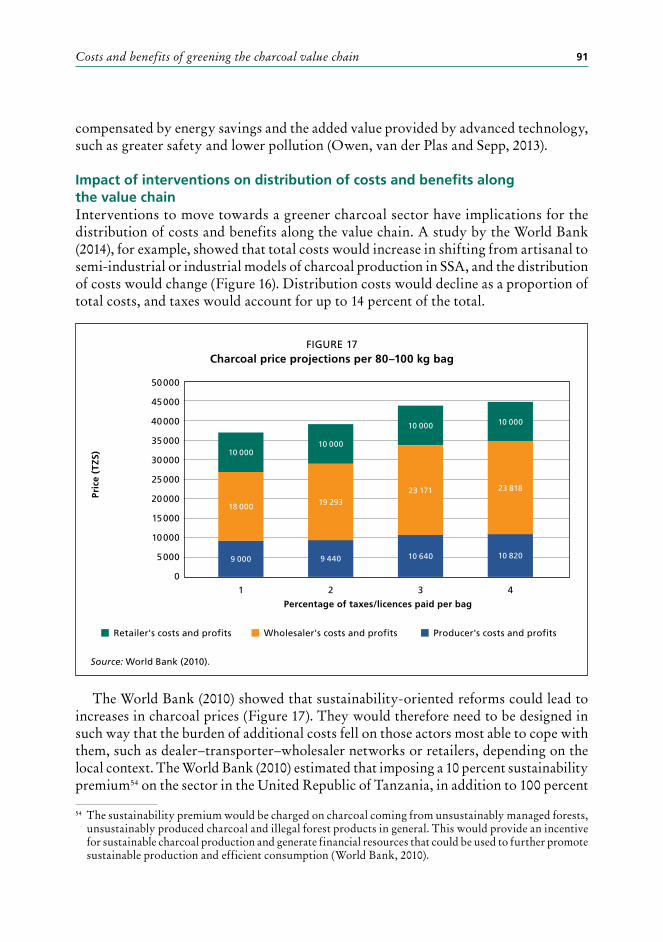
Costs and benefits of greening the charcoal value chain 91
compensated by energy savings and the added value provided by advanced technology, such as greater safety and lower pollution (Owen, van der Plas and Sepp, 2013).
Impact of interventions on distribution of costs and benefits along the value chainInterventions to move towards a greener charcoal sector have implications for the distribution of costs and benefits along the value chain. A study by the World Bank (2014), for example, showed that total costs would increase in shifting from artisanal to semi-industrial or industrial models of charcoal production in SSA, and the distribution of costs would change (Figure 16). Distribution costs would decline as a proportion of total costs, and taxes would account for up to 14 percent of the total.
The World Bank (2010) showed that sustainability-oriented reforms could lead to increases in charcoal prices (Figure 17). They would therefore need to be designed in such way that the burden of additional costs fell on those actors most able to cope with them, such as dealer–transporter–wholesaler networks or retailers, depending on the local context. The World Bank (2010) estimated that imposing a 10 percent sustainability premium54 on the sector in the United Republic of Tanzania, in addition to 100 percent
54 The sustainability premium would be charged on charcoal coming from unsustainably managed forests, unsustainably produced charcoal and illegal forest products in general. This would provide an incentive for sustainable charcoal production and generate financial resources that could be used to further promote sustainable production and efficient consumption (World Bank, 2010).
FIGURE 17Charcoal price projections per 80–100 kg bag
Source: World Bank (2010).
0
45 000
40 000
30 000
20 000
50 000
35 000
15 000
25 000
5 000
10 000
Percentage of taxes/licences paid per bag
Retailer's costs and profits Wholesaler's costs and profits Producer's costs and profits
1
9 000
18 000
10 000
2
9 440
19 293
10 000
3
10 640
23 171
10 000
4
10 820
23 818
10 000
Pric
e (T
ZS)
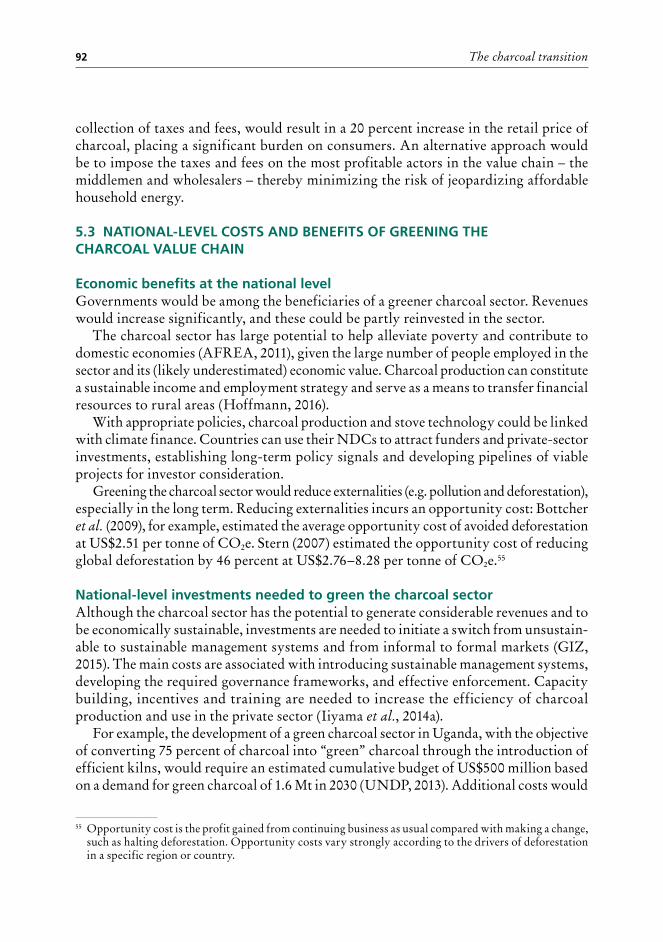
The charcoal transition92
collection of taxes and fees, would result in a 20 percent increase in the retail price of charcoal, placing a significant burden on consumers. An alternative approach would be to impose the taxes and fees on the most profitable actors in the value chain – the middlemen and wholesalers – thereby minimizing the risk of jeopardizing affordable household energy.
5.3 NATIONAL-LEVEL COSTS AND BENEFITS OF GREENING THE CHARCOAL VALUE CHAIN
Economic benefits at the national levelGovernments would be among the beneficiaries of a greener charcoal sector. Revenues would increase significantly, and these could be partly reinvested in the sector.
The charcoal sector has large potential to help alleviate poverty and contribute to domestic economies (AFREA, 2011), given the large number of people employed in the sector and its (likely underestimated) economic value. Charcoal production can constitute a sustainable income and employment strategy and serve as a means to transfer financial resources to rural areas (Hoffmann, 2016).
With appropriate policies, charcoal production and stove technology could be linked with climate finance. Countries can use their NDCs to attract funders and private-sector investments, establishing long-term policy signals and developing pipelines of viable projects for investor consideration.
Greening the charcoal sector would reduce externalities (e.g. pollution and deforestation), especially in the long term. Reducing externalities incurs an opportunity cost: Bottcher et al. (2009), for example, estimated the average opportunity cost of avoided deforestation at US$2.51 per tonne of CO2e. Stern (2007) estimated the opportunity cost of reducing global deforestation by 46 percent at US$2.76–8.28 per tonne of CO2e.55
National-level investments needed to green the charcoal sector Although the charcoal sector has the potential to generate considerable revenues and to be economically sustainable, investments are needed to initiate a switch from unsustain-able to sustainable management systems and from informal to formal markets (GIZ, 2015). The main costs are associated with introducing sustainable management systems, developing the required governance frameworks, and effective enforcement. Capacity building, incentives and training are needed to increase the efficiency of charcoal production and use in the private sector (Iiyama et al., 2014a).
For example, the development of a green charcoal sector in Uganda, with the objective of converting 75 percent of charcoal into “green” charcoal through the introduction of efficient kilns, would require an estimated cumulative budget of US$500 million based on a demand for green charcoal of 1.6 Mt in 2030 (UNDP, 2013). Additional costs would
55 Opportunity cost is the profit gained from continuing business as usual compared with making a change, such as halting deforestation. Opportunity costs vary strongly according to the drivers of deforestation in a specific region or country.
Costs and benefits of greening the charcoal value chain 93
include those associated with capacity-building programmes, sustainable forest practices and improving the charcoal value chain (UNDP, 2013).
Table 23 presents the costs and benefits of efficiency improvements in various forest subsectors in Kenya, given a certain amount of upfront investment. The proposed measures would result in a positive cost–benefit ratio in all subsectors (UNEP, 2016).
TABLE 23Overview of the costs and benefits of efficiency improvements in forest subsectors in Kenya, assuming a certain amount of upfront investment and a carbon price of US$5.6 per tonne of CO2e
Forest subsector Estimated investment (US$/yr)
Potential biomass savings (m3 roundwood equivalent per year)
Estimated emission reduction from deforestation and degradation (tCO2e/yr)
Benefit (US$/yr)
Forestry operations (harvesting) 375 000 86 000 Not applicable 1 166 000
Timber processing (briquette production) 1 415 000 237 000 46 000 3 249 000
Charcoal production 15 642 000 5 974 000 16 476 000 144 892 000
Fuelwood/charcoal consumption at household level
10 000 000 1 026 000 2 386 000 20 734 000
Fuelwood/charcoal consumption at industrial level
11 430 000 1 191 000 2 040 000 17 854 000
Total 38 862 000 8 514 000 20 948 000 187 896 000
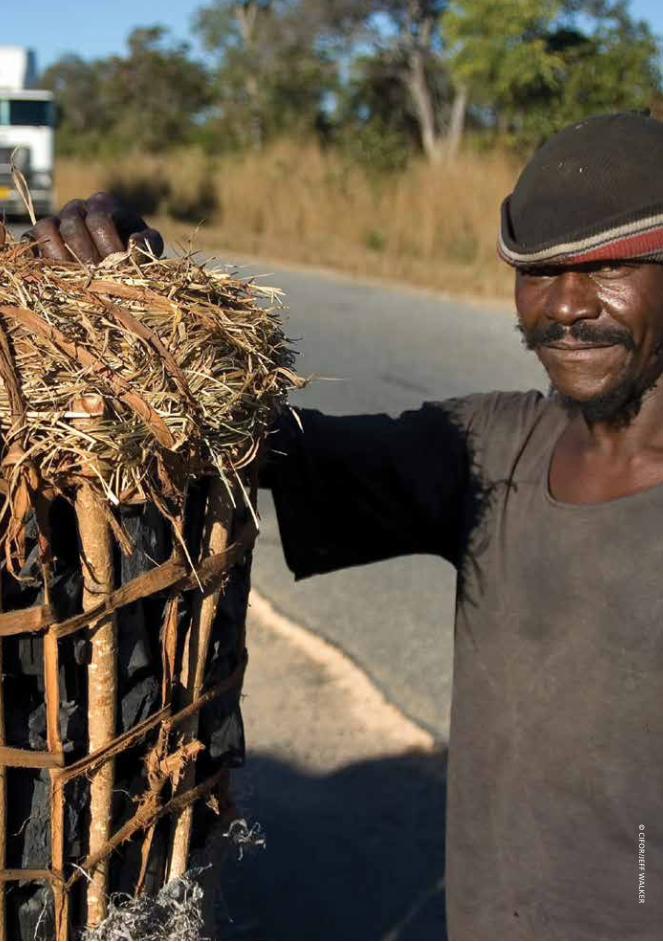
© C
IFOR
/JEFF WA
LKER
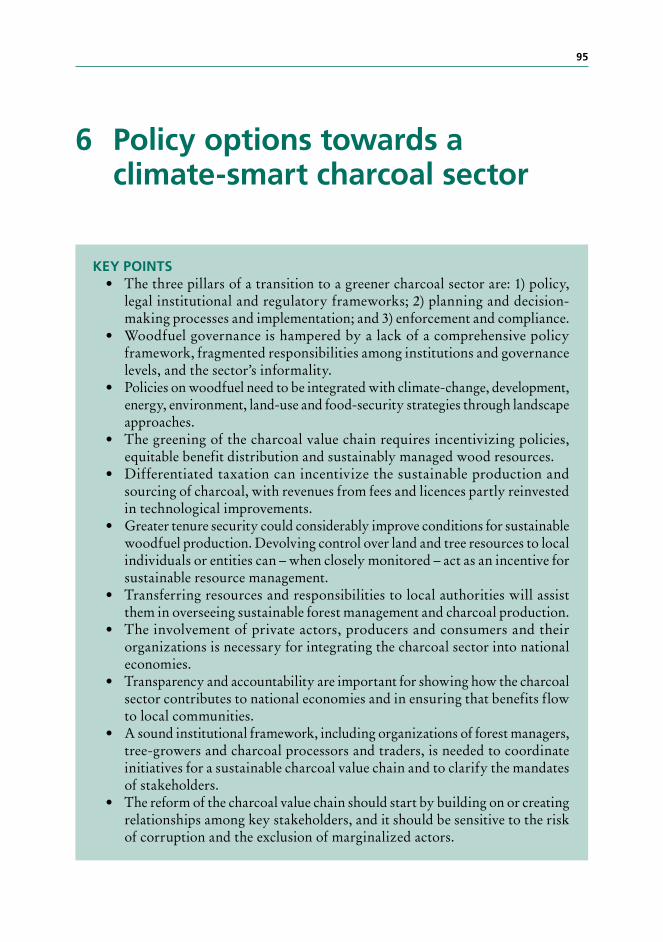
95
6 Policy options towards a climate-smart charcoal sector
KEY POINTS• The three pillars of a transition to a greener charcoal sector are: 1) policy,
legal institutional and regulatory frameworks; 2) planning and decision-making processes and implementation; and 3) enforcement and compliance.
• Woodfuel governance is hampered by a lack of a comprehensive policy framework, fragmented responsibilities among institutions and governance levels, and the sector’s informality.
• Policies on woodfuel need to be integrated with climate-change, development, energy, environment, land-use and food-security strategies through landscape approaches.
• The greening of the charcoal value chain requires incentivizing policies, equitable benefit distribution and sustainably managed wood resources.
• Differentiated taxation can incentivize the sustainable production and sourcing of charcoal, with revenues from fees and licences partly reinvested in technological improvements.
• Greater tenure security could considerably improve conditions for sustainable woodfuel production. Devolving control over land and tree resources to local individuals or entities can – when closely monitored – act as an incentive for sustainable resource management.
• Transferring resources and responsibilities to local authorities will assist them in overseeing sustainable forest management and charcoal production.
• The involvement of private actors, producers and consumers and their organizations is necessary for integrating the charcoal sector into national economies.
• Transparency and accountability are important for showing how the charcoal sector contributes to national economies and in ensuring that benefits flow to local communities.
• A sound institutional framework, including organizations of forest managers, tree-growers and charcoal processors and traders, is needed to coordinate initiatives for a sustainable charcoal value chain and to clarify the mandates of stakeholders.
• The reform of the charcoal value chain should start by building on or creating relationships among key stakeholders, and it should be sensitive to the risk of corruption and the exclusion of marginalized actors.
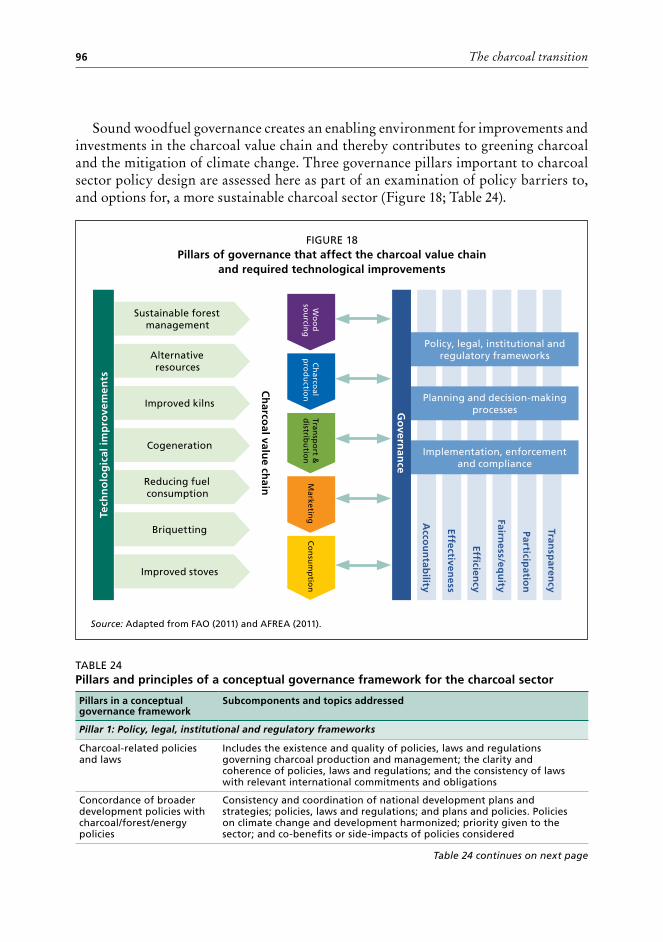
The charcoal transition96
Sound woodfuel governance creates an enabling environment for improvements and investments in the charcoal value chain and thereby contributes to greening charcoal and the mitigation of climate change. Three governance pillars important to charcoal sector policy design are assessed here as part of an examination of policy barriers to, and options for, a more sustainable charcoal sector (Figure 18; Table 24).
TABLE 24Pillars and principles of a conceptual governance framework for the charcoal sector
Pillars in a conceptual governance framework
Subcomponents and topics addressed
Pillar 1: Policy, legal, institutional and regulatory frameworks
Charcoal-related policies and laws
Includes the existence and quality of policies, laws and regulations governing charcoal production and management; the clarity and coherence of policies, laws and regulations; and the consistency of laws with relevant international commitments and obligations
Concordance of broader development policies with charcoal/forest/energy policies
Consistency and coordination of national development plans and strategies; policies, laws and regulations; and plans and policies. Policies on climate change and development harmonized; priority given to the sector; and co-benefits or side-impacts of policies considered
FIGURE 18Pillars of governance that affect the charcoal value chain
and required technological improvements
Source: Adapted from FAO (2011) and AFREA (2011).
Tech
no
log
ical
imp
rove
men
tsTran
sparen
cy
Participatio
n
Fairness/eq
uity
Efficiency
Effectiveness
Acco
un
tability
Sustainable forest management
Wo
od
so
urcin
g
Ch
arcoal
pro
du
ction
Transp
ort &
d
istribu
tion
Marketin
gC
on
sum
ptio
n
Improved kilns
Reducing fuel consumption
Alternative resources
Cogeneration
Briquetting
Improved stoves
Planning and decision-making processes
Policy, legal, institutional and regulatory frameworks
Implementation, enforcement and compliance
Go
vernan
ce
Ch
arcoal valu
e chain
Table 24 continues on next page
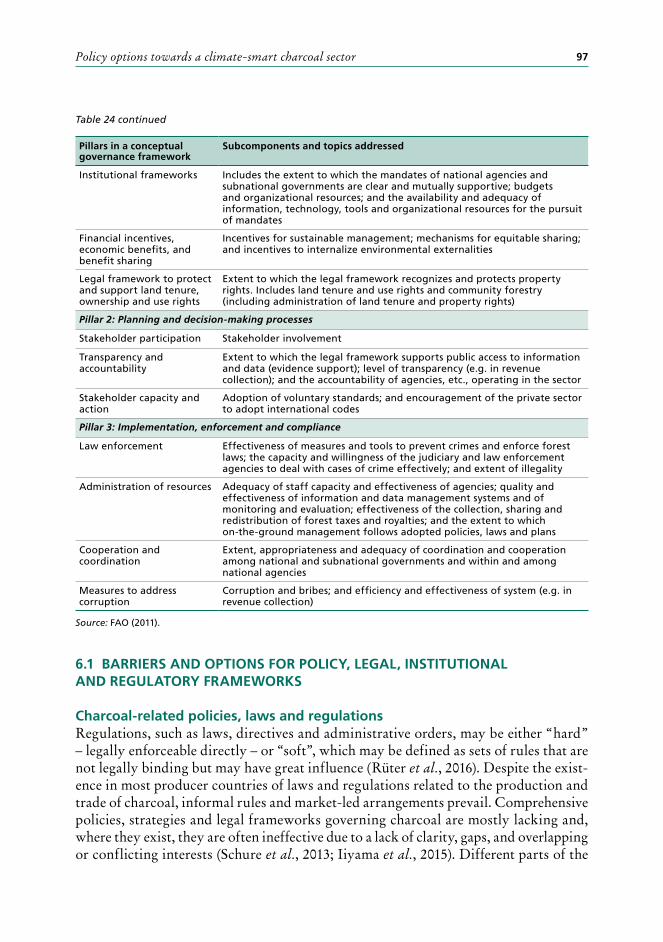
Policy options towards a climate-smart charcoal sector 97
Pillars in a conceptual governance framework
Subcomponents and topics addressed
Institutional frameworks Includes the extent to which the mandates of national agencies and subnational governments are clear and mutually supportive; budgets and organizational resources; and the availability and adequacy of information, technology, tools and organizational resources for the pursuit of mandates
Financial incentives, economic benefits, and benefit sharing
Incentives for sustainable management; mechanisms for equitable sharing; and incentives to internalize environmental externalities
Legal framework to protect and support land tenure, ownership and use rights
Extent to which the legal framework recognizes and protects property rights. Includes land tenure and use rights and community forestry (including administration of land tenure and property rights)
Pillar 2: Planning and decision-making processes
Stakeholder participation Stakeholder involvement
Transparency and accountability
Extent to which the legal framework supports public access to information and data (evidence support); level of transparency (e.g. in revenue collection); and the accountability of agencies, etc., operating in the sector
Stakeholder capacity and action
Adoption of voluntary standards; and encouragement of the private sector to adopt international codes
Pillar 3: Implementation, enforcement and compliance
Law enforcement Effectiveness of measures and tools to prevent crimes and enforce forest laws; the capacity and willingness of the judiciary and law enforcement agencies to deal with cases of crime effectively; and extent of illegality
Administration of resources Adequacy of staff capacity and effectiveness of agencies; quality and effectiveness of information and data management systems and of monitoring and evaluation; effectiveness of the collection, sharing and redistribution of forest taxes and royalties; and the extent to which on-the-ground management follows adopted policies, laws and plans
Cooperation and coordination
Extent, appropriateness and adequacy of coordination and cooperation among national and subnational governments and within and among national agencies
Measures to address corruption
Corruption and bribes; and efficiency and effectiveness of system (e.g. in revenue collection)
Source: FAO (2011).
6.1 BARRIERS AND OPTIONS FOR POLICY, LEGAL, INSTITUTIONAL AND REGULATORY FRAMEWORKS
Charcoal-related policies, laws and regulationsRegulations, such as laws, directives and administrative orders, may be either “hard” – legally enforceable directly – or “soft”, which may be defined as sets of rules that are not legally binding but may have great influence (Rüter et al., 2016). Despite the exist-ence in most producer countries of laws and regulations related to the production and trade of charcoal, informal rules and market-led arrangements prevail. Comprehensive policies, strategies and legal frameworks governing charcoal are mostly lacking and, where they exist, they are often ineffective due to a lack of clarity, gaps, and overlapping or conflicting interests (Schure et al., 2013; Iiyama et al., 2015). Different parts of the
Table 24 continued
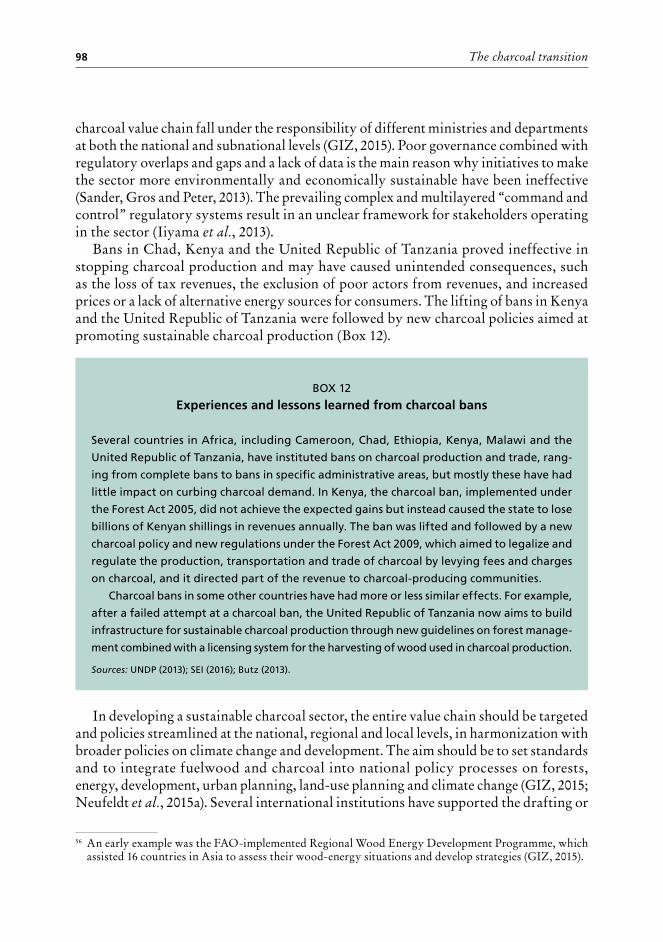
The charcoal transition98
charcoal value chain fall under the responsibility of different ministries and departments at both the national and subnational levels (GIZ, 2015). Poor governance combined with regulatory overlaps and gaps and a lack of data is the main reason why initiatives to make the sector more environmentally and economically sustainable have been ineffective (Sander, Gros and Peter, 2013). The prevailing complex and multilayered “command and control” regulatory systems result in an unclear framework for stakeholders operating in the sector (Iiyama et al., 2013).
Bans in Chad, Kenya and the United Republic of Tanzania proved ineffective in stopping charcoal production and may have caused unintended consequences, such as the loss of tax revenues, the exclusion of poor actors from revenues, and increased prices or a lack of alternative energy sources for consumers. The lifting of bans in Kenya and the United Republic of Tanzania were followed by new charcoal policies aimed at promoting sustainable charcoal production (Box 12).
In developing a sustainable charcoal sector, the entire value chain should be targeted and policies streamlined at the national, regional and local levels, in harmonization with broader policies on climate change and development. The aim should be to set standards and to integrate fuelwood and charcoal into national policy processes on forests, energy, development, urban planning, land-use planning and climate change (GIZ, 2015; Neufeldt et al., 2015a). Several international institutions have supported the drafting or
BOX 12
Experiences and lessons learned from charcoal bans
Several countries in Africa, including Cameroon, Chad, Ethiopia, Kenya, Malawi and the
United Republic of Tanzania, have instituted bans on charcoal production and trade, rang-
ing from complete bans to bans in specific administrative areas, but mostly these have had
little impact on curbing charcoal demand. In Kenya, the charcoal ban, implemented under
the Forest Act 2005, did not achieve the expected gains but instead caused the state to lose
billions of Kenyan shillings in revenues annually. The ban was lifted and followed by a new
charcoal policy and new regulations under the Forest Act 2009, which aimed to legalize and
regulate the production, transportation and trade of charcoal by levying fees and charges
on charcoal, and it directed part of the revenue to charcoal-producing communities.
Charcoal bans in some other countries have had more or less similar effects. For example,
after a failed attempt at a charcoal ban, the United Republic of Tanzania now aims to build
infrastructure for sustainable charcoal production through new guidelines on forest manage-
ment combined with a licensing system for the harvesting of wood used in charcoal production.
Sources: UNDP (2013); SEI (2016); Butz (2013).
56 An early example was the FAO-implemented Regional Wood Energy Development Programme, which assisted 16 countries in Asia to assess their wood-energy situations and develop strategies (GIZ, 2015).
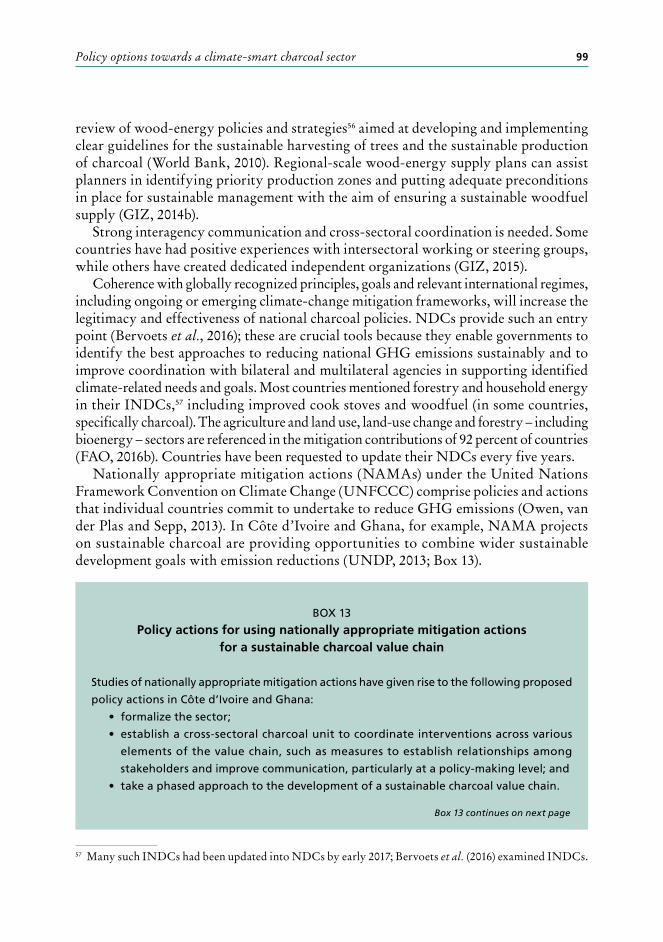
Policy options towards a climate-smart charcoal sector 99
review of wood-energy policies and strategies56 aimed at developing and implementing clear guidelines for the sustainable harvesting of trees and the sustainable production of charcoal (World Bank, 2010). Regional-scale wood-energy supply plans can assist planners in identifying priority production zones and putting adequate preconditions in place for sustainable management with the aim of ensuring a sustainable woodfuel supply (GIZ, 2014b).
Strong interagency communication and cross-sectoral coordination is needed. Some countries have had positive experiences with intersectoral working or steering groups, while others have created dedicated independent organizations (GIZ, 2015).
Coherence with globally recognized principles, goals and relevant international regimes, including ongoing or emerging climate-change mitigation frameworks, will increase the legitimacy and effectiveness of national charcoal policies. NDCs provide such an entry point (Bervoets et al., 2016); these are crucial tools because they enable governments to identify the best approaches to reducing national GHG emissions sustainably and to improve coordination with bilateral and multilateral agencies in supporting identified climate-related needs and goals. Most countries mentioned forestry and household energy in their INDCs,57 including improved cook stoves and woodfuel (in some countries, specifically charcoal). The agriculture and land use, land-use change and forestry – including bioenergy – sectors are referenced in the mitigation contributions of 92 percent of countries (FAO, 2016b). Countries have been requested to update their NDCs every five years.
Nationally appropriate mitigation actions (NAMAs) under the United Nations Framework Convention on Climate Change (UNFCCC) comprise policies and actions that individual countries commit to undertake to reduce GHG emissions (Owen, van der Plas and Sepp, 2013). In Côte d’Ivoire and Ghana, for example, NAMA projects on sustainable charcoal are providing opportunities to combine wider sustainable development goals with emission reductions (UNDP, 2013; Box 13).
57 Many such INDCs had been updated into NDCs by early 2017; Bervoets et al. (2016) examined INDCs.
BOX 13
Policy actions for using nationally appropriate mitigation actions for a sustainable charcoal value chain
Studies of nationally appropriate mitigation actions have given rise to the following proposed
policy actions in Côte d’Ivoire and Ghana:
• formalize the sector;
• establish a cross-sectoral charcoal unit to coordinate interventions across various
elements of the value chain, such as measures to establish relationships among
stakeholders and improve communication, particularly at a policy-making level; and
• take a phased approach to the development of a sustainable charcoal value chain.
Box 13 continues on next page
The charcoal transition100
Efforts to formalize the charcoal sector, combined with governance reforms to realize a greener charcoal sector, could contribute to and benefit from international commitments and targets, including:
• REDD+;• the Sustainable Development Goals;• the UNFCCC (e.g. national adaptation programmes of action and national
adaptation plans);• the Convention on Biological Diversity’s national biodiversity strategies and
action plans;• the United Nations Convention on Combating Desertification (UNCCD)’s
national action programmes; • the FLEGT process (which, in many cases, includes the regulation and formalization
of internal wood and woodfuel markets. Note, however, that the European Timber Regulation does not include charcoal);
• the New York Declaration on Forests;• the Bonn Challenge and the connected AFR100 Initiative, which aim to restore
350 million hectares of degraded forests and landscapes; • the UNCCD Land Degradation Neutrality Process, in which 105 countries have
requested support from the Global Mechanism on Land Degradation Neutrality to determine national land degradation neutrality targets for achieving Sustainable Development Goal 15.3; and
• the Green Climate Fund.
Concordance of broader development policies with charcoal policiesDespite the importance of wood energy for household energy consumption and liveli-hoods in many developing countries, wood energy is generally afforded low policy priority, and adequate political commitment and recognition is often lacking. Strategy
In Côte d’Ivoire, the first phase is focusing on establishing a charcoal unit that will begin
coordinating government entities and engaging the private sector and civil-society organi-
zations. The unit is expected to build capacity among the private sector and civil-society
organizations on topics such as improved forest management, the use of efficient kilns, how
to set up cooperatives, and the sale of improved cook stoves. It will also help organizations
develop business plans for sustainable charcoal operations.
In Ghana, the first phase should involve establishing charcoal producer associations and
the signing of formal agreements between these associations and government that outline
the benefits of, and responsibilities for, engaging in legal production. New technologies,
such as briquettes, will be investigated, and effective licensing systems and eco-labelling
for cook stoves established.
Sources: UNDP (2014a); UNDP (2014b); Neufeldt et al. (2015b).
Box 13 continued
Policy options towards a climate-smart charcoal sector 101
development and target-setting in national energy policies58 tend to overlook the role of wood-based energy, prioritizing instead access to “modern” household energy sources such as kerosene, LPG and electricity (Owen, van der Plas and Sepp, 2013).59 Charcoal is associated with “backwater” countries and rarely considered as part of the solution to energy and economic challenges (Ghilardi, Mwampamba and Dutt, 2013; Neufeldt et al., 2015b). Governments are hesitant to engage in the reform of the wood-energy sector, partially because the sector is associated with environmental damage; a lack of awareness of, and technology for, sustainable solutions; and a lack of data with which to build sound approaches (Owen, van der Plas and Sepp, 2013).
A holistic perspective on wood energy is needed to develop concepts and frameworks for a portfolio of objectives, including climate-change mitigation, environmental protection, energy security, public health and rural policy. Building such a perspective would involve creating synergies with international agreements and among the forest, energy and agriculture sectors. Recognizing that charcoal can be a renewable, pro-poor fuel, and linking the charcoal sector to green economies, climate change and poverty alleviation, are important preconditions for obtaining political support and aligning with broader development objectives (Ghilardi, Mwampamba and Dutt, 2013; Mwampamba et al., 2013).
Institutional frameworksWoodfuel institutions often operate informally based on customary rules; this enables the involvement of many actors but also leads to substantial unsustainable and unofficial production, corrupt practices and the loss of tax revenues (GIZ, 2015).
A sound institutional framework is needed to coordinate the implementation of sustainable resource production and use (World Bank, 2008). A coherent national energy policy and strategy would assign clear roles and responsibilities to the various relevant institutions (Sepp, 2008). A key factor is the existence of a high-level, intersectoral coordination mechanism to harmonize the policies, strategies and plans of the various sectors (Mundhenk, 2015). Existing intersectoral national working groups, such as those formed for REDD+ or land-use planning at the national level, could be a vehicle for starting discussions.
Financial incentives, economic instruments and benefit sharingLegal provisions and mechanisms should enable the sustainable and equitable distribution of access to resources, rights and incomes (Mundhenk, 2015). Incentive measures and systems of control (“carrots and sticks”) are needed for an effective wood-energy policy. Table 25 summarizes potential fiscal measures and economic incentives for encouraging a sustainable charcoal value chain.
58 Although recognizing that most Tanzanians depend on fuelwood and charcoal, the United Republic of Tanzania’s 2015 National Energy Policy does not address how the nation should manage the supply of woodfuel for domestic use (TFCS, 2016).
59 UNDP (2009) found that, although 35 governments in SSA have set strategic targets to increase access to electricity, only seven have done so for improved wood or charcoal stoves.
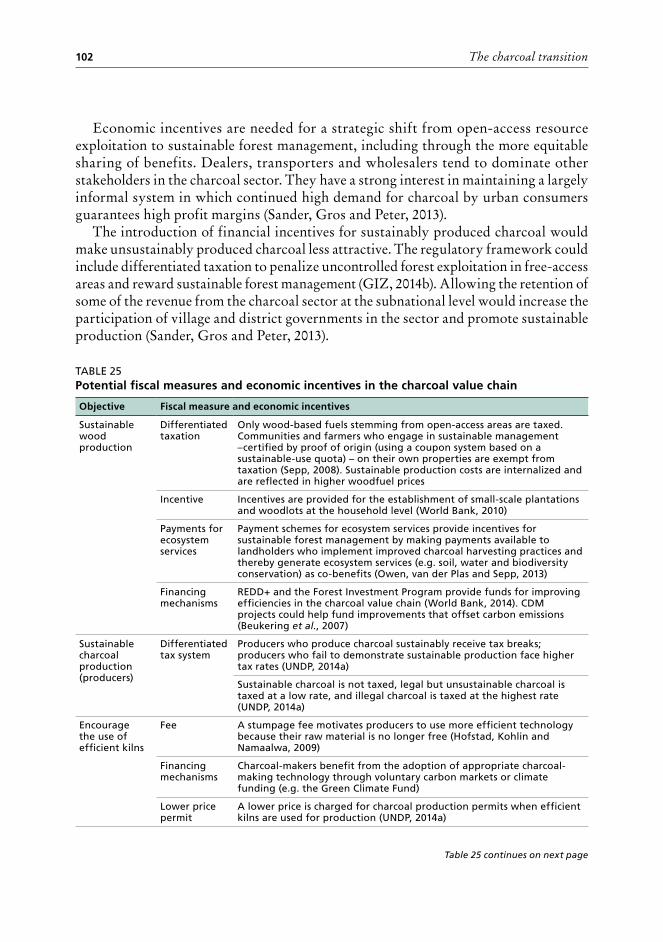
The charcoal transition102
Economic incentives are needed for a strategic shift from open-access resource exploitation to sustainable forest management, including through the more equitable sharing of benefits. Dealers, transporters and wholesalers tend to dominate other stakeholders in the charcoal sector. They have a strong interest in maintaining a largely informal system in which continued high demand for charcoal by urban consumers guarantees high profit margins (Sander, Gros and Peter, 2013).
The introduction of financial incentives for sustainably produced charcoal would make unsustainably produced charcoal less attractive. The regulatory framework could include differentiated taxation to penalize uncontrolled forest exploitation in free-access areas and reward sustainable forest management (GIZ, 2014b). Allowing the retention of some of the revenue from the charcoal sector at the subnational level would increase the participation of village and district governments in the sector and promote sustainable production (Sander, Gros and Peter, 2013).
TABLE 25Potential fiscal measures and economic incentives in the charcoal value chain
Objective Fiscal measure and economic incentives
Sustainable wood production
Differentiated taxation
Only wood-based fuels stemming from open-access areas are taxed. Communities and farmers who engage in sustainable management –certified by proof of origin (using a coupon system based on a sustainable-use quota) – on their own properties are exempt from taxation (Sepp, 2008). Sustainable production costs are internalized and are reflected in higher woodfuel prices
Incentive Incentives are provided for the establishment of small-scale plantations and woodlots at the household level (World Bank, 2010)
Payments for ecosystem services
Payment schemes for ecosystem services provide incentives for sustainable forest management by making payments available to landholders who implement improved charcoal harvesting practices and thereby generate ecosystem services (e.g. soil, water and biodiversity conservation) as co-benefits (Owen, van der Plas and Sepp, 2013)
Financing mechanisms
REDD+ and the Forest Investment Program provide funds for improving efficiencies in the charcoal value chain (World Bank, 2014). CDM projects could help fund improvements that offset carbon emissions (Beukering et al., 2007)
Sustainable charcoal production (producers)
Differentiated tax system
Producers who produce charcoal sustainably receive tax breaks; producers who fail to demonstrate sustainable production face higher tax rates (UNDP, 2014a)
Sustainable charcoal is not taxed, legal but unsustainable charcoal is taxed at a low rate, and illegal charcoal is taxed at the highest rate (UNDP, 2014a)
Encourage the use of efficient kilns
Fee A stumpage fee motivates producers to use more efficient technology because their raw material is no longer free (Hofstad, Kohlin and Namaalwa, 2009)
Financing mechanisms
Charcoal-makers benefit from the adoption of appropriate charcoal-making technology through voluntary carbon markets or climate funding (e.g. the Green Climate Fund)
Lower price permit
A lower price is charged for charcoal production permits when efficient kilns are used for production (UNDP, 2014a)
Table 25 continues on next page
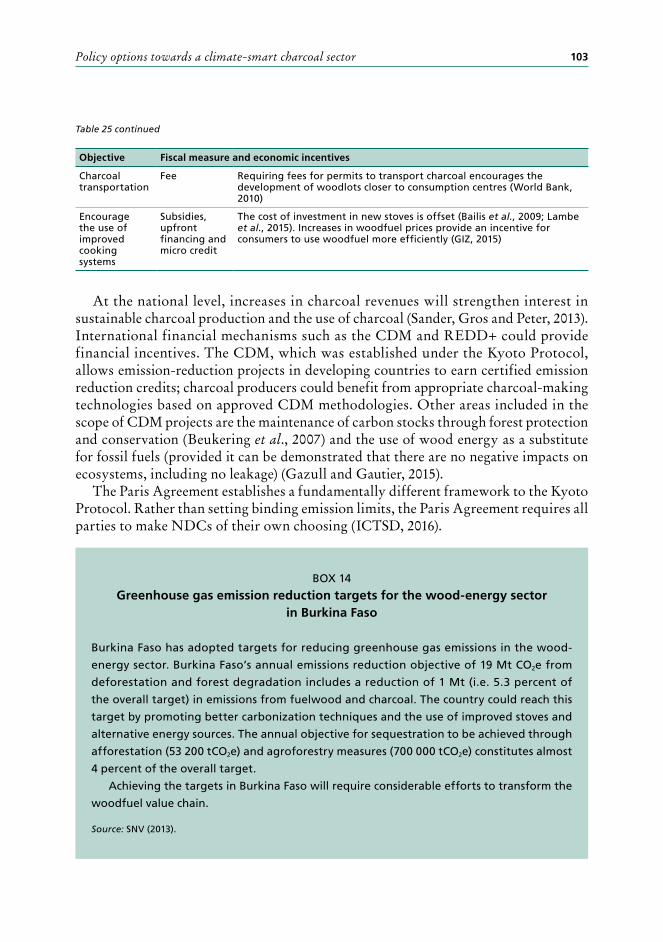
Policy options towards a climate-smart charcoal sector 103
Objective Fiscal measure and economic incentives
Charcoal transportation
Fee Requiring fees for permits to transport charcoal encourages the development of woodlots closer to consumption centres (World Bank, 2010)
Encourage the use of improved cooking systems
Subsidies, upfront financing and micro credit
The cost of investment in new stoves is offset (Bailis et al., 2009; Lambe et al., 2015). Increases in woodfuel prices provide an incentive for consumers to use woodfuel more efficiently (GIZ, 2015)
At the national level, increases in charcoal revenues will strengthen interest in sustainable charcoal production and the use of charcoal (Sander, Gros and Peter, 2013). International financial mechanisms such as the CDM and REDD+ could provide financial incentives. The CDM, which was established under the Kyoto Protocol, allows emission-reduction projects in developing countries to earn certified emission reduction credits; charcoal producers could benefit from appropriate charcoal-making technologies based on approved CDM methodologies. Other areas included in the scope of CDM projects are the maintenance of carbon stocks through forest protection and conservation (Beukering et al., 2007) and the use of wood energy as a substitute for fossil fuels (provided it can be demonstrated that there are no negative impacts on ecosystems, including no leakage) (Gazull and Gautier, 2015).
The Paris Agreement establishes a fundamentally different framework to the Kyoto Protocol. Rather than setting binding emission limits, the Paris Agreement requires all parties to make NDCs of their own choosing (ICTSD, 2016).
Table 25 continued
BOX 14
Greenhouse gas emission reduction targets for the wood-energy sector in Burkina Faso
Burkina Faso has adopted targets for reducing greenhouse gas emissions in the wood-
energy sector. Burkina Faso’s annual emissions reduction objective of 19 Mt CO2e from
deforestation and forest degradation includes a reduction of 1 Mt (i.e. 5.3 percent of
the overall target) in emissions from fuelwood and charcoal. The country could reach this
target by promoting better carbonization techniques and the use of improved stoves and
alternative energy sources. The annual objective for sequestration to be achieved through
afforestation (53 200 tCO2e) and agroforestry measures (700 000 tCO2e) constitutes almost
4 percent of the overall target.
Achieving the targets in Burkina Faso will require considerable efforts to transform the
woodfuel value chain.
Source: SNV (2013).
The charcoal transition104
The REDD+ climate-change mitigation framework could provide incentives for sustainable charcoal production through the rehabilitation and sustainable management of degraded forests and woodlands (Owen, van der Plas and Sepp, 2013).60 Some developing countries have adopted targets for reducing GHG emissions in their wood-energy sectors (e.g. Box 14).
Land tenure, ownership and use rightsTenure arrangements are highly specific to a country’s political and legal system, social order and historic development (GIZ, 2015).61 Farmers, agropastoralists and pastoralists in rural landscapes often depend on the same resources in a seamless continuum of woodlands, rangelands and farmlands. Access to individual plots is usually not exclusive to landowners with neighbours (Minang et al., 2015).62
Local or traditional rules often guide land use and access to trees. Official land-use rights and the ownership of forest assets are often unclear or unknown to village and district-level stakeholders; this may include whether a state or communal forest is protected or can be harvested, such as for charcoal production (World Bank, 2010). In Burkina Faso and the Democratic Republic of the Congo, for example, traditional authorities often assign land for agricultural purposes and for short periods, and official land-tenure procedures are complicated and costly (SNV, 2013).
Insecure tenure constitutes a formidable disincentive for long-term investments (GIZ, 2015), with the net result that there is little investment in adequate land management practices, tree-planting, forest landscape restoration and sustainable forest management (Bervoets et al., 2016). The problems and negative impacts associated with unregulated access to forest resources and unchecked exploitation, ultimately leading to forest degradation and deforestation, are directly linked, therefore, to a lack of ownership or long-term user rights.
Tenure security is one of the most significant framework conditions necessary for sustainable resource management and thus the sustainable production of wood energy (GIZ, 2015). Sustainable forest use is based on the creation of boundary and authority rules determining who can use resources under what conditions (Luoga et al., 2000). Clear, secure long-term forest tenure is crucial, therefore, for sustainable forest management (GIZ, 2015; Chidumayo and Gumbo, 2013).
60 A place-specific comprehensive analysis of the drivers of deforestation and forest degradation is needed to ground a REDD+ readiness process, including the development of national REDD+ strategies (FAO, 2012b). Fuelwood harvesting and charcoal production have been identified as drivers of deforestation and degradation in national REDD+ programmes (SNV, 2013).
61 It is estimated that 86 percent of the 3.9 billion hectares of forests worldwide are publicly owned, including approximately 200 million hectares of tribal and community-managed forests. Recent research suggests that the characteristics of forest tenure influence the ability of rural households to extract forest products and obtain income from forests (GIZ, 2015).
62 In such circumstances, some land-use activities may be complementary. On the other hand, they could create competition for resources: for example, the selective cutting of slow-growing hardwood species by charcoal producers could deplete the availability of fodder for pastoralists, and grazing by pastoralists could hinder natural tree regeneration (Minang et al., 2015).
Policy options towards a climate-smart charcoal sector 105
Examples presented in Iiyama et al. (2016) show differences in land-tenure systems. The privatization and formalization of land may provide more security; under some conditions, however, there is a risk that land clearance will accelerate as landowners look for quick returns rather than long-term investments. Experience in Kenya63 (Iiyama et al., 2014c) indicates that the formalization of land for sustainable charcoal production and use should be guided to ensure sustainable management and the equal division of benefits.
Some countries are devolving control over forests from centralized forest authorities to villages, user groups and individual households with the aim of addressing problems stemming from the failure of state management and the prevalence of open access (GIZ, 2015). Community-based forest management means that the rights and responsibilities associated with sustainable forest management are transferred to the local level; technical oversight and capacity building are provided by community authorities; and a share of taxes paid to communities or local governments is earmarked for forest maintenance and local community economic development (World Bank, 2014).
Commercially oriented production and harvesting of fuelwood and charcoal in dryland community forests began in Burkina Faso and Niger in 1985 and has since spread to Chad, Guinea, Mali and Senegal (FAO, 2016c). Box 15 provides another example of community-based forest management.
6.2 BARRIERS AND OPTIONS FOR PLANNING AND DECISION-MAKING PROCESSESPillar 2 considers planning and decision-making in key governance processes and insti-tutions, including the degree of transparency, accountability and inclusiveness of key
63 Nyakweri Forest is the largest remaining forest in the Trans Mara District in Kenya. The argument for the individualization of land tenure in the area was that more secure tenure would increase the efficiency of resource use and improve productivity. After land subdivision, local landowners – mainly from the Maasai community – invited outsiders to provide labour in clearing land for agriculture. The labourers earn money by selling the charcoal they produce from the trees they fell; landowners receive 25 percent of sales (Iiyama et al., 2014c).
BOX 15
An example of community-based forest management in woodfuel production
In Chad, under the Village VERT approach, a community may be granted the right to sell
wood-based fuels harvested and produced thereon. In return, the community is bound – via
formal agreement with the forest service – to manage the woodlands sustainably and to
use improved kiln technologies. Private-sector operators are encouraged to help communi-
ties establish rural fuelwood markets. Once a community is registered as a rural fuelwood
market, outsiders are barred from obtaining local cutting permits.
Source: Sepp (2008).
The charcoal transition106
governance processes and institutions. Further, it explores the characteristics of these processes and institutions and the space they create for the participation of stakeholders and the accountability of power-holders and decision-makers.
Stakeholder participationThe effective and efficient implementation of charcoal policies requires not only that they are relevant but also that they are legitimate, which can be enhanced by multistakeholder participation (Sepp, 2008). Stakeholder participation in woodfuel policy processes is often limited, however. Uganda, for example, has a guideline on governance in the charcoal sector aimed at regulating charcoal and creating standards that lead to the use of improved technologies and increased efficiency (e.g. improved charcoal kilns). The overall process for drafting the guideline did not seem to adequately involve local stakeholders (GCF, 2014).
In its review of the charcoal sector in the United Republic of Tanzania, the World Bank (2010) advocated that key central government agencies engage with dealer–transporter–wholesaler networks, possibly along the lines of a “charcoal roundtable” supported by an independent body of experts from research institutions, non-governmental organizations, civil-society organizations and development partners (Sander, Gros and Peter, 2013).
Central governments need to provide leadership in the development of a sustainable charcoal sector, but there is also a strong need for collaboration and information flows within government and between governmental and non-governmental actors. The private sector – such as the owners of private woodlots and woodfuel-consuming businesses – should be strongly involved (Neufeldt et al., 2015a; ESMAP, 2012). Schemes to promote sustainable charcoal production should be developed with producers, building on lessons learned from customary lands on which charcoal has been produced over long periods. Urban consumers should also be part of discussions on charcoal production, use and conservation (Gumbo et al., 2013).
Transparency and accountabilityTransparency and accountability refer to the provision of information to stakeholders and the extent to which the legal framework promotes public access to information. Information on wood-energy resources, quantities, habits and consumption patterns in the market are important but often unavailable (Mundhenk, 2015). The low rate of tax collection is an indicator of a weak system of checks and balances and ineffective accountability mechanisms (GIZ, 2015).
Reporting on charcoal-related revenue collection within existing government systems and structures needs to be strengthened and transparency – such as on the share of government revenue generated from charcoal – promoted at all levels of government as a way of obtaining greater visibility for the sector and its importance in national economies (World Bank, 2010). Transparent revenue collection and equitable revenue sharing in the charcoal value chain is the basis of a more sustainable framework for the commercial production of charcoal (ESMAP, 2012). The charcoal sector could use existing transparency initiatives such as FLEGT as a starting point.
Policy options towards a climate-smart charcoal sector 107
Stakeholder capacity and actionThe empowerment of non-government stakeholders in the charcoal sector, such as producers, consumers, women, bicycle transporters and improved-stove producers, would enable them to be more active in shaping the sector’s rules and practices (World Bank, 2010). In the context of a modern, legalized charcoal sector, facilitating charcoal producer associations or cooperatives can produce several benefits. Not only would such associations and cooperatives provide an enabling framework for investments in improved charcoal production, they could also strengthen the position of rural stakeholders in the charcoal value chain (GIZ, 2015) and support change in the social organization of charcoal production (AFREA, 2011). Cooperatives provide stakeholders with an oppor-tunity to pool resources and avoid the use of middlemen to facilitate improved charcoal technologies and transportation; ultimately, they would enable charcoal producers to increase their share of the revenue and encourage the more equitable distribution of income (UNDP, 2014a).
Adoption of voluntary standards by the private sectorCertification to national or international standards could be applied or developed for sustainably produced charcoal (Neufeldt et al., 2015b). Experiences in Kenya suggest that, for charcoal to become sustainable, its production and sale need to be standardized at the local and national levels, and a clear understanding of these standards or rules must be ensured along the entire value chain (Leopold, 2014).
The NAMA for Côte d’Ivoire recommends the establishment and promotion of an ecolabelling programme for conventional (unsustainable) and green (sustainable) charcoal. Standards would set the level of biomass management and carbonization efficiency necessary for charcoal to be considered “green” (UNDP, 2014a). The West Africa Clean Cooking Alliance provides an opportunity to develop regional policies and standards for clean cook stoves that aim to ensure that products sold as improved cook stoves are high-quality and provide cooking heat efficiently (UNDP, 2014a).
Other voluntary certification initiatives include the following:• The Forest Stewardship Council and the Programme for the Endorsement of Forest
Certification provide certificates for forest products assessed as environmentally appropriate, socially beneficial and economically viable.
• Projects addressing improved charcoal production and management could be implemented according to the Verified Carbon Standard or other standards on the voluntary carbon market. The Verified Carbon Standard includes guidelines on agriculture, forestry and other land-use projects (Peters-Stanley et al., 2013). Baseline standards are in place to support the assessment of GHG emissions from forest degradation and leakage due to charcoal production (Neufeldt et al., 2015b).64
64 There is no methodology, however, for assessing the emissions generated by an entire charcoal value chain (Neufeldt et al., 2015b).
The charcoal transition108
• The Climate, Community and Biodiversity Standards recognize land management projects that deliver net positive benefits for local communities and biodiversity in the context of voluntary climate-change mitigation projects. The Standards can be applied to any land management project, including those that reduce GHG emissions and projects that remove CO2 by sequestering carbon (Neufeldt et al., 2015b).
6.3 BARRIERS AND OPTIONS FOR IMPLEMENTATION, ENFORCEMENT AND COMPLIANCEPillar 3 examines the extent to which the policy, legal, institutional and regulatory frameworks are implemented and the effectiveness, efficiency and equitability of such implementation (FAO, 2011).
Law enforcementA lack of enforcement of woodfuel regulations, overlapping regulations among govern-ment bodies, and the predominance of informal arrangements create a disabling policy environment and leave space for corruption, including bribes. The net result is a loss of state revenues, squeezed margins for landowners and producers, and few incentives for investments in tree-planting as sustainable sources of revenue (Iiyama et al., 2016). For example, rules exist for the production, movement and trade of charcoal in Kenya but are largely ignored (Owen, 2016).
The bulk of woodfuel in Africa derives from areas where the state or forestry departments lack control over the exploitation of the resource (Gazull and Gautier, 2015).65 The lack of enforcement of existing laws and regulations undermines the effectiveness of the entire regulatory and institutional framework. The uncontrolled use of wood energy limits attempts at sustainable forest management (GIZ, 2014b; Beukering et al., 2007).
Sustainable wood-energy supplies require both regulation and enforcement (GIZ, 2014b) (Figure 19). Legal compliance is a prerequisite for formalizing and mainstreaming the charcoal sector in modern economies and a condition for viable commercial production at the community level (Owen, 2016; ESMAP, 2012). Successful enforcement targets existing vested interests and the benefits arising from existing informal mechanisms (Schure et al., 2013).
Experiences in Chad, Mali and the Niger confirm that supervision and law enforcement are major driving forces for a sustainable woodfuel supply strategy, contributing to increased revenue collection and a decline in unregulated open-access use, which leads to price increases for woodfuel. Merchants are forced to build in a “forest replacement” tax to the consumer price; such a price increase provides incentives for investment in sustainable forest management and forest plantations (GIZ, 2015).
65 Almost 80 percent of wood entering Bamako, Dakar, Niamey and Ouagadougou comes from uncontrolled areas. The percentage is even higher in central Africa, and the sustainability of the supply, therefore, is not guaranteed (Gazull and Gautier, 2015).
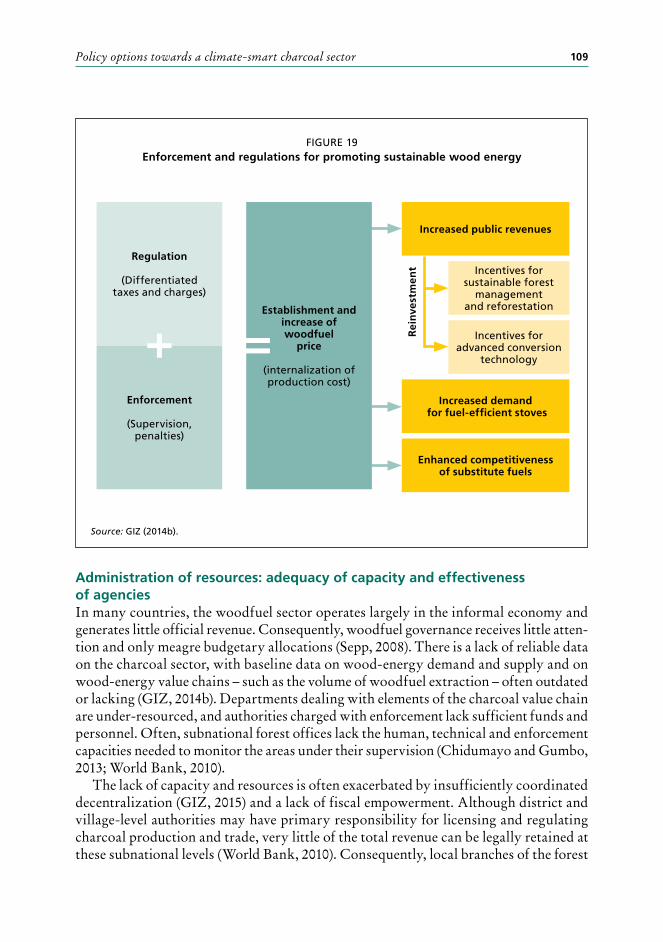
Policy options towards a climate-smart charcoal sector 109
Administration of resources: adequacy of capacity and effectiveness of agenciesIn many countries, the woodfuel sector operates largely in the informal economy and generates little official revenue. Consequently, woodfuel governance receives little atten-tion and only meagre budgetary allocations (Sepp, 2008). There is a lack of reliable data on the charcoal sector, with baseline data on wood-energy demand and supply and on wood-energy value chains – such as the volume of woodfuel extraction – often outdated or lacking (GIZ, 2014b). Departments dealing with elements of the charcoal value chain are under-resourced, and authorities charged with enforcement lack sufficient funds and personnel. Often, subnational forest offices lack the human, technical and enforcement capacities needed to monitor the areas under their supervision (Chidumayo and Gumbo, 2013; World Bank, 2010).
The lack of capacity and resources is often exacerbated by insufficiently coordinated decentralization (GIZ, 2015) and a lack of fiscal empowerment. Although district and village-level authorities may have primary responsibility for licensing and regulating charcoal production and trade, very little of the total revenue can be legally retained at these subnational levels (World Bank, 2010). Consequently, local branches of the forest
FIGURE 19Enforcement and regulations for promoting sustainable wood energy
Source: GIZ (2014b).
Increased public revenues
Incentives for sustainable forest
management and reforestation
Incentives for advanced conversion
technology
Increased demand for fuel-efficient stoves
Enhanced competitiveness of substitute fuels
Rei
nve
stm
ent
Establishment and increase of woodfuel
price
(internalization of production cost)
Regulation
(Differentiated taxes and charges)
Enforcement
(Supervision, penalties)
=+
The charcoal transition110
service have low human, technical and enforcement capacities. Institutional weaknesses lower the morale of local staff and further clear the way for corruption (GIZ, 2015).
In the United Republic of Tanzania, the lack of engagement of national, district and village authorities in the sustainable management of charcoal production, trade and use is linked to a lack of fiscal empowerment; a lack of legal empowerment (e.g. on land-use rights); and low capacity for policy implementation and enforcement by government entities (World Bank, 2010).
The main lesson learned from existing examples of community-based forest management is that allocating land tenure or long-term user rights to communities and individuals requires not only legal reforms but also accompanying development measures. Capacity and organizational development among forest users and administration, and effective law enforcement, are required.
Administering the wood-energy sector effectively requires sufficient staff capacity and effective administrative agencies, including in their information and monitoring and evaluation systems. The outcomes of monitoring and evaluation need to feed into planning and enable the assessment of the extent to which the management of the value chain complies with policies, regulations and plans (Mundhenk, 2015). To improve governance and sustainability in the charcoal sector, substantial investment is required in training and capacity development in law enforcement, financial management and reporting for charcoal-related revenue collection (Neufeldt et al., 2015b).
In improving governance and sustainability in the charcoal sector, substantial investment is also required in training and capacity development among stakeholders in the private sector. Specifically, technical support may be needed for:
• the establishment and sustainable management of forest areas, woodlands and trees outside forests, including agroforestry systems, woodlots and small-scale plantations (Neufeldt et al., 2015b);
• (participatory) sustainable forest management and community-based forest management at the village level (Sander, Gros and Peter, 2013);
• the dissemination of knowledge on improved kiln technologies (Neufeldt et al., 2015b; World Bank, 2010). Capacity building will likely be required for charcoal producers in organizational and technological skills and business management (Gumbo et al., 2013); and
• the adoption of energy-saving stoves and other energy conservation measures and technologies among consumers (Gumbo et al., 2013), which would reduce indoor air pollution (FAO, 2012a).
Cooperation and coordinationVarious ministries, departments and agencies across the forestry, energy and environ-ment portfolios at the national and subnational levels may have responsibilities for biomass energy, leading to complex governance structures (Owen, van der Plas and Sepp, 2013; Sander, Gros and Peter, 2013). A sound institutional framework is needed to coordinate sustainable resource production, clarify the mandates of stakeholders, and ensure the adequacy, reliability and stability of budgets and organizational resources
Policy options towards a climate-smart charcoal sector 111
and the availability of adequate information and technology. A high-level intersectoral coordination mechanism is crucial for harmonizing policies, strategies and planning among sectors (World Bank, 2008; Mundhenk, 2015). Recent initiatives by some African governments to establish renewable-energy agencies could play an important role in this.66 Any high-level coordination mechanism will need systems for engaging with subnational and local structures and stakeholders, including local authorities and producer groups (Gumbo et al., 2013).
CorruptionCorruption, combined with unclear policy and legal frameworks, is a major cause of unregulated or illegal charcoal activity (Chidumayo and Gumbo, 2013). Widespread corruption has a major impact on the economics of the wood-energy sector, affecting all segments of the value chain and reducing the financial benefits of legal operations (GIZ, 2015). It is estimated that bribes account for 12 percent of the final price paid by consumers for charcoal in Malawi and 20–30 percent of the final price in Kenya (Mwampamba et al., 2013; Bailis, Ezzati and Kammen, 2005a). In the United Republic of Tanzania, tax evasion in the trade segment of the charcoal chain is considered a common practice, and lax monitoring at checkpoints is a major cause of uncollected government revenues (Beukering et al., 2007). Mozambique and Côte d’Ivoire are also grappling with corruption in the charcoal value chain (Box 16).
66 The focus of these agencies is on promoting the potential of solar, wind, hydro, geothermal and biofuels – but not necessarily wood energy.
BOX 16
Impact of tax evasion and corruption on the charcoal value chain
Mozambique’s 1999 forest law states that anyone involved in commercial charcoal produc-
tion needs a licence, and local and external residents can apply individually or collectively
through local associations. Producers must identify their harvesting areas and consult with
communities to establish boundaries and negotiate benefits. They must also pay licence
fees and buy transit licences to transport up to 1 000 sacks of charcoal to market each year.
The transit licence is the main law enforcement instrument along transportation routes. The
state shares 20 percent of licence fees with the community in which the harvesting takes
place. A recent study (IIED, 2016) found, however, that individual licence-holders did not
always exploit the forest areas allocated to them. Instead, they rented part of their licences
to wholesalers, who used it to buy charcoal from other communities, although this illegal
practice was subject to heavy fines. This created discrepancies between the licensed and
actual exploitation areas and meant that local communities lost out on their portions of
licence fees. The low number of forest inspectors and the high number of licences issued had
Box 16 continues on next page
The charcoal transition112
Reforming the charcoal value chain requires establishing institutions, creating relationships among key stakeholders, and coherent policies and regulations that are properly enforced. This process should be sensitive to practices of corruption and the possible exclusion of marginalized stakeholders.
a negative effect on monitoring and law enforcement. Truck drivers reported that bribery
was the norm at checkpoints along charcoal transportation routes. Less than 10 percent of
the charcoal sold in urban markets was produced according to the forest law.
In Côte d’Ivoire, the practice of extorting woodfuel transporters at each roadblock has
virtually replaced the payment of taxes arising and may amount to XAF 200–300 per bag of
charcoal. Consequently, the charcoal supply chain is being appropriated in private taxation
(bribes) along the rural–urban supply chain, leading to estimated losses of US$8 million
annually in foregone taxes (GIZ, 2015).
Box 16 continued
© TA
MA
S BA
LOG
H / A
LAM
Y
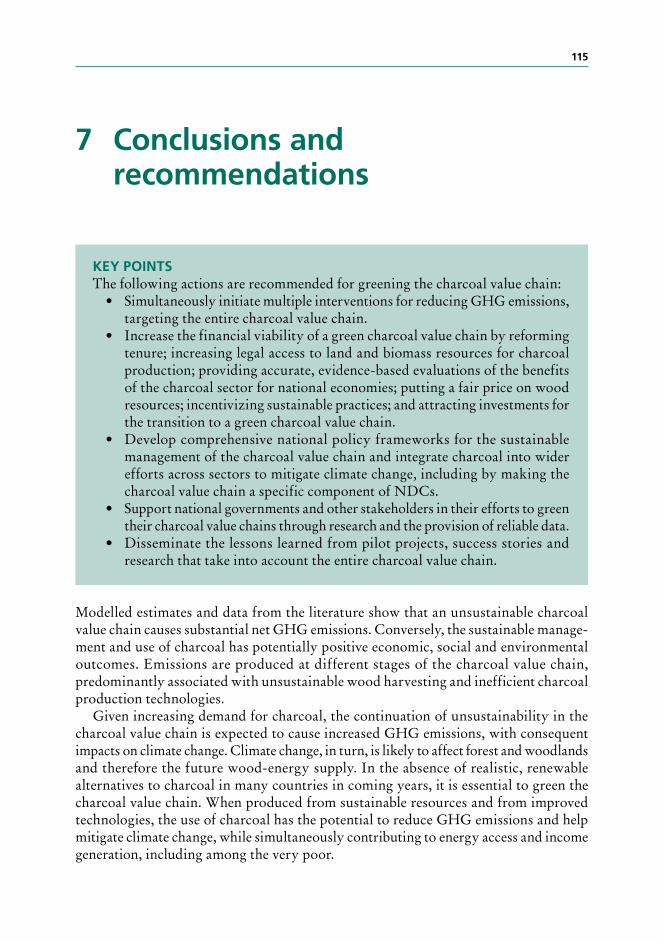
115
7 Conclusions and recommendations
KEY POINTSThe following actions are recommended for greening the charcoal value chain:
• Simultaneously initiate multiple interventions for reducing GHG emissions, targeting the entire charcoal value chain.
• Increase the financial viability of a green charcoal value chain by reforming tenure; increasing legal access to land and biomass resources for charcoal production; providing accurate, evidence-based evaluations of the benefits of the charcoal sector for national economies; putting a fair price on wood resources; incentivizing sustainable practices; and attracting investments for the transition to a green charcoal value chain.
• Develop comprehensive national policy frameworks for the sustainable management of the charcoal value chain and integrate charcoal into wider efforts across sectors to mitigate climate change, including by making the charcoal value chain a specific component of NDCs.
• Support national governments and other stakeholders in their efforts to green their charcoal value chains through research and the provision of reliable data.
• Disseminate the lessons learned from pilot projects, success stories and research that take into account the entire charcoal value chain.
Modelled estimates and data from the literature show that an unsustainable charcoal value chain causes substantial net GHG emissions. Conversely, the sustainable manage-ment and use of charcoal has potentially positive economic, social and environmental outcomes. Emissions are produced at different stages of the charcoal value chain, predominantly associated with unsustainable wood harvesting and inefficient charcoal production technologies.
Given increasing demand for charcoal, the continuation of unsustainability in the charcoal value chain is expected to cause increased GHG emissions, with consequent impacts on climate change. Climate change, in turn, is likely to affect forest and woodlands and therefore the future wood-energy supply. In the absence of realistic, renewable alternatives to charcoal in many countries in coming years, it is essential to green the charcoal value chain. When produced from sustainable resources and from improved technologies, the use of charcoal has the potential to reduce GHG emissions and help mitigate climate change, while simultaneously contributing to energy access and income generation, including among the very poor.
The charcoal transition116
The following recommendations are aimed at governmental policy-makers in developing countries and decision-makers in supportive governmental, intergovernmental, civil-society and private-sector agencies and institutions. They draw on the information presented in this report on the effectiveness of various interventions in the charcoal value chain. If adopted, they will assist in greening the charcoal value chain, for the potential benefit of millions of people, especially charcoal producers and consumers.
Recommendations for greening the charcoal value chain1. Simultaneously initiate multiple interventions for reducing GHG emissions,
targeting the entire charcoal value chain. A strong effort is needed to improve the efficiency of the charcoal value chain and thereby change it from a source of emissions to a mitigation option. This can be achieved by promoting the following seven interventions: 1) sustainable forest management; 2) alternative sources of biomass (e.g. waste, residues and trees outside forests); 3) agglomeration processes to increase the use of charcoal dust in briquettes; 4) the improved management of traditional kilns and the introduction of improved kilns; 5) cogeneration, in the case of industrial-scale production; 6) reducing fossil-fuel consumption in transportation; and 7) the use of improved cook stoves.
All seven interventions will directly reduce GHG emissions in the charcoal value chain. Modelling67 indicates that a shift from traditional kilns to highly efficient kilns could reduce GHG emissions in the carbonization process by 80 percent, and a transition from traditional to improved (state-of-the-art) cook stoves could reduce GHG emissions in that step by 63 percent.
Emission reductions can be further realized through interventions that reduce the demand of (non-sustainable) wood and that replace more GHG-intensive fuels.
The mitigation impacts of a greener charcoal value chain are optimized when multiple interventions are introduced simultaneously along the charcoal value chain. Modelled scenarios (based on a 100-year GWP in miombo woodlands) indicate, for example, that GHG emissions could decrease from 2.4 kg CO2e per MJ end use to 0.4 kg CO2e per MJ end use with multiple interventions and to 0.3 kg CO2e per MJ end use when biomass regrowth is considered, a reduction of 86 percent. Reductions increase to 90 percent on a 20-year GWP basis.
The potential for GHG emission reductions in a charcoal value chain is determined largely by context-related parameters. The largest reductions result from targeting traditional charcoal production systems in areas where deforestation rates are high or where forests are degraded.
Despite the efforts undertaken so far, the uptake of improved practices remains relatively low and largely project-based. Achieving adoption at a larger scale is
67 Based on 100-year GWP. Kilns: a reduction of 4 541 g CO2e per kg charcoal produced (80 percent), and a reduction of 3 382 g CO2e per kg charcoal produced (95 percent) when CO2 is excluded, assuming that CH4 emissions are fully flared. Stoves: a reduction of 565 g CO2e per MJ delivered (63 percent), and a reduction of 170 g CO2e per MJ delivered (83 percent) when CO2 is excluded.
Conclusions and recommendations 117
therefore a priority. Substantial efforts are required to create an enabling environment – including favourable policies and an attractive investment climate – for a greener charcoal sector.
2. Increase the financial viability of a green charcoal value chain by reforming tenure; increasing legal access to land and biomass resources for conversion to charcoal; providing accurate, evidence-based evaluations of the benefits of the charcoal sector for national economies; putting a fair price on wood resources; incentivizing sustainable practices; and attracting investments for the transition to a green charcoal value chain.Greening the charcoal sector could have considerable long-term economic value. For example, it would reduce the cost of health and environmental externalities and increase the incomes of rural people and the revenues of governments. African countries could potentially reinvest US$1.5 billion–3.9 billion of currently lost annual revenues in greening the charcoal sector. Countries can potentially attract climate funds from avoiding deforestation and GHGs.
3. Develop comprehensive national policy frameworks for the sustainable manage-ment of the charcoal value chain and integrate charcoal into wider efforts across sectors to mitigate climate change, including by making the charcoal value chain a specific component of NDCs.Appropriate government policies are required for the successful implementation of sustainable wood harvesting and improved charcoal production technologies and to attract the investments needed. This report reveals the following lessons for woodfuel governance that can contribute to greening the charcoal value chain:• Charcoal governance should encompass the entire value chain, which requires the
streamlining of policies at the national, subnational and local levels and strong coordination among ministries, agencies and other actors. It also requires the integration of woodfuel into national development, energy, environmental and food-security strategies and land-use planning.
• Higher national priority should be afforded to charcoal and its role in energy security, income generation and climate-change mitigation. The long-term policy vision should be both to improve the sustainability of the charcoal value chain and to diversify and democratize clean-energy options to reduce pressure on forests due to soaring charcoal demand.
• A sound institutional framework, based on transparency and accountability, is needed to coordinate initiatives for a sustainable charcoal value chain and to clarify the mandates of stakeholders.
• The coherence of charcoal policies with globally recognized principles and regimes increases the legitimacy and effectiveness of the sector and helps align it with other national efforts. Developing countries with high levels of charcoal use should consider options for greening the charcoal value chain in their NDCs and development strategies. With appropriate policies and sound NDCs, investments
The charcoal transition118
can be linked with climate finance options and private-sector investment to complement public investment.
• The greening of the charcoal value chain requires incentivizing policies, equitable benefit distribution and the sustainable management of lands, ecosystems and wood resources as part of overall land-use planning, landscape management and the development of a green economy.
• Effective law enforcement can increase revenue collection and investments in sustainable forest management and conversion technologies. Clarity on tenure rights and the transfer of resources and responsibilities to local structures can help in achieving sustainable forest management and improving charcoal production. Reforms of the charcoal value chain should build relationships among key stakeholders and their organizations, be sensitive to the risk of corruption, and protect the energy rights of the poor and marginalized. This requires the integration of woodfuel in poverty-reduction, development, energy, environment and land-use planning policies.
4. Support national governments and other stakeholders in their efforts to green their charcoal value chains through research and the provision of reliable data.Gaps in data and information point to an urgent need for additional studies to inform efforts to green the charcoal value chain, including the following:• systematic life-cycle assessments of the charcoal value chain in the main charcoal-
producing countries;• accurate, precise data on GHG emissions in the various stages of the charcoal
value chain;• the role of charcoal production in deforestation and forest degradation, including
in combination with other deforestation and forest degradation drivers in the vicinity of urban areas; and
• the socio-economic and environmental outcomes and trade-offs in the charcoal value chain at the local, subnational, national and regional levels.
5. Disseminate the lessons learned from pilot projects, success stories and research that take into account the entire charcoal value chain.The dissemination of best practices and lessons learned is needed to inform stakeholders on the development of a sustainable charcoal value chain at scale, considering the full range of socio-economic, policy and technical aspects.
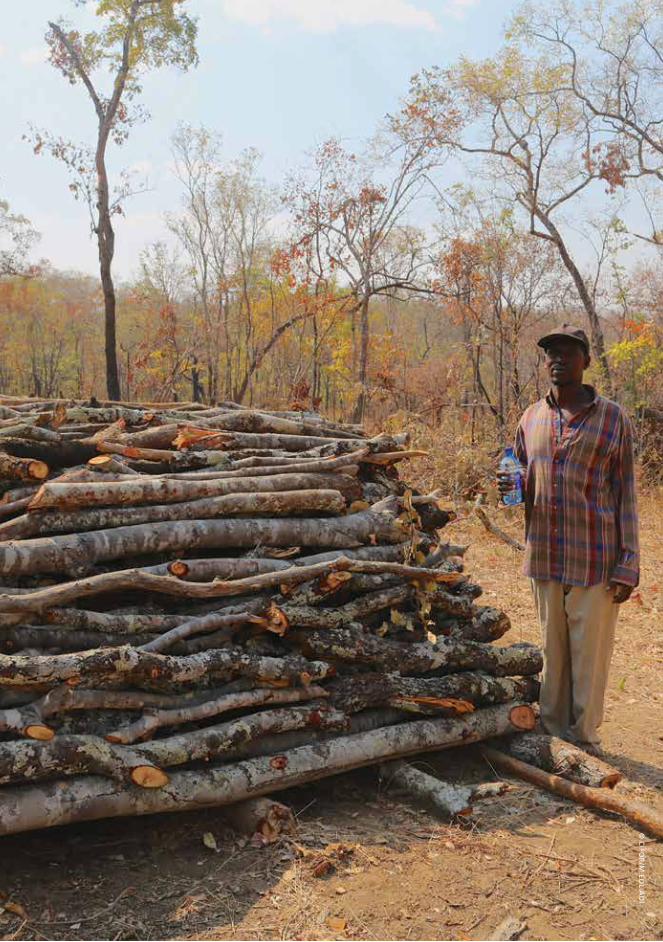
© C
IFOR
/M.ED
LIAD
I
121
Bibliography
Ackermann, K., Kirtz, L., Andriamanantseheno, C. & Sepp, S. 2014. The “green charcoal chain”. RURAL, 21: 01.
ACREST. 2011. ACREST mobile charcoal kiln final report, by M. Maenpaa, M. Mullininx, A. Musser & W. Wang. African Centre for Renewable Energy & Sustainable Technology (ACREST).
Adam, J.C. 2009. Improved and more environmentally friendly charcoal production system using a low-cost retort–kiln (Eco-charcoal). Renewable Energy, 34: 1923–1925.
AFREA. 2011. Wood-based biomass energy development for sub-Saharan Africa: issues and approaches. Africa Renewable Energy Access Program (AFREA). Washington, DC, the World Bank.
AFWC. 2016. Enhancing sustainability and efficiency of woodfuel production. Document FO:AFWC/2016/7 presented at the Twentieth Session of the African Forestry and Wildlife Commission (AFWC), Nairobi, Kenya, 1–5 February 2016.
Anang, B.T., Akuriba, M.A. & Alerigesane, A.A. 2011. Charcoal production in Gushegu district, Northern Region, Ghana: lessons for sustainable forest management. International Journal of Environmental Sciences, 1(7): 1944–1953.
Angelsen, A., Jagger, P., Babigumira, R., Belcher, B., Hogarth, N.J., Bauch, S., Börner, J., Smith-Hall, C. & Wunder, S. 2014. Environmental income and rural livelihoods: a global-comparative analysis. World Development, 64(Supplement 1): S12–S28.
Arnold, J.E.M., Köhlin, G. & Persson, R. 2006. Woodfuels, livelihoods and policy interventions: changing perspectives. World Development, 34(3): 596–611.
Bailis, R. 2009. Modeling climate change mitigation from alternative methods of charcoal production in Kenya. Biomass and Bioenergy, 33: 1491–1502.
Bailis, R. 2016. The energy-food-water nexus in charcoal production systems: introductory remarks. Paper presented at the 53rd Meeting of the Association for Tropical Biology and Conservation, Montpellier, France, 19–23 June 2016.
Bailis, R., Cowan, A., Berrueta, V. & Masera, O. 2009. Arresting the killer in the kitchen: the promises and pitfalls of commercializing improved cookstoves. World Development, 37(10): 1694–1705.
Bailis, R., Drigo, R., Ghilardi, A. & Masera, O. 2015. The carbon footprint of traditional wood fuels. Nature Climate Change, 5: 266–272 (DOI 10.1038/nclimate2491).
Bailis, R., Ezzati, M. & Kammen, D.M. 2003. Greenhouse gas implications of household energy technology in Kenya. Environmental Science & Technology, 37: 2051–2059.
Bailis, R., Ezzati, M. & Kammen, D.M. 2005a. The role of technology management in the dynamics of greenhouse gas emissions from household energy use in sub-Saharan Africa. Journal of Environment & Development, 14(1): 149–174 (DOI 10.1177/1070496504273651).
The charcoal transition122
Bailis, R., Ezzati, M. & Kammen, D.M. 2005b. Mortality and greenhouse gas impacts of biomass and petroleum energy future in Africa. Science, 308: 98–103 (DOI 10.1126/science.1106881).
Bailis, R., Pennise, D., Ezzati, M., Kammen D.M. & Kituyi, E. 2004. Impacts of greenhouse gas and particulate emissions from woodfuel production and end-use in Sub-Saharan Africa (available at http://rael.berkeley.edu/old_drupal/sites/default/files/very-old-site/OA5.1.pdf).
Bailis, R., Rujanavech, C., Dwivedi, P., Oliveira Vilela, A., Chang, H. & Carneiro de Miranda R. 2013. Innovation in charcoal production: a comparative life-cycle assessment of two kiln technologies in Brazil. Energy for Sustainable Development, 17: 189–200.
Basu, A., Blodgett, C. & Müller, N. 2013. Nationally appropriate mitigation action study on sustainable charcoal in Uganda. New York, USA, United Nations Development Programme (UNDP).
Benítez, P.C., McCallum, I., Obersteiner, M. & Yamagata, Y. 2007. Global potential for carbon sequestration: geographical distribution, country risk and policy implications. Ecological Economics, 60(3): 572–583 (DOI dx.doi.org/10.1016/j.ecolecon.2005.12.015).
Berndes, G., Abt, B., Asikainen, A., Cowie, A., Dale, V., Egnell, G., Lindner, M., Marelli, L., Paré, D., Pingoud, K. & Yeh, S. 2016. Forest biomass, carbon neutrality and climate change mitigation. From Science to Policy 3. Helsinki, European Forest Institute.
Bervoets, J., Boerstler, F., Dumas-Johansen, M., Thulstrup, A. & Xia, Z. 2016. Forests and access to energy in the context of climate change: the role of the woodfuel sector in selected INDCs in sub-Saharan Africa. Unasylva, 67(1): 53–60.
Beukering, P.J.H., Kahyararab, G., Masseya, E., di Primaa, S., Hessa, S., Makundi, V. & van der Leeuw, K. 2007. Optimization of the charcoal chain in Tanzania. PREM [Poverty Reduction and Environmental Management Working Paper] 07/03. Amsterdam, the Netherlands, Institute for Environmental Studies.
Bhattacharya, S.C., Albina, D.O. & Khaing A.M. 2002. Effects of selected parameters on performance and emission of biomass fired cookstoves. Biomass and Bioenergy, 23: 387–395.
Bhattacharya, S. & Salam P.A. 2002. Low greenhouse gas biomass options for cooking in the developing countries, Biomass and Bioenergy, 22: 305–317.
Bird, N.D., Zanchi, G., Pena, N., Havlík, P. & Frieden, D. 2011. Analysis of the potential of sustainable forest-based bioenergy for climate change mitigation. Working Paper No. 59. Bogor, Indonesia, Center for International Forestry Research (CIFOR).
Bottcher, H., Eisbrenner, K., Fritz, S., Kindermann, G., Kraxner, F., McCallum, I. & Obersteiner, M. 2009. An assessment of monitoring requirements and costs of “Reduced Emissions from Deforestation and Degradation”. Carbon Balance and Management, 4: 7 (DOI 10.1186/1750-0680-4-7).
Brocard, D., Lacaux, C., Lacaux, J.P., Kouadio, G. & Yoboue, V. 1996. Emissions from combustion of biofuels in Western Africa. In J.S. Levine, ed. Biomass, burning and global change, pp. 350–360. Volume 1. Cambridge, MA, USA, MIT Press.
Butz, R.J. 2013. Changing land management: a case study of charcoal production among a group of pastoral women in northern Tanzania. Energy for Sustainable Development, 17: 138–145.
Bibliography 123
Carneiro de Miranda, R., Bailis, R. & Oliveira Vilela, A. 2013. Cogenerating electricity from charcoaling: a promising new advanced technology. Energy for Sustainable Development, 17(2): 171–176.
CDM. 2012. Information note on the default values of fraction of non-renewable biomass for least developed countries and small island developing states. EB 67 Report Annex 22, Version 01.0 CDM Executive Board, 11 May 2012. Clean Development Mechanism (CDM).
Cerutti, P.O., Sola, P., Chenevoy, A., Iiyama, M., Yila, J., Zhou, W., Djoudi, H., Eba’a Atyi, R., Gautier, D.J., Gumbo, D., Kuehl, Y., Levang, P., Martius, C., Matthews, R., Nasi, R., Neufeldt, H., Njenga, M., Petrokofsky, G., Saunders, M., Shepherd, G., Sonwa, D.J., Sundberg C. & van Noordwijk, M. 2015. The socioeconomic and environmental impacts of wood energy value chains in Sub-Saharan Africa: a systematic map protocol. Environmental Evidence, 4:12 (DOI 10.1186/s13750-015-0038-3).
CHAPOSA. 2002. Final report of the Charcoal Potential in Southern Africa (CHAPOSA) research project – Tanzania. Swedish Environment Institute.
Chidumayo, E.N. 1993. Zambian charcoal production. Energy Policy, 21(5): 586–597.Chidumayo, E.N. 1994. Effects of wood carbonization on soil and initial development of
seedlings in miombo woodland, Zambia. Forest Ecology and Management, 70(1): 353–357.Chidumayo, E.N. & Gumbo, D.J. 2013. The environmental impacts of charcoal production
in tropical ecosystems of the world: a synthesis. Energy for Sustainable Development, 17(2): 86–94 (DOI 10.1016/j.esd.2012.07.004).
CIRAD. 2016. Project Makala. Website (available at http://makala.cirad.fr). Accessed January 2017. French Agricultural Research Centre for International Development (CIRAD).
Dam, J., Junginger, M. & Faaij, A. 2010. From the global efforts on certification of bioenergy towards an integrated approach based on sustainable land use planning. Renewable and Sustainable Energy Reviews, 14(9).
Dasappa, S. 2011. Potential of biomass energy for electricity generation in sub-Saharan Africa. Energy for Sustainable Development, 15(3): 203–213.
de Gouvello, C., Dayo, F.B. & Thioye, M. 2008. Low-carbon energy projects for development in sub-Saharan Africa: unveiling the potential, addressing the barriers. Washington, DC, International Bank for Reconstruction and Development/World Bank.
Diaoglou, V. 2016. The role of biomass in climate change mitigation: assessing the long-term dynamics of bioenergy and biochemicals in the land and energy systems. PhD thesis. Utrecht, the Netherlands, Utrecht University.
DIE. 2016. Wood energy in Sub-Saharan Africa: how to make a shadow business sustainable. Briefing Paper 14/2016. Deutsches Institut für Entwicklungspolitik (DIE).
Domac, J. & Trossero, M., eds. 2008. Environmental aspects of charcoal production in Croatia. Report for FAO project TCP/CRO/3101 (A). Zagreb, FAO.
Dramé, I. 2007. La priorité d’un programme régional qualité pour l’Afrique Central. Seen in World Bank (2008).
Drigo, R., Munyehirwe, A., Nzabanita, V. & Munyampundu, A. 2013. Rwanda supply master plan for firewood and charcoal. Support Program to the Development of the Forestry Sector (PAREF-B2) Final Report. Update and upgrade of WISDOM Rwanda and
The charcoal transition124
Woodfuels value chain analysis as a basis for a Rwanda Supply Master Plan for fuelwood and charcoal. AGRICONSULTING S.p.A.
Dubiez, E., Vermeulen, C., Peltier, R., Ingram, V., Schure, J. & Marien, J.N. 2012. Managing forest resources to secure wood energy supply for urban centers: the case of Kinshasa, Democratic Republic of Congo. Nature and Faune, 26(2): 52–57.
ECO Consult Sepp & Busacker Partnerschaft. 2013. Land rehabilitation through reforestation: the power of property rights. An innovative approach from the Republic of Madagascar.
Ekeh, O., Fangmeier, A. & Müller, J. 2014. Quantifying greenhouse gases from the production, transportation and utilization of charcoal in developing countries: a case study of Kampala, Uganda. International Journal of Life Cycle Assessment, 19(9): 643–1652 (DOI 10.1007/s11367-014-0765-7).
ESDA. 2005. National Charcoal Survey summary report: exploring the potential for a sustainable charcoal industry in Kenya. Nairobi, Kenya, Energy for Sustainable Development Africa (ESDA).
ESMAP. 2012. Commercial woodfuel production: experience from three locally controlled wood production models. Knowledge Series 012/12. Energy Sector Management Assistance Program (ESMAP).
EU/GIZ. 2012. Biomass Energy Strategy (BEST). Mozambique. Maputo.Ezzati, M., Mbinda, B. & Kammen, D. 2000. Comparison of emissions and residential
exposure from traditional and improved cookstoves in Kenya. Environmental Science and Technology, 34(4): 578–583.
FAO. 1983. Simple technologies for charcoal making. Rome (available at www.fao.org/docrep/X5328E/X5328E00.htm).
FAO. 2004. Unified bioenergy terminology. December. Rome.FAO. 2009. Biomass energy in the Asia-Pacific region: current status, trends and future
setting, by T. Gumartini. Bangkok.FAO. 2010. What woodfuels can do to mitigate climate change. FAO Forestry Paper No. 162.
Rome.FAO. 2011. Framework for assessing and monitoring forest governance. Rome, FAO and the
Program on Forests (PROFOR).FAO. 2012a. Translating the outcome of Rio+20 into action: wood energy for a sustainable
future. Background paper at the 21st Session of the Committee on Forestry. COFO/2012/5.2. Rome.
FAO. 2012b. Drivers of deforestation and forest degradation. Submission to the Secretariat of the United Nations Framework Convention on Climate Change on issues identified in Decision 1/CP. 16, paragraph 72 and Appendix II, in answer to the invitation of paragraph 5 of draft conclusions UNFCCC/SBSTA/2011/L.25.
FAO. 2012c. Urban and peri-urban forestry in Africa: the outlook for woodfuel. Urban and Peri-urban Forestry Working Paper No. 4. Rome.
FAO. 2014a. State of the World’s Forests 2014. Rome.FAO. 2014b. Bioenergy and food security rapid appraisal (BEFS RA) user manual. Charcoal.
Rome.
Bibliography 125
FAO. 2016a. Forestry for a low-carbon future: integrating forests and wood products in climate change strategies. FAO Forestry Paper No. 177. Rome.
FAO. 2016b. The agriculture sectors in the Intended Nationally Determined Contributions: analysis, by R. Strohmaier, J. Rioux, A. Seggel, A. Meybeck, M. Bernoux, M. Salvatore, J. Miranda & A. Agostini. Environment and Natural Resources Management Working Paper No. 62. Rome.
FAO. 2016c. Global Forest Resource Assessment 2015: How are the world’s forests changing? Second edition. Rome.
FAO. 2016d. FAOSTAT (dataset). Accessed December 2016. URL: http://faostat3.fao.org/faostat-gateway/go/to/browse/F/FO/E.
FAO. 2016e. Forty years of community-based forestry: a review of its extent and effectiveness. FAO Forestry Paper No. 176. Rome.
FAO & ClimateCare. 2014. Improving the value chain of charcoal production in Kenya: kiln testing, producer group outline, value chain analysis in Baringo and Kasigau Corridor and economic potential of carbon finance. FAO.
Friederich, H. 2016. Bamboo for energy in the Global South. Presentation by the Director General of the International Network for Bamboo and Rattan at a joint side event with the World Agroforestry Centre at the 22nd Session of the Conference of the Parties to the United Nations Framework Convention on Climate Change.
Fritsche, U.R., Iriarte, L., Fitzgerald, J. & Bird, N. 2014. Sustainability assurance for energy from forestry. Final report. Darmstadt, Germany, International Institute for Sustainability Analysis and Strategy (IINAS).
Gazull, L. & Gautier, D. 2015. Woodfuel in a global change context. Wiley Interdisciplinary Reviews: Energy and Environment, 4(2): 156–170.
GEF. 2013. Africa will import – not export – wood. Chevy Chase, MD, USA, Global Environment Fund (GEF).
GFC. 2014. A global overview of wood based energy: production, consumption, trends and impacts. Global Forest Coalition (GFC).
Ghilardi, A., Mwampamba, T. & Dutt, G. 2013. What role will charcoal play in the coming decades? Insights from up-to-date findings and reviews. Energy for Sustainable Development, 17: 73–74.
GIZ. 2011. Forestry Cameroon – charcoal production from sawmill waste. Factsheet.GIZ. 2014a. Multiple-household fuel use: a balanced choice between fuelwood, charcoal and
LPG. Eschborn, Germany, Deutsche Gesellschaft für Internationale Zusammenarbeit (GIZ).
GIZ. 2014b. Wood energy: renewable, profitable and modern. Eschborn, Germany, Deutsche Gesellschaft für Internationale Zusammenarbeit (GIZ).
GIZ. 2015. Towards sustainable modern wood energy development: stocktaking paper on successful initiatives in developing countries in the field of wood energy development. Eschborn, Germany, Deutsche Gesellschaft für Internationale Zusammenarbeit (GIZ).
Gmünder, S., Zah, R., Rainhard, J. & Charron-Doucet, F. 2014. Transforming Tanzania’s charcoal sector: life cycle assessment component. Dübendorf, Switzerland, Qantis.
The charcoal transition126
GTZ/EU. 2008. Biomass Energy Strategy (BEST) Rwanda. Volume 2: Background & analysis. Gesellschaft für Technische Zusammenarbeit (GTZ) and European Union (EU). Seen in GIZ (2015).
Gumbo, D. 2013. Charcoal production: can it be a sustainable enterprise? Presentation made at Lusaka, Zambia, 21 May 2013. Center for International Forestry Research (CIFOR).
Gumbo, D., Moombe, K.B., Kandulu, M.M., Kabwe, G., Ojanen, M., Ndhlovu, E. & Sunderland, T.C.H. 2013. Dynamics of the charcoal and indigenous timber trade in Zambia: a scoping study in Eastern, Northern and Northwestern provinces. CIFOR Occasional Paper 86. Bogor, Indonesia, Center for International Forestry Research (CIFOR).
Guo, L.B. & Gifford, R.M. 2002. Soil carbon stocks and land use change: a meta-analysis. Global Change Biology, 8(4): 345–360.
Gwenzi, W., Chaukurab, N., Mukomec, F.N.D., Machadod, S. & Nyamasokaa, B. 2015. Biochar production and applications in sub-Saharan Africa: opportunities, constraints, risks and uncertainties. Journal of Environmental Management, 150: 250–261.
Hautdidier, B. & Gautier, D. 2005. What local benefits does the implementation of rural wood markets in Mali generate? In M. Ros-Tonen & A.J. Dietz, eds. African forests between nature and livelihood resource, pp. 191–220. Edwin Mellen Press.
Hernandez-Soriano, M.C., Kerré, B., Kopittke, P.M., Horemans, B. & Smolders, E. 2016. Biochar affects carbon composition and stability in soil: a combined spectroscopy-microscopy study. Scientific Reports 6: 25127 (DOI 10.1038/srep25127).
Hoffmann, H. 2016. At the wooden cross-road: transforming the vicious cycle of unsustainable charcoal production into a virtuous cycle of increased producer’s resilience in Sub-Saharan Africa. Paper presented at the 53rd Meeting of the Association for Tropical Biology and Conservation, Montpellier, France, 19–23 June 2016.
Hofstad, O., Kohlin, G. & Namaalwa, J. 2009. How can emissions from wood fuel be reduced? In A. Angelsen, M. Brockhaus, M. Kanninen, E. Sills, W.D. Sunderlin & S. Wertz-Kanounnikoff, eds. Realizing REDD+: national strategy and policy options, pp. 237–249. Bogor, Indonesia, Center for International Forestry Research (CIFOR).
Hosier, R.H. & Kipondya, W. 1993. Urban household energy use in Tanzania: prices, substitutes and poverty. Energy Policy, 21(5): 454–473.
IADB. 2012. Latin America’s energy future. Discussion Paper No. IDB-DP-25. Inter-American Development Bank.
ICTSD. 2016. What’s ahead for carbon markets after COP21? International Centre for Trade and Sustainable Development (ICTSD). Website (available at www.ictsd.org/bridges-news/biores/news/what’s-ahead-for-carbon-markets-after-cop21). Accessed February 2016.
IEA. 2010. World Energy Outlook. Paris, International Energy Agency (IEA).IEA. 2014. Africa Energy Outlook: A focus on energy prospects in Sub-Saharan Africa.
International Energy Agency (IEA).IEA. 2015. Southeast Asia Energy Outlook. World Energy Outlook Special Report.
International Energy Agency (IEA).IEA. 2016a. Key World Energy Statistics for 2016. International Energy Agency (IEA).IEA. 2016b. World Energy Outlook 2016. International Energy Agency (IEA).
Bibliography 127
IEA Bioenergy. 2013. Climate change effects of biomass and bioenergy systems. IEA Bioenergy Task 38 (available at www.task38.org/publications/task38_description_2013.pdf).
IETD. 2017. Industrial Efficiency Technology Database (IETD). Information about blast furnace systems. Website (available at http://ietd.iipnetwork.org/content/blast-furnace-system). Accessed January 2017.
IIED. 2016. Charcoal supply chains from Mabalane to Maputo: who benefits? IIED Briefing, March. International Institute for Environment and Development (IIED) (available at http://pubs.iied.org/17350IIED).
Iiyama, M., Chenevoy, A., Otieno, E., Kinyanjui, T., Ndegwa, G., Vandenabeele, J., Njenga, M. & Johnson, O. 2014a. Achieving sustainable charcoal in Kenya: harnessing the opportunities for cross-sectoral integration. Technical Brief. Nairobi, World Agroforestry Centre (ICRAF) & Stockholm Environment Institute.
Iiyama, M., Neufeldt, H., Dobie, P., Hagen, R., Njenga, M., Ndegwa, G., Gasper Mowo, J., Kisoyan, P. & Jamnadass, R. 2014b. Opportunities and challenges of landscape approaches for sustainable charcoal production and use. ICRAF Policy Brief 31. Nairobi, World Agroforestry Centre (ICRAF).
Iiyama, M., Neufeldt, H., Dobie, P., Hagen, R., Njenga, M., Ndegwa, G., Mowo, J., Kisoyan, P. & Jamnadass, R. 2015. Opportunities and challenges of landscape approaches for sustainable charcoal production and use. In P.A. Minang, M. van Noordwijk, O.E. Freeman, C. Mbow, J. de Leeuw & D. Catacutan, eds. Climate-smart landscapes: multifunctionality in practice, pp. 195–209. Nairobi, World Agroforestry Centre (ICRAF).
Iiyama, M., Neufeldt, H., Dobie, P., Njenga, M., Ndegwa, G. & Jamnadass, R. 2014c. The potential of agroforestry in the provision of sustainable wood fuel in sub-Saharan Africa. Current Opinion in Environmental Sustainability, 6: 138–147.
Iiyama, M., Neufeldt, H., Njenga, M., Dobie, P., Jamnadass, R. & Mowo, J. 2016. Social-ecological systems contexts underlying the sustainability of charcoal value chains along the energy-water-food nexus in African landscapes. Paper presented at the 53rd Meeting of the Association for Tropical Biology and Conservation, Montpellier, France, 19–23 June 2016.
Iiyama, M., Njenga, M. & Meriki, S. 2014. Mara ecosystem threatened by charcoal production in Nyakweri Forest and its environs: call for landscape charcoal governance. Technical Brief 3. World Agroforestry Centre (ICRAF).
Iiyama, M., Petrokofsky, G., Kanowski, P. & Kuehl, Y. 2013. What happened to the charcoal crisis? A systematic review as a contribution to evidence-based policy on wood-based fuel in Africa. Presentation made at the World Agroforestry Centre, 11 September 2013.
Ingram, V., Haverhals, M., Petersen, S., Elias, M., Bimbika, S.B. & Sola, P. 2016. Gender and forest, tree and agroforestry value chains: evidence from literature. In C.J.P. Colfer, S.B. Bimbika & M. Elias, eds. Gender and forests: climate change, tenure, value chains and emerging issues, pp. 221–242. New York, USA, Routledge.
IPCC. 1997. Guidelines for national greenhouse gas inventories. Reference manual (revised 1996), Volume 3. Intergovernmental Panel on Climate Change (IPCC).
IPCC. 2001. Climate change 2001: the scientific basis. Intergovernmental Panel on Climate Change (IPCC). Cambridge, UK, and New York, USA Cambridge University Press.
The charcoal transition128
IPCC. 2016. Annex 3A.1: Biomass default tables for Section 3.2 Forest Land. Intergovernmental Panel on Climate Change (IPCC) (available at www.ipcc-nggip.iges.or.jp/public/gpglulucf/gpglulucf_files/Chp3/Anx_3A_1_Data_Tables.pdf).
ISO. 2017. ISO/NP 19868: Clean cookstoves and clean cooking solutions – a conceptual framework for cookstove testing protocols and performance indicators. Website (available at www.iso.org/iso/home/store/catalogue_tc/catalogue_detail.htm?csnumber=66520). International Standard Organization (ISO).
Jandl, R., Lindner, M., Vesterdal, L., Bauwens, B., Baritz, R., Hagedorn, F., Johnson, D.W., Minkkinen, K. & Byrne, K.A. 2007. How strongly can forest management influence soil carbon sequestration? Geoderma, 137(3–4): 253–268.
Jetter, J., Zhao, Y., Smith, K.R., Khan, B., Yelverton, T., DeCarlo, P. & Hays, M.D. 2012. Pollutant emissions and energy efficiency under controlled conditions for household biomass cookstoves and implications for metrics useful in setting international test standards. Environmental Science & Technology, 46(19): 10827–10834 (available at http://dx.doi.org/10.1021/es301693f).
Jones, B. 2015. Social and environmental impacts of charcoal production in Liberia. Thesis submitted in partial fulfillment of the requirements for the degree of Master of Science (Natural Resources and Environment), University of Michigan.
Kalenda, M., Ngatia, J., Ngöriareng, P.C., Simanto, O. & Oduor, N., compilers. Undated. Available charcoal production technologies in Kenya (draft copy). United Nations Development Programme (UNDP) & Kenya Forestry Service (KFS).
Kammen, D.M. & Lew, D.J. 2005. Review of technologies for the production and use of charcoal. Renewable and Appropriate Energy Laboratory Report. Berkeley, CA, USA, Energy and Resources Group and Goldman School of Public Policy, University of California (available at http://rael.berkeley.edu/sites/default/files/old-site-files/2005/Kammen-Lew-Charcoal-2005.pdf).
Kattel, R.R. 2015. Improved charcoal production for environment and economics of blacksmiths: evidence from Nepal. Journal of Agricultural Science and Technology, B5: 197–204 (DOI 10.17265/2161-6264/2015.03.006).
KFS. 2013. Analysis of the charcoal value chain in Kenya. A report by Camco Advisory Services (Kenya) Limited for the Kenya Forest Service (KFS). Nairobi, Kenya.
Kimaro, A.A., Timmer, V.R., Mugasha, A.G., Chamshama, S.A.O. & Kimaro, D.A. 2007. Nutrient use efficiency and biomass production of tree species for rotational woodlot systems in semi-arid Morogoro, Tanzania. Agroforestry Systems, 2007, 71: 175–184.
Kissinger, G., Herold, M. & De Sy, V. 2012. Drivers of deforestation and forest degradation: a synthesis report for REDD+ policymakers. Vancouver Canada, Lexeme Consulting.
Kodros, J.K., Scott, C.E., Farina, S.C., Lee, Y.H., L’Orange, C., Volckens, J. & Pierce, J.R. 2015. Uncertainties in global aerosols and climate effects due to biofuel emissions. Atmospheric Chemistry and Physics, 15(15): 8577–8596.
Lambe, F., Jürisoo, M., Wanjiru, H. & Senyagwa, J. 2015. Bringing clean, safe, affordable cooking energy to households across Africa: an agenda for action. Working Paper. Stockholm Environment Institute (available at www.sei-international.org/mediamanager/documents/Publications/NCE-SEI-2015-Transforming-household-energy-sub-Saharan-Africa-LR.pdf).
Bibliography 129
Legros, G., Havet, I., Bruce, N. & Bonjour, S. 2009. The energy access situation in developing countries: a review focusing on the least developed countries and Sub-Saharan Africa. New York, USA, United Nations Development Programme (UNDP) and World Health Organization (WHO).
Leopold, A. 2014. Sustainable charcoal: a key component of total energy access? Cornerstone, 2(2), Summer (available at http://cornerstonemag.net/sustainable-charcoal-a-key-component-of-total-energy-access).
Luoga, E.J., Witkowski, E.T.F. & Balkwill, K. 2000. Economics of charcoal production in miombo woodlands of eastern Tanzania: some hidden costs associated with commercialization of the resources. Ecological Economics, 35(2): 243–257 (DOI 10.1016/S0921-8009(00)00196-8).
Macqueen, D. & Korhaliller, S. 2011. Bundles of energy: the case for renewable biomass energy. London, International Institute for Environment and Development (IIED).
Maes, W.H. & Verbist, B. 2012. Increasing the sustainability of household cooking in developing countries: policy implications. Renewable and Sustainable Energy Reviews, 16(6): 4204–4221.
Makundi, W.R. & Sathaye, J.A. 2004. GHG mitigation potential and cost in tropical forestry: relative role for agroforestry. Environment, Development and Sustainability, 6(1): 235–260.
Malimbwi, R.E. & Zahabu, E. 2009. The analysis of sustainable charcoal production systems in Tanzania. In S. Rose, E. Remedio & M.A. Trossero, eds. Criteria and indicators for sustainable woodfuels: case studies from Brazil, Guyana, Nepal, Philippines and Tanzania, pp. 195–228. Rome, FAO.
Malimbwi, R.E., Zahabu, E., Kajembe, G.C. & Luoga, E.J. Undated. Contribution of charcoal extraction to deforestation: experience from CHAPOSA Research Project.
Marien, J.-N., Bisiaux, F., Dubiez, E., Maté, J.-P., Louppe, D., Peltier, R., Schure, J., Nkoua, M. & Vermeulen, C. 2013. Sécuriser la source de bois-énergie: de la réflexion à l’action. In J.-N. Marien, E. Dubiez, D. Louppe & A. Larzilliere, coords. Quand la ville mange la forêt: les défis du bois-énergie en Afrique central, pp. 185–204. France, Editions QUAE.
Means, P. & Lanning, C. 2013. Woody biomass supply chains (potential alternatives to charcoal). Presentation at the Clean Cooking Forum 2013, 18–23 March 2013, Phnom Penh.
Minang, P.A., van Noordwijk, M., Freeman, O.E., Mbow, C., de Leeuw, J. & Catacutan, D. eds. 2015. Climate-smart landscapes: multifunctionality in practice. Nairobi, World Agroforestry Centre (ICRAF).
Minten, B., Sander, K. & Stifel, D. 2013. Forest management and economic rents: evidence from the charcoal trade in Madagascar. Energy for Sustainable Development, 17(2): 106–115.
Mugo, F. & Ong, C. 2006. Lessons from eastern Africa's unsustainable charcoal trade. ICRAF Working Paper No 20. Nairobi, World Agroforestry Centre (ICRAF).
Mugo, F., Nungo, R., Odongo, F., Chavangi, N. & Abaru, M. 2007. An assessment of the energy saving potential and heat loss pattern in fireless cooking for selected commonly foods in Kenya. CARPA Working Paper Series No. 2.
Müller, N., Michaelowa, A. & Eschman, M. 2011. Proposal for a new standardised baseline for charcoal projects in the Clean Development Mechanism. Zurich, Switzerland, Perspectives GmbH.
The charcoal transition130
Müller, N., Spalding-Fecher, R., Bryan, S., Battye, W., Kollmuss, A., Sutter, C., Tison, S., Hayashi, D., Michaelowa, A. & Marr, M.A. 2011. Piloting greater use of standardised approaches in the Clean Development Mechanism. Phase II: Development of standardised approaches. Zurich, Switzerland.
Mutimba, S. & Barasa, M. 2005. National Charcoal Survey: exploring the potential for a sustainable charcoal industry in Kenya. Nairobi, Kenya, Energy for Sustainable Development Africa.
Mwampamba, T.H. 2007. Has the woodfuel crisis returned? Urban charcoal consumption in Tanzania and its implications to present and future forest availability. Energy Policy, 35: 4221–4234.
Mwampamba, T.H., Ghilardi, A., Sander, K. & Chaix, K.J. 2013. Dispelling common misconceptions to improve attitudes and policy outlook on charcoal in developing countries. Energy for Sustainable Development, 17(2): 75–85 (available at www.sciencedirect.com/science/article/pii/S0973082613000021).
Mwampamba, T.H., Owen, M. & Pigath, M. 2013. Opportunities, challenges and way forward for the charcoal briquette industry in Sub-Saharan Africa. Energy for Sustainable Development, 17: 158–170.
Mundhenk, M. 2015. Governance wood energy sector: comparative study of four African countries. Eschborn, Germany, Deutsche Gesellschaft für Internationale Zusammenarbeit (GIZ) GmbH.
Myhre, G., Shindell, D., Bréon, F.-M., Collins, W., Fuglestvedt, J., Huang, J., Koch, D., Lamarque, J.-F., Lee, D., Mendoza, B., Nakajima, T., Robock, A., Stephens, G., Takemura, T. & Zhang, H. 2013. Anthropogenic and natural radiative forcing. In T.F. Stocker, D. Qin, G.-K. Plattner, M. Tignor, S.K. Allen, J. Boschung, A. Nauels, Y. Xia, V. Bex & P.M. Midgley, eds. Climate change 2013: the physical science basis. Contribution of Working Group I to the Fifth Assessment Report of the Intergovernmental Panel on Climate Change. Cambridge, UK and New York, USA, Cambridge University Press.
Namaalwa, J., Hofstad, O. & Sankhayan, P.L. 2009. Achieving sustainable charcoal supply from woodlands to urban consumers in Kampala, Uganda. International Forestry Review, 11(1): 64–78.
Ndegwa, G.M., Nehren, U., Grüninger, F., Iiyama, M. & Anhuf, D. 2016. Charcoal production through selective logging leads to degradation of dry woodlands: a case study from Mutomo District, Kenya. Journal of Arid Land, 8: 618–631 (DOI 10.1007/s40333-016-0124-6).
Neufeldt, H., Dobie, P., Iiyama, M., Njenga, M., Mohan, S. & Neely, C. 2015a. Developing sustainable tree-based bioenergy systems in sub-Saharan Africa. ICRAF Policy Brief No. 28. Nairobi, World Agroforestry Centre (ICRAF).
Neufeldt, H., Langford, K., Fuller, J., Iiyama, M. & Dobie, P. 2015b. From transition fuel to viable energy source: improving sustainability in the sub-Saharan charcoal sector. ICRAF Working Paper No. 196. Nairobi, World Agroforestry Centre (ICRAF) (available at http://dx.doi.org/10.5716/WP15011.PDF).
Njenga, M., Iiyama, M., Jamnadass, R., Neely, C. & Neufeldt, H. 2015. Agroforestry for sustainable wood energy. Presentation at the Global Landscapes Forum, Paris, 6 December 2015.
Bibliography 131
Njenga, M., Karanja, N., Jamnadass, R., Kithinji, J., Sundberg, C. & Jirjis, R. 2013. Quality of briquettes produced locally from charcoal dust and sawdust in Kenya. Journal of Biobased Materials and Bioenergy, 7: 1–8.
Njenga, M., Karanja, N., Karlsson, H., Jamnadass, R., Iiyama, M., Kithinji, J. & Sundberg, C. 2014. Additional cooking fuel supply and reduced global warming potential from recycling charcoal dust into charcoal briquette in Kenya. Journal of Cleaner Production, 81(15): 81–88.
NL Agency. 2010. Making charcoal production in Sub Sahara Africa sustainable. Utrecht, the Netherlands, NL Agency and BTG Biomass Technology Group BV.
NL Agency. 2013. Charcoal production from alternative feedstocks. Netherlands Programmes Sustainable Biomass, Utrecht, the Netherlands. NL Agency and BTG Biomass Technology Group BV.
Oduor, N., Githiomi, J. & Chikamau, B. 2006. Charcoal production using improved earth, portable metal, drum and casamance kilns. Nairobi, Kenya Forestry Research Institute.
Oduor, N., Ngugi, W. & Gathui, T. 2012. Sustainable tree management for charcoal production. Acacia Species in Kenya. Acacia pocketbook. Nairobi, Kenya Forestry Research Institute.
Okello, B.D., O’Conner, T.G. & Young, T.P. 2001. Growth, biomass estimates, and charcoal production of Acacia drepanolobium in Laikipia, Kenya. Forest Ecology and Management, 142(1–3): 143–153.
Openshaw, K. 1997. Urban biomass fuels: production, transportation and trading study: a consolidated report. Lilongwe, Malawi, Ministry of Energy and Mining.
Openshaw, K. 2011. Supply of woody biomass, especially in the tropics: is demand outstripping sustainable supply? International Forestry Review, 13(4): 487–499.
Owen, M. 2016. Barriers to legal charcoal production by large landowners in Kenya. Paper presented at the 53rd Meeting of the Association for Tropical Biology and Conservation, Montpellier, France.
Owen, M., van der Plas, R. & Sepp, S. 2013. Can there be an energy policy in sub-Saharan Africa without biomass? Energy for Sustainable Development, 17(2): 146–152.
Partey, S.T., Frith, O.B., Kwaku, M.Y. & Sarfo, D.A. 2016. Comparative life cycle analysis of producing charcoal from bamboo, teak, and acacia species in Ghana. International Journal of Life Cycle Assessment, 1–9 (DOI 10.1007/s11367-016-1220-8).
Pennise, D.M., Smith, K.R., Kithinji, J.P., Rezende, M.E., Raad, T.J., Zhang, J. & Fan, C. 2001. Emissions of greenhouse gases and other airborne pollutants from charcoal making in Kenya and Brazil. Journal of Geophysical Research, 106(D20): 24 143–24 155.
Peters-Stanley, M., Gonzalez, G. & Yin, D. 2013. Covering new ground: state of the forest carbon markets 2013. Washington DC, Forest Trends’ Ecosystem Marketplace.
Phosiso, S. 2014. Women and charcoal value chains of eastern and southern Africa. Presentation at the 2014 IUFRO World Congress, Salt Lake City, USA, 5–11 October 2014.
ProPSFE. 2014. Programme Germano-cermounais d’appui au Programme Sectoriel Forêt et Environnement (ProPSFE): project pilote de production du charbon de boi à partir des rebuts de sciage pour alimenter le fonds de développement local de Mbang. Final report.
REN21. 2015. Renewables 2015: global status report. Renewable Energy Policy Network for the 21st Century (REN21).
The charcoal transition132
Reumerman, P.J. & Frederiks, B. 2002. Charcoal production with reduced emissions. Paper presented at the 12th European Conference on Biomass for Energy, Industry and Climate Protection, Amsterdam, the Netherlands.
Roman-Cuesta, R.M., Rufino, M.C., Herold, M., Butterbach-Bahl, K., Rosenstock, T.S., Herrero, M., Ogle, S., Li, C., Poulter, B., Verchot, L., Martius, C., Stulver, J. & de Bruin, S. 2016. Hotspots of gross emissions from the land use sector: patterns, uncertainties, and leading emission sources for the period 2000–2005 in the tropics. Biogeosciences, 13: 4253–4269 (DOI 10.5194/bg-13-4253-2016).
Romijn, H.A. 2011. Land clearing and greenhouse gas emissions from jatropha biofuels on African miombo woodlands. Energy Policy, 39(10): 5751–5762.
Rousset, P., Caldeira-Pires, A., Sablowski, A. & Rodrigues, T. 2011. LCA of eucalyptus wood charcoal briquettes. Journal of Cleaner Production, 19(14): 1647–1653.
Rüter, S., Werner, F., Forsell, N., Prins, C., Vial, E. & Levet, A.-L. 2016. ClimWood2030: climate benefits of material substitution by forest biomass and harvested wood products: perspective 2030. Final report. Thünen Report 42. Braunschweig, Germany, Johann Heinrich von Thünen-Institut (DOI 10.3220/REP1468328990000).
Rwanda Natural Resources Authority. 2014. Sustainable charcoal production and the potential role of climate financing: identifying and prioritizing appropriate actions and interventions. Workshop report, Kigali, 7 October 2014.
Sander, K. 2015. Biomass energy, green growth and FLR: learning from the past for the future. Presentation at the 17th Rights and Resources Initiative Dialogue on Forests, Governance, and Climate Change: Forest Tenure, Restoration, and Green Growth. 18 June 2015, Washington, DC.
Sander, K., Gros, C. & Peter, C. 2013. Enabling reforms: analyzing the political economy of the charcoal sector in Tanzania. Energy for Sustainable Development, 17(2): 116–126.
Schure, J., Ingram, V., Sakho-Jimbira, M.S., Levang, P. & Wiersum, K.F. 2013. Formalisation of charcoal value chains and livelihood outcomes in Central- and West Africa. Energy for Sustainable Development, 17(2): 95–105.
Schure, J., Levang, P. & Wiersum, K.F. 2014. Producing woodfuel for urban centers in the Democratic Republic of Congo: a path out of poverty for rural households? World Development, 64: S80–S90 (DOI http://dx.doi.org/10.1016/j.worlddev.2014.03.013).
Schure, J., Marien, J.N., de Wasseige, C., Drigo, R., Salbitano, F., Dirou, S. & Nkoua, M. 2010. Contribution of wood-fuel to meet the energy needs of the population of Central Africa: prospects for sustainable management of available resources. In C. de Wasseige, P. de Marcken, N. Bayol, F. Hiol Hiol, Ph. Mayaux, B. Desclée, R. Nasi, A. Billand, P. Defourny & R. Eba’a Atyi, eds. The forests of the Congo Basin: state of the forest 2010, pp. 109–122.
SEI. 2016. How Kenya can transform the charcoal sector and create new opportunities for low-carbon rural development. Discussion Brief. Stockholm Environment Institute (SEI) (available at www.sei-international.org/mediamanager/documents/Publications/SEI-UNDP-DB-2016-Kenya-sustainable-charcoal.pdf).
Seidel, A. 2008. Charcoal in Africa: importance, problems and possible solution strategies. Eschborn, Germany, Deutsche Gesellschaft für Technische Zusammenarbeit (GTZ).
Bibliography 133
Sepp, S. 2008. Shaping charcoal policies: context, process and instruments as exemplified by country cases. In R. Kwaschik, ed. Proceedings of the Conference on Charcoal and Communities in Africa, 16–18 June 2008, Maputo, Mozambique. International Network for Bamboo and Rattan (INBAR).
Sepp, S. 2014a. Reboisement Villageois Individuel: exploration de la possibilité d’intégrer l’approche RVI de Madagascar au Projet Promotion des Filières Agricoles et de la Biodiversité (PROFIAB) en Côte d’Ivoire. Bonn, GIZ-CCD-Project.
Sepp, S. 2014b. RVI-upscaling: project design study. Bonn, GIZ Sector Project to Combat Desertification.
Shah, N., Girard, P., Mezerette, C. & Vergnet, A.M. 1992. Wood-to-charcoal conversion in a partial-combustion kiln: an experimental study to understand and upgrade the process. Fuel, 71: 995–962.
Shively, G., Jagger, P., Sserunkuuma, D., Arinaitwe, A. & Chibwana, C. 2010. Profits and margins along Uganda’s charcoal value chain. International Forestry Review, 12(3): 270–283.
Sjølie, H.K. 2012. Reducing greenhouse gas emissions from households and industry by the use of charcoal from sawmill residues in Tanzania. Journal of Cleaner Production, 27: 109–117.
Smith, K.R., Pennise, D.M., Khummongkol, P., Chaiwong, V., Ritgeen, K., Zhang, J., Panyathanya, W., Rasmussen, R.A. & Khalil, M.A.K. 1999. Greenhouse gases from small-scale combustion in developing countries: charcoal making kilns in Thailand. Washington, DC, US Environment Protection Agency.
Smith, K.R., Uma, R., Kishore, V.V.N., Lata, K., Joshi, V., Zhang, J., Rasmussen, R.A. & Khalil, M.A.K. 2000. Greenhouse gases from small-scale combustion devices in developing countries: Phase IIA: household stoves in India. Washington, DC, US Environment Protection Agency.
SNV. 2013. Wood energy and climate change mitigation in Sub-Saharan Africa: a tool to design REDD-friendly woodfuel value chains, by J. Schure, G.P. Dkamela & A. van der Goes, SNV, Burkina Faso.
SNV. 2015. Successful cookstove distribution models: eight success factors to reach the last mile.Sola, P. & Gumbo, D. 2014. Women and charcoal value chains of Eastern and Southern
Africa. Paper presented at the IUFRO 2014 World Congress. International Union for Forest Research Organizations (IUFRO).
Stern, N. 2007. The economics of climate change: the Stern review. Cambridge, UK, Cambridge University Press.
Swami, S.N., Teixeira, W.G. & Lehmann, J. 2009. Charcoal making in the Brazilian Amazon: economic aspects of production and carbon conversion efficiencies of kilns. In: W.I. Woods, W.G. Teixeira, J. Lehmann, C. Steiner, A.M.G.A. WinklerPrins & L. Rebellato, eds. Amazonian dark earths: Wim Sombroek's vision, pp. 411–422. Springer Science+Business Media B.V.
Tabuti, J.R.S., Dhillion, S.S. & Lye, K.A. 2003. Firewood use in Bulamogi County, Uganda: species selection, harvesting and consumption patterns. Biomass and Bioenergy, 25(6): 581–596 (DOI 10.1016/S0961-9534(03)00052-7).
The charcoal transition134
Taccini, M.M. 2010. Estudo das metodologias da convenção quadro das Nações Unidas sobre mudanças clímaticas, referentes a avaliação de emissões de gases de efeito estufa na produção de carvão vegetal. Master of Science thesis. Piracicaba, Brazil, Luiz de Queiroz College of Agriculture, University of São Paulo.
TFCG. 2016. Most Tanzanians depend on woodfuel from natural forests for cooking: policy guidance to ensure a sustainable woodfuel supply is needed. Policy Brief. Tanzania Forest Conservation Group (TFCG).
Thomson, A., César Izaurralde, R., Smith, S.J. & Clarke, L.E. 2007. Integrated estimates of global terrestrial carbon sequestration. Global Environmental Change, 18(1): 192–203 (DOI 10.1016/j.gloenvcha.2007.10.002).
UNDP. 2013. Nationally appropriate mitigation action study on sustainable charcoal in Uganda. New York, USA, United Nations Development Programme (UNDP).
UNDP. 2014a. NAMA study for a sustainable charcoal value chain in Côte d’Ivoire. New York, USA, United Nations Development Programme (UNDP).
UNDP. 2014b. NAMA study for a sustainable charcoal value chain in Ghana. New York, USA, United Nations Development Programme (UNDP).
UNEP. 2010. Green economy developing countries success stories. Geneva, Switzerland, United Nations Environment Programme (UNEP).
UNEP. 2014. Information note by the secretariat on illegal trade in wildlife: the environmental, social and economic consequences for sustainable development. UNEP/EA.1/INF/19. First Session of the United Nations Environment Assembly. Nairobi, United Nations Environment Programme (UNEP).
UNEP. 2016. Improving efficiency in forestry operations and forest product processing in Kenya: a viable REDD+ policy and measure? Summary for policy makers. Nairobi, United Nations Environment Programme (UNEP).
UNFCCC. 2006. Mitigation of methane emissions in the charcoal production of Plantar, Brazil. Clean Development Mechanism project design document form (CDM-PDD). Version 03-in effect as of: 28 July 2006. United Nations Framework Convention on Climate Change (UNFCCC).
UNFCCC. 2007. Mitigation of methane emissions in the charcoal production of Plantar, Brazil. Project design document. Version 6.a. Clean Development Mechanism of the United Nations Framework Convention on Climate Change (UNFCCC).
UNFCCC. 2015. Climate action now: summary for policymakers 2015. Bonn, Germany, United Nations Framework Convention on Climate Change Secretariat (UNFCCC) (available at http://climateaction2020.unfccc.int/media/1173/21789-spm-unfccc-lowres.pdf).
UNFCCC. 2016. Kyoto Protocol. Website (available at http://unfccc.int/kyoto_protocol/items/3145.php). Accessed 17 January 2017.
US EPA. 1995. Compilation of air pollution emission factors. Volume 1: Stationary point and area sources. Fifth edition. Suppl. A, Rep. AP-42. Research Triangle Park, USA, United States Environment Protection Agency.
Van Eijck, J., Romijn, H., Smeets, E., Bailis, R., Rooijakkers, M., Hooijkaas, N., Verweij, P. & Faaij, A. 2014. Comparative analysis of key socio-economic and environmental impacts
Bibliography 135
of smallholder and plantation based jatropha biofuel production systems in Tanzania. Biomass and Bioenergy, 61: 25–45.
Verheijen, F., Jeffrey, S.L., Bastos, A.C., van der Velde, M. & Diafas, L. 2010. Biochar application to soils: a critical scientific review of effects on soil properties, processes and functions. Report no. EUR 24099 EN. Luxembourg, Office for Official Publications of the European Communities.
Vos, J. & Vis, M. 2010. Making charcoal production in Sub Sahara Africa sustainable. The Netherlands, NL Agency.
WBA. 2010. WBA position paper on certification criteria for sustainable biomass for energy. World Bioenergy Association (WBA).
WBA. 2012. The carbon neutrality of biomass from forests. Fact sheet. World Bioenergy Association (WBA).
World Bank. 1998. Staff appraisal report. Republic of Chad Household Energy Project. Report No: 17780-CD. Washington, DC.
World Bank. 2004. Implementation completion report on a credit in the amount of SDR 4.0 million to the Republic of Chad for a household energy project. Report No: 30711. Washington, DC.
World Bank. 2009. Environmental crisis or sustainable development opportunity? Transforming the charcoal sector in Tanzania. A policy note. Washington, DC, seen in GIZ (2015).
World Bank. 2010. Enabling reforms: a stakeholder-based analysis of the political economy of Tanzania's charcoal sector and the poverty and social impacts of proposed reforms. Washington, DC.
World Bank. 2012a. Establishing a green charcoal chain in Rwanda: a feasibility study. Washington, DC.
World Bank. 2012b. Forests, trees, and woodlands in Africa: an action plan for World Bank engagement. Washington, DC.
World Bank. 2014. Clean and improved cooking in sub-Saharan Africa. Second edition. Washington, DC.
Xia, Z. 2013. Domestic biogas in a changing China: can biogas still meet the energy needs of China’s rural households? London, International Institute for Environment and Development (IIED) (available at http://pubs.iied.org/pdfs/16553IIED.pdf).
Yonemitsu, A., Njenga, M., Iiyama, M. & Matsushita, S. 2015. A choice experiment study on fuel preference of Kibera Slum households in Kenya. International Journal of Environmental Science and Development, 6(3) (DOI 10.7763/IJESD.2015.V6.589).
Zomer, R.J., Trabucco, A., Bossio, D.A. & Verchot, L.V. 2008. Climate change mitigation: a spatial analysis of global land suitability for Clean Development Mechanism afforestation and reforestation. Agriculture, Ecosystems and Environment, 126: 67–80.
Zulu, L.C. 2010. The forbidden fuel: charcoal, urban wood fuel demand and supply dynamics, community forest management and wood fuel policy in Malawi. Energy Policy, 38(7): 3717–3730.
Zulu, L.C. & Richardson, R.B. 2013. Charcoal, livelihoods and poverty reduction: evidence from sub-Saharan Africa. Energy for Sustainable Development, 17(2): 127–137.
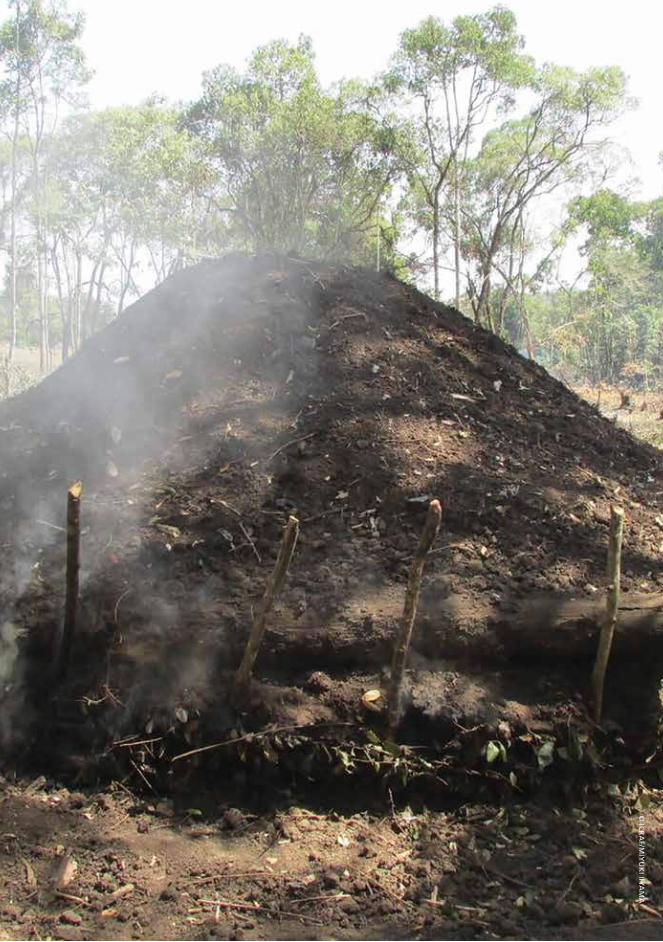
© IC
RA
F/MIY
UK
I IIYA
MA

Annexes
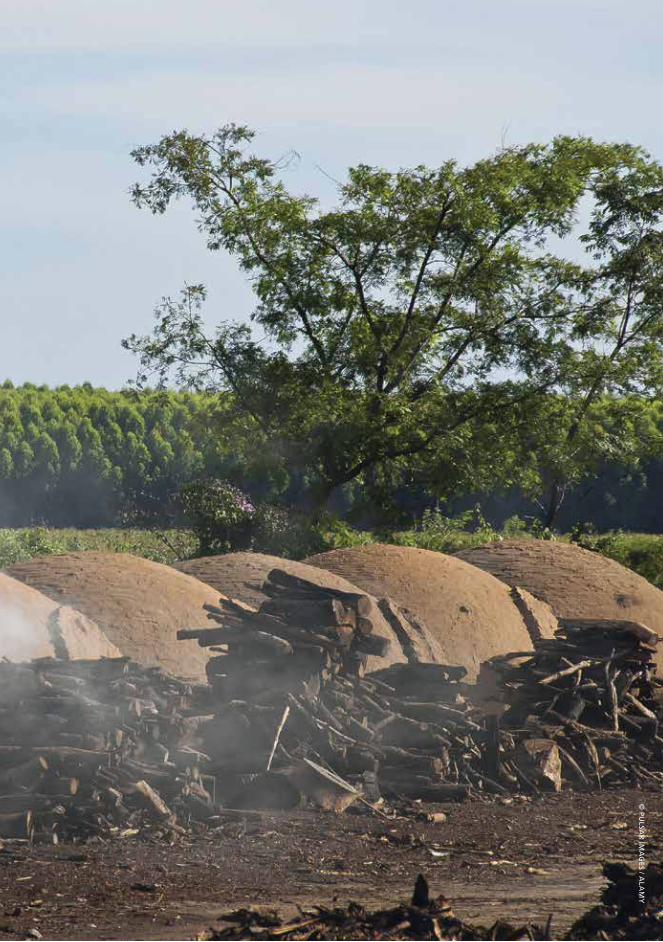
© PU
LSAR
IMA
GES / A
LAM
Y
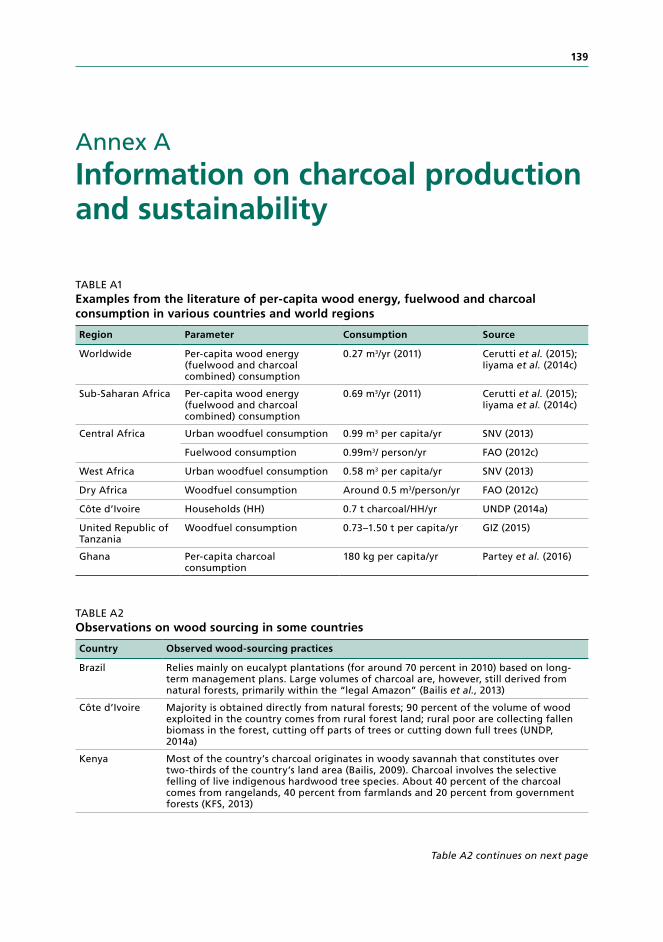
139
Annex A Information on charcoal production and sustainability
TABLE A1Examples from the literature of per-capita wood energy, fuelwood and charcoal consumption in various countries and world regions
Region Parameter Consumption Source
Worldwide Per-capita wood energy (fuelwood and charcoal combined) consumption
0.27 m3/yr (2011) Cerutti et al. (2015); Iiyama et al. (2014c)
Sub-Saharan Africa Per-capita wood energy (fuelwood and charcoal combined) consumption
0.69 m3/yr (2011) Cerutti et al. (2015); Iiyama et al. (2014c)
Central Africa Urban woodfuel consumption 0.99 m3 per capita/yr SNV (2013)
Fuelwood consumption 0.99m3/ person/yr FAO (2012c)
West Africa Urban woodfuel consumption 0.58 m3 per capita/yr SNV (2013)
Dry Africa Woodfuel consumption Around 0.5 m3/person/yr FAO (2012c)
Côte d’Ivoire Households (HH) 0.7 t charcoal/HH/yr UNDP (2014a)
United Republic of Tanzania
Woodfuel consumption 0.73–1.50 t per capita/yr GIZ (2015)
Ghana Per-capita charcoal consumption
180 kg per capita/yr Partey et al. (2016)
TABLE A2Observations on wood sourcing in some countries
Country Observed wood-sourcing practices
Brazil Relies mainly on eucalypt plantations (for around 70 percent in 2010) based on long-term management plans. Large volumes of charcoal are, however, still derived from natural forests, primarily within the “legal Amazon” (Bailis et al., 2013)
Côte d’Ivoire Majority is obtained directly from natural forests; 90 percent of the volume of wood exploited in the country comes from rural forest land; rural poor are collecting fallen biomass in the forest, cutting off parts of trees or cutting down full trees (UNDP, 2014a)
Kenya Most of the country’s charcoal originates in woody savannah that constitutes over two-thirds of the country’s land area (Bailis, 2009). Charcoal involves the selective felling of live indigenous hardwood tree species. About 40 percent of the charcoal comes from rangelands, 40 percent from farmlands and 20 percent from government forests (KFS, 2013)
Table A2 continues on next page
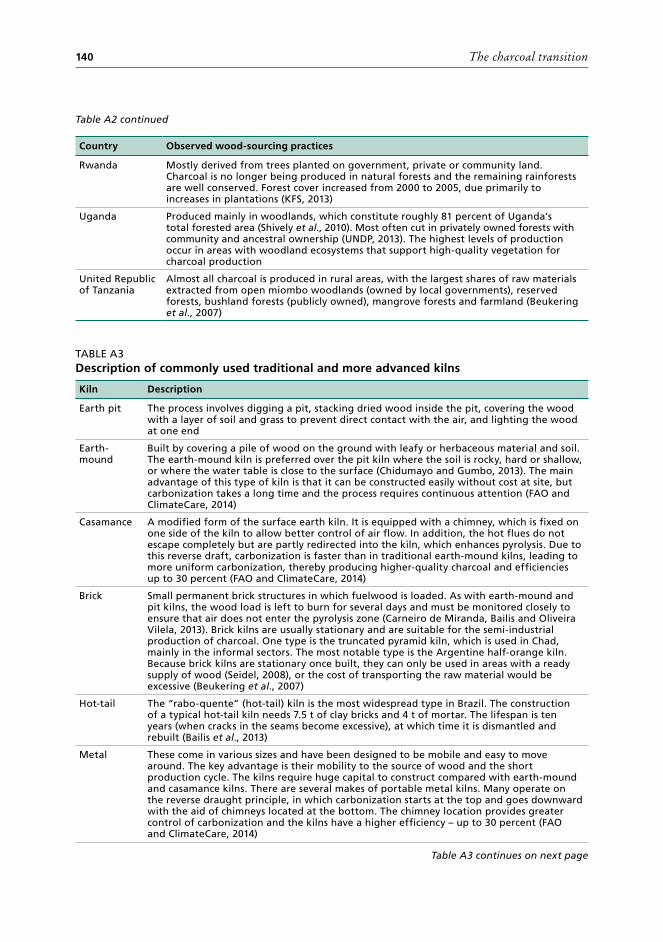
The charcoal transition140
Country Observed wood-sourcing practices
Rwanda Mostly derived from trees planted on government, private or community land. Charcoal is no longer being produced in natural forests and the remaining rainforests are well conserved. Forest cover increased from 2000 to 2005, due primarily to increases in plantations (KFS, 2013)
Uganda Produced mainly in woodlands, which constitute roughly 81 percent of Uganda’s total forested area (Shively et al., 2010). Most often cut in privately owned forests with community and ancestral ownership (UNDP, 2013). The highest levels of production occur in areas with woodland ecosystems that support high-quality vegetation for charcoal production
United Republic of Tanzania
Almost all charcoal is produced in rural areas, with the largest shares of raw materials extracted from open miombo woodlands (owned by local governments), reserved forests, bushland forests (publicly owned), mangrove forests and farmland (Beukering et al., 2007)
TABLE A3Description of commonly used traditional and more advanced kilns
Kiln Description
Earth pit The process involves digging a pit, stacking dried wood inside the pit, covering the wood with a layer of soil and grass to prevent direct contact with the air, and lighting the wood at one end
Earth-mound
Built by covering a pile of wood on the ground with leafy or herbaceous material and soil. The earth-mound kiln is preferred over the pit kiln where the soil is rocky, hard or shallow, or where the water table is close to the surface (Chidumayo and Gumbo, 2013). The main advantage of this type of kiln is that it can be constructed easily without cost at site, but carbonization takes a long time and the process requires continuous attention (FAO and ClimateCare, 2014)
Casamance A modified form of the surface earth kiln. It is equipped with a chimney, which is fixed on one side of the kiln to allow better control of air flow. In addition, the hot flues do not escape completely but are partly redirected into the kiln, which enhances pyrolysis. Due to this reverse draft, carbonization is faster than in traditional earth-mound kilns, leading to more uniform carbonization, thereby producing higher-quality charcoal and efficiencies up to 30 percent (FAO and ClimateCare, 2014)
Brick Small permanent brick structures in which fuelwood is loaded. As with earth-mound and pit kilns, the wood load is left to burn for several days and must be monitored closely to ensure that air does not enter the pyrolysis zone (Carneiro de Miranda, Bailis and Oliveira Vilela, 2013). Brick kilns are usually stationary and are suitable for the semi-industrial production of charcoal. One type is the truncated pyramid kiln, which is used in Chad, mainly in the informal sectors. The most notable type is the Argentine half-orange kiln. Because brick kilns are stationary once built, they can only be used in areas with a ready supply of wood (Seidel, 2008), or the cost of transporting the raw material would be excessive (Beukering et al., 2007)
Hot-tail The “rabo-quente” (hot-tail) kiln is the most widespread type in Brazil. The construction of a typical hot-tail kiln needs 7.5 t of clay bricks and 4 t of mortar. The lifespan is ten years (when cracks in the seams become excessive), at which time it is dismantled and rebuilt (Bailis et al., 2013)
Metal These come in various sizes and have been designed to be mobile and easy to move around. The key advantage is their mobility to the source of wood and the short production cycle. The kilns require huge capital to construct compared with earth-mound and casamance kilns. There are several makes of portable metal kilns. Many operate on the reverse draught principle, in which carbonization starts at the top and goes downward with the aid of chimneys located at the bottom. The chimney location provides greater control of carbonization and the kilns have a higher efficiency – up to 30 percent (FAO and ClimateCare, 2014)
Table A2 continued
Table A3 continues on next page
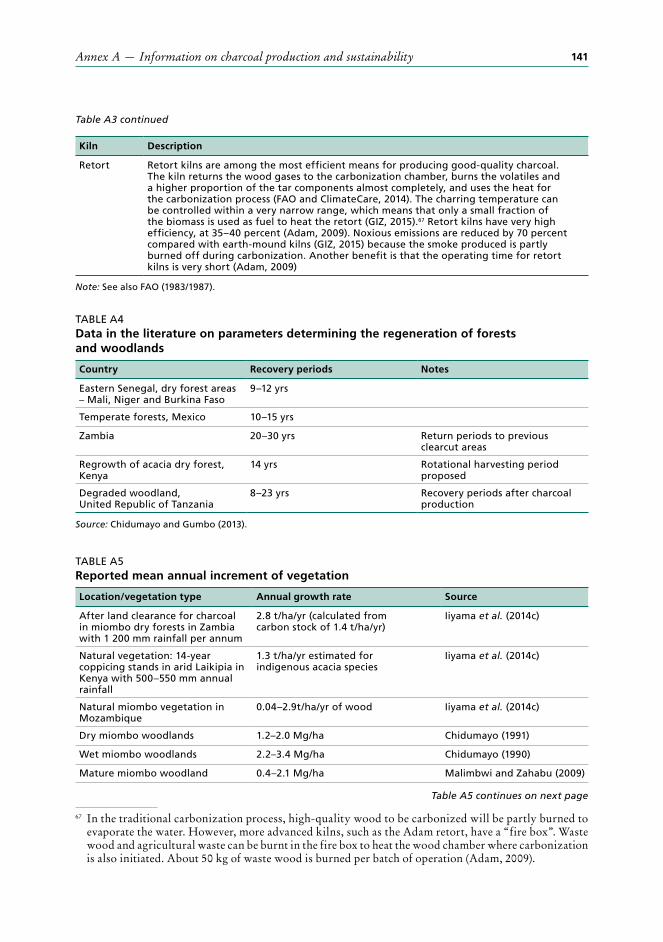
Annex A — Information on charcoal production and sustainability 141
Kiln Description
Retort Retort kilns are among the most efficient means for producing good-quality charcoal. The kiln returns the wood gases to the carbonization chamber, burns the volatiles and a higher proportion of the tar components almost completely, and uses the heat for the carbonization process (FAO and ClimateCare, 2014). The charring temperature can be controlled within a very narrow range, which means that only a small fraction of the biomass is used as fuel to heat the retort (GIZ, 2015).67 Retort kilns have very high efficiency, at 35–40 percent (Adam, 2009). Noxious emissions are reduced by 70 percent compared with earth-mound kilns (GIZ, 2015) because the smoke produced is partly burned off during carbonization. Another benefit is that the operating time for retort kilns is very short (Adam, 2009)
Note: See also FAO (1983/1987).
TABLE A4Data in the literature on parameters determining the regeneration of forests and woodlands
Country Recovery periods Notes
Eastern Senegal, dry forest areas – Mali, Niger and Burkina Faso
9–12 yrs
Temperate forests, Mexico 10–15 yrs
Zambia 20–30 yrs Return periods to previous clearcut areas
Regrowth of acacia dry forest, Kenya
14 yrs Rotational harvesting period proposed
Degraded woodland, United Republic of Tanzania
8–23 yrs Recovery periods after charcoal production
Source: Chidumayo and Gumbo (2013).
TABLE A5Reported mean annual increment of vegetation
Location/vegetation type Annual growth rate Source
After land clearance for charcoal in miombo dry forests in Zambia with 1 200 mm rainfall per annum
2.8 t/ha/yr (calculated from carbon stock of 1.4 t/ha/yr)
Iiyama et al. (2014c)
Natural vegetation: 14-year coppicing stands in arid Laikipia in Kenya with 500–550 mm annual rainfall
1.3 t/ha/yr estimated for indigenous acacia species
Iiyama et al. (2014c)
Natural miombo vegetation in Mozambique
0.04–2.9t/ha/yr of wood Iiyama et al. (2014c)
Dry miombo woodlands 1.2–2.0 Mg/ha Chidumayo (1991)
Wet miombo woodlands 2.2–3.4 Mg/ha Chidumayo (1990)
Mature miombo woodland 0.4–2.1 Mg/ha Malimbwi and Zahabu (2009)
67 In the traditional carbonization process, high-quality wood to be carbonized will be partly burned to evaporate the water. However, more advanced kilns, such as the Adam retort, have a “fire box”. Waste wood and agricultural waste can be burnt in the fire box to heat the wood chamber where carbonization is also initiated. About 50 kg of waste wood is burned per batch of operation (Adam, 2009).
Table A3 continued
Table A5 continues on next page
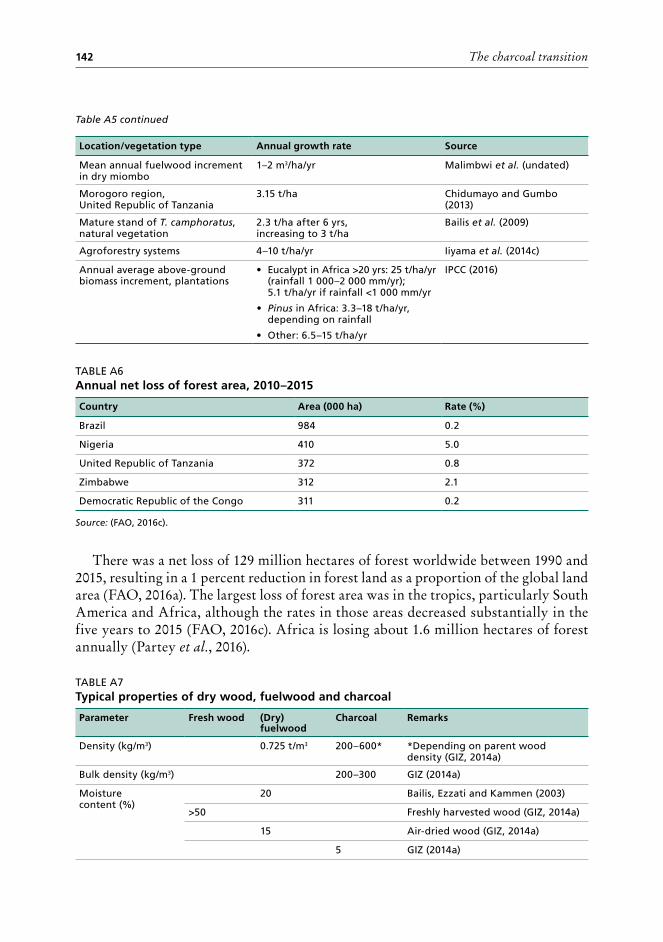
The charcoal transition142
Location/vegetation type Annual growth rate Source
Mean annual fuelwood increment in dry miombo
1–2 m3/ha/yr Malimbwi et al. (undated)
Morogoro region, United Republic of Tanzania
3.15 t/ha Chidumayo and Gumbo (2013)
Mature stand of T. camphoratus, natural vegetation
2.3 t/ha after 6 yrs, increasing to 3 t/ha
Bailis et al. (2009)
Agroforestry systems 4–10 t/ha/yr Iiyama et al. (2014c)
Annual average above-ground biomass increment, plantations
• Eucalypt in Africa >20 yrs: 25 t/ha/yr (rainfall 1 000–2 000 mm/yr); 5.1 t/ha/yr if rainfall <1 000 mm/yr
• Pinus in Africa: 3.3–18 t/ha/yr, depending on rainfall
• Other: 6.5–15 t/ha/yr
IPCC (2016)
TABLE A6Annual net loss of forest area, 2010–2015
Country Area (000 ha) Rate (%)
Brazil 984 0.2
Nigeria 410 5.0
United Republic of Tanzania 372 0.8
Zimbabwe 312 2.1
Democratic Republic of the Congo 311 0.2
Source: (FAO, 2016c).
There was a net loss of 129 million hectares of forest worldwide between 1990 and 2015, resulting in a 1 percent reduction in forest land as a proportion of the global land area (FAO, 2016a). The largest loss of forest area was in the tropics, particularly South America and Africa, although the rates in those areas decreased substantially in the five years to 2015 (FAO, 2016c). Africa is losing about 1.6 million hectares of forest annually (Partey et al., 2016).
TABLE A7Typical properties of dry wood, fuelwood and charcoal
Parameter Fresh wood (Dry) fuelwood
Charcoal Remarks
Density (kg/m3) 0.725 t/m3 200–600* *Depending on parent wood density (GIZ, 2014a)
Bulk density (kg/m3) 200–300 GIZ (2014a)
Moisture content (%)
20 Bailis, Ezzati and Kammen (2003)
>50 Freshly harvested wood (GIZ, 2014a)
15 Air-dried wood (GIZ, 2014a)
5 GIZ (2014a)
Table A5 continued
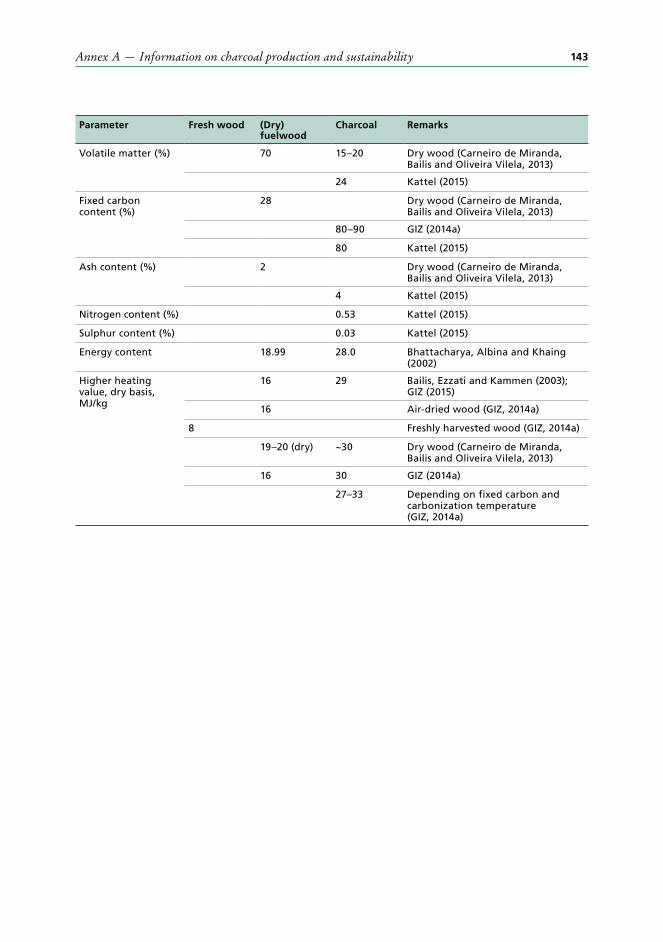
Annex A — Information on charcoal production and sustainability 143
Parameter Fresh wood (Dry) fuelwood
Charcoal Remarks
Volatile matter (%) 70 15–20 Dry wood (Carneiro de Miranda, Bailis and Oliveira Vilela, 2013)
24 Kattel (2015)
Fixed carbon content (%)
28 Dry wood (Carneiro de Miranda, Bailis and Oliveira Vilela, 2013)
80–90 GIZ (2014a)
80 Kattel (2015)
Ash content (%) 2 Dry wood (Carneiro de Miranda, Bailis and Oliveira Vilela, 2013)
4 Kattel (2015)
Nitrogen content (%) 0.53 Kattel (2015)
Sulphur content (%) 0.03 Kattel (2015)
Energy content 18.99 28.0 Bhattacharya, Albina and Khaing (2002)
Higher heating value, dry basis, MJ/kg
16 29 Bailis, Ezzati and Kammen (2003); GIZ (2015)
16 Air-dried wood (GIZ, 2014a)
8 Freshly harvested wood (GIZ, 2014a)
19–20 (dry) ~30 Dry wood (Carneiro de Miranda, Bailis and Oliveira Vilela, 2013)
16 30 GIZ (2014a)
27–33 Depending on fixed carbon and carbonization temperature (GIZ, 2014a)
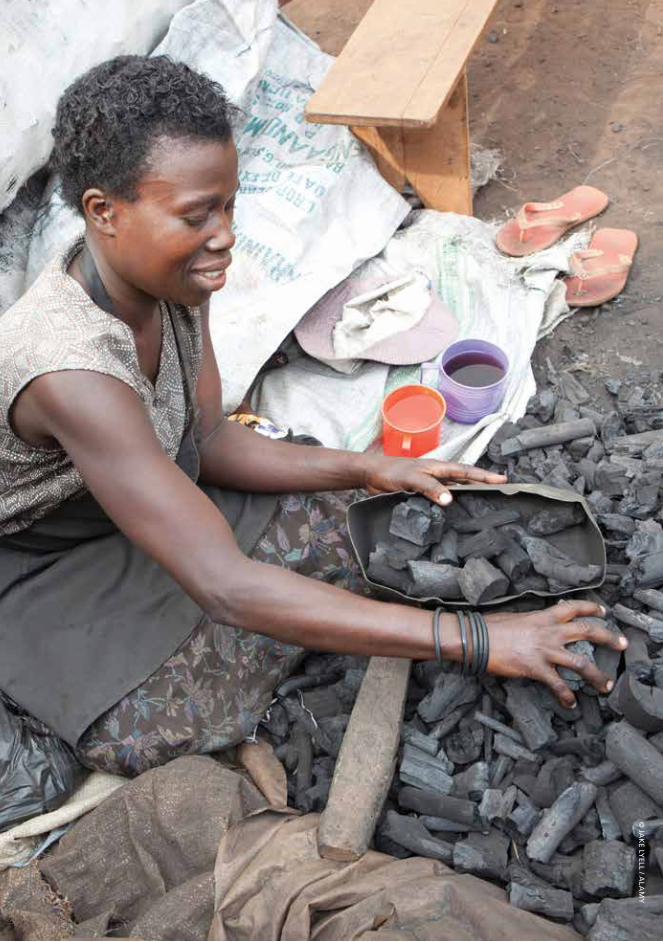
© JA
KE LY
ELL / ALA
MY
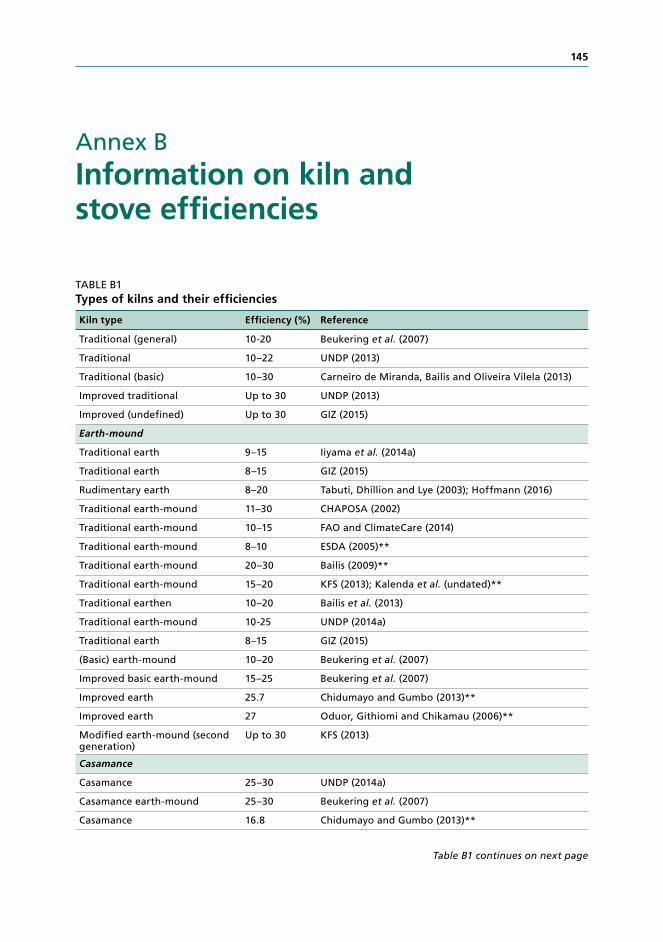
145
Annex B Information on kiln and stove efficiencies
TABLE B1Types of kilns and their efficiencies
Kiln type Efficiency (%) Reference
Traditional (general) 10-20 Beukering et al. (2007)
Traditional 10–22 UNDP (2013)
Traditional (basic) 10–30 Carneiro de Miranda, Bailis and Oliveira Vilela (2013)
Improved traditional Up to 30 UNDP (2013)
Improved (undefined) Up to 30 GIZ (2015)
Earth-mound
Traditional earth 9–15 Iiyama et al. (2014a)
Traditional earth 8–15 GIZ (2015)
Rudimentary earth 8–20 Tabuti, Dhillion and Lye (2003); Hoffmann (2016)
Traditional earth-mound 11–30 CHAPOSA (2002)
Traditional earth-mound 10–15 FAO and ClimateCare (2014)
Traditional earth-mound 8–10 ESDA (2005)**
Traditional earth-mound 20–30 Bailis (2009)**
Traditional earth-mound 15–20 KFS (2013); Kalenda et al. (undated)**
Traditional earthen 10–20 Bailis et al. (2013)
Traditional earth-mound 10-25 UNDP (2014a)
Traditional earth 8–15 GIZ (2015)
(Basic) earth-mound 10–20 Beukering et al. (2007)
Improved basic earth-mound 15–25 Beukering et al. (2007)
Improved earth 25.7 Chidumayo and Gumbo (2013)**
Improved earth 27 Oduor, Githiomi and Chikamau (2006)**
Modified earth-mound (second generation)
Up to 30 KFS (2013)
Casamance
Casamance 25–30 UNDP (2014a)
Casamance earth-mound 25–30 Beukering et al. (2007)
Casamance 16.8 Chidumayo and Gumbo (2013)**
Table B1 continues on next page
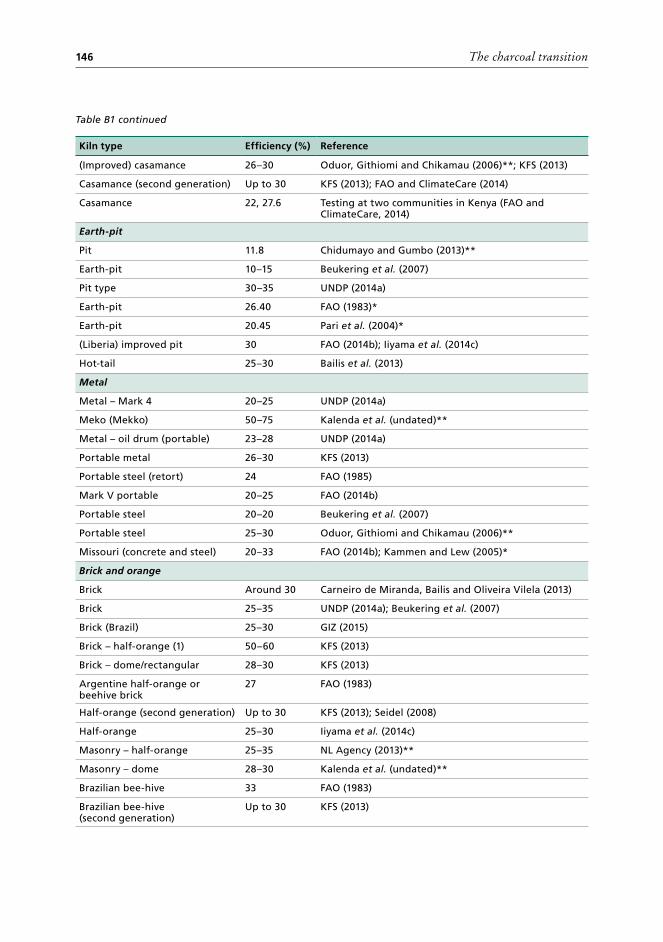
The charcoal transition146
Kiln type Efficiency (%) Reference
(Improved) casamance 26–30 Oduor, Githiomi and Chikamau (2006)**; KFS (2013)
Casamance (second generation) Up to 30 KFS (2013); FAO and ClimateCare (2014)
Casamance 22, 27.6 Testing at two communities in Kenya (FAO and ClimateCare, 2014)
Earth-pit
Pit 11.8 Chidumayo and Gumbo (2013)**
Earth-pit 10–15 Beukering et al. (2007)
Pit type 30–35 UNDP (2014a)
Earth-pit 26.40 FAO (1983)*
Earth-pit 20.45 Pari et al. (2004)*
(Liberia) improved pit 30 FAO (2014b); Iiyama et al. (2014c)
Hot-tail 25–30 Bailis et al. (2013)
Metal
Metal – Mark 4 20–25 UNDP (2014a)
Meko (Mekko) 50–75 Kalenda et al. (undated)**
Metal – oil drum (portable) 23–28 UNDP (2014a)
Portable metal 26–30 KFS (2013)
Portable steel (retort) 24 FAO (1985)
Mark V portable 20–25 FAO (2014b)
Portable steel 20–20 Beukering et al. (2007)
Portable steel 25–30 Oduor, Githiomi and Chikamau (2006)**
Missouri (concrete and steel) 20–33 FAO (2014b); Kammen and Lew (2005)*
Brick and orange
Brick Around 30 Carneiro de Miranda, Bailis and Oliveira Vilela (2013)
Brick 25–35 UNDP (2014a); Beukering et al. (2007)
Brick (Brazil) 25–30 GIZ (2015)
Brick – half-orange (1) 50–60 KFS (2013)
Brick – dome/rectangular 28–30 KFS (2013)
Argentine half-orange or beehive brick
27 FAO (1983)
Half-orange (second generation) Up to 30 KFS (2013); Seidel (2008)
Half-orange 25–30 Iiyama et al. (2014c)
Masonry – half-orange 25–35 NL Agency (2013)**
Masonry – dome 28–30 Kalenda et al. (undated)**
Brazilian bee-hive 33 FAO (1983)
Brazilian bee-hive (second generation)
Up to 30 KFS (2013)
Table B1 continued
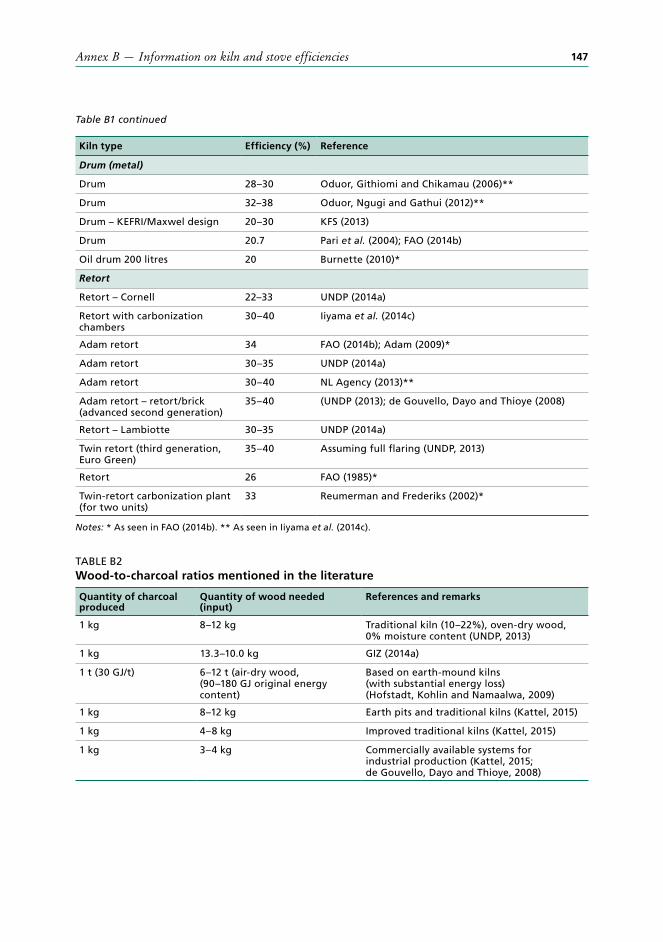
Annex B — Information on kiln and stove efficiencies 147
Kiln type Efficiency (%) Reference
Drum (metal)
Drum 28–30 Oduor, Githiomi and Chikamau (2006)**
Drum 32–38 Oduor, Ngugi and Gathui (2012)**
Drum – KEFRI/Maxwel design 20–30 KFS (2013)
Drum 20.7 Pari et al. (2004); FAO (2014b)
Oil drum 200 litres 20 Burnette (2010)*
Retort
Retort – Cornell 22–33 UNDP (2014a)
Retort with carbonization chambers
30–40 Iiyama et al. (2014c)
Adam retort 34 FAO (2014b); Adam (2009)*
Adam retort 30–35 UNDP (2014a)
Adam retort 30–40 NL Agency (2013)**
Adam retort – retort/brick (advanced second generation)
35–40 (UNDP (2013); de Gouvello, Dayo and Thioye (2008)
Retort – Lambiotte 30–35 UNDP (2014a)
Twin retort (third generation, Euro Green)
35–40 Assuming full flaring (UNDP, 2013)
Retort 26 FAO (1985)*
Twin-retort carbonization plant (for two units)
33 Reumerman and Frederiks (2002)*
Notes: * As seen in FAO (2014b). ** As seen in Iiyama et al. (2014c).
TABLE B2Wood-to-charcoal ratios mentioned in the literature
Quantity of charcoal produced
Quantity of wood needed (input)
References and remarks
1 kg 8–12 kg Traditional kiln (10–22%), oven-dry wood, 0% moisture content (UNDP, 2013)
1 kg 13.3–10.0 kg GIZ (2014a)
1 t (30 GJ/t) 6–12 t (air-dry wood, (90–180 GJ original energy content)
Based on earth-mound kilns (with substantial energy loss) (Hofstadt, Kohlin and Namaalwa, 2009)
1 kg 8–12 kg Earth pits and traditional kilns (Kattel, 2015)
1 kg 4–8 kg Improved traditional kilns (Kattel, 2015)
1 kg 3–4 kg Commercially available systems for industrial production (Kattel, 2015; de Gouvello, Dayo and Thioye, 2008)
Table B1 continued
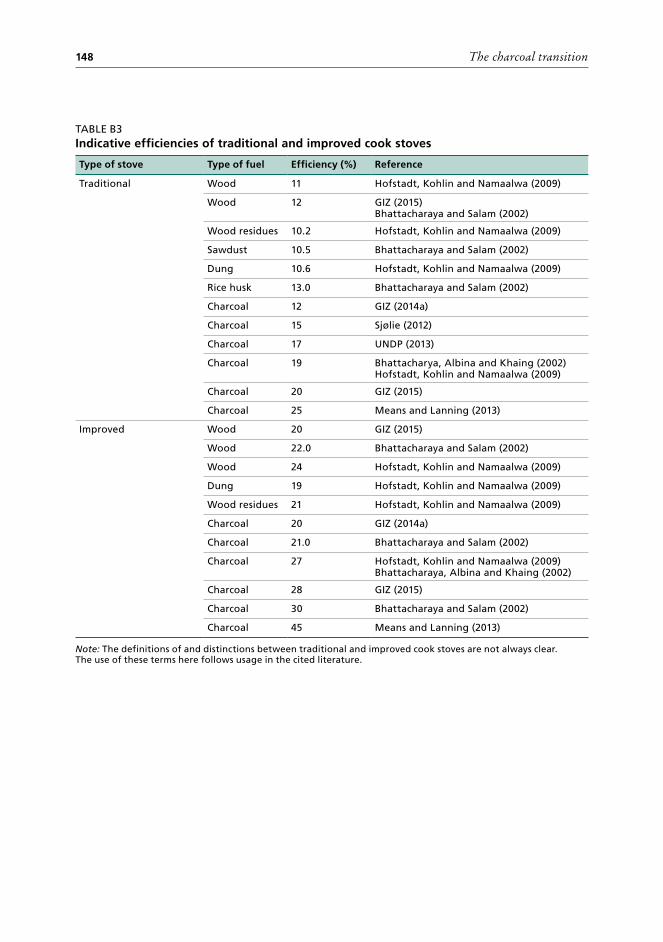
The charcoal transition148
TABLE B3Indicative efficiencies of traditional and improved cook stoves
Type of stove Type of fuel Efficiency (%) Reference
Traditional Wood 11 Hofstadt, Kohlin and Namaalwa (2009)
Wood 12 GIZ (2015) Bhattacharaya and Salam (2002)
Wood residues 10.2 Hofstadt, Kohlin and Namaalwa (2009)
Sawdust 10.5 Bhattacharaya and Salam (2002)
Dung 10.6 Hofstadt, Kohlin and Namaalwa (2009)
Rice husk 13.0 Bhattacharaya and Salam (2002)
Charcoal 12 GIZ (2014a)
Charcoal 15 Sjølie (2012)
Charcoal 17 UNDP (2013)
Charcoal 19 Bhattacharya, Albina and Khaing (2002) Hofstadt, Kohlin and Namaalwa (2009)
Charcoal 20 GIZ (2015)
Charcoal 25 Means and Lanning (2013)
Improved Wood 20 GIZ (2015)
Wood 22.0 Bhattacharaya and Salam (2002)
Wood 24 Hofstadt, Kohlin and Namaalwa (2009)
Dung 19 Hofstadt, Kohlin and Namaalwa (2009)
Wood residues 21 Hofstadt, Kohlin and Namaalwa (2009)
Charcoal 20 GIZ (2014a)
Charcoal 21.0 Bhattacharaya and Salam (2002)
Charcoal 27 Hofstadt, Kohlin and Namaalwa (2009) Bhattacharaya, Albina and Khaing (2002)
Charcoal 28 GIZ (2015)
Charcoal 30 Bhattacharaya and Salam (2002)
Charcoal 45 Means and Lanning (2013)
Note: The definitions of and distinctions between traditional and improved cook stoves are not always clear. The use of these terms here follows usage in the cited literature.
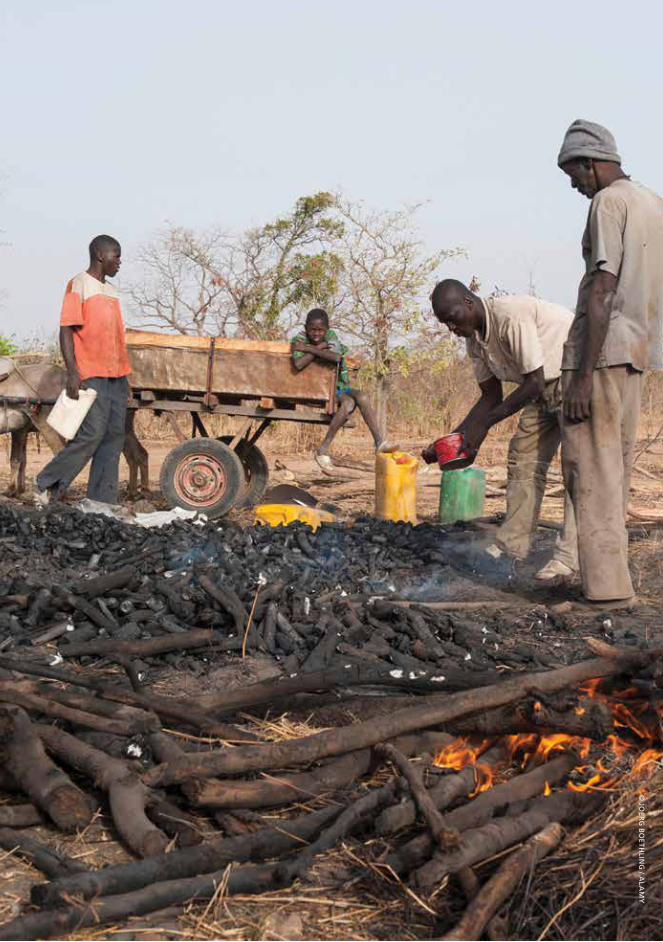
© JO
ERG
BO
ETH
LING
/ ALA
MY
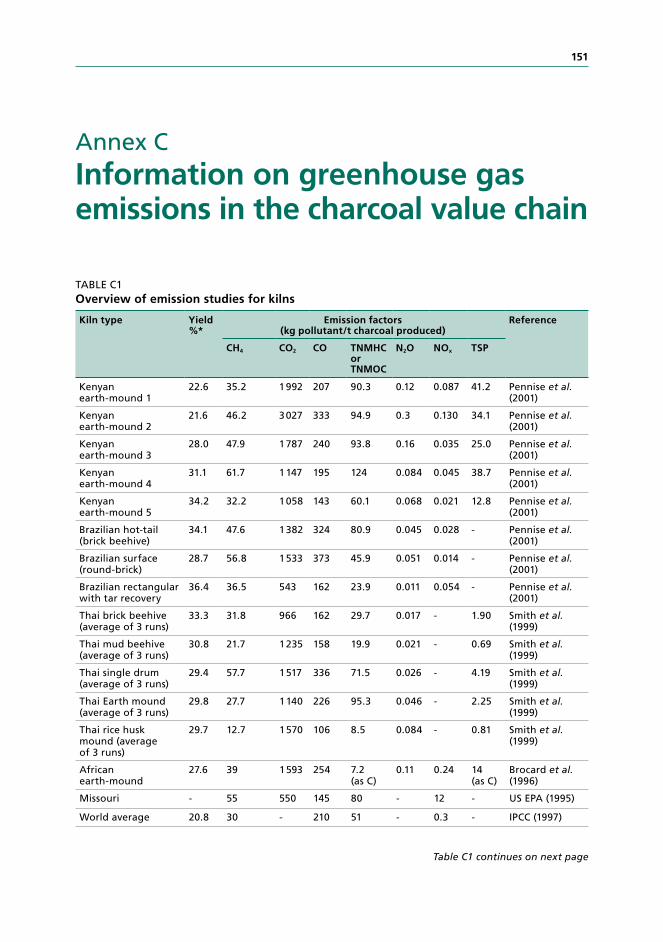
151
Annex C Information on greenhouse gas emissions in the charcoal value chain
TABLE C1Overview of emission studies for kilns
Kiln type Yield %*
Emission factors (kg pollutant/t charcoal produced)
Reference
CH4 CO2 CO TNMHC or TNMOC
N2O NOx TSP
Kenyan earth-mound 1
22.6 35.2 1 992 207 90.3 0.12 0.087 41.2 Pennise et al. (2001)
Kenyan earth-mound 2
21.6 46.2 3 027 333 94.9 0.3 0.130 34.1 Pennise et al. (2001)
Kenyan earth-mound 3
28.0 47.9 1 787 240 93.8 0.16 0.035 25.0 Pennise et al. (2001)
Kenyan earth-mound 4
31.1 61.7 1 147 195 124 0.084 0.045 38.7 Pennise et al. (2001)
Kenyan earth-mound 5
34.2 32.2 1 058 143 60.1 0.068 0.021 12.8 Pennise et al. (2001)
Brazilian hot-tail (brick beehive)
34.1 47.6 1 382 324 80.9 0.045 0.028 - Pennise et al. (2001)
Brazilian surface (round-brick)
28.7 56.8 1 533 373 45.9 0.051 0.014 - Pennise et al. (2001)
Brazilian rectangular with tar recovery
36.4 36.5 543 162 23.9 0.011 0.054 - Pennise et al. (2001)
Thai brick beehive (average of 3 runs)
33.3 31.8 966 162 29.7 0.017 - 1.90 Smith et al. (1999)
Thai mud beehive (average of 3 runs)
30.8 21.7 1 235 158 19.9 0.021 - 0.69 Smith et al. (1999)
Thai single drum (average of 3 runs)
29.4 57.7 1 517 336 71.5 0.026 - 4.19 Smith et al. (1999)
Thai Earth mound (average of 3 runs)
29.8 27.7 1 140 226 95.3 0.046 - 2.25 Smith et al. (1999)
Thai rice husk mound (average of 3 runs)
29.7 12.7 1 570 106 8.5 0.084 - 0.81 Smith et al. (1999)
African earth-mound
27.6 39 1 593 254 7.2 (as C)
0.11 0.24 14 (as C)
Brocard et al. (1996)
Missouri - 55 550 145 80 - 12 - US EPA (1995)
World average 20.8 30 - 210 51 - 0.3 - IPCC (1997)
Table C1 continues on next page
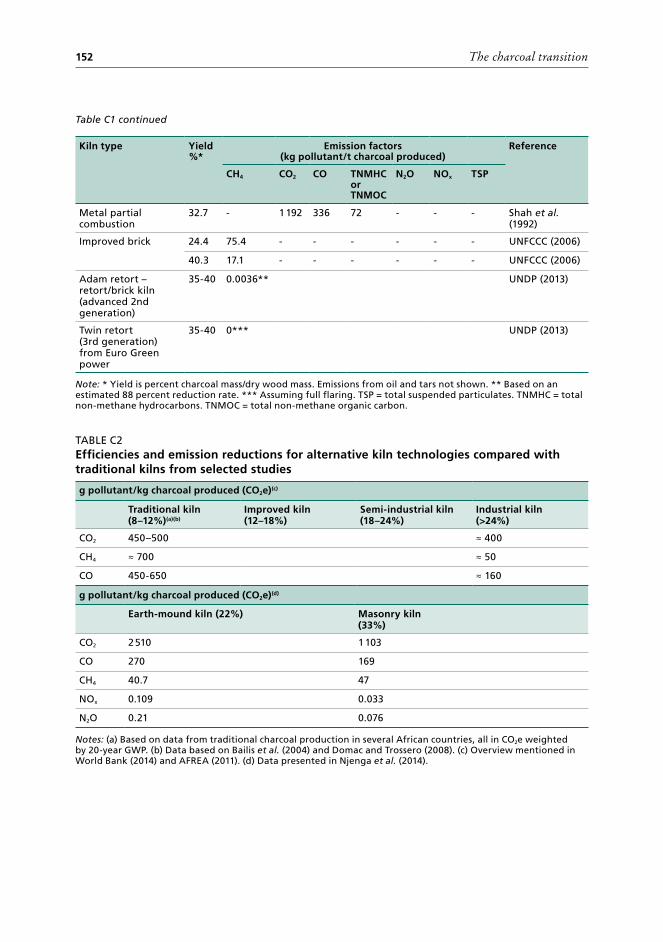
The charcoal transition152
Kiln type Yield %*
Emission factors (kg pollutant/t charcoal produced)
Reference
CH4 CO2 CO TNMHC or TNMOC
N2O NOx TSP
Metal partial combustion
32.7 - 1 192 336 72 - - - Shah et al. (1992)
Improved brick 24.4 75.4 - - - - - - UNFCCC (2006)
40.3 17.1 - - - - - - UNFCCC (2006)
Adam retort – retort/brick kiln (advanced 2nd generation)
35-40 0.0036** UNDP (2013)
Twin retort (3rd generation) from Euro Green power
35-40 0*** UNDP (2013)
Note: * Yield is percent charcoal mass/dry wood mass. Emissions from oil and tars not shown. ** Based on an estimated 88 percent reduction rate. *** Assuming full flaring. TSP = total suspended particulates. TNMHC = total non-methane hydrocarbons. TNMOC = total non-methane organic carbon.
TABLE C2Efficiencies and emission reductions for alternative kiln technologies compared with traditional kilns from selected studies
g pollutant/kg charcoal produced (CO2e)(c)
Traditional kiln (8–12%)(a)(b)
Improved kiln (12–18%)
Semi-industrial kiln (18–24%)
Industrial kiln (>24%)
CO2 450–500 ≈ 400
CH4 ≈ 700 ≈ 50
CO 450-650 ≈ 160
g pollutant/kg charcoal produced (CO2e)(d)
Earth-mound kiln (22%) Masonry kiln (33%)
CO2 2 510 1 103
CO 270 169
CH4 40.7 47
NOx 0.109 0.033
N2O 0.21 0.076
Notes: (a) Based on data from traditional charcoal production in several African countries, all in CO2e weighted by 20-year GWP. (b) Data based on Bailis et al. (2004) and Domac and Trossero (2008). (c) Overview mentioned in World Bank (2014) and AFREA (2011). (d) Data presented in Njenga et al. (2014).
Table C1 continued
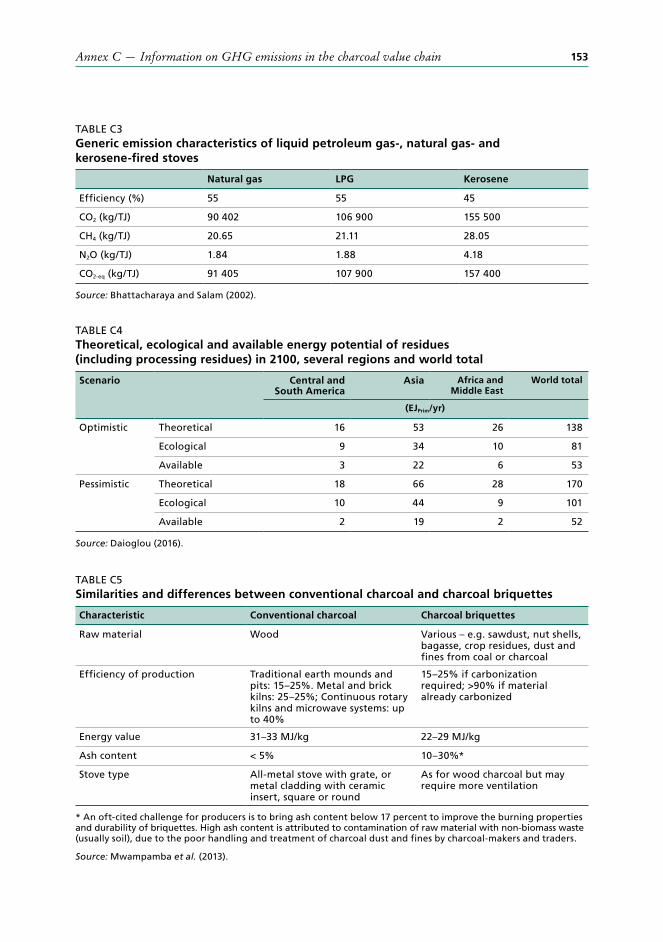
Annex C — Information on GHG emissions in the charcoal value chain 153
TABLE C3Generic emission characteristics of liquid petroleum gas-, natural gas- and kerosene-fired stoves
Natural gas LPG Kerosene
Efficiency (%) 55 55 45
CO2 (kg/TJ) 90 402 106 900 155 500
CH4 (kg/TJ) 20.65 21.11 28.05
N2O (kg/TJ) 1.84 1.88 4.18
CO2-eq (kg/TJ) 91 405 107 900 157 400
Source: Bhattacharaya and Salam (2002).
TABLE C4Theoretical, ecological and available energy potential of residues (including processing residues) in 2100, several regions and world total
Scenario Central and South America
Asia Africa and Middle East
World total
(EJPrim/yr)
Optimistic Theoretical 16 53 26 138
Ecological 9 34 10 81
Available 3 22 6 53
Pessimistic Theoretical 18 66 28 170
Ecological 10 44 9 101
Available 2 19 2 52
Source: Daioglou (2016).
TABLE C5Similarities and differences between conventional charcoal and charcoal briquettes
Characteristic Conventional charcoal Charcoal briquettes
Raw material Wood Various – e.g. sawdust, nut shells, bagasse, crop residues, dust and fines from coal or charcoal
Efficiency of production Traditional earth mounds and pits: 15–25%. Metal and brick kilns: 25–25%; Continuous rotary kilns and microwave systems: up to 40%
15–25% if carbonization required; >90% if material already carbonized
Energy value 31–33 MJ/kg 22–29 MJ/kg
Ash content < 5% 10–30%*
Stove type All-metal stove with grate, or metal cladding with ceramic insert, square or round
As for wood charcoal but may require more ventilation
* An oft-cited challenge for producers is to bring ash content below 17 percent to improve the burning properties and durability of briquettes. High ash content is attributed to contamination of raw material with non-biomass waste (usually soil), due to the poor handling and treatment of charcoal dust and fines by charcoal-makers and traders.
Source: Mwampamba et al. (2013).
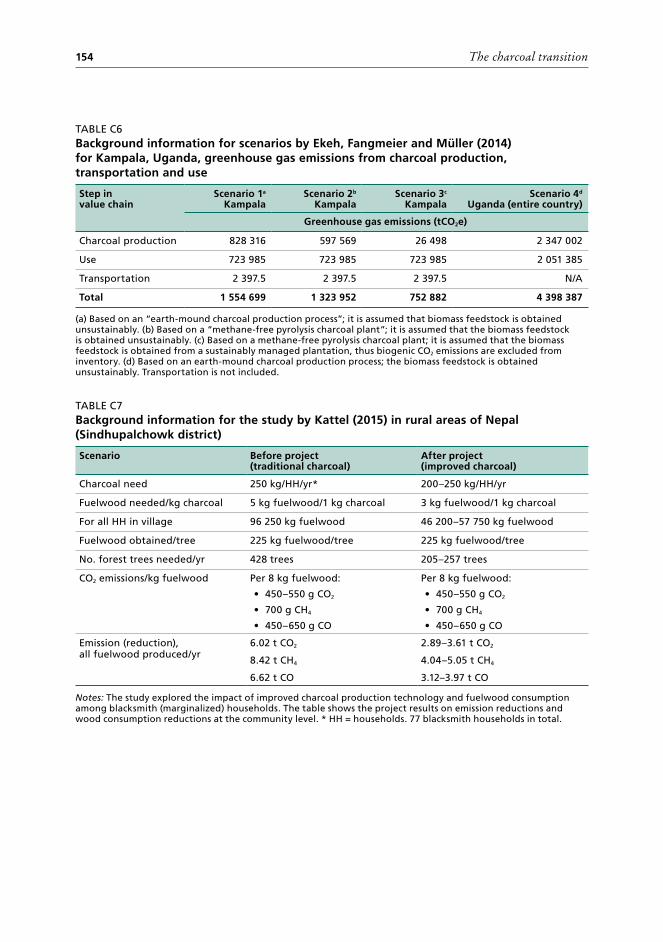
The charcoal transition154
TABLE C6Background information for scenarios by Ekeh, Fangmeier and Müller (2014) for Kampala, Uganda, greenhouse gas emissions from charcoal production, transportation and use
Step in value chain
Scenario 1a
KampalaScenario 2b
KampalaScenario 3c
KampalaScenario 4d
Uganda (entire country)
Greenhouse gas emissions (tCO2e)
Charcoal production 828 316 597 569 26 498 2 347 002
Use 723 985 723 985 723 985 2 051 385
Transportation 2 397.5 2 397.5 2 397.5 N/A
Total 1 554 699 1 323 952 752 882 4 398 387
(a) Based on an “earth-mound charcoal production process”; it is assumed that biomass feedstock is obtained unsustainably. (b) Based on a “methane-free pyrolysis charcoal plant”; it is assumed that the biomass feedstock is obtained unsustainably. (c) Based on a methane-free pyrolysis charcoal plant; it is assumed that the biomass feedstock is obtained from a sustainably managed plantation, thus biogenic CO2 emissions are excluded from inventory. (d) Based on an earth-mound charcoal production process; the biomass feedstock is obtained unsustainably. Transportation is not included.
TABLE C7Background information for the study by Kattel (2015) in rural areas of Nepal (Sindhupalchowk district)
Scenario Before project (traditional charcoal)
After project (improved charcoal)
Charcoal need 250 kg/HH/yr* 200–250 kg/HH/yr
Fuelwood needed/kg charcoal 5 kg fuelwood/1 kg charcoal 3 kg fuelwood/1 kg charcoal
For all HH in village 96 250 kg fuelwood 46 200–57 750 kg fuelwood
Fuelwood obtained/tree 225 kg fuelwood/tree 225 kg fuelwood/tree
No. forest trees needed/yr 428 trees 205–257 trees
CO2 emissions/kg fuelwood Per 8 kg fuelwood:
• 450–550 g CO2
• 700 g CH4
• 450–650 g CO
Per 8 kg fuelwood:
• 450–550 g CO2
• 700 g CH4
• 450–650 g CO
Emission (reduction), all fuelwood produced/yr
6.02 t CO2
8.42 t CH4
6.62 t CO
2.89–3.61 t CO2
4.04–5.05 t CH4
3.12–3.97 t CO
Notes: The study explored the impact of improved charcoal production technology and fuelwood consumption among blacksmith (marginalized) households. The table shows the project results on emission reductions and wood consumption reductions at the community level. * HH = households. 77 blacksmith households in total.
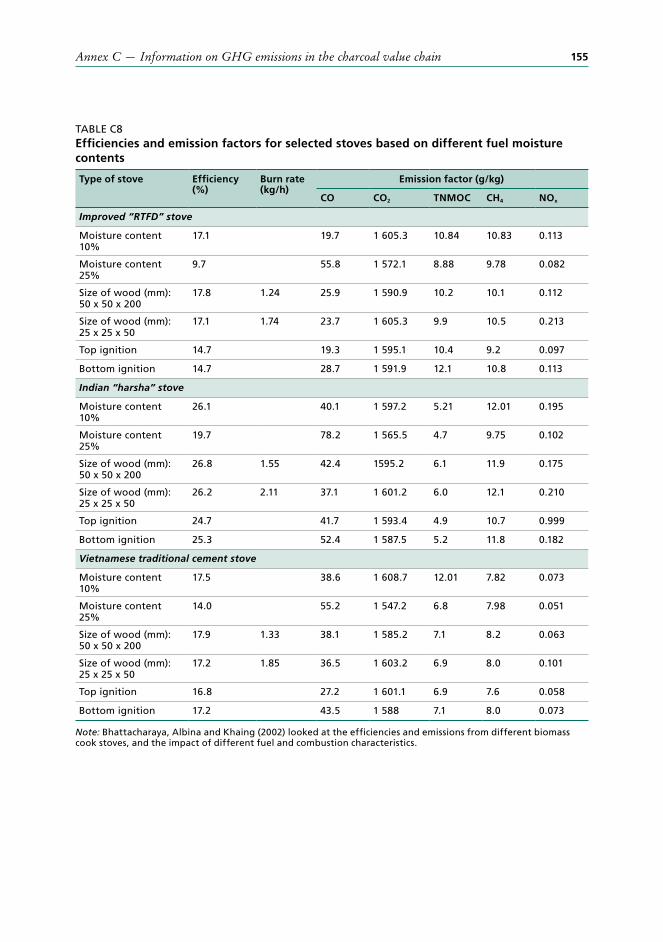
Annex C — Information on GHG emissions in the charcoal value chain 155
TABLE C8Efficiencies and emission factors for selected stoves based on different fuel moisture contents
Type of stove Efficiency (%)
Burn rate (kg/h)
Emission factor (g/kg)
CO CO2 TNMOC CH4 NOx
Improved “RTFD” stove
Moisture content 10%
17.1 19.7 1 605.3 10.84 10.83 0.113
Moisture content 25%
9.7 55.8 1 572.1 8.88 9.78 0.082
Size of wood (mm): 50 x 50 x 200
17.8 1.24 25.9 1 590.9 10.2 10.1 0.112
Size of wood (mm): 25 x 25 x 50
17.1 1.74 23.7 1 605.3 9.9 10.5 0.213
Top ignition 14.7 19.3 1 595.1 10.4 9.2 0.097
Bottom ignition 14.7 28.7 1 591.9 12.1 10.8 0.113
Indian “harsha” stove
Moisture content 10%
26.1 40.1 1 597.2 5.21 12.01 0.195
Moisture content 25%
19.7 78.2 1 565.5 4.7 9.75 0.102
Size of wood (mm): 50 x 50 x 200
26.8 1.55 42.4 1595.2 6.1 11.9 0.175
Size of wood (mm): 25 x 25 x 50
26.2 2.11 37.1 1 601.2 6.0 12.1 0.210
Top ignition 24.7 41.7 1 593.4 4.9 10.7 0.999
Bottom ignition 25.3 52.4 1 587.5 5.2 11.8 0.182
Vietnamese traditional cement stove
Moisture content 10%
17.5 38.6 1 608.7 12.01 7.82 0.073
Moisture content 25%
14.0 55.2 1 547.2 6.8 7.98 0.051
Size of wood (mm): 50 x 50 x 200
17.9 1.33 38.1 1 585.2 7.1 8.2 0.063
Size of wood (mm): 25 x 25 x 50
17.2 1.85 36.5 1 603.2 6.9 8.0 0.101
Top ignition 16.8 27.2 1 601.1 6.9 7.6 0.058
Bottom ignition 17.2 43.5 1 588 7.1 8.0 0.073
Note: Bhattacharaya, Albina and Khaing (2002) looked at the efficiencies and emissions from different biomass cook stoves, and the impact of different fuel and combustion characteristics.
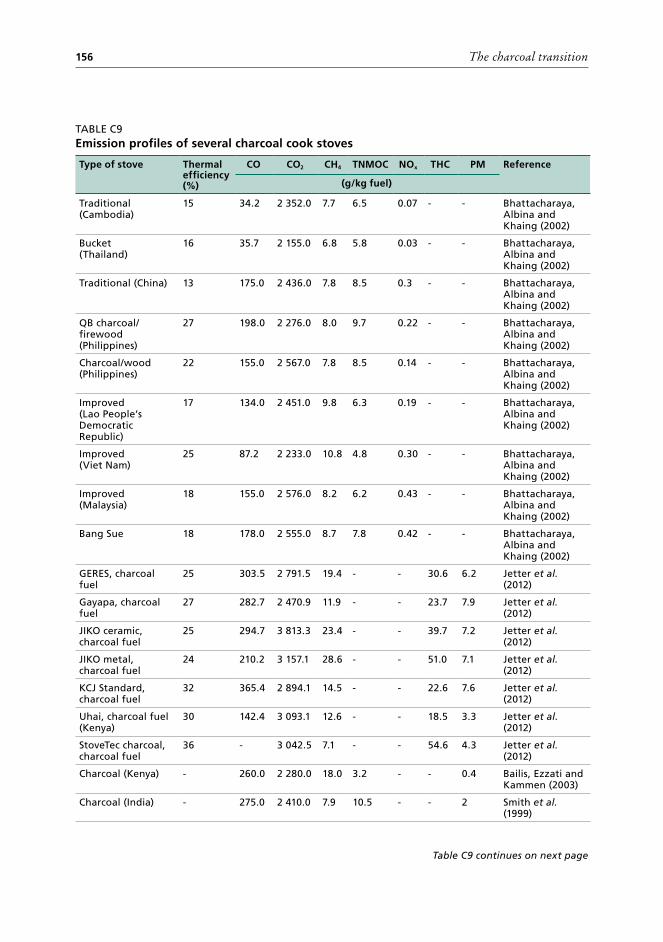
The charcoal transition156
TABLE C9Emission profiles of several charcoal cook stoves
Type of stove Thermal efficiency (%)
CO CO2 CH4 TNMOC NOx THC PM Reference
(g/kg fuel)
Traditional (Cambodia)
15 34.2 2 352.0 7.7 6.5 0.07 - - Bhattacharaya, Albina and Khaing (2002)
Bucket (Thailand)
16 35.7 2 155.0 6.8 5.8 0.03 - - Bhattacharaya, Albina and Khaing (2002)
Traditional (China) 13 175.0 2 436.0 7.8 8.5 0.3 - - Bhattacharaya, Albina and Khaing (2002)
QB charcoal/firewood (Philippines)
27 198.0 2 276.0 8.0 9.7 0.22 - - Bhattacharaya, Albina and Khaing (2002)
Charcoal/wood (Philippines)
22 155.0 2 567.0 7.8 8.5 0.14 - - Bhattacharaya, Albina and Khaing (2002)
Improved (Lao People’s Democratic Republic)
17 134.0 2 451.0 9.8 6.3 0.19 - - Bhattacharaya, Albina and Khaing (2002)
Improved (Viet Nam)
25 87.2 2 233.0 10.8 4.8 0.30 - - Bhattacharaya, Albina and Khaing (2002)
Improved (Malaysia)
18 155.0 2 576.0 8.2 6.2 0.43 - - Bhattacharaya, Albina and Khaing (2002)
Bang Sue 18 178.0 2 555.0 8.7 7.8 0.42 - - Bhattacharaya, Albina and Khaing (2002)
GERES, charcoal fuel
25 303.5 2 791.5 19.4 - - 30.6 6.2 Jetter et al. (2012)
Gayapa, charcoal fuel
27 282.7 2 470.9 11.9 - - 23.7 7.9 Jetter et al. (2012)
JIKO ceramic, charcoal fuel
25 294.7 3 813.3 23.4 - - 39.7 7.2 Jetter et al. (2012)
JIKO metal, charcoal fuel
24 210.2 3 157.1 28.6 - - 51.0 7.1 Jetter et al. (2012)
KCJ Standard, charcoal fuel
32 365.4 2 894.1 14.5 - - 22.6 7.6 Jetter et al. (2012)
Uhai, charcoal fuel (Kenya)
30 142.4 3 093.1 12.6 - - 18.5 3.3 Jetter et al. (2012)
StoveTec charcoal, charcoal fuel
36 - 3 042.5 7.1 - - 54.6 4.3 Jetter et al. (2012)
Charcoal (Kenya) - 260.0 2 280.0 18.0 3.2 - - 0.4 Bailis, Ezzati and Kammen (2003)
Charcoal (India) - 275.0 2 410.0 7.9 10.5 - - 2 Smith et al. (1999)
Table C9 continues on next page
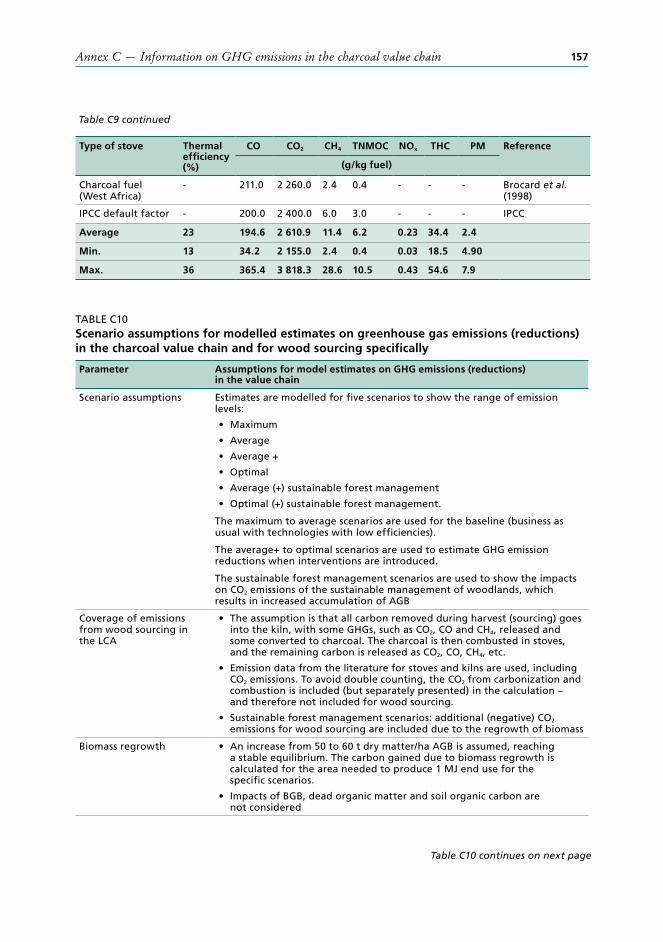
Annex C — Information on GHG emissions in the charcoal value chain 157
Type of stove Thermal efficiency (%)
CO CO2 CH4 TNMOC NOx THC PM Reference
(g/kg fuel)
Charcoal fuel (West Africa)
- 211.0 2 260.0 2.4 0.4 - - - Brocard et al. (1998)
IPCC default factor - 200.0 2 400.0 6.0 3.0 - - - IPCC
Average 23 194.6 2 610.9 11.4 6.2 0.23 34.4 2.4
Min. 13 34.2 2 155.0 2.4 0.4 0.03 18.5 4.90
Max. 36 365.4 3 818.3 28.6 10.5 0.43 54.6 7.9
TABLE C10Scenario assumptions for modelled estimates on greenhouse gas emissions (reductions) in the charcoal value chain and for wood sourcing specifically
Parameter Assumptions for model estimates on GHG emissions (reductions) in the value chain
Scenario assumptions Estimates are modelled for five scenarios to show the range of emission levels:
• Maximum
• Average
• Average +
• Optimal
• Average (+) sustainable forest management
• Optimal (+) sustainable forest management.
The maximum to average scenarios are used for the baseline (business as usual with technologies with low efficiencies).
The average+ to optimal scenarios are used to estimate GHG emission reductions when interventions are introduced.
The sustainable forest management scenarios are used to show the impacts on CO2 emissions of the sustainable management of woodlands, which results in increased accumulation of AGB
Coverage of emissions from wood sourcing in the LCA
• The assumption is that all carbon removed during harvest (sourcing) goes into the kiln, with some GHGs, such as CO2, CO and CH4, released and some converted to charcoal. The charcoal is then combusted in stoves, and the remaining carbon is released as CO2, CO, CH4, etc.
• Emission data from the literature for stoves and kilns are used, including CO2 emissions. To avoid double counting, the CO2 from carbonization and combustion is included (but separately presented) in the calculation – and therefore not included for wood sourcing.
• Sustainable forest management scenarios: additional (negative) CO2 emissions for wood sourcing are included due to the regrowth of biomass
Biomass regrowth • An increase from 50 to 60 t dry matter/ha AGB is assumed, reaching a stable equilibrium. The carbon gained due to biomass regrowth is calculated for the area needed to produce 1 MJ end use for the specific scenarios.
• Impacts of BGB, dead organic matter and soil organic carbon are not considered
Table C9 continued
Table C10 continues on next page
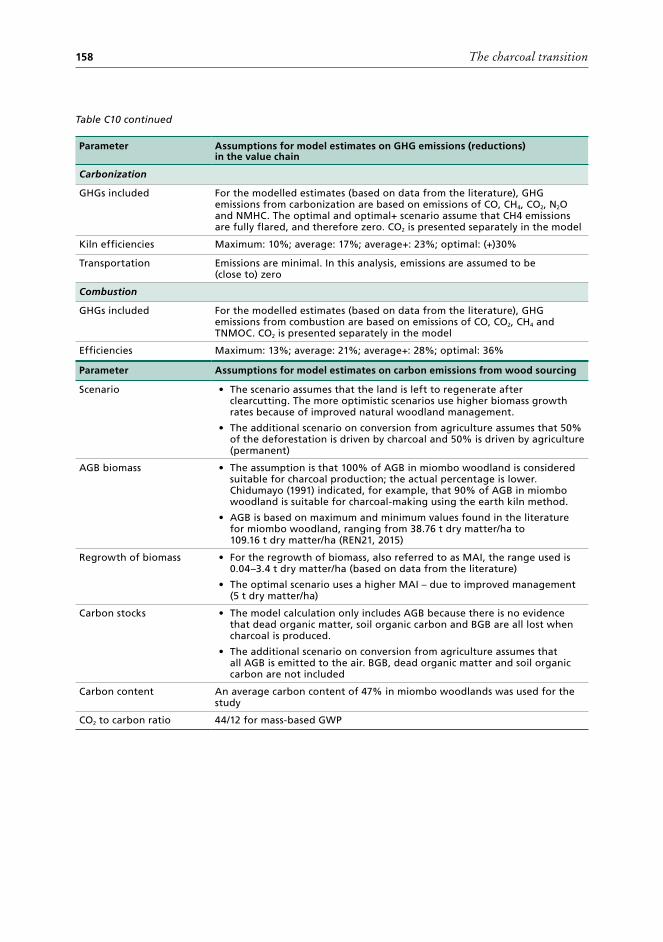
The charcoal transition158
Parameter Assumptions for model estimates on GHG emissions (reductions) in the value chain
Carbonization
GHGs included For the modelled estimates (based on data from the literature), GHG emissions from carbonization are based on emissions of CO, CH4, CO2, N2O and NMHC. The optimal and optimal+ scenario assume that CH4 emissions are fully flared, and therefore zero. CO2 is presented separately in the model
Kiln efficiencies Maximum: 10%; average: 17%; average+: 23%; optimal: (+)30%
Transportation Emissions are minimal. In this analysis, emissions are assumed to be (close to) zero
Combustion
GHGs included For the modelled estimates (based on data from the literature), GHG emissions from combustion are based on emissions of CO, CO2, CH4 and TNMOC. CO2 is presented separately in the model
Efficiencies Maximum: 13%; average: 21%; average+: 28%; optimal: 36%
Parameter Assumptions for model estimates on carbon emissions from wood sourcing
Scenario • The scenario assumes that the land is left to regenerate after clearcutting. The more optimistic scenarios use higher biomass growth rates because of improved natural woodland management.
• The additional scenario on conversion from agriculture assumes that 50% of the deforestation is driven by charcoal and 50% is driven by agriculture (permanent)
AGB biomass • The assumption is that 100% of AGB in miombo woodland is considered suitable for charcoal production; the actual percentage is lower. Chidumayo (1991) indicated, for example, that 90% of AGB in miombo woodland is suitable for charcoal-making using the earth kiln method.
• AGB is based on maximum and minimum values found in the literature for miombo woodland, ranging from 38.76 t dry matter/ha to 109.16 t dry matter/ha (REN21, 2015)
Regrowth of biomass • For the regrowth of biomass, also referred to as MAI, the range used is 0.04–3.4 t dry matter/ha (based on data from the literature)
• The optimal scenario uses a higher MAI – due to improved management (5 t dry matter/ha)
Carbon stocks • The model calculation only includes AGB because there is no evidence that dead organic matter, soil organic carbon and BGB are all lost when charcoal is produced.
• The additional scenario on conversion from agriculture assumes that all AGB is emitted to the air. BGB, dead organic matter and soil organic carbon are not included
Carbon content An average carbon content of 47% in miombo woodlands was used for the study
CO2 to carbon ratio 44/12 for mass-based GWP
Table C10 continued
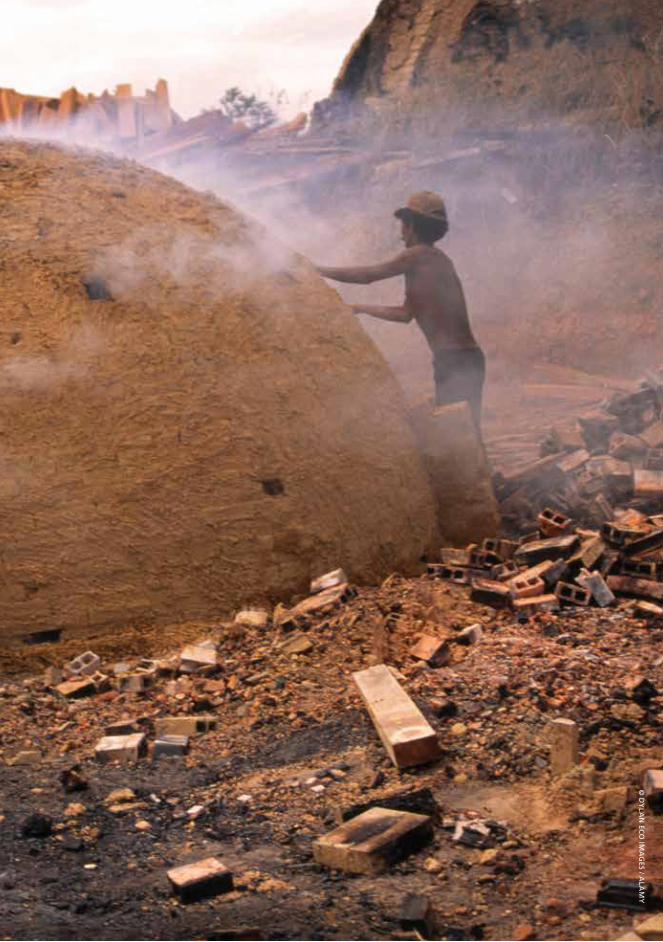
© D
YLA
N EC
O IM
AG
ES / ALA
MY
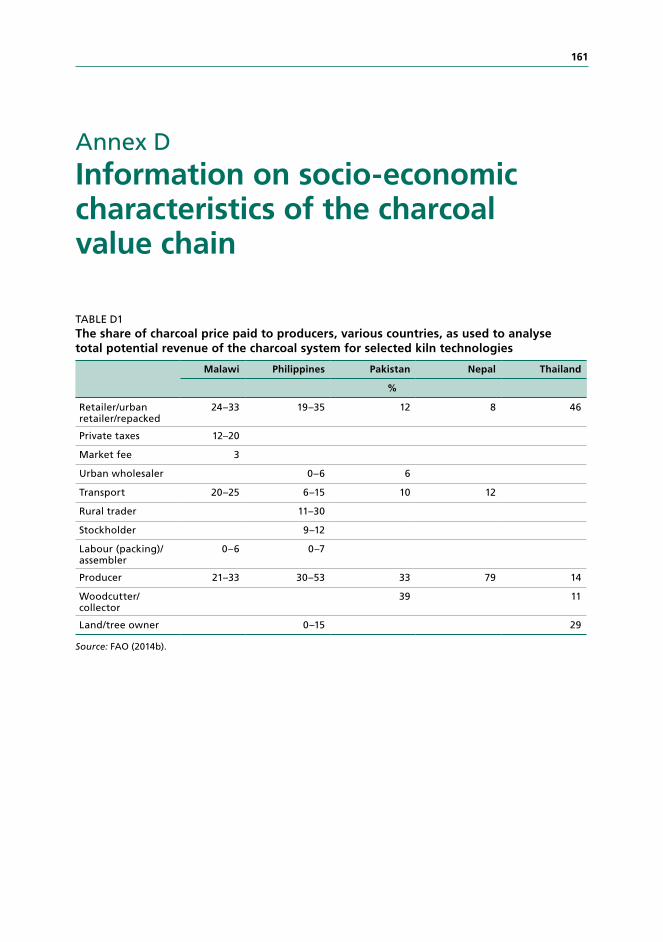
161
Annex DInformation on socio-economic characteristics of the charcoal value chain
TABLE D1The share of charcoal price paid to producers, various countries, as used to analyse total potential revenue of the charcoal system for selected kiln technologies
Malawi Philippines Pakistan Nepal Thailand
%
Retailer/urban retailer/repacked
24–33 19–35 12 8 46
Private taxes 12–20
Market fee 3
Urban wholesaler 0–6 6
Transport 20–25 6–15 10 12
Rural trader 11–30
Stockholder 9–12
Labour (packing)/assembler
0–6 0–7
Producer 21–33 30–53 33 79 14
Woodcutter/collector
39 11
Land/tree owner 0–15 29
Source: FAO (2014b).
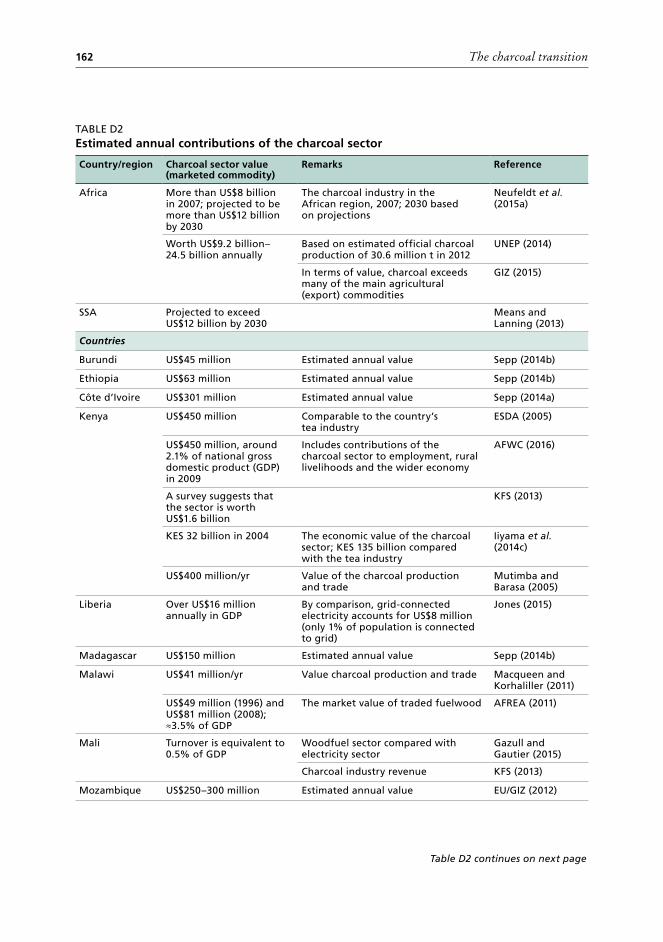
The charcoal transition162
TABLE D2Estimated annual contributions of the charcoal sector
Country/region Charcoal sector value (marketed commodity)
Remarks Reference
Africa More than US$8 billion in 2007; projected to be more than US$12 billion by 2030
The charcoal industry in the African region, 2007; 2030 based on projections
Neufeldt et al. (2015a)
Worth US$9.2 billion– 24.5 billion annually
Based on estimated official charcoal production of 30.6 million t in 2012
UNEP (2014)
In terms of value, charcoal exceeds many of the main agricultural (export) commodities
GIZ (2015)
SSA Projected to exceed US$12 billion by 2030
Means and Lanning (2013)
Countries
Burundi US$45 million Estimated annual value Sepp (2014b)
Ethiopia US$63 million Estimated annual value Sepp (2014b)
Côte d’Ivoire US$301 million Estimated annual value Sepp (2014a)
Kenya US$450 million Comparable to the country’s tea industry
ESDA (2005)
US$450 million, around 2.1% of national gross domestic product (GDP) in 2009
Includes contributions of the charcoal sector to employment, rural livelihoods and the wider economy
AFWC (2016)
A survey suggests that the sector is worth US$1.6 billion
KFS (2013)
KES 32 billion in 2004 The economic value of the charcoal sector; KES 135 billion compared with the tea industry
Iiyama et al. (2014c)
US$400 million/yr Value of the charcoal production and trade
Mutimba and Barasa (2005)
Liberia Over US$16 million annually in GDP
By comparison, grid-connected electricity accounts for US$8 million (only 1% of population is connected to grid)
Jones (2015)
Madagascar US$150 million Estimated annual value Sepp (2014b)
Malawi US$41 million/yr Value charcoal production and trade Macqueen and Korhaliller (2011)
US$49 million (1996) and US$81 million (2008); ≈3.5% of GDP
The market value of traded fuelwood AFREA (2011)
Mali Turnover is equivalent to 0.5% of GDP
Woodfuel sector compared with electricity sector
Gazull and Gautier (2015)
Charcoal industry revenue KFS (2013)
Mozambique US$250–300 million Estimated annual value EU/GIZ (2012)
Table D2 continues on next page
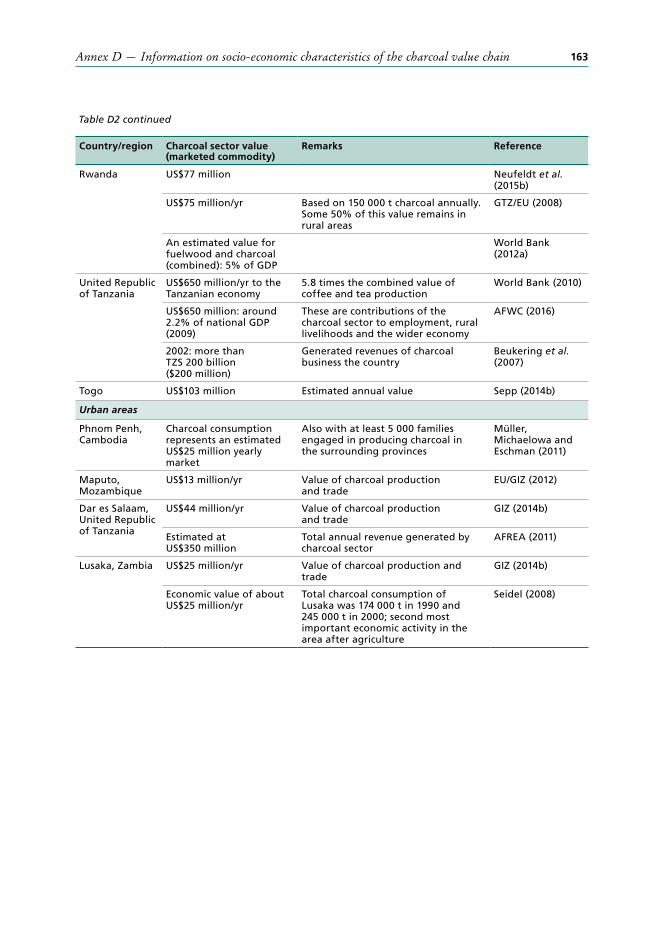
Annex D — Information on socio-economic characteristics of the charcoal value chain 163
Country/region Charcoal sector value (marketed commodity)
Remarks Reference
Rwanda US$77 million Neufeldt et al. (2015b)
US$75 million/yr Based on 150 000 t charcoal annually. Some 50% of this value remains in rural areas
GTZ/EU (2008)
An estimated value for fuelwood and charcoal (combined): 5% of GDP
World Bank (2012a)
United Republic of Tanzania
US$650 million/yr to the Tanzanian economy
5.8 times the combined value of coffee and tea production
World Bank (2010)
US$650 million: around 2.2% of national GDP (2009)
These are contributions of the charcoal sector to employment, rural livelihoods and the wider economy
AFWC (2016)
2002: more than TZS 200 billion ($200 million)
Generated revenues of charcoal business the country
Beukering et al. (2007)
Togo US$103 million Estimated annual value Sepp (2014b)
Urban areas
Phnom Penh, Cambodia
Charcoal consumption represents an estimated US$25 million yearly market
Also with at least 5 000 families engaged in producing charcoal in the surrounding provinces
Müller, Michaelowa and Eschman (2011)
Maputo, Mozambique
US$13 million/yr Value of charcoal production and trade
EU/GIZ (2012)
Dar es Salaam, United Republic of Tanzania
US$44 million/yr Value of charcoal production and trade
GIZ (2014b)
Estimated at US$350 million
Total annual revenue generated by charcoal sector
AFREA (2011)
Lusaka, Zambia US$25 million/yr Value of charcoal production and trade
GIZ (2014b)
Economic value of about US$25 million/yr
Total charcoal consumption of Lusaka was 174 000 t in 1990 and 245 000 t in 2000; second most important economic activity in the area after agriculture
Seidel (2008)
Table D2 continued
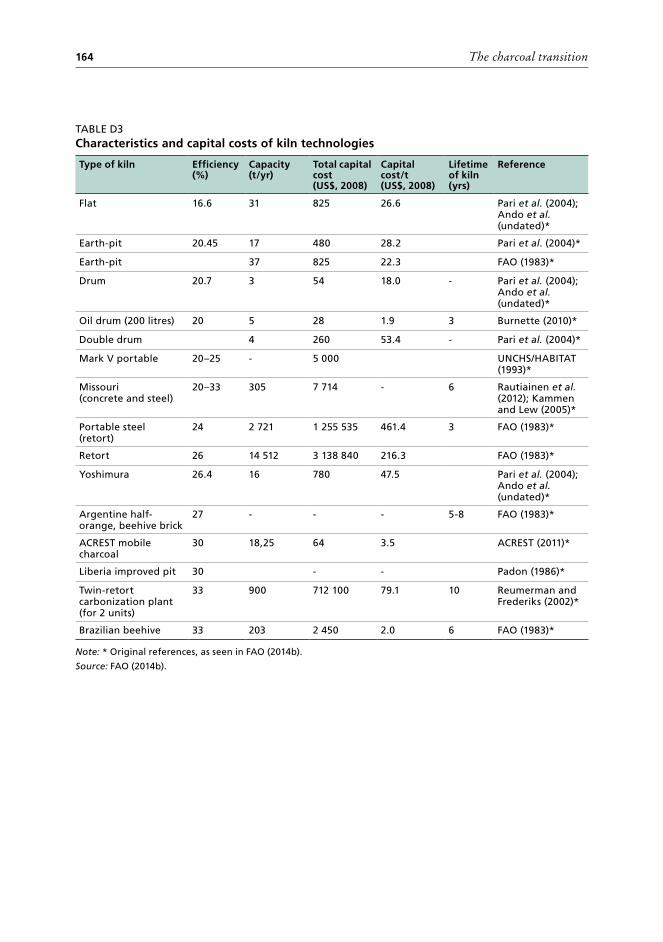
The charcoal transition164
TABLE D3Characteristics and capital costs of kiln technologies
Type of kiln Efficiency (%)
Capacity (t/yr)
Total capital cost (US$, 2008)
Capital cost/t (US$, 2008)
Lifetime of kiln (yrs)
Reference
Flat 16.6 31 825 26.6 Pari et al. (2004); Ando et al. (undated)*
Earth-pit 20.45 17 480 28.2 Pari et al. (2004)*
Earth-pit 37 825 22.3 FAO (1983)*
Drum 20.7 3 54 18.0 - Pari et al. (2004); Ando et al. (undated)*
Oil drum (200 litres) 20 5 28 1.9 3 Burnette (2010)*
Double drum 4 260 53.4 - Pari et al. (2004)*
Mark V portable 20–25 - 5 000 UNCHS/HABITAT (1993)*
Missouri (concrete and steel)
20–33 305 7 714 - 6 Rautiainen et al. (2012); Kammen and Lew (2005)*
Portable steel (retort)
24 2 721 1 255 535 461.4 3 FAO (1983)*
Retort 26 14 512 3 138 840 216.3 FAO (1983)*
Yoshimura 26.4 16 780 47.5 Pari et al. (2004); Ando et al. (undated)*
Argentine half-orange, beehive brick
27 - - - 5-8 FAO (1983)*
ACREST mobile charcoal
30 18,25 64 3.5 ACREST (2011)*
Liberia improved pit 30 - - Padon (1986)*
Twin-retort carbonization plant (for 2 units)
33 900 712 100 79.1 10 Reumerman and Frederiks (2002)*
Brazilian beehive 33 203 2 450 2.0 6 FAO (1983)*
Note: * Original references, as seen in FAO (2014b).
Source: FAO (2014b).
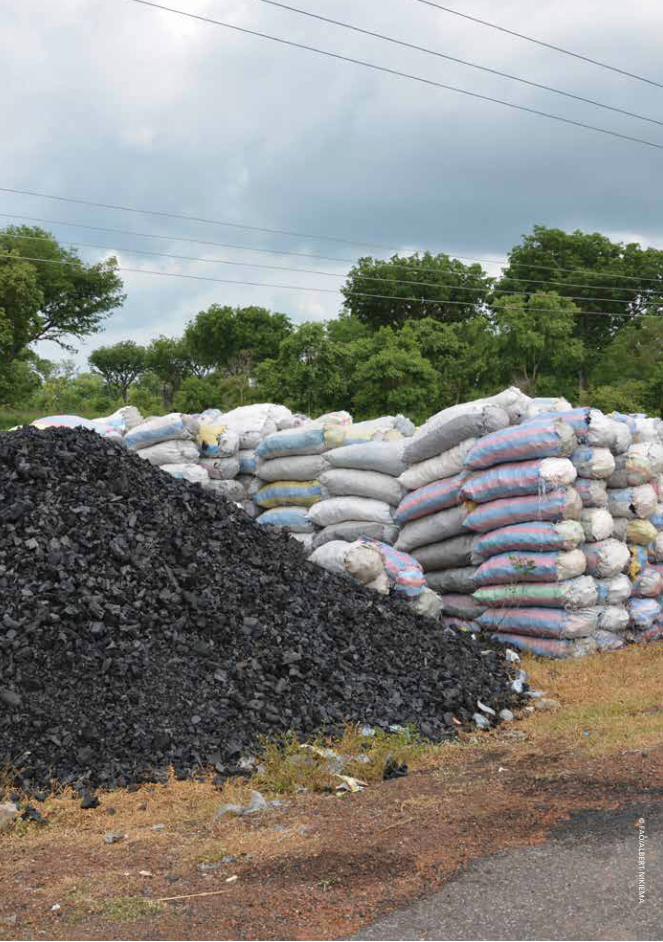
© FA
O/A
LBER
T NIK
IEMA
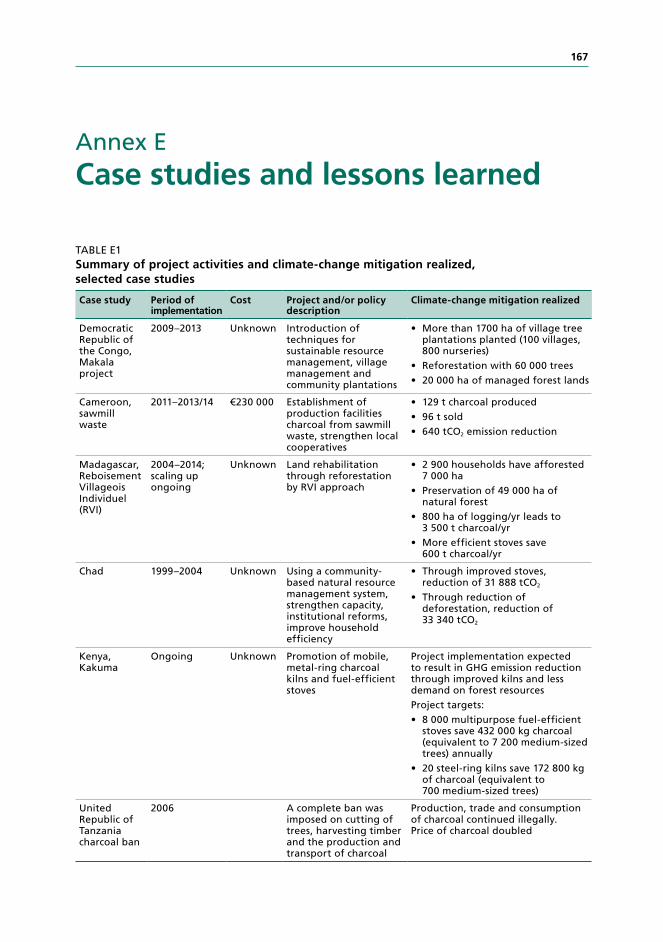
167
Annex E Case studies and lessons learned
TABLE E1Summary of project activities and climate-change mitigation realized, selected case studies
Case study Period of implementation
Cost Project and/or policy description
Climate-change mitigation realized
Democratic Republic of the Congo, Makala project
2009–2013 Unknown Introduction of techniques for sustainable resource management, village management and community plantations
• More than 1700 ha of village tree plantations planted (100 villages, 800 nurseries)
• Reforestation with 60 000 trees• 20 000 ha of managed forest lands
Cameroon, sawmill waste
2011–2013/14 €230 000 Establishment of production facilities charcoal from sawmill waste, strengthen local cooperatives
• 129 t charcoal produced• 96 t sold• 640 tCO2 emission reduction
Madagascar, Reboisement Villageois Individuel (RVI)
2004–2014; scaling up ongoing
Unknown Land rehabilitation through reforestation by RVI approach
• 2 900 households have afforested 7 000 ha
• Preservation of 49 000 ha of natural forest
• 800 ha of logging/yr leads to 3 500 t charcoal/yr
• More efficient stoves save 600 t charcoal/yr
Chad 1999–2004 Unknown Using a community-based natural resource management system, strengthen capacity, institutional reforms, improve household efficiency
• Through improved stoves, reduction of 31 888 tCO2
• Through reduction of deforestation, reduction of 33 340 tCO2
Kenya, Kakuma
Ongoing Unknown Promotion of mobile, metal-ring charcoal kilns and fuel-efficient stoves
Project implementation expected to result in GHG emission reduction through improved kilns and less demand on forest resourcesProject targets: • 8 000 multipurpose fuel-efficient
stoves save 432 000 kg charcoal (equivalent to 7 200 medium-sized trees) annually
• 20 steel-ring kilns save 172 800 kg of charcoal (equivalent to 700 medium-sized trees)
United Republic of Tanzania charcoal ban
2006 A complete ban was imposed on cutting of trees, harvesting timber and the production and transport of charcoal
Production, trade and consumption of charcoal continued illegally. Price of charcoal doubled
The charcoal transition168
CASE STUDY 1: MAKALA PROJECT, DEMOCRATIC REPUBLIC OF THE CONGOThe Makala project68 (2009–2013) was implemented to enhance understanding and management of urban woodfuel supply in central Africa to guarantee woodfuel supply to urban citizens while limiting environmental pressure from supply. With a range of pilot activities in the Democratic Republic of the Congo, it contributed to knowledge on the woodfuel value chain for policy-makers, the private sector, aid organizations and rural communities.
Wood energy is the primary household energy in central Africa, and charcoal consumption is increasing in urban centres, thanks to a growing population and a lack of alternative energy sources. In the Democratic Republic of the Congo – one of the poorest countries in the world – around 85 percent of households use wood as their primary cooking fuel. Kinshasa consumes around 5 million tonnes of woodfuel per year supplied from about 60 000 hectares of peri-urban woodlands. With a rapidly increasing urban population and the ongoing popularity of charcoal, demand for woodfuel continues to rise. In Kinshasa, two-thirds of woodfuel is sourced from newly cleared woodlands for agriculture and one-third from forests. The few woodfuel plantations that exist include:
• the agroforestry Mampu Project on the Batéké plateau, with the production of charcoal from 7 700 hectares of acacia trees planted between 1987 and 1992;
• the Clean Development Mechanism’s project on afforestation and charcoal production, “village Ibi”;
• the Ntsio Project, with a plantation of 5 500 hectares of acacia trees on the Batéké plateau;
• The Gungu Project near Kikwit in the Province of Kwilu; and• the EcoMakala Project in North Kivu. The woodfuel sector provides a significant number of informal jobs, with over
300 000 people involved in producing woodfuel for Kinshasa alone. The increased woodfuel demand puts pressure on forests and has negative environmental and social impacts. Especially in peri-urban areas, pressure from woodfuel harvesting, often combined with slash-and-burn agriculture, causes land degradation, and woodfuel needs to be sourced from ever-increasing distances.
Interventions introducedProject activities included an analysis of the legislative framework and woodfuel value chains. The project also mapped the available resources and practices of resource extraction. Subsequently mitigation measures, in terms of the sustainable management of natural forestlands through village management and community plantations, were introduced. Also, the project looked into the efficiency of carbonization and options for improving charcoal-making skills. Lessons from the various activities were translated for capacity building among villagers and the training of officials and students.
68 The project was funded by the European Union and operated by the Agricultural Research or Development in partnership with Center for International Forestry Research, the Hanns Seidel Foundation, Gembloux Agro Bio Tech and the Faculty of Science at the University of Kisangani.
Annex E — Case studies and lessons learned 169
The project introduced techniques for the sustainable management of the resource base that can help to mitigate climate change. These included provenance trials for the identification and selection of acacia species best adapted for reforestation in the Batéké plateau.
More than 1 700 hectares of village tree plantations were planted during the project, involving thousands of villagers in 100 villages and 800 nurseries.
Assisted natural regeneration techniques for land after slash-and-burn agriculture were developed in more 150 plots, principally on the Batéké plateau. In Bas Congo, reforestation was initiated using local tree species, and about 60 000 trees were used to reforest and restore deforested lands.
Simple management plans were established for 18 communities covering a total area of around 20 000 hectares of managed forest lands.
Climate-change mitigation realizedAll afforestation and reforestation pilot activities, and avoided forest degradation, potentially contribute to enhancing carbon stocks and climate-change mitigation.
The contributions to climate-change mitigation have not been calculated, but would be at a limited scale given the modest pilot phase. The impact of such initiatives, even for fast-growing tree species, cannot be measured in the short timeline of projects. Much will depend on follow-up activities, the multiplier effect of the project, and institutional changes.
The Makala project informed the development of the country’s national REDD+ plan, which identifies woodfuel as a major driver of deforestation and forest degradation and introduces a range of possible measures. Pillar 2 on energy aims to reduce unsustainably produced woodfuel while, at the same time, responding to the national demand for energy.
Key lessons learnedWood energy will continue to dominate household energy supply for the foreseeable future in the Democratic Republic of the Congo, putting pressure on tree resources. Policies are needed not only to encourage more sustainable supply options, but also to address the informal trade chains and the affordability of household energy supplies. Uncertain land rights, shifting cultivation, environmental externalities, and conflicting customary and official laws are all obstacles to sustainable forest management.
Interventions to date tend to target official forest concessions and plantations, while most woodfuel is sourced from village woodlands, often combined with land-clearing for agriculture. Present initiatives, of which the largest is the acacia planation on the Batéké plateau, produce only a fraction of total charcoal needs in urban centres (an estimated 50 000–80 000 m3 of wood per year, or 1 percent of Kinshasa’s demand). Future interventions need to consider the dependence of many people on woodfuel production and the importance of sales as a cash-generating activity. Woodfuel production is still mostly in the informal sphere, and collaboration among different sectors in needed to professionalize and formalize it, without harming the livelihoods of those involved. New management options that combine agroforestry, plantations and improving energy efficiency among both producers and consumers can provide
The charcoal transition170
opportunities for sustainable future energy supplies. The establishment of plantations, the restoration of natural and degraded forests, and the introduction of trees in agricultural lands and peri-urban zones can all contribute to sustainable sourcing. Management interventions are needed at the local level, combined with integrated land management at the level of the supply zone. Institutional and legal frameworks are needed to support the development and ownership of rural plantations and tree-planting in the context of decentralization and energy production. There is a need for institutions and legislation to protect local rights to trees and to provide options for differentiated taxation on wood from plantations and managed production versus wood without management plans.
Sources: CIRAD (2016); Schure et al. (2010); Dubiez et al. (2012); Marien et al. (2013).
CASE STUDY 2: INCOME GENERATION AND EMISSION REDUCTIONS THROUGH SUSTAINABLE CHARCOAL PRODUCTION FROM SAWMILL WASTE IN CAMEROON Although dense humid forests exist in the south of Cameroon, northern Cameroon is in the Sahel and lacks forest resources. Logging companies are active in the south, but they lack facilities to make use of sawmill waste, for example to produce charcoal for households in the north. Two hundred thousand tonnes of charcoal are produced per year from a total volume of 2.5 million tonnes of available waste timber (GIZ, 2011).
In a public–private partnership between SFID SA (a French tropical wood-trading company) and Deutsche Gesellschaft für Internationale Zusammenarbeit (GIZ), the project described here assisted local cooperatives to convert waste from sawmills in southern Cameroon into charcoal. The charcoal was sold locally and elsewhere in Cameroon, and 20 000 people living in the vicinity of the concessions benefited. The project supported local development projects via Fonds de Développement Local, to which part of the revenues from the sale of charcoal was returned.
The project ran from 2011 to 2014. The project cost €231 283, with contributions from GIZ and SFID (ProPSFE, 2014).
Interventions introducedThe main objective of the project was to develop activities for the sustainable use of forestry residues to generate income in the rural area of Mbang (East Cameroon) through the production and marketing of charcoal, thereby also contributing to the reduction of GHG emissions.
SFID is one of the main operators in the Cameroonian timber industry, managing nearly 550 000 hectares of forests with management plans. It has two industrial units (Djoum and Mbang), which produce sawnwood as well as processed products. SFID holds an FSC certificate on 100 percent of its southeast forest concessions (265 000 hectares).
The project supported the establishment of production facilities among a network of producers piloted by SFID and strengthened local cooperatives in their capacity to
Annex E — Case studies and lessons learned 171
market the charcoal. New technologies for converting waste timber were promoted, such as modern carbonization in clay and metal kilns. SFID supplied the raw material as well as maintenance services for the kilns. The project partners trained the technical staff involved in kiln construction and operation and the manufacture of clay bricks.
A producer network was established to run large-scale, state-of-the art, sustainable production processes and turn a greater proportion of waste from (semi)processed timber into charcoal.
Revenues from charcoal were re-invested in Fonds de Développement Local and used to finance micro-development projects for local groups. A ministerial order reduced the taxes payable on charcoal manufactured from waste timber.
Climate-change mitigation realizedOver the course of the project, 3 225 bags – about 129 tonnes – of charcoal were produced at the Mbang site, and 96 tonnes of charcoal were sold.
Expertise from the Walloon Agronomic Research Center was mobilized to assess the environmental impact of carbonization. The main points arising from this scientific study can be summarized as follows:
• The modern carbonization of sawmill residues for the production of charcoal avoids the emission of a considerable amount of CO2 into the atmosphere by replacing much of the artisanal coal produced directly in the forest from trees used for this purpose.
• From an environmental point of view, whatever the type, carbonization is preferable to open-air combustion. Carbonization also emits greenhouse gases (CO2, CH4, etc.), but in considerably less quantity than combustion in the open air.
• Even if the residues were not burnt, their biological degradation would inevitably lead to the production of greenhouse gases proportional to their carbon content.
• Low-carbon charcoal makes it possible to avoid the emission of 4.95 tCO2 per tonne of charcoal produced. Horn-type furnaces that do not emit methane make it possible to avoid the emission of more than 6.50 tCO2e.
A reduction of 4.95 tCO2 in emissions per tonne of charcoal produced implies a total reduction of almost 640 tCO2 emissions for the entire project (i.e. for 129 tonnes of charcoal produced).
Key lessons learnedThe project covered six aspects and lessons have been learned in all of them. The most relevant were:
• Improved carbonization techniques – it is important to use kilns suitable for the climate and location.
• Charcoal production – charcoal producers could be organized in producer groups instead of recruited as employees of a sawmill company, for which this is a secondary activity.
• Charcoal marketing – a cost–benefit analysis should include all actors in the chain so that profitability can be assured for each actor.
The charcoal transition172
• Actions to combat illegal charcoal are crucial for ensuring the profitability of the sector for legal actors.
• Bulk transport is advised to reduce charcoal transport costs. • Green charcoal production quotas set by the responsible ministry can help limit
illegal charcoal markets.• If a local development fund is used, the amount set aside must not negatively
affect the sales of charcoal.• Institutional support – the involvement of institutional partners is important for
capitalizing project achievements at the national level.
Sources: GIZ (2011); ProPSFE (2014).
CASE STUDY 3: RVI MADAGASCAREight-five percent of all Madagascan households depend on woodfuel. The rate of deforestation is high, at 0.6 percent per year. National policies almost entirely omit charcoal, which leads to unsustainable and inefficient production.
Interventions introducedThe Reboisement Villageois Individuel (RVI) approach prioritizes individual smallhold-ers as forest stewards with secure tenure rights. At its core, surplus or freely disposable wasteland unsuitable for other purposes is reforested with the goal of producing woodfuel in a sustainable and highly efficient manner. The approach involves four core activities (Ackermann et al., 2014):
1. Achieving community consensus on setting aside wasteland for reforestation, subject to participatory land-use planning.
2. Promoting the formation of smallholder groups willing to undertake reforestation efforts.
3. Supporting the allocation of plots to individual households.4. Facilitating the formal registration of tenure rights in recognition of and conditional
on predetermined performance benchmarks (a minimum 80 percent survival rate one year after planting).
The project ‘s objective was to contribute to the sustainable woodfuel supply of Antsiranana, the capital of the Diana region in northern Madagascar. RVI places local people at the centre of planning and implementation of woodfuel plantation management. The approach is based on the voluntary participation of communities eager to rehabilitate degraded lands by means of voluntary individual reforestation. A village-based participatory approval process allocates individual woodlots to interested households, along with defined use rights and obligations. Each plot is demarcated, mapped and documented with the community’s approval. Specially trained non-governmental organizations provide technical assistance through a three-stage approach, with a total implementation period of 21 months.
Large-area planting of fast-growing trees is coupled with the training of personnel in nursery management and forest management according to fixed quality standards.
Annex E — Case studies and lessons learned 173
The areas eligible for afforestation and the transfer of individual property rights are degraded and lack agricultural potential; this is to prevent competition and use conflicts in the long term.
Climate-change mitigation realizedOverall, 2 900 households afforested 7 000 hectares of wasteland around 68 villages, mainly using eucalypts. Because the approach mandates mechanical tillage, degraded areas with compacted topsoil can be revitalized through rehabilitation. Newly created plantations ease pressure on natural forests, especially around protected areas under threat of conversion for charcoal production (biodiversity conservation as a co-benefit). Additionally, bushfires in the afforestation zones have declined because the owners of the forest plots have a strong interest in protecting their properties. Coupled with efficient technologies, this has resulted in the preservation of about 49 000 hectares of natural forests, with corresponding carbon sequestration.
Of the total afforested area of 7 000 hectares, 800 hectares can be logged each year. This, combined with efficient use technologies, enables the production of 3 500 tonnes of charcoal, meaning that, particularly in the regional capital of Antsiranana, about 33 000 people (30 percent of the town’s population) can be sustainably supplied with domestic energy.
Four thousand households in the project area now use more efficient stoves, comprising roughly 20 000 people. They save some 600 tonnes of charcoal per year, worth a total of €60 000, or €15 per household (corresponding to a 25 percent drop in expenditure). Retailers and end consumers receive information and advice, partly in the context of public–private partnerships (ECO Consult Sepp and Busacker Partnerschaft 2013).
Key lessons learnedSuccess factors in the project (Ackermann et al., 2014) include the following:
• Good governance – innovations include forward-looking policies (e.g. “Vision 2020”).
• Subsidiarity – technical services are relieved of what they cannot afford to do. Trained non-governmental organizations bridge the gap between executive authority and target group.
• Decentralization – management functions are assigned to those directly concerned.• Legalization – the approach assists in setting tenure/use arrangements (communal
decree).• Tenure security – allocating individual legal titles to people is the driving force of
the approach, rather than counting on community property and management alone.• Efficient technologies along the value chain – the output per equivalent amount
of raw material is quadrupled.• Simplicity – the approach requires no complex community institutions or
management regulations compared with community-based forest management.• Formalization – the legalization of representative user groups provides income
to communities and the forest administration through legal taxes and dues.
The charcoal transition174
• Economic returns are quick and tangible.• Empowerment, devolution – user rights and duties are transferred to user groups
according to jointly set-up quality standards.• Capacity building – increased local capacity ensures upscaling, efficient steering
and sustainable implementation.Adjustments in the national energy policy are necessary to make RVI effective in the
long run. What is true for Madagascar is also likely to be relevant in other comparable countries. Policy lessons from the project include that energy policies should:
• transform mostly informal wood-energy sectors into regulated, legally formalized regional economies;
• devote administrative attention and financing to formal local biomass energy markets;
• establish national energy wood reserves and sustainable wood production for household energy purposes – best combined with participatory approaches such as RVI; and
• integrate woodfuel as an important pillar in the energy mix (image change).The project is being scaled up in Madagascar by KfW to a further 15 000 hectares.
Sources: Ackerman et al. (2014); ECO Consult Sepp and Busacker Partnerschaft (2013).
CASE STUDY 4: SUSTAINABLE WOOD-ENERGY DEVELOPMENT IN CHADChad has a long history of political and economic uncertainty. Since 1993, the govern-ment has taken significant actions for economic recovery.
The development objective of the project described here and implemented from 1999 to 2004 was to provide an economic, sustainable supply of energy for households. The specific objectives of the project, as per the Development Credit Agreement, were to:
• promote the establishment of the sustainable production of woodfuels using a community-based natural resource management system (Village Exploitant Rationnellement son Terroir – VERT) in selected villages providing energy to the capital, N’Djamena;
• strengthen the capacity of the borrower to extend such production elsewhere; • carry out institutional reforms in the household energy sector; and • improve efficiency in the use of household energy.On the supply side (80 percent of project costs), simple, long-term, village-based land-use
and wood exploitation plans were prepared for the N’Djamena woodfuel catchment area; the plans were based on an assessment of wood resources and economic activities in the vicinity of the villages, focusing on a rational, participatory approach to the management of wood resources. Efficient charcoal conversion techniques were promoted in charcoal production areas. A system was established to monitor the inflow of wood products from rural production zones into N’Djamena and an effective environmental policy was implemented to guide transporters to areas where least-cost wood was available.
On the demand side (20 percent of project costs), private agents commercialized efficient cook stoves; suitable stove models were identified through non-governmental
Annex E — Case studies and lessons learned 175
organizations; and a promotional campaign was launched to encourage the private sector to adopt the programme. The project promoted the commercialization of low-cost kerosene and LPG stoves by private agents and sought ways to increase the efficiency of their supply system.
Climate-change mitigation realizedThe following environmental benefits were obtained:
• Consumption and supply of woodfuels. The improved stoves component could reduce CO2 emissions by about 31 888 tonnes over the five-year project period, which is below the expected level of savings (112 000 tonnes) due to the lower than expected number of improved stoves in use. Because some 8–11 percent of the total supply of charcoal became sustainable, deforestation was reduced, implying lower overall CO2 emissions. The associated estimated reduction was about 33 340 tCO2 over the project period.
• Conservation effects at the village level. Wood resources were conserved, soil conditions may have improved, and biodiversity in general may have been maintained or improved. These effects were not monitored in Chad but were observed elsewhere in the Sahel. Thus, the environmental sustainability of VERT resources is highly likely. However, until N’Djamena’s entire woodfuel supply basin is fully covered by VERTs there is a risk of a partial displacement of production and consequently an increase in resource depletion in not-yet regulated areas.
Key lessons learnedThe component to “create capacity to monitor and control wood products flows” was highly successful. A differential taxation system was implemented and a payment verification system created:
• A low tax is levied on woodfuel produced sustainably in a VERT (XAF 300 per stere of wood – 1 m3, or roughly 300 kg) or per bag of charcoal; transporters pay this tax to the VERT at newly implemented rural wood markets; 90 percent is transferred to the bank account of the local management entity and 10 percent flows back to the government).
• A high tax is levied in all other areas (XAF 600 per stere of wood or per bag of charcoal; transporters pay the tax at a forestry inspection office in the production zones or along the road, or at one of five control posts created by the Agence pour l’Energie Domestique et l’Environnement – AEDE – around N’Djaména); and
• 100 percent of the tax flows back to the government and is shared with AEDE to pay for its operations.
Compliance rates with respect to tax payments by transporters in the established VERT were close to 100 percent because villages could keep most of the revenues. To increase payment compliance in both managed and non-managed zones, AEDE created a ring of professional control posts along the main entrances into N’Djaména and staffed these posts with forestry police seconded to AEDE. Mobile brigades plied between fixed control points using cars and motorcycles. After six months, infractions
The charcoal transition176
were reduced to less than 5 percent, down from 25 percent. Most transporters accepted the fiscal changes and simply paid their tax at a designated place. Overall tax collection efficiency increased from 23 percent in the first year to an estimated 84 percent in 2003. Tax collected nationally before the project amounted to around XAF 30 million per year; the average monthly collected tax revenue over the period January 2003 to June 2004 was XAF 51.7 million. Over the three-year period that taxes were collected, a total of about US$2.7 million was obtained.
The principal lessons learned apply to three different levels: • At the central level, having the regulatory environment in place from the beginning
was crucial for the success of the project. The fact that AEDE was autonomous and sufficiently independent also helped enormously to insulate the project, both from the turmoil affecting the rest of the energy sector and from political pressure resulting from the induced redistribution of the rent extracted from natural resources. Such autonomy had to be supported continuously by the World Bank. In other Sahelian countries, these elements are generally not satisfied, which probably explains why the results in Chad were more profound than most other places.
• At the local level, giving villagers a legal opportunity to become owners of their natural resources and to earn money from this had a far-reaching impact: from “subjects” they became “individuals” and, moreover, “organized individuals”, with the result that environmental degradation could be halted in VERT.
• The capacity to combine AEDE’s formal autonomy with the active on-the-ground participation of both villagers and local forestry inspection offices ensured a high level of ownership by stakeholders.
The model developed in the project demonstrably delivered results, but its full impact can only be achieved if it is scaled up. Therefore, the activities need to continue and expand.
Sources: World Bank (1998); World Bank (2004).
CASE STUDY 5: REFUGEE CAMP IN KENYAThe town of Kakuma in arid and semi-arid lands in Turkana County, Kenya, has hosted the Kakuma refugee camp since 1992. The camp is a melting pot of over 180 000 refugees from more than 20 countries, including large populations from South Sudan, Somalia, Ethiopia and the Democratic Republic of the Congo. The area faces regularly severe weather and climate events, which have negative impacts on people, their livelihoods and the provision of goods and services. Droughts, floods, landslides and fires all occur in Kenya, with drought the most pressing issue in the arid and semi-arid lands. Drought pushes people into other areas in search of natural resources, such as woodfuel, which increases tension between social groups competing for these resources.
Annex E — Case studies and lessons learned 177
Interventions introducedThe ECHO-funded FAO project “Strengthening linkages between refugee and host communities in Kakuma to improve incomes, food security and ultimately nutrition” is designed to increase the incomes of host community residents in Turkana County, Kenya. The project also aims to reduce social tensions between residents and refugees in the Kakuma camp and to relieve pressure on the environment.
The project addresses four key challenges with social, environmental and economic dimensions through the promotion of mobile metal-ring charcoal kilns and fuel-efficient stoves.
The metal-ring kilns are made of steel and consist of three interlocking cylindrical sectors and a conical cover. The kiln operates on a reverse draft principle in which carbonization starts at the top and progresses downward, aided by chimneys at the base of the kiln. The kilns have a capacity to yield approximately four sacks of charcoal per kiln per cycle; they have four compartments that lock together and can be unlocked and transported from one place to another with ease.
The kilns have been pilot-tested with local charcoal producers using an invasive shrub, Prosopis juliflora, obtaining an average efficiency of 22 percent, with higher efficiencies expected as skills improve and the moisture content of the feedstock is reduced. The production process using these kilns is also much faster than traditional earth-mound kilns, taking less than 24 hours compared with four days. The project will work with ten charcoal producer groups, representing about 40 households, in the host communities. A total of 8 000 households among both refugees and host communities will benefit from locally produced fuel-efficient cook stoves over the course of the project.
As of the beginning of 2017, the project had distributed 2 469 multipurpose, fuel-efficient stoves and four steel-ring charcoal kilns.
Climate-change mitigation realizedCharcoal production and use is a major source of GHG emissions in many African countries. Nearly all charcoal in SSA is produced using traditional kilns, which often have suboptimal conversion efficiencies and lack measures to curb emissions (Bailis, Ezzati and Kammen, 2005). Kenya is likely one of the biggest consumers of charcoal worldwide, in both absolute and per-capita terms (Bailis, 2009). Almost all charcoal in Kenya is produced using native woody vegetation: it is estimated that more than 200 species are used, predominantly indigenous trees (Bailis, 2009). A study has found that switching from traditional charcoal production methods to the use of an improved kiln, without any change in the post-harvest management of tree and forest systems used for charcoal production, would reduce GHG emissions by 3.4 tonnes per hectare. The deployment of 8 000 multipurpose, fuel-efficient stoves would save 432 000 kg of charcoal (saving approximately 7 200 medium-sized trees annually).
In the project area in Turkana, the use of traditional earth-mound kilns results in the emission of CH4 due to low conversion efficiencies and a lack of CH4 capture. Using the efficient metal-ring kiln reduces the volume of CH4 per unit charcoal produced; this accounts for part of the emission reductions under the project, and the reduced use of
The charcoal transition178
non-renewable biomass accounts for the other part. It has been estimated that 1 tonne of charcoal produced using the metal-ring kiln reduces CO2e emissions by 7 tonnes.
Key lessons learnedThe project is ongoing.
Sources: Andreas Thulstrup and Maina Kibata (both FAO), internal communications.
CASE STUDY 6: CHARCOAL BAN IN THE UNITED REPUBLIC OF TANZANIAAmid fears that rapid deforestation in the United Republic of Tanzania was leading to declining hydroelectric capacity and causing a severe energy crisis, the Minister for Natural Resources and Tourism placed a total ban on the transportation of charcoal in 2006 (World Bank, 2010; Sander, Gros and Peter, 2013). The reasoning was that if charcoal could not be moved to the city for final sale, end users would seek alternative sources of fuel, thus reducing charcoal demand.
Key lessons learnedThe attempt to stop deforestation by introducing a sudden ban on charcoal production was a restrictive intervention that ignored the complexity of the charcoal chain (Beukering et al., 2007), and it had several negative impacts.
Most urban households in the United Republic of Tanzania had no alternative fuel. Cheaper fuelwood was not available and they could not afford or access kerosene, LPG or electricity to satisfy their energy needs. Not surprisingly, there was a large public outcry over the ban, and the production, trade and consumption of charcoal continued, albeit illegally (World Bank, 2010; Sander, Gros and Peter, 2013).
Corruption and collusion increased. The high cost of doing business (resulting from the risk of being caught and the confiscation of illegally produced and traded charcoal) was passed to consumers. Charcoal prices almost doubled during the ban.
Next stepsThe Government of the United Republic of Tanzania now aims to build infrastructure for the sustainable production of charcoal, issuing new guidelines on forestry manage-ment in 2006. Under these guidelines, district committees are to be set up and chaired by district commissioners, who will approve all licences to harvest logs and wood and produce charcoal. Permits will be needed to transport logs out of districts and regions. Although the guidelines are a positive development, their complexity is a source of concern (Butz, 2013).

I6935EN/1/03.17 © FAO, 2017
Food and Agriculture Organization of the United NationsViale delle Terme di Caracalla00153 Rome, Italywww.fao.org
I6935EN/1/03.17
ISBN 978-92-5-109680-2
9 7 8 9 2 5 1 0 9 6 8 0 2