The Causal Impact of Migration on US Trade: Evidence from ...I would like to thank Andriana Bellou,...
35
Bank of Canada staff working papers provide a forum for staff to publish work-in-progress research independently from the Bank’s Governing Council. This research may support or challenge prevailing policy orthodoxy. Therefore, the views expressed in this paper are solely those of the authors and may differ from official Bank of Canada views. No responsibility for them should be attributed to the Bank. www.bank-banque-canada.ca Staff Working Paper/Document de travail du personnel 2017-49 The Causal Impact of Migration on US Trade: Evidence from Political Refugees by Walter Steingress
Transcript of The Causal Impact of Migration on US Trade: Evidence from ...I would like to thank Andriana Bellou,...

Bank of Canada staff working papers provide a forum for staff to publish work-in-progress research independently from the Bank’s Governing Council. This research may support or challenge prevailing policy orthodoxy. Therefore, the views expressed in this paper are solely those of the authors and may differ from official Bank of Canada views. No responsibility for them should be attributed to the Bank.
www.bank-banque-canada.ca
Staff Working Paper/Document de travail du personnel 2017-49
The Causal Impact of Migration on US Trade: Evidence from Political Refugees
by Walter Steingress

2
Bank of Canada Staff Working Paper 2017-49
November 2017
The Causal Impact of Migration on US Trade: Evidence from Political Refugees
by
Walter Steingress
International Economic Analysis Department Bank of Canada
Ottawa, Ontario, Canada K1A 0G9 [email protected]
ISSN 1701-9397 © 2017 Bank of Canada

i
Acknowledgements
I would like to thank Andriana Bellou, Rui Castro, Thomas Chaney, Matthieu Crozet, Jean Francois Maystadt, Baris Kaymak, Anna Maria Mayda, Francesc Ortega, Giovanni Peri, John Ries, Sebastian Stumpner and Maurizio Zanardi as well as seminar participants at Lancaster University, the RIEF conference in Orleans, the 6th Rocky Mountain Empirical Trade conference, the CEA conference in Antigonish and the 4th CEPII-OECD migration conference for their useful comments and suggestions. I would also like to thank the Office of Refugee Resettlement (ORR) for providing me with the data. The views expressed in this paper are those of the author alone and do not reflect those of the Bank of Canada.

ii
Abstract
Immigrants can increase international trade by shifting preferences towards the goods of their country of origin and by reducing bilateral transaction costs. Using geographical variation across U.S. states for the period 2008 to 2013, I estimate the respective causal impact of immigrants on U.S. exports and imports. I address endogeneity and reverse causality by exploiting the exogenous allocation of political refugees within the U.S. refugee resettlement program that prevents immigrants from choosing the destination location. I find that a 10 percent increase in recent immigrants to a U.S. state raises imports from those immigrants’ country of origin by 1.2 percent and exports by 0.8 percent.
Bank topics: International topics; Regional economic developments JEL codes: F14, F22, J61
Résumé
Les immigrants peuvent accroître les échanges internationaux en ce qu’ils accordent plus d’importance aux biens de leur pays d’origine et réduisent le coût des transactions bilatérales. Nous nous appuyons sur les variations géographiques entre les États américains de 2008 à 2013 pour estimer l’effet causal des immigrants sur les exportations et importations américaines. Nous contournons le problème de l’endogénéité et de la causalité inversée en nous servant de la répartition exogène des réfugiés politiques établie par le programme américain de réinstallation des réfugiés. Dans ce programme, les refugiés ne peuvent pas choisir leur destination d’accueil. Nous constatons qu’une augmentation de 10 % des nouveaux arrivants dans un État américain entraîne une hausse de 1,2% des importations provenant de leur pays d’origine et un accroissement de 0,8 % des exportations vers ce pays.
Sujets : Questions internationales; Évolution économique régionale Codes JEL : F14, F22, J61

Non-technical summary
International migrants can influence international trade flows via two distinct mechanisms.First, migrants shift preferences towards the goods of their country of origin, thus generatingdemand for imports of those goods by their host country. Second, migrants reduce transactioncosts between countries, either by holding information about relevant market characteristics orby attenuating frictions because of imperfect contract enforcement. While both mechanisms havetrade-enhancing effects, only the cost-reducing channel is welfare improving in both countries.
In this paper, we estimate the impact of recent immigrants on U.S. imports and exports usinggeographical variations across U.S. states for the period 2008 to 2013. We follow a gravity approachand regress the log of bilateral imports and exports on the log of immigrants who entered the U.S.within the past 5 years. To address reverse causality, and more broadly endogeneity, we analyzethe exogenous allocation of refugees within the U.S. refugee resettlement program. Within thisprogram, the placement decision of refugees is taken by resettlement agencies, preventing refugeesfrom choosing where to settle in the U.S. In a two-step Instrumental Variables (IV) estimationprocedure, we first show that the number of resettled refugees is an exogenous predictor for thelocation decision of recent immigrants. In the second step, we use the predicted number of recentimmigrants to causally estimate the impact of recent immigrants on international trade. Thisapproach insulates our results from endogeneity concerns, where immigrants from a given countryare likely to settle in states with the best trading opportunities to their country of origin. Theresulting empirical estimates imply that a 10 percent increase in recent immigrants to a given U.S.state raises imports from those immigrants’ country of origin by 1.1 percent and exports by 0.8percent.
To shed light on the underlying mechanism at play, we borrow from the gravity literatureand group immigrants according to common factors, i.e., sharing a common legal origin, having acommon official language and sharing a common border. The idea is that migrants from countriesthat use the same language act as an information bridge because they can more easily understandthe economic and cultural particularities of the related country. Immigrants who share a commonlegal origin may have knowledge about the legal framework and institutions and therefore help toovercome imperfect enforcement of contracts. Preferences for goods might be more similar acrosscountries if the respective countries share a common border. Our empirical evidence supports thesehypotheses. We find that immigrants from countries that share a common legal origin increaseexports between their state of residence and the country-origin (transaction cost channel). On theother hand, sharing an official language and having a common border increases bilateral imports(preference channel).
Overall, these results suggest that immigrant networks play an important role in promotingtrade across countries. By providing information on market conditions in both countries, thecountry of origin as well as the country of destination, they reduce transaction/trade costs forimporters and exporters. As a result, consumers can purchase cheaper goods from abroad, andindustries are more competitive in export markets.
3

1 Introduction
Work on individual attitudes shows that public opinion is not favorable to increases in thenumber of immigrants; see Mayda (2006) for further details. Yet increasing evidence in the litera-ture shows a range of beneficial effects for the destination country. An important channel throughwhich migration might increase the welfare of the host country is international trade. If migrantsreduce transaction costs between countries, either by holding information about relevant marketcharacteristics or by attenuating frictions because of imperfect contract enforcement, gains fromtrade are realized. Alternatively, if migrants shift preferences towards the goods of their countryof origin, consumers in the host country may benefit from more consumption variety.1
This paper studies the impact of immigrants on imports and exports by exploiting geographicalvariation across U.S. states for the period 2008 to 2013. I follow a gravity approach and regressthe log of exports and imports, respectively, on the log of recent immigrants. To estimate a causalrelationship, I use variation in the number of immigrants driven by the exogenous allocation ofpolitical refugees within the U.S. refugee resettlement program. I find evidence of a significantlypositive effect of immigrants on U.S. trade.
My analysis differs from previous studies in two respects. First, I focus on regional variation inimmigration and trade within the United States over time. This approach minimizes the concernthat the estimates are driven by the positive correlation between trade and migration policies, giventhat the latter are set at the national level. Second, and more importantly, I address endogeneityby focusing on exogenous shocks to immigration. Endogeneity arises because immigrants’ decisionsregarding settlement within the United States are likely to be correlated with several variables –such as income, employment opportunities and preferences – which in turn are correlated with trade(Borjas (1999)). An additional source of endogeneity arises in the form of reverse causality, i.e.,immigrants from a given country are likely to settle in states that trade a lot with their countryof origin. To address these issues, I estimate an IV specification, where I use the exogenousallocation of political refugees across states within the U.S. refugee resettlement program. TheIV approach removes the endogenous component of migration decisions whereby individuals mightmove to those regions with the best trading opportunities. To establish the causal relationship, myanalysis takes advantage of the fact that political refugees to the United States are exogenouslyallocated across locations once I control for time-varying state and time-varying country of originfixed effects.2 The main benefit of this approach compared with the existing literature is thatit generates exogenous variation for many countries of origin. This variation is key in sheddingnew light on the channels through which migrants increase trade (transaction cost channel versuspreference channel).
Starting with the pioneering work of Gould (1994), there exists ample empirical literature thatargues that immigrants increase trade across international borders. Gould (1994) studies the effectof migration on aggregate U.S. exports and imports for the years 1970 to 1986. He estimates agravity model of trade on migration and finds evidence of a strong positive relationship. Manyauthors follow Gould and study immigration into a single country; for example, Head and Ries(1998) examine Canada, and Girma and Yu (2002) examine the United Kingdom. As mentio-
1However, if imports crowd out domestic production, then welfare losses from trade may be realized.2Other papers in the migration literature that use placement policies of refugees to obtain identification focus
on labor market outcomes: see Beaman (2012) for evidence from the United States as well as Damm (2009) andFoged and Peri (2016) for evidence from Denmark.
4

ned above, a potential concern with aggregate-level analyses is the correlation of migration andtrade policies. More recent studies exploit the regional distribution of immigrants and look atthe bilateral trade relationship between U.S. regions and foreign countries, such as Bardhan andGuhathakurta (2004), Dunlevy (2006) and Parsons and Vézina (2016). While these studies focusexclusively on U.S. exports, this paper presents evidence on both U.S. exports and imports at thestate level. More importantly, this paper puts greater emphasis on the relevance of the underlyingchannels and on the identification of causal effects, which are key for deriving meaningful policyimplications.
In a recent literature review, Felbermayr et al. (2015) argue that the main concern for theidentification of the causal effect of immigration is reverse causality. To deal with this issue, authorshave adopted different approaches. Drawing upon the seminal work of Card (2001), several papers(see, for example Peri and Requena-Silvente (2010) and Bratti et al. (2014)) instrument changesin immigrants at the sub-national level based on the past distribution of immigrants across regions(Spain and Italy, respectively) by country of origin and on the growth in their aggregate inflows.Still, historical migrant stocks can have direct effects on trade even many years after their arrival,therefore violating the exclusion restriction.3 Indeed, the estimated elasticity of immigrants withrespect to trade flows using a Card instrument is significantly higher than the same elasticity usingrefugees.
There are two recent contributions to the literature, Parsons and Vézina (2016) and Cohen et al.(2017), which use a natural experiment for identification of a causal link between trade and migra-tion. Both papers find a positive impact of migration on trade for a specific immigrant population.In Parsons and Vézina (2016) the identification is based on the location choice of the Vietnameseboat people across U.S. states and a concurrent trade embargo on Vietnam. Cohen et al. (2017)use the World War II Japanese internment camps to instrument for the location of the Japanesepopulation in the United States. Instead, this paper uses the exogenous allocation of migrantsfrom many countries of origin across different locations in the U.S. The resulting panel structurestrengthens identification by controlling for time-varying origin and destination fixed effects. Theresults show that in the absence of these control variables, the estimated effects of immigrants aremagnified. By borrowing from the gravity literature (e.g., Head and Mayer (2014)), the multi-country approach also generates new evidence on the underlying channels. Specifically, the resultsshow that immigrants from countries that share a common legal origin reduce transaction costs forexporters, while sharing an official language and having a common border increases the demandfor imports.
The rest of the paper is organized as follows. Section 2 covers the data and the summarystatistics. Section 3 describes the identification strategy as well as the details of the politicalrefugees program, which allow me to establish causality in the estimated impact of trade onmigration. Section 4 discusses the OLS and IV results. Section 5 discusses the robustness of myfindings and Section 6 sheds light on different channels through which immigrants can affect tradeflows. Section 7 concludes.
3An interesting recent contribution that tackles endogeneity is Burchardi et al. (2016). The authors use theethnic composition from the 19th century onward across U.S. states to predict the current immigrant populationand their impact on foreign direct investment.
5
2 Data and summary statistics
My empirical analysis uses variation in exports, imports and the number of recent immigrantsacross U.S. states, countries of origin and time. Before presenting the estimating equation strategyin detail, we describe the data and the summary statistics.
2.1 Trade data
The trade data, which include all sectors of the economy, come from the U.S. Census Bureauand are based on the transaction level data set. Data on imports and exports are available forthe years 2008 to 2013, while for earlier years (2000 to 2008) only export data exist. The datacontain trade flows at the 3-digit NAICS industry level to 183 trading partners. The import valueof shipments is defined as the net selling value exclusive of freight charges and excise taxes. Theexport value is the free-on-board value.
Note that, I focus on the manufacturing sector. The reason is that the state export data seriesuses the “Origin of Movement” definition, which implies that state export data do not necessarilyreflect the state where the goods for export were produced, see Cassey (2009). The Census statesthat these limitations are particularly noticeable for agricultural and non-manufacturing shipments.On the import side, the state may not reflect the final location of consumption because the state,where the entry documentation was filed, may be a storage or distribution point. From there,shipments may later be distributed to another location in another state. To circumvent thisproblem I constructed in an earlier draft an import demand model and found similar results, seeSteingress (2015). In addition, as a robustness check, I re-estimate the model excluding Californiaand New York from the sample. These states contain the major ports in the United States andmay therefore bias the estimates. However, the results remain unaffected by this change.
2.2 Trade cost data
To calculate the bilateral distances used in the trade cost function, I adopt the procedure usedby Mayer and Zignago (2011). dij is the population-weighted distance between the state i andthe country j measured in kilometers. Like Mayer and Zignago (2011), I calculate the geometricaverage of the population-weighted distance between the 15 most populated cities by country andby U.S. state. All data on population, latitudes and longitudes are from the free World CitiesDatabase.4
2.3 Immigration data
The measures of the immigrant population are based on data from the American CommunitySurvey (ACS) compiled by Ruggles et al. (2004) for the years 2008 to 2013 and include 1% of thepopulation. The main explanatory variable in my regressions, i.e., recent immigrants, is defined asthe number of immigrants who immigrated up to 5 years prior to the census year. I also controlfor pre-existing immigrants, which are all those immigrants who live in the respective state in the
4The database is freely available at https://www.maxmind.com/en/free-world-cities-database.
6
census year and immigrated more than five years ago to the United States. I follow Borjas (2003)and focus only on immigrants who are wage-earning civilian employees between the ages 18-64.I then aggregate the number of immigrants at the state level using the census sampling weight.Figure 2 plots the share of recent immigrants over the period 2008 to 2013 with respect to thestate population in 2013.
In the identification strategy, I use political refugees as an instrument for immigration. Data onthe number of refugees per U.S. state come from the Office of Refugee Resettlement (ORR). TheORR provides yearly refugee arrival data sorted by country of origin, state of initial resettlementand information on whether the refugee has family members or friends living in the United States.Each fiscal year, the U.S. government sets an overall refugee admissions limit based on regionalallocations. The limit of refugee admissions varies from year to year depending on the Congressand the geopolitical situation.5
For the purpose of this study, we focus only on “no-U.S.-tie” refugees, i.e., refugees who didnot have family members living in the United States prior to their arrival. Figure 1 plots the totalnumber of “no-U.S.-tie” refugees for each state over the period 2003 to 2013. In order to make therefugee data compatible with the immigration data, I add up the refugee data per country of originand state for all five years prior to the years 2008 and 2013. Table 2 contains the total numberof “no-U.S.-tie” refugees per country of origin who arrived in the United States during the sampleperiod.
2.4 Summary statistics
Table 1 presents the summary statistics for each of the sample years, 2008 and 2013. Rows 1to 5 show the total number of immigrants, the number of newly arrived immigrants (in the pastfive years), their share in the immigrant population and the trade statistics for each census year.The total number of immigrants in the United States was 35.2 million in 2008 and 38.8 millionin 2013. In terms of recent immigrants, immigration to the United States is very diverse. In theyears between 2003 and 2008, 4.6 million migrants emigrated from 156 countries to the UnitedStates, which represents around 12% of the total population of immigrants in the United States.In the period from 2008 to 2013, the immigrant pattern changed only slightly with 4.4 millionpeople with 159 different nationalities. During the same period, the total value of manufacturedimported (exported) goods increased from USD 1.7 trillion (USD 1.2 trillion) in 2008 to USD 1.8trillion (USD 1.5 trillion) in 2013.
Turning our attention to refugees, between 2004 and 2008, 98,000 “no-U.S.-tie” refugees from73 countries settled across the United States (see lower part of Table 1). These numbers increaseto 131,000 “no-U.S.-tie” refugees from 74 countries for the period between 2008 and 2013. Theshare of refugees within recent immigration to the United States was 2.1% in 2008 and 2.9% in2013. In terms of export value, 24% of U.S. exports in 2013 were going to the refugees’ countriesof origin, while 22% of U.S. imports came from these countries.
5See U.S. Department of Homeland Security. 2005 Yearbook of Immigration Statistics. Washington, DC:U.S. Department of Homeland Security. Available at http://www.dhs.gov/xlibrary/assets/statistics/yearbook/2005/OIS_2005_Yearbook.pdf.
7

3 Identification strategy
Once migrants settle in a U.S. state, international trade between the state of residence and theirhome countries is likely to increase. This effect may take place through the following channels.First, migrants might provide information that reduces transaction costs. Second, trade mightincrease simply because migrants have a preference for the goods from their country of origin.Before discussing the channels in detail, I present the identification strategy.
3.1 Regression specification
To analyze the impact of immigration on trade flows, I follow the literature and employ thegravity equation. (See Gould (1994) for the seminal contribution.) The gravity equation relatestrade flows between state i and country j to the relative sizes of the participating economies (whichin my specification are captured by fixed effects). The log of the trade flow of state i from countryj for the period t, Xijt, is given by
log(Xijt) = β1 log(Immijt) + β2 log dij + β3 logPImmijt + fjt + fit + εijt. (1)
The regressor Immijt indicates the number of foreign-born residents in state i who immigrated fromcountry j in any of the five years prior to time t. The other regressors are the log of the weighteddistance, dij, between the capital of state i and the capital in country j, measured in kilometers.PImmijt is the number of foreign-born residents in state i who immigrated from country j morethan five years prior to time t.6 In addition, I introduce time-varying state and country fixedeffects, fit and fjt respectively. The coefficient of interest is β1. If β1 > 0, then the presence ofrecent immigration increases trade. Equation 1 will be my main regression specification.
In terms of identification of β1, it is important to control for geography, since both migration andtrade are correlated with distance; see Head and Mayer (2014) for further evidence. Specifically,distance is negatively correlated with both migration and trade, as states both import relativelymore goods and receive relatively more migrants from neighboring countries. Neglecting theseeffects would introduce an omitted variable bias.
Note that, by analyzing the trade migration relationship across U.S. states, I directly addressthe criticism of Hanson (2010) with respect to the earlier literature. He argues that “it is difficultto draw causal inference from results based on international trading and migration patterns, sinceimmigration may be correlated with unobserved factors that also affect trade, such as the tradingpartners’ cultural similarity or bilateral economic policies (e.g., preferential trade policies or inves-tment treaties that raise the return to both migration and trade).” Trade policies and investmenttreaties are negotiated at the federal level and are thus controlled for by fixed effects specific tothe country of origin, fjt. These fixed effects also control for any determinants of trade that arecommon to all U.S. states. For example, if a country of origin experiences a positive productivityshock, trade might increase since all U.S. states will face lower import prices from this countryand emigration might decrease because of better employment opportunities.
A further concern for the identification of the parameter β1 is the presence of time-varying6Note that Immijt and PImmijt represent the change in the stock of immigrants in the last five years and the
preceding period. Thus, my specification regresses trade flows on migration flows.
8

state-specific characteristics that may be correlated with trade flows as well as immigration. Onesuch candidate is, for instance, economies of agglomeration, i.e., more immigrants are likely tosettle in larger states and those states have higher demand for imported goods. For this reason, Iinclude time-varying state-fixed effects, fit, that control for any state-specific effects, such as localdemand and income shocks, which are common to all migrants and vary over time.
By looking at regional variations and including state and country time-varying fixed effects,I follow the recent literature (see Bardhan and Guhathakurta (2004) and Dunlevy (2006)). Thekey difference of this paper with respect to the literature is that I follow a new approach toresolve endogeneity. Endogeneity arises because immigrants’ decisions regarding settlement withinthe United States is likely to be correlated with several variables, such as income, employmentopportunities and/or preferences, which in turn are correlated with trade (Borjas (1999)). Anadditional source of endogeneity arises in the form of reverse causality, i.e., immigrants from agiven country of origin are likely to go to states that trade a lot with that country.
3.2 Refugees
To tackle reverse causality as well as endogeneity more generally, I focus on exogenous shocks tomigration, i.e., refugees. Gould (1994) argues that immigration occurs before the onset of trade andis therefore predetermined. This is true if the migration decision is based on current or past levelsof trade. However, if the migration decision is forward-looking and dependent on expected futuretrade (for example, people emigrate in order to take advantage of information arbitrage, which leadsto trade), past immigration is endogenous. As a result, the number of immigrants and the level oftrade are jointly determined. Generally, migration is endogenous due to omitted variables such asincome, employment opportunities and/or preferences that are correlated with trade. Thus, theOLS estimates of both the number of recent and previous immigrants in equation 1 are likely to beinconsistent. To address this concern, we implement a two-stage least squares (2SLS) instrumentalvariable estimation strategy and instrument the number of recent immigrants by the number ofrefugee arrivals with no family members in the U.S. (the so-called “no-U.S.-tie” cases). We arguethat the placement upon arrival of no-U.S.-tie cases is decided by resettlement agencies and notby the refugee. Also, the placement does not depend on the number of immigrants already in thestate (I provide a formal test below). Thus, we can isolate the effect of recent immigrants fromthe effect of previous immigrants and exclude the latter from equation 1. Next, we describe theU.S. refugee program followed by the IV estimation strategy.
Refugees are people who have fled their home country and cannot return because they have awell-founded fear of persecution based on religion, race, nationality, political opinion or membershipin a particular social group (Immigration and Nationality Act, Sect. 101[a][42]). Each fiscal year,the President of the United States sends a proposal to Congress for the maximum number ofrefugees to be admitted. After a congressional debate, the overall refugee admissions limit for theupcoming fiscal year is set. The limit varies from year to year. For example, over the period 2003to 2013, 609,208 refugees were admitted to the United States, primarily from Myanmar (108,608),Iraq (93,514) and Bhutan (69,821).7
7The United States has a special concern for a designated group of refugees related to religious activists orminorities in certain countries. This group includes Jews and Christians in the former Soviet Union with closefamily ties in the United States, civil rights activists from Cuba, political refugees from Myanmar, Iranian members
9
One of the main endogeneity concerns in the migration-trade literature is that immigrantschoose where to locate, and this decision might be correlated with trade. For refugees, this is not thecase for the following reasons. In order to become a refugee, an individual presents his case before anImmigration and Naturalization Service officer in one of the U.S. refugee-processing centers aroundthe world outside the United States.8 Upon receiving the application, the Immigration officerreviews the case and decides whether the applicant fulfills the necessary conditions.9 Within theapplication process, the applicants are asked to provide information on whether they have familyand friends already living in the United States. If this is the case, the ORR tries to allocate themclose to their family members. For this reason, this study focuses exclusively on the allocation of“no-U.S.-tie” refugee application cases, i.e., those where the political refugee has no family ties orfriends in the United States. The placement of refugees without family ties is solely decided by theresettlement agency and not by the refugee. Table 2 shows the number of “no-U.S.-tie” refugeesper country of origin.
A potential threat to the identification of a causal effect is strategic placement by resettlementagencies. For example, a given state may have greater opportunities for trade with a specific origincountry, hence the resettlement agency may send refugees from that country to that city. The al-location of “no-U.S.-tie” refugees is handled by the Bureau of Population, Refugees and Migration(PRM), part of the State Department. The PRM takes care of the overseas processing and trans-portation to the United States. Upon the refugees’ arrival in the United States, the PRM allocatesthe “no-U.S.-tie” refugees to voluntary resettlement agencies (Volag), who place them in one oftheir regional offices in the U.S. and provide social services that foster their integration. The deci-sion on where to relocate the “no-U.S.-tie” refugee depends on the characteristics of each refugee,such as his or her medical condition and demographic information.10 With this information, themain objective of the voluntary agencies is to place “no-U.S.-tie” refugees into locations where theycan quickly integrate into American society. The aim of the PRM is to place “no-U.S.-tie” refugeesnot in states where there are people from the same country of origin to avoid the concentration ofethnic groups, as was the case for Cuban refugees in Florida in the 1960s and 1970s, see Kerwin(2012).
The PRM encourages Volags to help refugees to find employment quickly, as this reduces theeconomic costs for their social services (such as housing, furniture, access to health care as wellas English-language courses) and helps refugees integrate faster into American society (David(2004)). Thus, the placement decision is correlated with economic opportunities in the state. Forthis reason, I include time-varying state fixed effects, which control for the potential correlationbetween a state’s capacity to host refugees and the level of its income as well as trade. Figure 1plots the resulting distribution of “no-U.S.-tie” refugees as a share of the local population acrossU.S. states over the whole sample period, i.e., 2008 to 2013. In terms of absolute numbers, thestate that took in the most refugees was Texas with 35,301 refugees. New York ranked secondwith 18,691 refugees, followed by Arizona with 18,673 refugees.
of certain religious minorities and Sudanese Darfurians.8Asylum seekers who claim refugee status within the United States are not included in the sample.9The person must either be in imminent danger and identified as such by the United Nations High Commissioner
for Refugees (UNHCR), a United States Embassy, or a designated non-governmental organization (NGO), or belongto a group of special humanitarian concern identified by the U.S. refugee program.
10For example, refugees with HIV are sent only to particular offices that specialize in such cases (see Beaman(2012)).
10

Turning to the empirical implementation, my identification is based on a two-stage least squarespanel. In the first stage, I regress the log of the number of immigrants (Immijt) who arrived inthe five years prior to year t from country j and settled in state i on the log of the number of “no-U.S.-tie” refugees who arrived in the past five years (Refijt). The second stage uses the predictednumber of immigrants from the first stage as the identifying variable in equation 1. The resultingfirst-stage equation is given by
log(Immijt) = α0 + α1 logRefijt + α2 log dij + fit + fjt + εijt (2)
where fit and fjt are country of origin-year and state-year pair fixed effects. The state-yeareffects, fit, control for any state-specific change in the allocation of refugees over time that iscommon to all countries of origin. Country-year fixed effects, fjt, control for country of originspecific effects that are common to all states in the United States, such as the nature of theconflict that forced people to emigrate or any other macroeconomic condition in the country oforigin. Note that in the robustness section, we address additional concerns on the validity of theinstrument. In particular, we include bilateral (dyadic) fixed effects, fij, in equation 1 and 2.This more demanding specification addresses possible concerns that time-constant factors mightallocate refugees to places that provide better trading opportunities with their country of origin.
The empirical model specified in equation 1 partitions the effect of immigrants on internationaltrade into two categories: (1) recent immigrants and (2) past immigrants. However, in our 2SLSIV approach we use the number of “no-U.S.-tie” refugees to instrument recent immigrants andexclude the previous number of immigrants as an explanatory variable, see equation 2. The reasonis that, based on similar arguments for recent immigrants, the location decision of past immigrantsmight be endogenous to trade flows. However, simply excluding the past number of immigrants isnot sufficient because the allocation of refugees could depend on existing immigrant communitiesfrom the same country of origin. If this is the case, the refugee allocation mechanism would not beexogenous to trade flows because past immigrants are positively correlated with trade. In additionto past immigrants, we also check whether past bilateral trade is related to the allocation of futurerefugees. Since trade flows are persistent, a positive correlation between past trade flows and theallocation of refugees would suggest that the exclusion restriction of strict exogeneity does nothold. To shed further light on the validity of refugees as an instrument, we run the followingregression:
log(Ref ijt) = β0 + β1 logX ijt−1 + β2 log dij + β3 logPImmijt + fit + fjt + εijt (3)
where theXijt−1 represents exports or imports the year before the accumulated five-year refugeeinflow in year t. Note that for exports, we do have two years of observation (2003 and 2008), whilefor imports the first year of observation is 2008, implying that, for imports, we can analyze onlythe refugee allocation in 2013. In addition to distance, trade flows and a set of fixed effects, I alsoinclude the number of past immigrants PImmijt to test whether refugees are placed close to theexisting communities from their country of origin. Table 3 shows that this is not the case.
The only remaining identification concern is that resettlement agencies base their allocationdecisions on real-time information on trade opportunities between a state and the country of origin.This is unlikely to be the case. As Beaman (2012) notes, Volag employees in charge of placementhave stated that the effectiveness of strategic decision-making is limited. Placement officers neverknow when a refugee who is assigned to the Volag by the State Department will actually be allowed
11

to travel. For example, consider the refugee allocation in 2005. In some cases the individuals weregranted refugee status in 2001, but arrived in 2005 because of delays associated with heightenedpost-September 11, 2001 security requirements. These significant time delays make exploitingplacement with respect to country-specific trade shocks extremely difficult.
4 Results
This section shows empirically that the migration channel is important for increasing exportsand imports across U.S. states. I start by a simple OLS regression of equation 1. The resultsare presented in Table 4 and show the estimation results for all countries that sent “no-U.S.-tie”refugees in the period 2003 to 2013 to the United States. Overall, I find a positive and significantmigrant effect on trade across all specifications. The baseline OLS results in columns 1 and 4suggest that a 10% increase in the number of recent migrants raises exports by 1.1% and importsby 1.4%.
Note that the magnitudes of the migration elasticities (0.11 for exports and 0.14 for imports)are significantly lower than the values found in the literature. Looking at the national level ofU.S. imports for the period 1870 to 1910, Dunlevy and Hutchinson (1999) found an elasticity of0.28. Similarly, Wagner et al. (2002) found an elasticity of 0.28 using a variation across Canadianprovinces, and Bratti et al. (2014) estimated an elasticity of 0.32 for imports using Italian data.Briant et al. (2014) on the other hand found an elasticity of 0.12, which is very similar to ourresults, when looking at French import data. For exports, Bandyopadhyay et al. (2008) estimatedan elasticity of 0.14 at the U.S. state level, slightly higher than 0.11 in Table 4. The main differencewith respect to the high migration elasticities found in the literature is that column (1) and (4)focus on newly arrived immigrants, whereas the previous paper focused on the total stock ofimmigrants.11
Next, we estimate the full model specified in equation 1 and include the number of previousimmigrants as an additional explanatory variable. I follow two distinct approaches. In columns(2) and (5), I add the number of immigrants who arrived six or more years ago and reportedto be living in state i in the year t the Census was conducted. In columns (3) and (6) I usethe number of immigrants before the first year of trade is observed. More precisely, I includethe number of immigrants who arrived before 2003 and reported to be living in state i in 2008.Previous immigration will be correlated with actual immigration if recent immigrants prefer tosettle in states where there is a large pre-existing community. However, the second specificationis less demanding because it is based on the distribution of immigrants in the year 2003 and doesnot consider the year-to-year changes in the migration patterns of older immigrants.
Table 4 presents the results for the full sample. When I include pre-existing immigrants, themigration elasticity of recent immigrants decreases for both exports and imports. More specifi-cally, the coefficient of exports decreases from 0.11 to 0.09 and for imports from 0.14 to 0.11.12 Asexpected, omitting the number of previous immigrants increases the migration elasticity because
11One exception is Peri and Requena-Silvente (2010), who exploit the fact that the number of immigrants wasvery low in the first year of their study (Spain in 1993). They examine the quick, intense arrivals of immigrantsin the next 15 years, similar to the definition of recent immigrants in this paper. Their estimated immigrationelasticities range from 0.05 and 0.09 for exports and from 0.02 to 0.05 for imports.
12The results are similar if I use the immigrant distribution in the year 2003.
12
the immigration decision of recent immigrants is positively correlated with the presence of previousimmigrants. Also note that the combined effect of previous and recent immigrants is now compa-rable in magnitude to values found in the literature. Thus, the positive correlation between tradeand immigrants depends partly on the existing trade network established by previous immigrants.
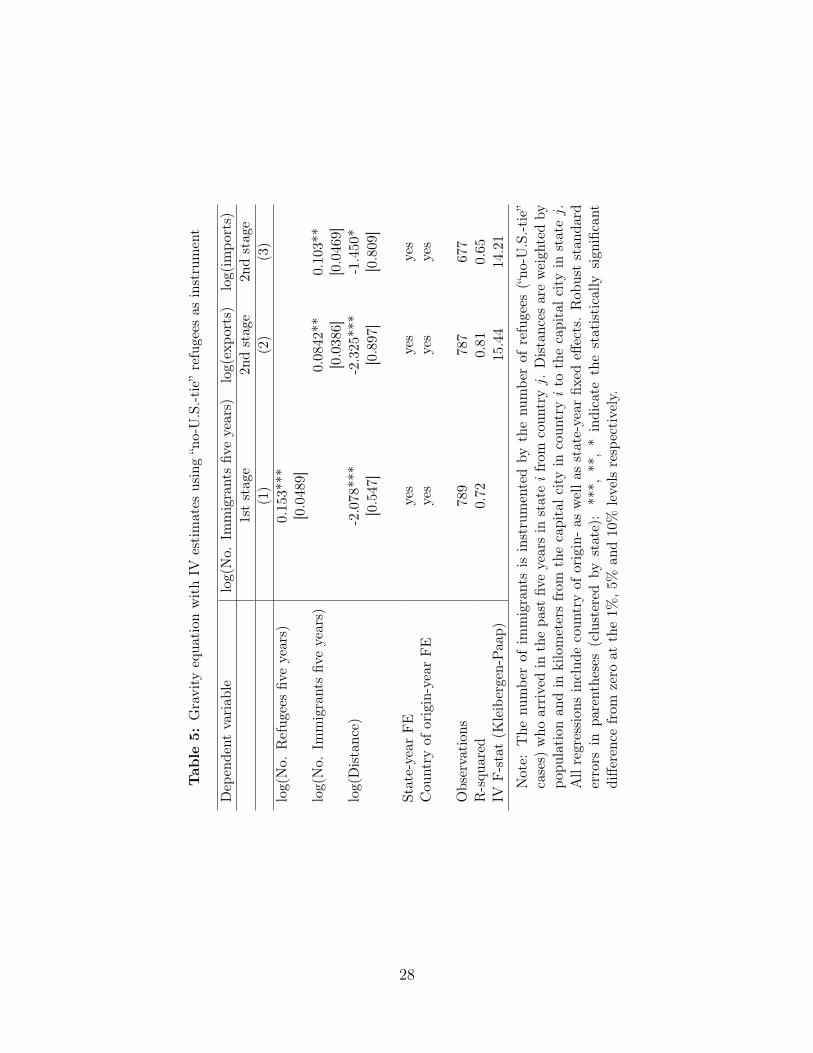
As discussed, the OLS results might be biased: for example, if people immigrate in order to takeadvantage of trading opportunities, i.e., trade causes immigration. To infer a causal link betweenmigration and trade, I instrument the number of recent immigrants by political refugees using a2SLS approach. The first-stage results are presented in column (1) of Table 5. The number ofrefugees is positive and significantly correlated with the number of immigrants.13 To confirm thevalidity of the IV regressions, I include the Kleibergen-Paap F statistics at the bottom of the tables.The Kleibergen-Paap F statistic provides an indication of the significance of the instrument. Ifthe instrument is only weakly correlated with the endogenous regressor, the IV estimator is notvalid. To assess the weakness of the instrument, I need to compare these F statistics with theStock-Yogo critical values for the Cragg-Donald F-statistic with one endogenous regressor (Stockand Yogo (2002)). As a rule of thumb, an F-statistic above 10 indicates that the IV is acceptable.
Column (2) in Table 5 contains the second-stage IV results for exports and column (3) forimports. The coefficient on the number of recent immigrants is significantly positive, with anelasticity slightly lower than in the OLS regression for all specifications. However, performinga Hausman test does not reveal any significant difference in the coefficients. This suggests thatsorting of immigrants towards locations that trade a lot with their country of origin plays only anegligible role. Overall, the results imply that a 10% increase in the number of immigrants in thepast five years increases exports by 0.8% and imports by 1.0%.
5 Robustness
This section provides additional evidence that the positive effect of recent immigrants in inter-national trade is robust. First, we compare our results with the literature and address potentialbiases introduced by studying just one country as in Parsons and Vézina (2016) or by followingthe Card approach as in Peri and Requena-Silvente (2010) and Bratti et al. (2014). Second, weaccount for issues related to zeros, i.e., the presence of trade flows but no immigrants and viceversa.
5.1 Comparison with alternative approaches in the literature
As mentioned in the Introduction, a related paper is Parsons and Vézina (2016). The authorsbase identification on the combination of an immigration shock – driven by the location of Vietna-mese boat people across U.S. states – and a concurrent trade embargo. They use the cross-sectionalvariation in the share of Vietnamese immigrants and exports to Vietnam of the 50 U.S. states.They show that, after the end of the 1994 trade embargo, U.S. states with a higher share of Viet-namese immigrants exported significantly more to Vietnam. The key identification assumption is
13The estimated elasticity of 0.10 implies that doubling the refugee population increases the number of recentimmigrants by 10%. To be more concrete, increasing the inflow of refugees in the five years between 2008 and 2013from 150,000 to 300,000 would imply an “exogenous” increase of 200,000 new immigrants.
13

that the settlement choice of Vietnamese immigrants before the trade embargo is exogenous withrespect to U.S. exports after the embargo. While Parsons and Vézina (2016) use Census data toidentify Vietnamese refugees, my analysis is based on data from the Office of Refugee Resettle-ment (ORR) and considers only political refugees recognized by the State Department. Withinthis refugee resettlement program, immigrants cannot choose their settlement location; instead,the ORR allocates them across U.S. states.
The main differences with respect to Parsons and Vézina (2016) are the following. First, I focuson regional variation in both U.S. imports and exports, whereas they focus only on U.S. exports.Second, and more importantly, my analysis addresses endogeneity by exploiting the exogenousvariation in migration not only across states but also over time and across countries of origin,i.e., in a panel structure. As a result, we observe migration flows from different countries anddifferent time periods increasing the number of observations significantly compared with Parsonsand Vezina’s cross-section of 50 U.S. states. The resulting panel structure also allows us to includevarious fixed effects, like a state-year fixed effect that takes into account that California mayexperience an economic boom that draws in refugees and increase exports and imports versus allcountries (i.e., an upward bias in the immigration elasticity).14 Another important fixed effectis the country of origin-year fixed effect, which controls for size effects (i.e., more immigrantscome from larger economies, which also have a higher trading volume with the United States) andpotential bilateral economic policies that favor trade and migration between the two countries.Based on these arguments, we expect an upward bias in the immigration elasticity. To investigatethe presence of these biases more formally, I re-estimate equation 1 (i) without any fixed effect, (ii)including a state-year fixed effect, (iii) including a country of origin-year fixed effect, (iv) includingstate-year and country of origin-year fixed effect (baseline specification) and, for completeness, (v)including all possible types of fixed effects. Note that I re-estimate the model using both OLSas well as 2SLS because the exclusion restriction of the IV specification requires the presence ofstate-year as well country of origin-year fixed effects. In the absence of these fixed effects, thedirection of the bias is confounded by the refugee allocation mechanism, which complicates theanalysis.
Table 6 shows the results. Consistent with our expectations, the presence of a state-year fixedeffect or a country of origin-year fixed effect reduces the elasticity of recent immigrants with respectto trade, as seen by comparing columns (3) to (8) with (1) and (2). While columns (7) and (8)repeat the estimates of Tables 3 and 4, the results in columns (9) and (10) are based on an evenmore demanding specification, which includes dyadic (state-country of origin) fixed effects. Theseestimates are robust to any time-constant bilateral effects between a state and an immigrant’scountry of origin. The estimated coefficients are positive, significant and similar in magnitude tothe coefficients obtained without dyadic fixed effects. However, there are signs of potential weakinstruments (IV F-stat below 10), as the number of observations drops by half.
Overall, I see my approach as complementary to that of Parsons and Vézina (2016) and as atest of external validity in a multi-country, multi-period setting. Parsons and Vézina (2016) focuson a specific group of migrants at a given point in time. This paper uses data on refugees to theU.S. from all countries in the period of 2008 to 2013, leading to a more comprehensive samplein terms of countries of origin and allows us to investigate more deeply the underlying channels
14In Parsons and Vézina (2016), Vietnamese immigrants settled predominantly in coastal states in the westernpart of the U.S., which are naturally more open to trade and closer to Vietnam.
14

through which immigrants increase trade in Section 6.A popular alternative approach to address endogeneity in the migration literature is based on
Card’s (2001) methodology. The idea is to instrument the current flow of recent immigrants by theshare in the stock of past immigrants interacted with the aggregate growth of recent immigrants,see Peri and Requena-Silvente (2010) and Bratti et al. (2014), among others. However, historicalmigrant stocks could have established long-standing trade relationships, with direct effects on thecurrent level of trade. Hence, Card-based instruments may violate the exclusion restriction andoverestimate the effect of immigrants on trade. To assess whether there is a potential positivebias in comparison to using the allocation of refugees, I construct a Card instrument for recentimmigrants as follows:
ImmCardijt = shij2000Immjt (4)
where shij2000 = Immij2000/(∑
i Immij2000) is the share of immigrants that arrived in the UnitedStates between 1996 and 2000 from country j and reported to live in state i in 2000. Immjt isthe aggregate number of immigrants who arrived within five years prior to year t in the UnitedStates (note that t equals either 2008 or 2013). Next, we replace the number of refugees by theCard instrument in the first stage (equation 2) and re-estimate the model. The results in Table7 show that the estimated immigration elasticities are significantly higher for both exports andimports, compared with the specification based on refugees in Table 5. Consistent with our prior,the results suggest that instruments based on Card can create an upward bias.
5.2 The presence of zeroes
An important issue is the presence of zeros. Given the fact that there are refugees from 80different countries, the number of potential observations is 80x50x2, much higher than the actual787 observations. As a first step, I count 5,813 observations with no trade flow and no immigrantflow in both sample periods. The bilateral (dyadic) fixed effects absorb these observations becausethere is no time-specific variation. With respect to observations that have no trade flow and noimmigrant flow in one period and a positive trade or immigrant flow in the other period, I followPeri and Requena-Silvente (2010) and add one so that the log of one equals zero. In the caseof zero trade flows but positive immigration flows, I follow an alternative approach based on thePseudo Poisson Maximum Likelihood (PPML) estimator of Silva and Tenreyro (2006). Columns(1) and (2) in Table 8 show the log plus one results, while columns (3) and (4) show the PPMLones. In both cases, the estimates imply that the positive effects of recent immigrants on tradeare robust to the presence of zeroes.
Another concern relates to the fact that the countries of origin of refugees in the UnitedStates do not correspond to the major trading partners of the United States. As the summarystatistics show, the combined value of exports and imports from the countries of origin of refugeesrepresents only 24% of overall U.S. exports and 22% of overall U.S. imports in 2013. One paperthat looks at cross-country differences in the effect of migration on trade is Egger et al. (2012).They show that the estimated coefficient of immigrants on trade flows decreases in the numberof immigrants (i.e., smaller immigrant communities have larger effects on trade than larger ones).Since the average immigrant community from a refugee-sending country is smaller than the average
15

immigrant communities across all countries of origin, I consider the estimated effect of recentimmigrants in Table 5 as an upper bound.15
6 Channels
Note that in all regressions the effect of immigrants on imports is slightly higher than the effecton exports. The reason is that migrants affect exports and imports through different channels. Ingeneral, the literature distinguishes between two types of effects: the transaction cost channel andthe preference channel. The transaction cost channel captures the idea that migrants either holdspecific information about relevant market characteristics, attenuate frictions because of imperfectcontract enforcement or reduce search costs. The preference channel implies that migrants have apreference for goods from their country of origin and demand those products in their host country.
In his seminal article, Rauch (1999) argued that the transmission of information through mi-grants’ networks is particularly important for differentiated products since search costs are parti-cularly high for this type of good. Immigrant networks can provide information and reduce thesecosts. On the other hand, homogeneous products are not subject to these information flows. Forthis reason, I separate exports and imports according to the Rauch classification and match eachNAICS code to one of the three categories: differentiated products, reference priced products ororganized exchange products. I find only a robust pro-trade effect for differentiated products (seeTable 9) and suggest that both exports and imports are subject to transaction/search costs. Theseresults are in line with the existing literature. The larger coefficient on imports suggests that thecost-reducing effect of immigrants is more pronounced for imports than for exports.
To shed further light on the underlying channels, I use proxies from the gravity literature (seeHead and Mayer (2014)) and group immigrants according to common factors. For the transactioncost channel, I use the following variables: sharing a common legal origin and sharing a commonofficial language. The idea is that migrants from countries that use the same language act asan information bridge because they can understand the economic and cultural particularities ofthe related country. Immigrants who share a common legal origin may have knowledge aboutthe legal framework and institutions and therefore help to overcome imperfect enforcement ofcontracts. For the preference effect, I assume that preferences between countries are more similarto each other if the respective countries share a border. For example, the preferences for goods ofFrench immigrants are more closely related to preferences of Italian immigrants than to those ofChinese immigrants. Of course, this is only an approximation. Sharing a border may also captureknowledge, as I expect that the French know more about the Italian economy than about theChinese economy.
To examine whether a common factor (like sharing a language/border, etc.) increases tradeflows, I include the number of related immigrants as an additional control variable. For example,suppose we want to explain trade between a U.S. state and France. In this case, the regressionincludes the trade of France with the respective U.S. state on the left-hand side and on the right-
15One way to support this argument is to compare the OLS estimates of equation 1 between a sample thatincludes all recent immigrants from all U.S. trading partners and a sample that includes only recent immigrantsfrom countries that have refugees in the United States. The findings show that the estimated coefficients using thefull sample are smaller than the estimated coefficients restricting to refugees’ countries of origin. Detailed resultsare available upon request.
16

hand side the number of French immigrants and, as a separate variable, the number of otherimmigrants who also speak French (i.e., Belgian or Canadian immigrants). However, the numberof immigrants who share the common factor may be endogenous. I address this endogeneityconcern by first running the same first-stage regression as in equation 2. Then, I group thepredicted number of recent immigrants Mijt from the first stage according to the common factorby summing over all countries except the one whose trade flows I want to explain. In particular,the number of immigrants that share a common official language with country j is calculated as
LAMijt =∑l 6=j
MiltIilt
where Iijt is an indicator function that equals 1 if the immigrants from l and j share a commonlanguage and are living in state i. Otherwise the indicator equals zero. I repeat the same calculationfor each common factor. I then estimate the following second-stage regression:
log(Xijt) = β1 log( Immijt) + β2 log dij + β3bij + β4 log( BOImm−jit)
+ β5 log( LAImm−jit) + β6 log( LOImm−jit) + fjt + fit + εijt. (5)
where the regressor Immijt indicates the predicted number of recent immigrants from country j,BOImm−jit the predicted number of recent immigrants who share a border with j, LAImm−jitthe predicted number of recent immigrants who share a common language with j and LOImm−jitthe predicted number of recent immigrants who share a common legal origin with j. Note that byall common factor variables, I exclude the immigrants from country j. In this way, I distinguishbetween the effects of recent immigrants on trade from the same country (β1) and from relatedcountries (β5 − β7).
Columns (1) and (2) in Table 10 show the results on the channels. Immigrants who sharecommon legal origins increase only exports, whereas immigrants who share a common border ora common language increase imports of the related country. This evidence seems to suggest thatimmigrants increase the exports of a U.S. state by providing information about the legal systemwhen contracting in the related country. Surprisingly, sharing a common language or a border doesnot increase exports, although it generates import demand. This finding is consistent with theidea that being close to each other and/or speaking the same language fosters cultural proximityand can manifest itself in similar preferences for goods.
Overall, the results in Table 10 imply that related immigrants of similar countries can actas complements to immigrants from the country of origin and increase trade flows. However,these immigrants cannot be arbitrarily related to the country under investigation. In a sensitivityanalysis, I include all other immigrants living in the state as an additional regressor to the mainspecification in equation 1. Columns (3) and (4) in Table 10 show that other immigrants do notexplain imports and exports.
17

7 Conclusion
Migrants carry information about the goods and market conditions of the country of origin aswell as the country of destination. By providing this information, migrants reduce bilateral tradecosts and increase trade between countries. As a result, consumers can purchase cheaper goodsfrom abroad and industries are more competitive in export markets.
This paper focuses on the trade cost-reducing effect of migrants by looking at the relationshipbetween immigration and imports as well as exports across U.S. states. Using the exogenousmigration decision brought about by a quasi-natural experiment (political refugees), I establishthe causal relationship between immigrants and trade. My results indicate a strong positive impactof migration on trade. I find that a 10% increase in immigrants raises exports by around 0.8% andimports by 1.1%.
Taking a broader perspective, immigrants may also have knowledge of production techniquesused in their country of origin, which can increase the comparative advantage of industries intheir country of destination; see Bahar and Rapoport (2016) for empirical evidence on this issue.All in all, these results suggest that the mobility of people between countries can serve as a keyelement in enhancing industrial productivity growth. However, more research is needed to assessthe long-term impact of immigration on the economy.
18

ReferencesBahar, D. and H. Rapoport (2016): “Migration, Knowledge Diffusion and the ComparativeAdvantage of Nations,” Tech. Rep. 5769, CESifo Working Paper Series.
Bandyopadhyay, S., C. C. Coughlin, and H. J. Wall (2008): “Ethnic Networks and USExports*,” Review of International Economics, 16, 199–213.
Bardhan, A. D. and S. Guhathakurta (2004): “Global Linkages of Subnational Regions:Coastal Exports and International Networks,” Contemporary Economic Policy, 22, 225–236.
Beaman, L. A. (2012): “Social Networks and the Dynamics of Labour Market Outcomes: Evi-dence from Refugees Resettled in the US,” The Review of Economic Studies, 79, 128–161.
Borjas, G. J. (1999): “The Economic Analysis of Immigration,” Handbook of Labor Economics,3, 1697–1760.
——— (2003): “The Labor Demand Curve is Downward Sloping: Reexamining the Impact of Im-migration on the Labor Market,” Working Paper 9755, National Bureau of Economic Research.
Bratti, M., L. De Benedictis, and G. Santoni (2014): “On the Pro-Trade Effects of Immi-grants,” Review of World Economics, 1–38.
Briant, A., P.-P. Combes, and M. Lafourcade (2014): “Product Complexity, Quality ofInstitutions and the Protrade Effect of Immigrants,” The World Economy, 37, 63–85.
Burchardi, K. B., T. Chaney, and T. A. Hassan (2016): “Migrants, Ancestors, and Invest-ments,” Working Paper 21847, National Bureau of Economic Research.
Card, D. (2001): “Immigrant Inflows, Native Outflows, and the Local Labor Market Impacts ofHigher Immigration,” Journal of Labor Economics, 19, 22–64.
Cassey, A. (2009): “State Export Data: Origin of Movement vs. Origin of Production,” Journalof Economic and Social Measurement., 34, 241–268.
Cohen, L., U. G. Gurun, and C. J. Malloy (2017): “Resident Networks and CorporateConnections: Evidence fromWorld War II Internment Camps,” Journal of Finance, forthcoming.
Damm, A. P. (2009): “Ethnic Enclaves and Immigrant Labor Market Outcomes: Quasi-Experimental Evidence,” Journal of Labor Economics, 27, 281–314.
David, M. (2004): The United States Refugee Admissions Program, Migration Policy Institute.
Dunlevy, J. A. (2006): “The Influence of Corruption and Language on the Protrade Effectof Immigrants: Evidence from the American States,” Review of Economics and Statistics, 88,182–186.
19

Dunlevy, J. A. and W. K. Hutchinson (1999): “The Impact of Immigration on AmericanImport Trade in the late Nineteenth and Early Twentieth Centuries,” Journal of EconomicHistory, 59, 1043–1062.
Egger, P. H., M. Von Ehrlich, and D. R. Nelson (2012): “Migration and Trade,” TheWorld Economy, 35, 216–241.
Felbermayr, G., V. Grossmann, and W. Kohler (2015): “Chapter 18 - Migration, Inter-national Trade, and Capital Formation: Cause or Effect?” in Handbook of the Economics ofInternational Migration, ed. by B. R. Chiswick and P. W. Miller, North-Holland, vol. 1, 913 –1025.
Foged, M. and G. Peri (2016): “Immigrants’ Effect on Native Workers: New Analysis onLongitudinal Data,” American Economic Journal: Applied Economics, 8, 1–34.
Girma, S. and Z. Yu (2002): “The Link Between Immigration and Trade: Evidence from theUnited Kingdom,” Review of World Economics/Weltwirtschaftliches Archiv, 138, 115–130.
Gould, D. M. (1994): “Immigrant Links to the Home Country: Empirical Implications for USBilateral Trade Flows,” The Review of Economics and Statistics, 302–316.
Hanson, G. H. (2010): “International Migration and the Developing World,” Handbook of Deve-lopment Economics, 66, 4363–4414.
Head, K. and T. Mayer (2014): Gravity Equations: Workhorse,Toolkit, and Cookbook, Elsevier,vol. 4 of Handbook of International Economics, chap. 3, 131–195.
Head, K. and J. Ries (1998): “Immigration and Trade Creation: Econometric Evidence fromCanada,” Canadian Journal of Economics/Revue canadienne d’économique, 47–62.
Kerwin, D. (2012): “The Faltering US Refugee Protection System: Legal and Policy Responsesto Refugees, Asylum-seekers, and Others in need of Protection,” Refugee Survey Quarterly, 31,1–33.
Mayda, A. M. (2006): “Who is Against Immigration? A Cross-country Investigation of IndividualAttitudes Toward Immigrants,” The Review of Economics and Statistics, 88, 510–530.
Mayer, T. and S. Zignago (2011): “Notes on CEPII’s Distances Measures: The GeoDistDatabase,” Working Papers 2011-25, CEPII research center.
Parsons, C. and P.-L. Vézina (2016): “Migrant Networks and Trade: The Vietnamese BoatPeople as a Natural Experiment,” IZA Discussion Papers.
Peri, G. and F. Requena-Silvente (2010): “The Trade Creation Effect of Immigrants: Evi-dence from the Remarkable Case of Spain,” Canadian Journal of Economics/Revue canadienned’économique, 43, 1433–1459.
Rauch, J. E. (1999): “Networks Versus Markets in International Trade,” Journal of InternationalEconomics, 48, 7–35.
20

Ruggles, S., M. Sobek, T. Alexander, C. A. Fitch, R. Goeken, P. K. Hall, M. King,and C. Ronnander (2004): “Integrated Public Use Microdata Series (IPUMS): Version 3.0,”Minneapolis, MN: Minnesota Population Center.
Silva, J. and S. Tenreyro (2006): “The Log of Gravity,” The Review of Economics and Sta-tistics, 88, 641–658.
Steingress, W. (2015): “The Causal Impact of Migration on US Trade: Evidence from a NaturalExperiment,” IZA Discussion Papers 9058, Institute for the Study of Labor (IZA).
Stock, J. H. and M. Yogo (2002): “Testing for Weak Instruments in Linear IV Regression,”NBER Technical Working Papers 0284, National Bureau of Economic Research, Inc.
Wagner, D., K. Head, and J. Ries (2002): “Immigration and the Trade of Provinces,” ScottishJournal of Political Economy, 49, 507–525.
21

8 Figures
Figure 1: The share of refugees, who immigrated to the United States over the period from 2003 to 2013,with respect to the state population in 2013.
22

Figure 2: The share of recent immigrants, who migrated to the United States over the period 2003 to2013, with respect to the state population in 2013.
23

9 Tables
Table 1: Summary Statistics
Year 2008 2013
Total
No. of immigrants (thousands) 35200 38800No. of immigrants last five years (thousands) 4663 4431Share of immigrants (%) 13.2 11.4Value of exports (Bil.$) 1211 1537Value of imports (Bil.$) 1705 1809Number nationalities among recent immigrants 156 159Number of countries exporting to U.S. 152 154Number of countries importing from U.S. 154 156
Refugees
No. of “no-U.S.-tie” refugees last five years (thousands) 98 131Share of no-U.S.-tie” refugees in immigrants last five years (%) 2.1 2.9Value of exports (Bil.$) to countries of origin of “no-U.S.-tie” refugees 207 370Value of imports (Bil.$) from countries of origin of “no-U.S.-tie” refugees 345 404Share of U.S. exports going to countries of origin of “no-U.S.-tie” refugees 17.1 24.1Share of U.S. imports from countries of origin of “no-U.S.-tie” refugees 20.2 22.3Number nationalities among “no-U.S.-tie” refugees 73 74
24

Table 2: Total number of “no-U.S.-tie” refugees by country of origin for the years 2003 to 2013
Refugees Country Refugees Country Refugees Country
63507 Myanmar 139 Laos 12 Georgia28996 Somalia 128 Chad 11 Morocco27614 Bhutan 128 Lebanon 10 Turkey21618 Iraq 110 Jordan 10 Costa Rica12951 Russia 107 Korea 9 Venezuela9844 DR Congo 106 Ivory Coast 8 Philippines9464 Burundi 91 Uganda 8 Thailand8844 Liberia 90 Angola 6 Libya8558 Cuba 76 Nigeria 6 Macedonia7637 Sudan 62 Kuwait 5 Mozambique7508 Eritrea 58 Cambodia 5 Guatemala5013 Afghanistan 53 Zimbabwe 5 Algeria3774 Ethiopia 48 Egypt 5 Zambia2490 Viet Nam 47 Equatorial Guinea 4 Honduras1470 Iran 44 Yemen 4 Tunisia1238 Colombia 42 Cameroon 4 Bangladesh1122 Rwanda 35 Ecuador 4 Namibia1096 Israel 34 Gambia 3 Madagascar936 Congo 30 Nepal 3 Mali663 Yugoslavia 29 Moldova 2 Guinea-Bissau660 Sierra Leone 25 Indonesia 2 Burkina Faso643 Central African Republic 21 India 1 Panama500 Pakistan 21 Kenya 1 Saudi Arabia307 Togo 21 Gabon 1 Poland262 Sri Lanka 18 Senegal 1 Antigua and Barbuda215 Mauritania 15 Guinea 1 Oman196 China 14 Haiti 1 Benin161 Syria 13 Tanzania
25

Tab
le3:
Falsification
test
Dep
endent
Variable
log(No.
“no-U.S.-tie”refugees
fiveyears)
(1)
(2)
(3)
(4)
(5)
(6)
log(PastExp
orts)
-0.00935
-0.00656
-0.000857
[0.0226]
[0.0247]
[0.0248]
log(PastIm
ports)
0.00466
-0.0103
-0.0165
[0.0201]
[0.0222]
[0.0234]
log(Distance)
-0.207
-0.0394
-0.107
-0.224
-0.126
-0.214
[0.474]
[0.460]
[0.461]
[0.496]
[0.515]
[0.521]
log(No.
Immigrants6or
moreyears)
0.107
0.114
[0.321]
[0.422]
log(No.
Immigrants2003)
0.0860
0.0924
[0.317]
[0.433]
State-year
FE
yes
yes
yes
yes
yes
yes
Cou
ntry
oforigin-yearFE
yes
yes
yes
yes
yes
yes
Observation
s730
640
621
420
362
347
R-squ
ared
0.831
0.856
0.856
0.823
0.843
0.845
Note:
The
depe
ndentvariab
leisthelogof
thenu
mbe
rof
refugees
(“no
-U.S.-tie”cases)
who
arrivedin
thepa
stfiv
eyearsin
stateifrom
coun
tryj.
Distances
areweigh
tedby
popu
lation
andin
kilometers
from
thecapitalcityin
coun
tryito
thecapitalcityin
statej.
Allregression
sinclud
ecoun
tryof
origin-
aswella
sstate-year
fixed
effects.Rob
uststan
dard
errors
inpa
rentheses(clustered
bystate):***,
**,
*indicate
thestatistically
sign
ificant
diffe
rencefrom
zero
atthe1%
,5%
and10%
levels
respectively.
26

Tab
le4:
Gravity
equa
tion
withOLS
estimates
consideringon
lyim
migrantsfrom
thesamecoun
triesof
origin
as“no-U.S.-tie”refugees
Dep
endent
variab
lelog(expo
rts)
log(im
ports)
(1)
(2)
(3)
(4)
(5)
(6)
log(No.
Immigrantsfiv
eyears)
0.10
8**
0.09
31*
0.09
53*
0.13
9*0.11
1*0.10
9**
[0.045
2][0.049
8][0.034
2][0.0774]
[0.055
1][0.051
7]log(Distance)
-1.574
***
-1.496
***
-1.435
***
-1.316
-1.231
**-1.217
**[0.429
][0.412
][0.403
][0.955
][0.977
][0.971
]log(No.
Immigrants6or
moreyears)
0.05
000.13
4*[0.042
6][0.067
1]log(No.
Immigrants20
03)
0.12
9**
0.16
7**
[0.061
0][0.092
0]
State-year
FE
yes
yes
yes
yes
yes
yes
Cou
ntry
oforigin-yearFE
yes
yes
yes
yes
yes
yes
Observation
s78
773
171
667
764
864
1R-squ
ared
0.82
0.83
0.83
0.66
0.67
0.68
Note:
The
depe
ndentvariab
lesarethelogof
expo
rtsan
dthelogof
impo
rtsfrom
coun
tryjto
statei
inpe
riod
t.Distances
areweigh
tedby
popu
lation
andin
kilometersfrom
thecapitalcity
incoun
tryi
tothecapitalc
ityin
statej.
Allregression
sinclud
ecoun
tryof
origin-as
wella
sstate-year
fixed
effects.
Rob
uststan
dard
errors
inpa
renthe
ses(clustered
bystate):**
*,**
,*indicate
thestatistically
sign
ificant
diffe
rencefrom
zero
atthe1%
,5%
and10
%levels
respectively.
27
Tab
le5:
Gravity
equa
tion
withIV
estimates
using“no-U.S.-t
ie”refugees
asinstrument
Dep
endent
variab
lelog(No.
Immigrantsfiv
eyears)
log(expo
rts)
log(im
ports)
1ststag
e2n
dstag
e2n
dstag
e(1)
(2)
(3)
log(No.
Refug
eesfiv
eyears)
0.15
3***
[0.048
9]log(No.
Immigrantsfiv
eyears)
0.08
42**
0.10
3**
[0.038
6][0.046
9]log(Distance)
-2.078
***
-2.325
***
-1.450
*[0.547
][0.897
][0.809]
State-year
FE
yes
yes
yes
Cou
ntry
oforigin-yearFE
yes
yes
yes
Observation
s78
978
767
7R-squ
ared
0.72
0.81
0.65
IVF-stat(K
leibergen-Paap)
15.44
14.21
Note:
The
numbe
rof
immigrantsis
instrumentedby
thenu
mbe
rof
refugees
(“no
-U.S.-tie”
cases)
who
arrivedin
thepa
stfiv
eyearsin
stateifrom
coun
tryj.
Distanc
esareweigh
tedby
popu
lation
andin
kilometersfrom
thecapitalc
ityin
coun
tryito
thecapitalc
ityin
statej.
Allregression
sinclud
ecoun
tryof
origin-as
wella
sstate-year
fixed
effects.Rob
uststan
dard
errors
inpa
rentheses(clustered
bystate):
***,
**,*indicate
thestatistically
sign
ificant
diffe
rencefrom
zero
atthe1%
,5%
and10
%levels
respectively.
28

Tab
le6:
OLS
and2S
LSestimates
invariou
sfix
edeff
ectspecification
s.
log(Exp
.)log(Im
p.)
log(Exp
.)log(Im
p.)
log(Exp
.)log(Im
p.)
log(Exp
.)log(Im
p.)
log(Exp
.)log(Im
p.)
OLS
esti
mat
es(1)
(2)
(3)
(4)
(5)
(6)
(7)
(8)
(9)
(10)
log(No.
Immigrantsfiv
eyears)
0.576***
0.585***
0.493***
0.624***
0.427***
0.332***
0.0842**
0.103**
0.0919*
0.123*
[0.0442]
[0.0405]
[0.0416]
[0.0353]
[0.0563]
[0.0434]
[0.0386]
[0.0469]
[0.0526]
[0.0659]
log(Distance)
-1.029***
-0.343*
-1.320***
-0.378**
0.170
-0.694
-1.450*
-1.316
[0.175]
[0.170]
[0.156]
[0.181]
[0.995]
[0.716]
[0.809]
[0.955]
State-year
FE
nono
yes
yes
nono
yes
yes
yes
yes
Cou
ntry
oforigin-yearFE
nono
nono
yes
yes
yes
yes
yes
yes
State-coun
tryof
origin
FE
nono
nono
nono
nono
yes
yes
Observation
s812
707
804
694
795
690
787
677
352
324
R-squ
ared
0.22
0.27
0.38
0.34
0.69
0.59
0.82
0.66
0.99
0.99
2SLS
esti
mat
es
log(No.
Immigrantsfiv
eyears)
5.797**
6.256*
4.102**
4.023**
1.114***
0.958***
0.0841**
0.117**
0.0801*
0.102*
[2.475]
[3.532]
[2.082]
[2.264]
[0.409]
[0.319]
[0.0420]
[0.0502]
[0.0451]
[0.0517]
log(Distance)
-3.167**
-2.042
-3.492*
-3.016***
-0.241
-0.493
-2.325***
-1.450*
[1.739]
[1.791]
[1.821]
[1.138]
[1.041]
[1.210]
[0.897]
[0.809]
State-year
FE
nono
yes
yes
nono
yes
yes
yes
yes
Cou
ntry
oforigin-yearFE
nono
nono
yes
yes
yes
yes
yes
yes
State-coun
tryof
origin
FE
nono
nono
nono
nono
yes
yes
Observation
s812
707
804
694
795
690
787
677
352
324
R-squ
ared
0.21
0.26
0.30
0.33
0.67
0.54
0.81
0.65
0.98
0.97
IVF-stat(K
leibergen-Paap)
9.75
8.72
9.51
5.20
27.46
24.02
15.44
14.21
8.79
8.12
Note:
The
numbe
rof
immigrantsis
instrumentedby
thenu
mbe
rof
refugees
(“no
-U.S.-tie”cases)
who
arrivedin
thepa
stfiv
eyearsin
stateifrom
coun
tryj.
Distances
areweigh
tedby
popu
lation
andin
kilometersfrom
thecapitalcity
incoun
tryito
thecapitalcity
instatej.
Rob
uststan
dard
errors
inpa
rentheses(clustered
bystate):***,
**,*
indicate
thestatistically
sign
ificant
diffe
rencefrom
zero
atthe1%
,5%
and10%
levelsrespectively.
29

Tab
le7:
Gravity
equa
tion
withIV
estimates
basedon
Cardinstrument.
Dep
endent
Variable
log(No.
Immigrantsfiv
eyears)
log(Exp
orts)
log(Im
ports)
(1)
(2)
(3)
log(Cardinstrument)
0.511***
[0.0560]
log(No.
Immigrantsfiv
eyears)
0.181*
0.309*
[0.0742]
[0.167]
log(Distance)
-0.665*
-1.376***
-1.030
[0.373]
[0.437]
[1.138]
State-year
FE
yes
yes
yes
Cou
ntry
oforigin-yearFE
yes
yes
yes
Observation
s697
695
625
R-squ
ared
0.74
0.81
0.65
IVF-stat(K
leibergen-Paap)
83.99
64.47
Note:
The
depe
ndentvariab
lein
thefirst
stageisthelogof
numbe
rof
immigrantswho
arrived
inthepa
stfiv
eyearsin
stateifrom
coun
tryj.
The
depe
ndentvariab
lesin
thesecond
stage
arethelogof
expo
rtsan
dthelogof
impo
rtsfrom
coun
tryjto
stateiin
period
t.Distances
areweigh
tedby
popu
lation
andin
kilometersfrom
thecapitalcity
incoun
tryito
thecapital
city
instatej.
Allregression
sinclud
ecoun
tryof
origin-as
wellas
state-year
fixed
effects.
Rob
uststan
dard
errors
inpa
rentheses(clustered
bystate):***,
**,*
indicate
thestatistically
sign
ificant
diffe
rencefrom
zero
atthe1%
,5%
and10%
levels
respectively.
30

Tab
le8:
Dealin
gwithzero
trad
eflo
wso
rzeroim
migrant
flows:
log+
1an
dIV
estimates.
Log+
1PPML
Dep
endent
Variable
log(Exp
orts)
log(Im
ports)
log(Exp
orts)
log(Im
ports)
(1)
(2)
(3)
(4)
log(No.
Immigrantsfiv
eyears)
0.128*
0.194*
0.0987*
0.128**
[0.0654]
[0.107]
[0.0501]
[0.0618]
log(Distance)
-3.429***
-4.783*
-1.508***
-1.044
[1.361]
[2.724]
[0.373]
[1.668]
State-year
FE
yes
yes
yes
yes
Cou
ntry
oforigin-yearFE
yes
yes
yes
yes
Observation
s3162
2187
814
809
R-squ
ared
0.63
0.62
0.72
0.677
IVF-stat(K
leibergen-Paap)
10.44
10.47
12.79
11.65
Note:
The
numbe
rof
immigrantsis
instrumentedby
thenu
mbe
rof
refugees
(“no
-U.S.-tie”
cases)
who
arrivedin
thepa
stfiv
eyearsin
stateifrom
coun
tryj.
Distances
areweigh
tedby
popu
lation
andin
kilometersfrom
thecapitalc
ityin
coun
tryito
thecapitalc
ityin
statej.
Allregression
sinclud
ecoun
tryof
origin-as
wella
sstate-year
fixed
effects.Rob
uststan
dard
errors
inpa
rentheses(clustered
bystate):***,
**,*indicate
thestatistically
sign
ificant
diffe
rencefrom
zero
atthe1%
,5%
and10%
levels
respectively.
31
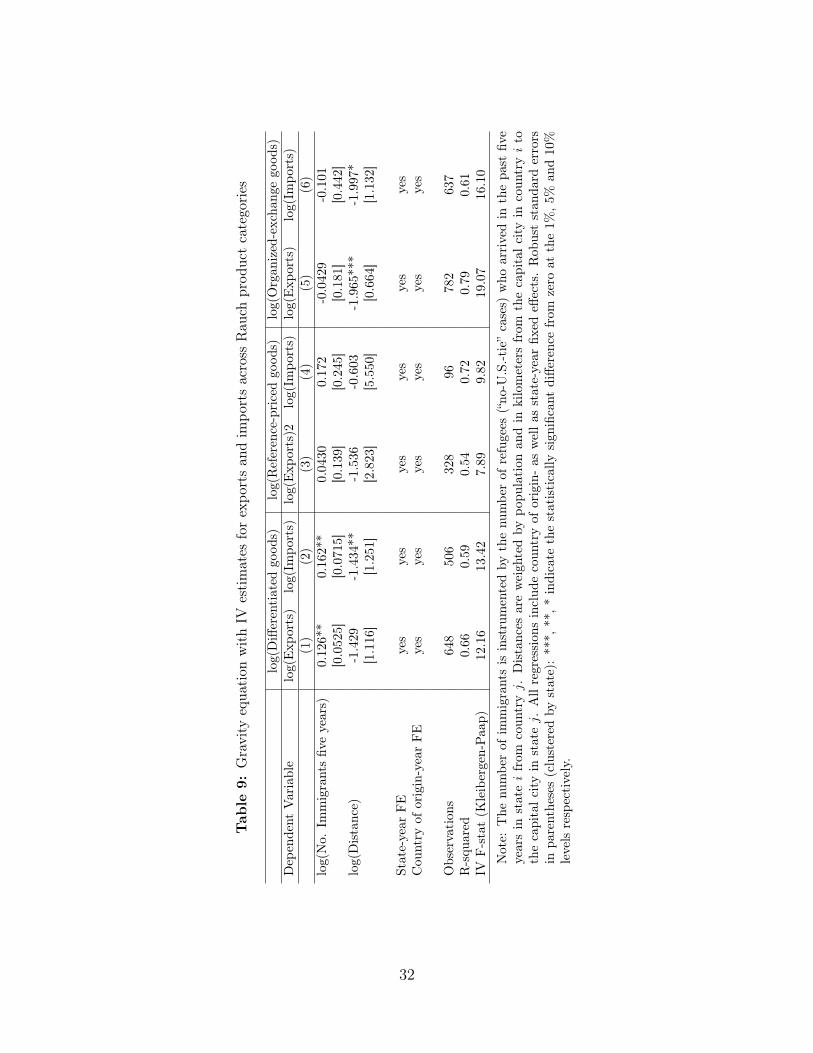
Tab
le9:
Gravity
equa
tion
withIV
estimates
forexpo
rtsan
dim
portsacross
Rau
chprod
uctcatego
ries
log(Differentiated
good
s)log(Reference-pricedgo
ods)
log(Organ
ized-excha
ngego
ods)
Dep
endent
Variable
log(Exp
orts)
log(Im
ports)
log(Exp
orts)2
log(Im
ports)
log(Exp
orts)
log(Im
ports)
(1)
(2)
(3)
(4)
(5)
(6)
log(No.
Immigrantsfiv
eyears)
0.126**
0.162**
0.0430
0.172
-0.0429
-0.101
[0.0525]
[0.0715]
[0.139]
[0.245]
[0.181]
[0.442]
log(Distance)
-1.429
-1.434**
-1.536
-0.603
-1.965***
-1.997*
[1.116]
[1.251]
[2.823]
[5.550]
[0.664]
[1.132]
State-year
FE
yes
yes
yes
yes
yes
yes
Cou
ntry
oforigin-yearFE
yes
yes
yes
yes
yes
yes
Observation
s648
506
328
96782
637
R-squ
ared
0.66
0.59
0.54
0.72
0.79
0.61
IVF-stat(K
leibergen-Paap)
12.16
13.42
7.89
9.82
19.07
16.10
Note:
The
numbe
rof
immigrantsis
instrumentedby
thenu
mbe
rof
refugees
(“no
-U.S.-tie”cases)
who
arrivedin
thepa
stfiv
eyearsin
stateifrom
coun
tryj.
Distances
areweigh
tedby
popu
lation
andin
kilometersfrom
thecapitalcity
incoun
tryito
thecapitalc
ityin
statej.
Allregression
sinclud
ecoun
tryof
origin-as
wella
sstate-year
fixed
effects.Rob
uststan
dard
errors
inpa
rentheses(clustered
bystate):***,
**,*
indicate
thestatistically
sign
ificant
diffe
rencefrom
zero
atthe1%
,5%
and10%
levels
respectively.
32

Tab
le10
:Gravity
equa
tion
IVestimates
forchan
nels
effects
using“no-U.S.-t
ie”refugees
asinstrument.
Dep
endent
Variable
log(Exp
orts)
log(Im
ports)
log(Exp
orts)
log(Im
ports)
(1)
(2)
(3)
(4)
log(Distance)
-2.720*
-2.618***
-3.039***
-2.386**
[1.432]
[1.759]
[0.957]
[1.768]
log(No.
Immigrantsfiv
eyears)
0.0745**
0.101*
0.0846**
0.127*
[0.0381]
[0.0502]
[0.0429]
[0.0651]
log(No.
Immigrantsfiv
eyears)
border
0.144
0.0941*
[0.148]
[0.0515]
log(No.
Immigrantsfiv
eyears)
common
lang
uage
-0.106
0.0811**
[0.197]
[0.0413]
log(No.
Immigrantsfiv
eyears)
common
legalo
rigin
0.0796**
0.0117
[0.0402]
[0.159]
log(No.
Immigrantsfiv
eyears)
minus
j-0.431
-0.597
[0.667]
[0.584]
State-year
FE
yes
yes
yes
yes
Cou
ntry
oforigin-yearFE
yes
yes
yes
yes
Observation
s728
641
779
668
R-squ
ared
0.84
0.72
0.82
0.70
IVF-stat(K
leibergen-Paap)
9.51
8.42
11.29
10.48
Note:
The
numbe
rof
immigrantsis
instrumentedby
thenu
mbe
rof
refugees
(“no
-U.S.-tie”cases)
who
arrivedin
thepa
stfiv
eyearsin
stateifrom
coun
tryj.
Distances
areweigh
tedby
popu
lation
andin
kilometersfrom
the
capitalcity
incoun
tryito
thecapitalcity
instatej.
Allregression
sinclud
ecoun
tryof
origin-as
wellas
state-
year
fixed
effects.Rob
uststan
dard
errors
inpa
rentheses(clustered
bystate):***,
**,*
indicate
thestatistically
sign
ificant
diffe
rencefrom
zero
atthe1%
,5%
and10%
levels
respectively.
33