
The Canadian Uniform Data Collection Program (UDCP) … · The Canadian Uniform Data Collection...
88
The Canadian Uniform Data Collection Program (UDCP) for Mercury from Coal-fired Electric Power Generation A GUIDANCE DOCUMENT Developed by the Canadian Council of Ministers of the Environment Mercury Canada-wide Standards Development Committee to guide data monitoring and reporting under its 2002 - 2005 Mercury Electric Power Generation Workplan January, 2003
Transcript of The Canadian Uniform Data Collection Program (UDCP) … · The Canadian Uniform Data Collection...

The Canadian Uniform Data CollectionProgram (UDCP) for Mercury from Coal-fired
Electric Power Generation
A GUIDANCE DOCUMENT
Developed by the Canadian Council of Ministers of the EnvironmentMercury Canada-wide Standards Development Committee
to guide data monitoring and reportingunder its 2002 - 2005 Mercury Electric Power Generation Workplan
January, 2003

UDCP i
Table of Contents
Table of Contents ..........................................................................................i
List of Appendices........................................................................................ii
1.0 Introduction.............................................................................................1
2.0 Part I: General Plant Information.......................................................2
2.1 Background..........................................................................................................................2
2.2 Program Description...........................................................................................................2
2.3 Deliverables..........................................................................................................................2
3.0 Part II: Coal, Ash and Residues Sampling Program ......................2
3.1 Background..........................................................................................................................2
3.2 Program Description...........................................................................................................23.2.1 Sampling and Analysis ................................................................................................33.2.2 Sample Collection, Preparation and Analysis Methodologies................................3
3.3 Deliverables..........................................................................................................................5
4.0 Part III: Air Emissions Monitoring Program.....................................5
4.1 Background..........................................................................................................................5
4.2 Program Description...........................................................................................................5
4.3 Deliverables..........................................................................................................................6
5.0 Proxies and Historical Data.................................................................6
5.1 Background..........................................................................................................................6
5.2 Program Description..........................................................................................................6
5.3 Deliverables.........................................................................................................................6
6.0 UDCP Summary .....................................................................................7

UDCP ii
List of Appendices
Appendix A - General Plant Information
Appendix B - Preparation of Site-Specific Test Plans for the Coal, Ashand Residue Sampling and Analysis Program
Appendix C - Laboratory Verification and Round Robin Testing
Appendix D - Data Fields for the Coal, Ash and Residue Sampling andAnalysis Program
Appendix E - Preparation of Site-Specific Test Plans for the AirEmissions Testing Program
Appendix F - Approved Ontario Hydro Method

UDCP 1
The Canadian Uniform Data Collection Program (UDCP) forMercury from Coal-fired Electric Power Generation
1.0 Introduction
In order to permit a sound and scientific assessment of the mercury emissions from coal-firedelectricity-generation in Canada, a national program of testing, analysis and verification called“The Canadian Uniform Data Collection Program (UDCP) for Mercury from Coal-fired ElectricPower Generation” will be conducted under the auspices of the Canadian Council of Ministers ofthe Environment (CCME). The main objective of the UDCP is to gather nationally consistent,comparable and compatible information upon which to base future standards development.More specifically, the program is designed to:
• compile quality assured and quality controlled inventories for mercury in coals, residuesand flue gases - the assessment of mercury emissions should include analysis of alladditives, for example limestone injection, and heavy fuel oil (HFO) where supplementaryfiring is used;
• develop reasonable correlations between mercury in feed coals, residues and flue gasesfor mass balance purposes; and
• use the above information to reasonably predict the mercury emission reductions thatmay be expected from various control technologies.
The testing program, to be conducted according to jurisdiction specific agreements betweenprovincial governments and their utilities, will consist of the three major initiatives outlined below.It is anticipated that these initiatives will generate the data required to determine what mercuryemissions reductions can reasonably be expected from coal-fired electric power plants and overwhat time frames. It is recognized, however, that operational realities and safety considerationsmay preclude the use of some of the recommended sampling procedures. In such cases,individual facilities are asked to propose alternatives in their individual test plans (describedbelow) that will yield equivalent information.
It is anticipated that the information collected for the UDCP will be compiled into a national reportand be made broadly available to the Canadian public. Details of how and when this is to beaccomplished will be the subject of discussion between jurisdictions and the CCME. Inquiriesregarding the UDCP should be directed to the UDCP Project Manager:
Mike Gilbertson, CCME Secretariat123 Main Street, Suite 360Winnipeg, MB., R3C 1A3
Phone: (204) 948-2032FAX: (204) 948-2125e-mail: [email protected]

UDCP 2
2.0 Part I: General Plant Information
2.1 Background
Coal-fired thermal electric power plants in Canada burn a range of coal types. These plants varyin generation capacity, age, process equipment and pollution control technology. Suchdifferences can have significant impacts on the quantities and species of mercury emitted to theatmosphere. Compiling facility specific configuration information, therefore, is an essentialcomponent of the UDCP that will aid in the evaluation of factors influencing mercury emissions.In addition, this information will be used in the evaluation of test plans (described below) toensure fuels, residues and emissions data are nationally compatible, consistent andcomparable.
2.2 Program Description
Individual utilities will be asked to provide the detailed identification, engineering and performanceinformation specified in Appendix A.
2.3 Deliverables
Utilities will be asked to submit the information outlined in Appendix A to their jurisdictionalrepresentative. For the duration of the UDCP, utilities will be asked to update this informationwhenever modifications or changes are made which are likely to significantly impact mercuryemissions or speciation (for example, configuration changes, modifications to boilers, burnerequipment, and/or air pollution control devices).
3.0 Part II: Coal, Ash and Residues Sampling Program
3.1 Background
Weekly coal, ash and residues sampling/analyses programs from every electricity generatingunit in Canada are designed to supply needed information on the mercury content of coal andresidues found in Canadian coal-fired power plants. The collection of composite coal, ash andresidue samples over the term of the UDCP will generate an essential portion of the data neededto make mass-balance estimates and predict the fate of mercury at each facility. In addition,analysis of all additives, for example limestone injection, and heavy fuel oil (HFO) wheresupplementary firing is used, will be important for mass-balances.
3.2 Program Description
Prior to commencing the sampling program, each utility will be asked to submit a site specifictest plan outlining a coal (and supplementary fuels if applicable), ash and residue samplingprogram in accordance with the methodologies outlined below and as described in the guidancedocument for utility test plans (Appendix B). Again, it is recognized that operational realitiesmay preclude the use of some of the recommended procedures. In such cases, individualfacilities are asked to propose alternatives in their individual test plans that will yield equivalentinformation.
In order to minimize interlaboratory variances, utilities will be asked to utilize Natural ResourcesCanada’s Canada Centre for Mineral and Energy Technology (CANMET) for their respectiveanalyses while a 6-month, round-robin testing program is being conducted. Details regardingthe Laboratory Verification and Round-Robin Testing Program can be found in Appendix C.

UDCP 3
When the round-robin is complete, utilities may select their laboratories of choice from theapproved list. It is anticipated that Part II will be carried out over a period of about 24 months.
3.2.1 Sampling and Analysis
Weekly composite coal samples are to be collected as-fired and must be reported with theircorresponding feed rate. As-fired refers to the condition of the coal immediately upon enteringthe boiler. Any proposed deviation from this may require additional testing (i.e. on rejects) for thepurposes of mass balance determination.
Fly ash composite samples must be obtained from either the hoppers of at least the first twofields of an electrostatic precipitator, each of the hoppers of a fabric filter, the ash silo, or thestation prior to conveyance to the ash lagoon (i.e. prior to sluicing). Samples of bottom ash willbe obtained once per week for the first three weeks of the UDCP. The requirement for bottomash sampling will be reviewed at the end of this period with the objective of eliminating thisrequirement if results warrant.
At a minimum, all weekly composite samples must be comprised of samples taken over threeseparate days of the week in question. As far as possible, ash samples should correspond tothe coal that is represented by the composite coal sample. It is recommended that splitsamples be obtained and stored in the event that future analyses are desired to re-evaluateprogram results.
Utilities will be asked to analyse weekly composite samples of coal, ash and any other significantresidues for mercury, chlorine, inherent moisture (combined with air dry values to calculate totalmoisture) and sulphur. Coal samples will also be analysed for heat value while ash will betested for unburned carbon. Proximate and ultimate analyses will be obtained for coal samples.Tests for moisture, sulphur and unburned carbon may be done using any standard analyticalmethod and service provider the utility chooses. Mercury and chlorine contents, however, mustbe determined using laboratories whose performance has been assessed and approved duringthe UDCP Laboratory Round-robin Proficiency Testing Program. While not a mandatory part ofthe UDCP, it is recommended that utilities also analyze samples for other halides such asbromine and fluorine.
3.2.2 Sample Collection, Preparation and Analysis Methodologies
The methods below (Table 1) are recommended for collecting, preparing and analyzing samplesfor Part II of the UDCP.
Table 1: Recommended methods for sample preparation, collection and analysisActivity Sample Procedures
SampleCollection
Coal ASTM D6315 - Standard Practice for Manual Sampling of Coal from Tops ofBargesASTM D6610 - Standard Practice for Manual Sampling Coal from Surfaces ofa StockpileASTM D4915 - Standard Guide for Manual Sampling of Coal from Tops ofRailroad CarsASTM D4916 - Standard Practice for Mechanical Auger SamplingASTM D6609 - Standard Guide for Part-Stream Sampling of CoalASTM D2234 - Standard Practice for Collection of a Gross Sample of CoalASTM D4702 - Standard Guide for Inspecting Crosscut, Sweep-Arm, andAuger Mechanical Coal-Sampling Systems for Conformance with Current

UDCP 4
ASTM StandardsASTM D6518 - Standard Practice for Bias Testing a Mechanical CoalSampling SystemASTM D4182 - Standard Practice for Evaluation of Laboratories Using ASTMProcedures in the Sampling and Analysis of Coal and Coke
SolidResidues
Standard practices for the sampling and preparation of residues have notbeen established.
SamplePreparation
Coal ASTM D2013 - Standard Practice of Preparing Coal Samples for Analysis
SolidResidues
Standard practices for the preparation of residues have not been established.The recommended size reduction is 150-um (No. 100) U.S.A. standard sieve,prepared in an agate mortar and pestle.
MercuryAnalysis
Coal ASTM D3684 - Standard Test Method for Total Mercury in Coal by the OxygenBomb Combustion/Atomic Absorption MethodASTM D6414 - Standard Test Method for Total Mercury in Coal and CoalCombustion Residues by Acid Extraction or Wet Oxidation/Cold VaporAtomic AdsorptionASTM D6722 - Standard Test Method for Total Mercury in Coal and CoalCombustion Residues by Direct Combustion AnalysisEPA Method 7473 - Mercury in Solids and Solutions by ThermalDecomposition, Amalgamation, and Atomic Absorption Spectrophotometry
SolidResidues
ASTM D6414 - Standard Test Method for Total Mercury in Coal and CoalCombustion Residues by Acid Extraction or Wet Oxidation/Cold VaporAtomic AdsorptionASTM D6722 (Draft Method) - Standard Test Method for Total Mercury in Coaland Coal Combustion Residues by Direct Combustion AnalysisEPA Method 7473 - Mercury in Solids and Solutions by ThermalDecomposition, Amalgamation, and Atomic Absorption Spectrophotometry
OtherResidues
EPA 7471A (Acid Extraction CVAA)
EPA 1631 (Acid Extraction CVAFS)Microwave Digestion CVAA
ChlorineAnalysis
Coal ASTM D4208 - Bomb Combustion Ion Selective Electrode (ISE)
Pyrohydrolysis / Ion ChromatographyASTM D2361 - Standard Test Method for Chlorine in CoalASTM D6721 - Standard Test Method for Determination of Chlorine in Coal byOxidative Hydrolysis MicrocoulometryInstrumental Neutron Activation
SolidResidues
Pyrohydrolysis / Ion Chromatography
Summaries of the ASTM methods outined in Table 1 can be viewed at http://www.astm.org/cgi-bin/SoftCart.exe/DATABASE.CART/MARKETINGCODES/PE2.htm?U+mystore+mnos7563or by writing to: ASTM
100 Barr Harbor DriveWest Conshohocken, PA 19428-2959, USAPhone: (610) 832-9585, Fax: (610) 832-9555
EPA method summaries can be obtained from http://www.epa.gov/epahome/index/sources.htm

UDCP 5
3.3 Deliverables
Utility test plans should be submitted to their respective jurisdictional representatives. Feedbackfor utilities will be provided within 30 days. Thirty days will be allocated for test plan revisions (ifnecessary) prior to the commencement of the sampling program.
The sampling program is scheduled to run approximately 24 months. Utilities should providedata quarterly to the jurisdictional representative in hardcopy or spreadsheet format usingreporting formats described in Appendix D.
4.0 Part III: Air Emissions Monitoring Program
4.1 Background
The UDCP will include the development of quality-assured speciated mercury emissions data forevery electricity-generating unit in Canada. It is anticipated that the emissions data will besufficient to determine facility-specific mass-balance relationships, predict the fate of themercury in each facility, convert the weekly data collected in Part II to estimates of annualmercury emissions and predict the mercury emission reductions that may be expected fromvarious control technologies.
4.2 Program Description
Each utility will submit a site-specific test plan outlining a speciated mercury emissions samplingand analysis program for its generating units in accordance with the methodologies describedbelow and in the guidance document for the preparation of site-specific test plans (Appendix E).Again, it is recognized that operational realities may preclude the use of some of therecommended procedures. In such cases, individual facilities are asked to propose alternativesin their individual test plans that will yield equivalent information. The alternatives are to includethe proposed use of proxy results or configurations in accordance with the requirementsdescribed in Section 5.0.
Ideally, Part III of the UDCP will consist of concurrent flue gas sampling upstream of the firstemission control device (if applicable) and downstream of the last emission control device ateach electricity generating unit to determine concentrations of elemental, reactive and particulateforms of mercury. At a minimum, facilities will be expected to obtain downstreammeasurements for each unit. Units should be operating under full load during the test period.The testing is to consist of three runs at each sampling location and is to be conducted inaccordance with the approved Ontario Hydro Method (Appendix F). For each stack test, threeas-fired coal samples will be collected and analyzed. Also, for each stack test, threecombustion residue samples will be collected and analyzed. Coal and ash samples should beanalyzed for the characteristics outlined in Part II using the procedures prescribed therein.Based on residence times, the emission testing and ash sampling should correspond, asclosely as possible, to the coal that was sampled and was being burned during the test period. Itis recommended that split samples be obtained and stored in the event that future analyses aredesired to re-evaluate program results.
If coal samples are taken before coal rejects are removed, the rejects must also be analyzed formercury content. It is imperative that the feed rates of the sampled coal (and rejects, ifapplicable) are known. Fly ash samples must be taken, at a minimum, from the hoppers of thefirst two fields of an electrostatic precipitator or from each of the hoppers of a fabric filter.

UDCP 6
4.3 Deliverables
Utility test plans should be submitted to their respective jurisdictional representatives 60 daysprior to testing. Feedback for utilities will be provided within 30 days of the receipt of the plans.The UDCP Part III is estimated to require 24 months to complete. Utilities will be expected tosubmit the results of stack testing to their respective jurisdictional representatives within 90 daysof the completion of the test.
The results of flue gas, coal and residue sampling and analysis should be submitted in a finalreport following the format for test reports outlined in Appendix E. Reports will include aninventory of mercury in coal, combustion residues and speciated mercury air emissions. Allstack testing is to be completed by June, 2004.
5.0 Proxies and Historical Data
5.1 Background
While some utilities will conduct stack tests for each electricity generating unit for the UDCP,some may have already completed tests that meet UDCP requirements. Preliminary short-termanalysis of this existing data will be undertaken to evaluate its suitability for inclusion in the UDCPdatabase.
In addition, it is recognized that some utilities may have generating units with configurations andfeed coal sources that are equivalent for the purposes of mercury emissions and mass balancedeterminations. The equivalency, or “proxy” status, of these units will be assessed based onsimilarity of plant configurations, historical or current data for feed coals, residues and airemissions.
5.2 Program Description
Stack analyses conducted after 1996 and meeting the requirements outlined in Section 4.2above may be used to partially fulfill the requirements of Part III of the UDCP. Re-testing usingthe approved Ontario Hydro Method (Appendix F) may be required to assure jurisdictions thatno significant changes in emissions have occurred since the initial testing. Expert advice will beobtained on the suitability of existing data and the possible use of one plant configuration as aproxy for another.
5.3 Deliverables
Utilities should notify jurisdictions and the CCME (through the UDCP Project Manager) of thepotential use of existing mercury emissions data or proxy units with the submission of their testplans. In the case of existing data, notification should be accompanied by the data in question, adetailed description of collection, analysis and QA/QC methods, and an indication of anychanges to the unit capacity or configuration since the date of data collection. In the case ofproxy determination, a detailed justification supporting the ‘similarity’ of unit configurations mustbe included. Any significant changes in the plant configuration during the UDCP will require areassessment of the applicability of existing data and/or proxy status.

UDCP 7
6.0 UDCP Summary
Tables 2, 3 and 4 below provide a synopsis of utility information requirements for UDCP Parts I, II and III. The testing programs may bemodified or extended based on identified data gaps.
Table 2: Utility information requirement for UDCP Part I - General Plant InformationInformation Requirement Reporting to
Facility identification, performance andengineering information outlined in AppendixA
Jurisdictional representatives
Information on potential use of existingmercury emissions data or proxy unitsidentified in section 5 above
Jurisdictional representatives, with updates if plantmodifications are made during the course of the
UDCP
Table 3: Utility information requirement for UDCP Part II - Coal, Ash and Residue Sampling ProgramSource Sampling
FrequencySampling Locations Sampling
MethodsAnalyses to be
ConductedAnalysisMethods
Reporting
As-firedCoal
Weekly compositesamples, comprisedof samples taken onat least 3 separatedays
Milled coal sent to boiler ReferenceSection3.2.2
mercury,chlorine, inherentmoisture, totalmoisture, sulphurand heat value
ReferenceSection3.2.2
Quarterly
Fly Ash Weekly compositesamples, comprisedof samples taken onat least 3 separatedays
The hoppers of the first two fields ofan electrostatic precipitator, each ofthe hoppers of a fabric filter, the ashsilo, or prior to conveyance to theash lagoon (i.e. prior to sluicing)
ReferenceSection3.2.2
mercury,chlorine, inherentmoisture, totalmoisture,sulphur, andunburned carbon
ReferenceSection3.2.2
Quarterly
BottomAsh
Once per week forthe first 3 weeks ofsampling - furtherrequirements will bereviewed
Before quenching mercury ReferenceSection3.2.2
First Quarterlyreport

UDCP 8
Table 4: Utility information requirement for UDCP Part III - Air Emissions Testing ProgramSource Number of
SamplesSampling Locations Sampling
MethodsAnalyses to be
ConductedAnalysisMethods
Reporting
As-firedCoal
3 samples foreach stack test
Milled coal sent to boiler ReferenceSection 3.2.2
mercury, chlorine,inherent moisture,total moisture, sulphurand heat value
ReferenceSection 3.2.2
Test report within 90days of thecompletion of thetest, and prior toNovember 1, 2004
Fly Ash 3 samples foreach stack test
The hoppers of the firsttwo fields of anelectrostatic precipitatoror each of the hoppers ofa fabric filter (at aminimum)
ReferenceSection 3.2.2
mercury, chlorine,inherent moisture,total moisture,sulphur, and unburnedcarbon
ReferenceSection 3.2.2
Test report within 90days of thecompletion of thetest, and prior toNovember 1, 2004
BottomAsh
3 samples foreach stack test
Before quenching mercury ReferenceSection 3.2.2
Test report within 90days of thecompletion of thetest, and prior toNovember 1, 2004
FlueGas
Three runs ateach samplinglocation
Concurrent flue gassampling upstream (ifapplicable) of the firstemission control deviceand downstream of thelast emission controldevice
ApprovedOntario HydroMethod(Appendix F)
elemental, oxidizedand particulatemercury. Whereexisting speciateddata are acceptable,total mercury
ApprovedOntario HydroMethod(Appendix F)
Test report within 90days of thecompletion of thetest, and prior toNovember 1, 2004

UDCP Appendix A 1
The Canadian Uniform Data Collection Program (UDCP) for Mercury from
Coal-fired Electric Power Generation
APPENDIX A: General Plant Information
Contact Information
1. Facility name:
_____________________________________________________________________
_________________________________________________________________
2. Street address of facility:
___________________________________________________________________
_____________________________________________________________________
_________________________________________________________________
3. Mailing address of facility (if different from above):
_____________________________________________________________________
_____________________________________________________________________
_______________________________________________________________
4. Facility Latitude and Longitude:
Latitude________________ Longitude_______________
5. Legal name of facility owner as incorporated under law:_____________________________________________________________________
_________________________________________________________________
6. Address of legal owner (Head Office):_____________________________________________________________________
_____________________________________________________________________
_______________________________________________________________
7. Legal name of operator (if different from above):
_____________________________________________________________________
_________________________________________________________________

UDCP Appendix A 2
8. Address of legal operator (if different from above):
_____________________________________________________________________
_____________________________________________________________________
_______________________________________________________________
9. Name and title of person(s) able to answer any technical questions regardinginformation provided in this form (please also include their phone numbers and e-mailaddresses):_____________________________________________________________________
_____________________________________________________________________
_____________________________________________________________________
_____________________________________________________________
Plant History
10. Date of initial plant construction:
___________________________________________________________________
11. Using table A-1, provide a list of units, the dates of construction of each unit andprojected dates of retirement of each unit at this facility.
12. In table A-2, list major modifications since initial start-up (i.e. changes resulting in a ±5% change in unit output).
Fuels and Residues
13. In table A-3, indicate the type of coal that is primarily utilized at each unit, its sourceand the amount burned during the 365 days prior to the completion of this form.Please indicate if coal mixing is occurring, or if different coals are fired sequentially.
14. In table A-4, provide proximate and ultimate analyses, heating value and mercury(Hg) content of the coal type identified in question 13 that is primarily utilized at eachunit. (Proximate analysis is defined as the determination of moisture, volatile matter,and ash, and the calculation of fixed carbon by difference. Ultimate analysis from adried sample is defined as the determination of carbon, hydrogen, sulphur, nitrogenand ash, and the calculation of oxygen by difference.) Also indicate the coal type forwhich the unit performance is optimized if different from coal currently combusted.
15. Using table A-5, describe fly ash and bottom ash disposal methods and provide theamount of ash generated at each unit for this year (over the 365 days prior to thecompletion of this form).

UDCP Appendix A 3
Power Generation
16. In table A-6, describe the type of boiler operating at each unit.
17. In table A-7, provide the current capacity and the net electricity generated annually forthe period 1995-2002.
Process and Control Equipment Description
18. Using the format shown in figures 1 though 4, provide a diagram which shows thegeneral equipment configuration at each unit at this facility.
19. Using table A-8, describe the air pollution control systems at each unit. List standardoperating parameters and ranges. Indicate the maximum efficiency of these unitsand the typical operating efficiency.
20. In table A-9, indicate if there is physical space available to add additional air pollution
control systems for the units at this facility. 21. In table A-10, Describe any additional operations which may affect pollution
emissions (e.g., coal cleaning by supplier or on-site, reject separation)
Emissions
22. Using table A-11, indicate annual stack emissions of SO2, NOX, particulate matter(PM) and mercury (Hg) for each unit at this facility for the period from 1995 to 2002.
23. Please indicate the facility-specific identification number used for reporting to the
National Pollutant Release Inventory (NPRI).
NPRI ID: __________________________

UDCP Appendix A 4
Table A-1: Unit Life span
Facility Name _____________________________________________
Unit ID Date of Construction Projected Date ofRetirement

UDCP Appendix A 5
Table A-2: Major Plant Modifications
Facility Name _____________________________________________
Unit ID Nature of Modification Year of modification Change in rated output(Mwe)

UDCP Appendix A 6
Table A-3: Primary coal type burned at each unit, source and annual amountburned (complete table 4 for each unit at this facility)
Facility Name _____________________________________________
Unit ID______________
Coal Type Coal Source (e.g., Country,Province, seam, mine mouth
or shipment, etc.)
Tonnes of Coal Burned ThisYear (365 days prior tocompletion of this form)
lignite
waste lignite
sub bituminous
waste sub bituminous
bituminous
waste bituminous (gob)
anthracite
waste anthracite (culm)
blend
lignite % ___________________
waste lignite % ______________
sub bituminous % ____________
waste sub bituminous % ______
bituminous %_______________
waste bituminous (gob) %______
anthracite %_________________
waste anthracite (culm) %______
other - specify__________________________________________________________________________________________________________________________________________________________________
Note: if different coals are used, please describe if they are mixed or firedsequentially:____________________________________________________________________________________________________________________________________________________________________________________________________________________________________________________________________________________________________________________________________________________________

UDCP Appendix A 7
Table A-4: Characteristics of the primary coal type burned at each unit, and coaltype for which the unit performance is optimized (complete table 5 for each unit atthis facility)
Facility Name _____________________________________________
Unit ID______________
Proximate Analysis of Primary Coal Type BurnedComponent Weight (%)
Moisture
Volatile Matter
Fixed Carbon
Ash
Total/100
Ultimate Analysis of Primary Coal Type BurnedComponent Dry Weight (%)
Moisture
Carbon
Hydrogen
Sulphur
Nitrogen
Oxygen
Ash
Total/100
Higher Heating Value (HHV) ofPrimary Coal Type Burned
(MJ/kg)
Hg Content (PPM) of Primary CoalType Burned
Is the performance of thisunit optimized for the above
coal type ? (yes or no)
If the performance at this unit is notoptimized for the above coal type, indicate
the optimal coal type

UDCP Appendix A 8
Table A-5: Ash disposal methods and amount generated this year (365 days priorto completion of this form) - complete table 6 for each unit at this facility
Facility Name _____________________________________________
Unit ID______________
Ash Total TonnesGenerated during the365 days prior to the
completion of this form
Disposal Method andAmount (tonnes)
Wet Dry
Amount Sent for Gypsum orOther Recovery Process
Process Tonnes
Fly Ash
Bottom Ash

UDCP Appendix A 9
Table A-6: Boiler type at each unit
Facility Name _____________________________________________
Unit ID Boiler ID Type1 of Boiler
1 Examples: tangential-fired; cyclone; wall-fired; fluidized bed combustion (FBC)

UDCP Appendix A 10
Table A-7: Unit capacity and net electrical generation
Facility Name _____________________________________________
Unit ID UnitCapacity(MWe)
1995(GWh)
1996(GWh)
1997(GWh)
1998(GWh)
1999(GWh)
2000(GWh)
2001(GWh)
2002(GWh)

UDCP Appendix A 11
Table A-8: Pollution control devices present at each unit (complete table 9 for each unit at this facility)
Facility Name _____________________________________________
Unit ID______________
Type of NOx
Control 1Standard Operating
Parameter and RangeStandard Operating
Parameter and RangeMaximum Efficiency Typical Operating
Efficiency
Type of SO2
Control 2Standard OperatingParameter and Range
Standard OperatingParameter and Range
Maximum Efficiency Typical OperatingEfficiency
Type of ParticulateMatter Control 3
Standard OperatingParameter and Range
Standard OperatingParameter and Range
Maximum Efficiency Typical OperatingEfficiency
1 Examples: low-NOx burners; selective catalytic reduction (SCR); selective non-catalytic reduction (SNCR)2 Examples: wet flue gas desulphurization (FGD; any type); dry scrubbing (any type); compliance (low sulphur) coal; FBC (any type)3 Examples: fabric filter; cold-side electrostatic precipitator (ESP); hot-side ESP; cyclone

UDCP Appendix A 12
Table A-9: Space availability for additional air pollution control systems
Facility Name _____________________________________________
Unit ID Describe availability of physical space to add additional air pollution control systems

UDCP Appendix A 13
Table A-10: Additional operations which may affect pollution emissions
Facility Name _____________________________________________
Operations

UDCP Appendix A 14
Table A-11: Annual stack pollutant emissions from each unit (complete table 12 for each unit at this facility)
Facility Name _____________________________________________
Unit ID______________
Pollutant 1995 (tonnes) 1996(tonnes)
1997(tonnes)
1998(tonnes)
1999(tonnes)
2000(tonnes)
2001(tonnes)
2002(tonnes)
SO2
NOX
PM
Hg(Total)

Figure 1
Plant Configuration 1 Facility Name Unit # MWe
Unit # MWeUnit # MWeUnit # MWe
INSTRUCTIONS:1. Plant may submit own diagram, if available, or may use this diagram.2. Plant may submit more than one diagram.3. Components not installed at plant should be deleted from this diagram. 4. Components installed at plant but not shown here should be added to this diagram.5. Indicate on this diagram where sampling ports exist or are required for solid, liquid and air streams.6. Indicate on this diagram the lengths and cross-sectional dimensions of ducting at existing or required sampling locations. 15
CoalPile
CoalCrusher
&Dryer
SCR
Bottom Ash
HopperAsh
Burners
SNCRInjection
Pulverizer
CoalSilo
Ash
AirPreheater
UDCP Appendix A

16
WetFGD
Stack
DryFGD
FGDWaste
I.D.Fan
ESP
FabricFilter
Cyclone
Ash Silo
FGD WasteTreatment
Byproductor Sludge
Wastewater
UDCP Appendix A

Figure 2Plant Configuration 2 Facility Name: Unit # MWe
Unit # MWeUnit # MWeUnit # MWe
INSTRUCTIONS:1. Plant may submit own diagram, if available, or may use this diagram.2. Plant may submit more than one diagram.3. Components not installed at plant should be deleted from this diagram. 4. Components installed at plant but not shown here should be added to this diagram.5. Indicate on this diagram where sampling ports exist or are required for solid, liquid and air streams.6. Indicate on this diagram the lengths and cross-sectional dimensions of ducting at existing or required sampling locations. 17
Bottom Ash
CoalPile
Crusher &Dryer
CoalSilo
Boiler
Hopper Ash
Unit # ____
_____ MWe
CycloneSCRAir
Preheater
Ash
DryFGD
FGD Waste
CoalSilo
Hopper Ash
Boiler
Unit # ____
_____ MWe
CycloneSCRAir
Preheater
Ash
DryFGD
FGD Waste
UDCP Appendix A

18
AshSilo
FGD WasteTreatment
Wastewater
Byproductor Sludge
StackWetFGD
I.D.Fan
FabricFilter
ESPCyclone
StackWetFGD
I.D.Fan
FabricFilter
ESPCyclone
UDCP Appendix A

Figure 3Plant Configuration 3 Facility Name: Unit # MWe
Unit # MWeUnit # MWeUnit # MWe
INSTRUCTIONS:1. Plant may submit own diagram, if available, or may use this diagram.2. Plant may submit more than one diagram.3. Components not installed at plant should be deleted from this diagram. 4. Components installed at plant but not shown here should be added to this diagram.5. Indicate on this diagram where sampling ports exist or are required for solid, liquid and air streams.6. Indicate on this diagram the lengths and cross-sectional dimensions of ducting at existing or required sampling locations. 19
CoalPile
Crusher &Dryer
BoilerCoalSilo
BoilerCoalSilo
Bottom Ash
Hopper Ash
Hopper Ash
SCRAir
Preheater
Ash
DryFGD
FGD Waste
SCR
Ash
AirPreheater
FGD Waste
DryFGD
UDCP Appendix A

20
WetFGD
I.D.Fan
FabricFilter
ESPCyclone
WetFGD
I.D.FanCyclone
AshSilo
FGD WasteTreatment
FGD Waste
ESPFabricFilter
FGD Waste
UDCP Appendix A

NOTE:Indicate if the two (or more) unitsshare a common flue within the stack or if each unit has its ownflue within the stack.
21
Stack
Wastewater
Byproductor Sludge
UDCP Appendix A

Figure 4Plant Configuration 4 Facility Name: Unit # MWe
Unit # MWeUnit # MWeUnit # MWe
INSTRUCTIONS:1. Plant may submit own diagram, if available, or may use this diagram.2. Plant may submit more than one diagram.3. Components not installed at plant should be deleted from this diagram. 4. Components installed at plant but not shown here should be added to this diagram.5. Indicate on this diagram where sampling ports exist or are required for solid, liquid and air streams.6. Indicate on this diagram the lengths and cross-sectional dimensions of ducting at existing or required sampling locations. 22
CoalPile
Crusher &Dryer
CoalSilo
CoalSilo
Boiler
Boiler
Bottom Ash
Hopper Ash
Hopper Ash
SCRAir
Preheater
Ash
DryFGD
FGD Waste
UDCP Appendix A

23
FGD WasteTreatment
StackI.D.Fan
Cyclone
AshSilo
ESPFabricFilter
FGD Waste
WetFGD
Wastewater
Byproductor Sludge
UDCP Appendix A

UDCP Appendix B 1
The Canadian Uniform Data Collection Program (UDCP) for Mercury from
Coal-Fired Electric Power Generation
APPENDIX B: Preparation of Site-Specific Test Plans for the Coal,
Ash and Residue Sampling and Analysis Program
Preface
The main purpose of the site-specific test plan is determine whether the sampling will meet theobjectives of the “The Canadian Uniform Data Collection Program (UDCP) for Mercury fromCoal-fired Electric Power Generation”. The test plan will demonstrate that the sampling entityunderstands the sampling and analytical methods and has an approach that will be consistentwith the national objectives and requirements. As numerous sources will be sampled under theUDCP, it is essential to adopt a consistent approach that will result in coal, ash and residue datathat is consistent, compatible and comparable.
This document is an outline of the format for site-specific test plans for coal, ash and residuessampling and analysis that are to be submitted as part of the UDCP . A reasonable amount oftime will be provided for the consultant/company to prepare the plan. A test plan does notnecessarily have to be lengthy to be effective.
UDCP Appendix B 2
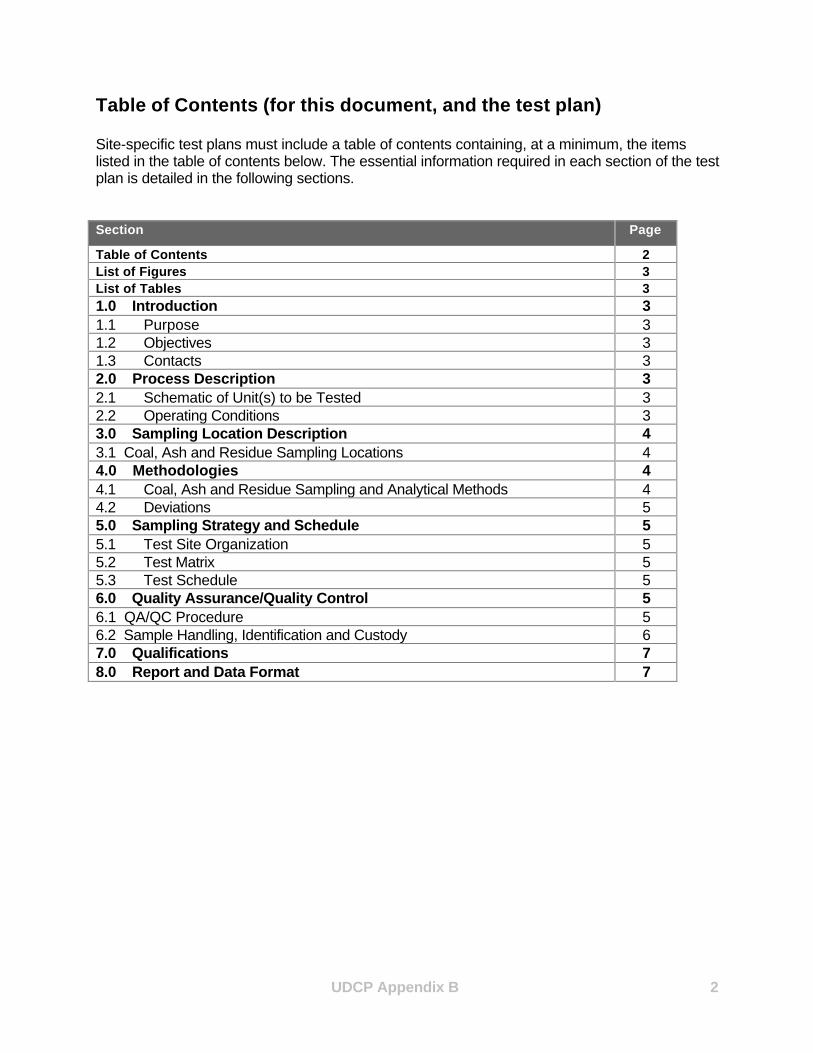
Table of Contents (for this document, and the test plan)
Site-specific test plans must include a table of contents containing, at a minimum, the itemslisted in the table of contents below. The essential information required in each section of the testplan is detailed in the following sections.
Section Page
Table of Contents 2List of Figures 3List of Tables 31.0 Introduction 31.1 Purpose 31.2 Objectives 31.3 Contacts 32.0 Process Description 32.1 Schematic of Unit(s) to be Tested 32.2 Operating Conditions 33.0 Sampling Location Description 43.1 Coal, Ash and Residue Sampling Locations 44.0 Methodologies 44.1 Coal, Ash and Residue Sampling and Analytical Methods 44.2 Deviations 55.0 Sampling Strategy and Schedule 55.1 Test Site Organization 55.2 Test Matrix 55.3 Test Schedule 56.0 Quality Assurance/Quality Control 56.1 QA/QC Procedure 56.2 Sample Handling, Identification and Custody 67.0 Qualifications 78.0 Report and Data Format 7

UDCP Appendix B 3
List of FiguresIn this section, list the figures appearing throughout the test plan.
List of TablesList the tables appearing throughout the test plan in this section.
1.0 Introduction
1.1 Purpose
In this section, provide a brief description of the facility and the purpose for the test program.
1.1 Objectives
In this section of the test plan, provide an overview of the facility test program and generatingunits to be tested. List the specific objectives and core components of the test program.
1.1 Contacts
In this section, list the key contacts (individuals/organizations) for the actual testing program. Asa minimum, the contacts should include individual(s) from the company, the sampling consultantand the laboratory(s) performing the analyses. Contacts should be individuals in positions ofauthority and responsibility.
2.0 Process Description
2.1 Schematic of Unit(s) to be Tested
This area should include a detailed diagram for each unit(s) to be tested. In the diagrams, tracethe processes from beginning to end, identifying major operations and equipment. Show onlythose flow streams that relate to the coal and residues sampling and analysis. (Please note:utilities may wish to prepare this diagram with sufficient detail to be included in both UDCP Part IIand Part III test plans.)
2.2 Operating Conditions
For the unit(s) to be tested, describe process operating conditions, key parameters and standardoperating ranges, control devices and operating schedules. Process operation should includeoperating conditions such as feed rates and materials, firing rates and fuels, temperatures,pressures, production rates, by-products, etc. Other process information should include theoperating schedule (24 hours/day, 7 days per week, etc). Information on process operation willhelp to determine the sampling schedules and will also help to flag any potential conflicts insampling timetables. Any maintenance completed on the process or control equipment shouldbe identified. Steady process operation is also very important during the emission testing.(Please note: utilities may wish to prepare this section with sufficient detail to be utilized for bothUDCP Part II and Part III test plans.)

UDCP Appendix B 4
3.0 Sampling Location Description
3.1 Coal, Ash and Residue Sampling Locations
A detailed description and diagram is required for each sampling location. Information shouldinclude:
• description of sampling locations• access to the sampling site• modifications, if any, that will be undertaken to facilitate sampling• discussion of the representativeness of each sampling location
4.0 Methodologies 4.1 Coal, Ash and Residues Sampling and Analytical Methods Describe the methods to be used for coal, ash and residues sampling and analysis. Adescription of the equipment and reagents, which can be inserted in the Appendix, should alsobe included. 4.2 Deviations The program manager must approve, in advance, any proposed deviations from the prescribedmethods. Although deviations may be unavoidable, they are discouraged as much as possible.It is critical that deviations are considered before the survey for the following reasons: • To allow enough time to investigate the impact on sample representativeness• To permit the consultant to take corrective action when a deviation is not approved.
5.0 Sampling Strategy and Schedule
5.1 Test Site Organization
Prepare a table showing the key tasks to be undertaken as part of the sampling program and thetask leaders. In addition, prepare a table that lists sampling team assignments andresponsibilities.
5.2 Test Matrix
Prepare a table with the following information:• sampling locations• sampling method• analytical method• analytical laboratory
5.3 Test Schedule
For each of the generating units being tested, describe the testing timeframes and schedules.

UDCP Appendix B 5
6.0 Quality Assurance/Quality Control
6.1 QA/QC Procedure
It is assumed that, where utilities have indicated they will follow one of the prescribed ASTM orEPA methods, they will also adhere to the corresponding quality assurance/quality controlrequirements of the standards. Where alternative procedures are proposed, however, the site-specific test plan must include information on all quality assurance and quality control (QA/QC)measures and procedures for the sampling program. This would typically include, but is notlimited to, the following:
• Measures taken to avoid sample contamination such as pre-cleaning of the samplecontainers, reagent purity, proofing and handling of equipment in the field.
• Summary of acceptance criteria, control limits and corrective action• Discussion of special QC procedures• Data reduction techniques.• Procedures for addressing and correcting problems in the field.• External quality assurance and performance audits (control and reference materials).• QC checklists must be included and can be added as an Appendix to the Test Plan.
6.2 Sample Handling, Identification and Custody
Provide a description of measures to maintain sample integrity such as sample identification andlabelling, preservation of samples, container type, storage method, recovery facilities and chain-of-custody and tracking procedures. Provide details such as the names of person(s) responsiblefor handling and identifying samples. Also, sample log sheets and chain of custody formsshould be included in an Appendix to the report.
7.0 Qualifications
As part of the test plan, describe the sampling team’s and the analysis team’s corporate historyand experience and the qualifications of the staff participating in the emissions sampling andanalysis.
8.0 Data Reporting and Format
Describe the manner in which the facility plans on submitting coal, ash and residues data inaccordance with Part II of the UDCP. A potential reporting format is described in Appendix D.

UDCP Appendix C 1
The Canadian Uniform Data Collection Program (UDCP) for Mercury from
Coal-Fired Electric Power Generation
APPENDIX C: Laboratory Verification and Round Robin Testing
1.0 Background
The development of a credible mercury inventory requires that the accuracy and limits ofdetection of coal mercury analysis are known. Accordingly, the round robin component of theprogram seeks to:
• assess the proficiency of candidate laboratories in determining the mercury content in coaland ash samples,
• provide quality assurance for data gathered as part of the UDCP; and• determine mercury and chlorine contents for coals and ash commonly found in Canadian
electric power generating facilities.
This work will complement subsequent stack testing and solids sampling program componentsof the program.
2.0 Program Description In order to improve mercury analysis and measurement, the program is using a two-stageapproach. Broadly speaking, Phase I seeks to conduct a round-robin assessment oflaboratories within Canada while Phase II will provide on-going quality assurance for the durationof this two-year data collection program as well as benchmark selected coals for mercury,chlorine and other coal-specific properties. Approved methodologies for mercury and chlorine analysis are described in Section 3.2.2 of theUDCP. It is anticipated that Phase I will require six months to complete. Well-characterized coal andash reference materials will be sent to candidate laboratories for analysis of specific chemicalcharacteristics, including, but not limited to: mercury; total chlorine; sulphur; moisture content;total carbon in ash. The results will be reviewed statistically to determine each lab’s individualability to analyze the necessary parameters in specific coals and ashes, the appropriateness oftheir respective methods for mercury determination, and their limits of detection. A prioritized listof the candidate labs with specific reference to their ability to analyze mercury and chlorine willthen be compiled. Phase II will provide two important components to the project: ongoing quality control and qualityassurance for the duration of the UDCP and the opportunity to measure the mercury andchlorine concentrations of coal and ash commonly found in Canadian power generation. DuringPhase II, coal and ash sample suites will be sent quarterly for analysis to the laboratoriesapproved in Phase I, as well as others who routinely participate in the Coal and Ash Sample

UDCP Appendix C 2
Proficiency Exchange (CANSPEX) (or equivalent) program. Again, part of the sample suite willconsist of reference coals, similar to Phase I, that will be used to provide an on-going measureof laboratory performance. Utilities will also have the opportunity to nominate additional samplesthat, as mentioned, would be representative of coal and ash commonly found in Canadianoperations. Results from the broader CANSPEX (or equivalent) network should provide a goodstatistical population from which to estimate mercury and chlorine contents in these coals. Formore information on the CANSPEX program, please see http://www.qai-online.com/CANSPEX.PDF.
3.0 Deliverables The project is estimated to require 6 months to complete Phase I and an additional 18 months tocomplete Phase II. The deliverables from this project will be: • quarterly progress update reports,• an interim report on Phase I, detailing the performance: multiple and single lab precision,
recovery, lower quantitative limits, flexibility and economics, and• a final report with statistical data on their performance as individuals and as a collective for
both Phases, as well as a report on the benchmarking of the sampled coals used in Canada.
It is recommended that this program element begin in August, 2002 in order to identify suitablelaboratories for the sampling and analysis data collection program.
The total cost of this contract will be based on the number of participating laboratories.

The Canadian Uniform Data Collection Program (UDCP) for Mercury from Coal-Fired Power Generation
APPENDIX D: Data Fields for the Coal, Ash and Residue Sampling and Analysis Program
Field Header Field Description1-8: Identification of the plant, its generating units and the sample period 1 Company Name The name of the electricity generating company
2 Plant Name The name of the plant.3 Street The street address of the plant4 City / Town The city / town of the plant5 Province The province of the plant
6 Unit #The unit for which coal / ash samples are taken(All units at this plant are to be sampled and analyzed.)
7 Sample Period The week for which sampling has occurred to obtain the composite samples described below.
8 Unit Production Unit production (MWh) for the sample period
9-49: Identification of the fuel / fuel blend burned in each generating unit for the sample period 9 Fuel Type 1 The primary coal / fuel burned.
10 Fuel Type 1 % The percentage of fuel type 1 in this sample.11 Coalfield 1 The coalfield from which fuel type 1 is derived12 Mine / Other 1 Name of mine or other location identification for fuel type 113 Seam 1 The coal seam for which the fuel type 1 weekly sample is applicable (if available)14 Supplier 1 Name of fuel type 1 supplier15 Street 1 Street address of fuel type 1 supplier16 City 1 City of fuel type 1 supplier17 P / S 1 Province / State of fuel type 1 supplier18 PC / ZC 1 Postal Code / Zip Code of fuel type 1 supplier19 Country 1 Country of fuel type 1 supplier
20 Fuel Type 2 The secondary coal / fuel burned. (if applicable) 21 Fuel Type 2 % The percentage of fuel type 2 in this sample22 Coalfield 2 The coalfield from which fuel type 2 is derived23 Mine / Other 2 Name of mine or other location identification for fuel type 224 Seam 2 The coal seam for which the fuel type 2 weekly sample is applicable (if available)25 Supplier 2 Name of fuel type 2 supplier
UDCP Appendix D
1

26 Street 2 Street address of fuel type 2 supplier27 City 2 City of fuel type 2 supplier28 P / S 2 Province / State of fuel type 2 supplier29 PC / ZC 2 Postal Code / Zip Code of fuel type 2 supplier30 Country 2 Country of fuel type 2 supplier
31 Fuel Type 3 The tertiary coal / fuel burned. (if applicable) 32 Fuel Type 3 % The percentage of fuel type 3 in this sample33 Coalfield 3 The coalfield from which fuel type 3 is derived34 Mine / Other 3 Name of mine or other location identification for fuel type 335 Seam 3 The coal seam for which the fuel type 3 weekly sample is applicable (if available)36 Supplier 3 Name of fuel type 3 supplier37 Street 3 Street address of fuel type 3 supplier38 City 3 City of fuel type 3 supplier39 P / S 3 Province / State of fuel type 3 supplier40 PC / ZC 3 Postal Code / Zip Code of fuel type 3 supplier41 Country 3 Country of fuel type 3 supplier
42 Other Additives Other significant substances added to fuels, eg. limestone, SO2 sorbents43 Mine Name of mine or other location identification for the sorbent44 Supplier Name of additive supplier45 Street Street address of additive supplier46 City City of additive supplier47 P / S Province / State of additive supplier48 PC / ZC Postal Code / Zip Code of additive supplier49 Country Country of additive supplier
50-66: Fuel sampling and analyses 50 Fuel Sample IDThe sample ID is the analysis number that is used to identify the as-burned coal / fuel sample as it is analyzed by the testing laboratory.
51 Fuel consumption The fuel use for the period (Kg )52 Sulfur Fuel The total sulfur content of the fuel sample, by percentage (by weight, dry basis).
53 MJ/kg FuelThe higher heating value of the fuel sample, in megajoules per kilogram (MJ/kg - dry basis).
54 Ash Fuel The ash content of the fuel sample, by percentage (by weight).55 Ash Fuel Dry The ash content of the fuel sample, by percentage (by weight, dry basis).56 Moisture Fuel The moisture content (by weight) of the fuel sample, by percentage.
57 Mercury FuelThe mercury content of the fuel sample, in ppm (dry basis) or ND if below detection limits.
Chlorine FuelThe chlorine content of the coal / fuel sample, in ppm (dry basis) or ND if below detection limits.
58 VM Fuel The volatile matter content (weight) of the coal/fuel sample, by percentage 59 Fixed Carbon Fuel The fixed carbon content (weight) of the coal/fuel sample (by percent)60 Dry Carbon Fuel The carbon content of the coal/fuel sample (by percent, dry weight)
UDCP Appendix D
2

61 Hydrogen Fuel The hydrogen content of the coal/fuel sample (by percent, dry weight)62 Oxygen Fuel The oxygen content of the coal/fuel sample (by percent, dry weight)63 Nitrogen Fuel The nitrogen content of the coal/fuel sample (by percent, dry weight)
64 Obtain M FuelThe specific method(s) used by the electric utility company to obtain the coal/fuel sample (e.g., ASTM...).
65 Prepare M FuelThe specific method(s) used by the testing laboratory to prepare the coal / fuel sample for analysis of mercury (e.g., ASTM...).
66 Analysis M FuelThe specific method used by the testing laboratory to analyze the coal / fuel sample for mercury (e.g., EPA Method...).
67-77: Coal rejects sampling and analyses 67 Rejects Sample ID
The sample ID is the analysis number that is used to identify the coal rejects sample as it is analyzed by the testing laboratory.
68 Rejects Production The total rejects generated, and represented by this sample, during the sampling period (Kg)
69 Sulfur Rejects The total sulfur content of the coal rejects sample, by percentage (dry basis).
70 MJ/kg RejectsThe higher heating value of the coal rejects sample, in megajoules per kilogram (MJ/kg - dry basis).
71 Ash Rejects The ash content of the coal rejects sample, by percentage (dry basis).72 Moisture Rejects The moisture content of the coal rejects sample, by percentage.
73 Mercury RejectsThe mercury content of the coal rejects sample, in ppm (dry basis) or ND if below detection limit.
74 Chlorine RejectsThe chlorine content of the coal rejects sample, in ppm (dry basis) or ND if below detection limit.
75 Obtain M RejectsThe specific method(s) used by the electric utility company to obtain the coal rejects sample (e.g., ASTM...).
76 Prepare M RejectsThe specific method(s) used by the testing laboratory to prepare the coal rejects sample for analysis of mercury (e.g., ASTM...).
77 Analysis M RejectsThe specific method used by the testing laboratory to analyze the coal rejects sample for mercury (e.g., EPA Method...).
78-87: Fly ash sampling and analysis 78 F-Ash Sample IDThe sample ID is the analysis number that is used to identify the fly ash sample as it is analyzed by the testing laboratory.
79 Amount of F-AshThe amount of fly ash generated, and represented by this sample, during the sampling period (Kg)
80 Mercury F-AshThe mercury content of the fly ash sample, in ppm (dry basis) or ND if below detection limit.
81 Carbon F-Ash The unburned carbon content of the fly ash, by percentage
UDCP Appendix D
3

82 Chlorine F-AshThe chlorine content of the fly ash sample, in ppm (dry basis) or ND if below detection limit.
83 Sulphur F-Ash The total sulphur content of the fly ash sample, by percentage (dry basis).84 Moisture F-Ash The moisture content of the fly ash sample, by percentage.
85 Obtain M F-AshThe specific method(s) used by the electric utility company to obtain the fly ash sample (e.g., ASTM...).
86 Prepare M F-AshThe specific method(s) used by the testing laboratory to prepare the fly ash sample for analysis of mercury and LOI (e.g., ASTM...).
87 Analysis M F-AshThe specific method used by the testing laboratory to analyze the fly ash sample for mercury and LOI (e.g., EPA Method...).
88-97: Bottom ash sampling and analyses 88 B-Ash Sample ID
The sample ID is the analysis number that is used to identify the bottom-ash sample as it is analyzed by the testing laboratory.
89B-Ash Production Rate
The amount of bottom ash generated, and represented by this sample, during the sampling period (Kg)
90 Mercury B-AshThe mercury content of the bottom ash sample, in ppm (dry basis) or ND if below detection limit.
91 Carbon B- Ash The unburned carbon content of the bottom ash, by percentage
92 Chlorine B- AshThe chlorine content of the bottom ash sample, in ppm (dry basis) or ND if below detection limit.
93 Sulphur B-Ash The total sulphur content of the bottom ash sample, by percentage (dry basis).94 Moisture B-Ash The moisture content of the bottom ash sample, by percentage.
95 Obtain M B-AshThe specific method(s) used by the electric utility company to obtain the bottom ash sample (e.g., ASTM...).
96 Prepare M B-AshThe specific method(s) used by the testing laboratory to prepare the ash sample for analysis of mercury and LOI (e.g., ASTM...).
97 Analysis M B-AshThe specific method used by the testing laboratory to analyze the bottom ash sample for mercury and LOI (e.g., EPA Method...).
98-99: These fields can be used to record useful information. 98 Acc-Prec Hg
Information on any evidence of accuracy and precision of analysis for mercury in fuel, rejects and ash can be entered here.
99 Notes Any other useful notes about these analyses can be entered here.
100-123: Identification of the laboratory(ies) that performed the analyses and the aspects of the analyses performed by each lab. 100 Laboratory 1 Name of first laboratory performing analyses
101 Approved Is this a UDCP approved laboratory?102 Analyses 1 What elements of the analyses were carried out at laboratory 1?103 Street L1 Street address of laboratory 1104 City L1 City of laboratory 1105 P / S L1 Province / State of laboratory 1106 PC / ZC L1 Postal Code / Zip Code of laboratory 1
UDCP Appendix D
4

107 Country L1 Country of laboratory 1
108 Laboratory 2 Name of second laboratory performing analyses (if applicable)109 Approved Is this a UDCP approved laboratory?110 Analyses 2 What elements of the analyses were carried out at laboratory 2?111 Street L2 Street address of laboratory 2112 City L2 City of laboratory 2113 P / S L2 Province / State of laboratory 2114 PC / ZC L2 Postal Code / Zip Code of laboratory 2115 Country L2 Country of laboratory 2
116 Laboratory 3 Name of third laboratory performing analyses (if applicable)117 Approval Is this a UDCP approved laboratory?118 Analyses 3 What elements of the analyses were carried out at laboratory 3?119 Street L3 Street address of laboratory 3120 City L3 City of laboratory 3121 P / S L3 Province / State of laboratory 3122 PC / ZC L3 Postal Code / Zip Code of laboratory 3123 Country L3 Country of laboratory 3
UDCP Appendix D
5

UDCP Appendix E 1
The Canadian Uniform Data Collection Program (UDCP) for Mercury from
Coal-Fired Electric Power Generation
APPENDIX E: Preparation of Site-Specific Test Plans for the Air
Emissions Testing Program
Preface
The main purpose of the site-specific test plan is to determine whether the sampling will meetthe objectives of the “The Canadian Uniform Data Collection Program (UDCP) for Mercury fromCoal-fired Electric Power Generation”. The test plan will demonstrate that the sampling entityunderstands the sampling and analytical methods and has an approach that will be consistentwith the national objectives and requirements. As numerous sources will be sampled under theUDCP, it is essential to adopt a consistent approach that will result in emission data that isconsistent, compatible and comparable.
A requirement of the UDCP emission testing program is the collection of sufficient data to allowmercury mass balances to be performed, thereby providing a powerful QA/QC tool forassessing the success of the flue gas sampling. Details of this requirement are included anddiscussed in this Appendix.
This document is an outline of the format for site-specific test plans for flue gas sampling andanalysis that are to be submitted as part of the UDCP. A reasonable amount of time will beprovided for the consultant/company to prepare the test plan. A test plan does not necessarilyhave to be lengthy to be effective.

UDCP Appendix E 2
Table of Contents (for this document, and the test plan)
Site-specific test plans must include a table of contents containing, at a minimum, the itemslisted in the table of contents below. The essential information required in each section of the testplan is detailed in the following sections.
Section PageTable of Contents 2List of Figures 3List of Tables 31.0 Introduction 31.1 Purpose 31.2 Objectives 31.3 Contacts 32.0 Process Description 32.1 Schematic of Unit(s) to be Tested 32.2 Operating Conditions 33.0 Sampling Location Description 33.1 Flue Gas Sampling Locations 33.2 Coal, Ash and Residue Sampling Locations 44.0 Methodologies 44.1 Flue Gas Sampling and Analytical Methods 44.2 Coal, Ash and Residue Sampling and Analytical Methods 44.3 Deviations 45.0 Sampling Strategy and Schedule 55.1 Test Site Organization 55.2 Test Matrix 55.3 Test Schedule 56.0 Quality Assurance/Quality Control 56.1 QA/QC Procedures 56.2 Sample Handling, Identification and Custody 56.3 Mass Balances 67.0 Qualifications 68.0 Air Emissions Testing Program Report Format 68.1 Test Report Table of Contents 68.2 Format of Data Reporting Tables 88.3 Example Mass Balance Calculation 17

UDCP Appendix E 3
List of FiguresIn this section, list the figures appearing throughout the test plan.
List of TablesList the tables appearing throughout the test plan in this section.
1.0 Introduction
1.1 Purpose
In this section, provide a brief description of the facility and the purpose for the test program.
1.2 Objectives
In this section of the test plan, provide an overview of the facility test program and generatingunits to be tested. List the specific objectives and core components of the test program.
1.3 Contacts
In this section, list the key contacts (individuals/organizations) for the actual testing program. Asa minimum, the contacts should include individual(s) from the company, the sampling consultantand the laboratory(s) performing the analyses. Contacts should be individuals in positions ofauthority and responsibility.
2.0 Process Description
2.1 Schematic of Unit(s) to be Tested
This area should include a detailed diagram for each unit(s) to be tested. In the diagrams, tracethe processes from beginning to end, identifying major operations and equipment. Show onlythose flow streams that relate to the emissions test. (Please note: utilities may wish to preparethis diagram with sufficient detail to be included in both UDCP Part II and Part III test plans.)
2.2 Operating Conditions
For the unit(s) to be tested, describe process operating conditions, key parameters and standardoperating ranges, control devices and operating schedules. Process operation should includeoperating conditions such as feed rates and materials, firing rates and fuels, temperatures,pressures, production rates, by-products, etc. Other process information should include theoperating schedule (24 hours/day, 7 days per week, etc). Information on process operation willhelp to determine the sampling schedules and will also help to flag any potential conflicts insampling timetables. Any maintenance completed on the process or control equipment shouldbe identified. Steady process operation at full load conditions is also very important during theemission testing. (Please note: utilities may wish to prepare this section with sufficient detail tobe included in both UDCP Part II and Part III test plans.)
3.0 Sampling Location Description
3.1 Flue Gas Sampling Locations
Flue gas sampling must be conducted downstream of the last emission control device.Although generally not required, it may be necessary to also sample upstream of the first controldevice. For example, this could be required if suitable samples of the feed coal, along with the

UDCP Appendix E 4
coal feed rate, cannot be obtained. A detailed description and diagram is required for eachsampling location. Information should include:
• duct lengths and cross-sectional• direction of flow• flow disturbances• number and configuration of traverse points• sampling port placement• access to the sampling site• discussion of the representativeness of each sampling location
3.2 Coal, Ash and Residue Sampling Locations
A detailed description and diagram is required for each sampling location. Information shouldinclude:
• description of sampling locations• access to the sampling site• modifications, if any, that will be undertaken to facilitate sampling• discussion of the representativeness of each sampling location
4.0 Methodologies
4.1 Flue Gas Sampling and Analysis Methods
Describe the methods to be used for flue gas sampling and analysis. Include a schematic of thesampling train and a flow diagram or a description of the sample recovery procedure. As aminimum, sampling duration, train configuration, impinger contents, proofing or cleaningprocedures and recovery and partitioning of the samples should be specified in this section. Adescription of the equipment and reagents, which can be inserted in the Appendix, should alsobe included.
4.2 Coal, Ash and Residue Sampling and Analysis
Describe the methods to be used for coal, ash and residues sampling and analysis. Adescription of the equipment and reagents, which can be inserted in the Appendix, should alsobe included. Note that it is essential to sample the coal as close as possible to where its feedrate is being measured, so that a dry basis coal feed rate can be determined (see Section 6.3,Mass Balances).
4.3 Deviations
The program manager must approve, in advance, any proposed deviations from the prescribedmethods. Although deviations may be unavoidable, they are discouraged as much as possible.It is critical that deviations are considered before the survey for the following reasons:
• To allow enough time to investigate the impact of a deviation on the emission results.• To permit the consultant to take corrective action when a deviation is not approved.

UDCP Appendix E 5
5.0 Sampling Strategy and Schedule
5.1 Test Site Organization
Prepare a table showing the key tasks to be undertaken as part of the sampling program and thetask leaders. In addition, prepare a table that lists sampling team assignments andresponsibilities.
5.2 Test Matrix
Prepare a table with the following information:
• sampling locations• number of runs• sampling method• sample run times• analytical methods• analytical laboratory
5.3 Test Schedule
For each of the generating units being tested, describe the testing timeframes and schedules,including a summary of pre-test preparation activities.
6.0 Quality Assurance/Quality Control
6.1 QA/QC Procedures
It is assumed that, where utilities have indicated they will follow the prescribed Ontario HydroMethod, they will also adhere to the corresponding quality assurance/quality control requirementsof that method. Where alternative procedures are proposed, however, the site-specific test planmust include information on all quality assurance and quality control (QA/QC) measures andprocedures for the sampling program. This would typically include, but is not limited to, thefollowing:
• Calibration methods and results for the sampling equipment such as dry gas meters, orificemeters, nozzle diameters, differential pressure gauges and temperature readers. Thecalibration results may be included in the Appendices.
• Measures taken to avoid sample contamination such as pre-cleaning of the glassware,reagent purity, proofing and handling of equipment in the field.
• Listing of blank solutions and trains.• Summary of acceptance criteria, control limits and corrective action• Discussion of special QC procedures, such as those contained in the prescribed Ontario
Hydro Method• Data reduction techniques.• Procedures for addressing and correcting problems in the field.• External quality assurance and performance audits (control and reference materials).• QC checklists must be included and can be added as an Appendix to the Test Plan.
6.2 Sample Handling, Identification and Custody
Provide a description of measures to maintain sample integrity such as sample identification andlabelling, preservation of samples, container type, storage method, recovery facilities and chain-of-custody and tracking procedures. Provide details such as the names of person(s) responsible

UDCP Appendix E 6
for handling and identifying samples. Also, sample log sheets and chain of custody formsshould be included in an Appendix to the report.
6.3 Mass Balances
The UDCP emission testing protocol requires that sufficient data be collected to allow a mercurymass balance to be calculated for each test run. This requires that the mercury input to theboiler in the coal and the mercury retained in the bottom ash and fly ash (and any othersignificant residues) be known, in addition to the measured mercury emissions.
At a minimum, the following data are required to perform these mass balances:
• “As-fired” or “as-weighed” coal feed rate (Mg/hr)• “As-fired” or “as-weighed” coal moisture, to give the dry basis coal feed rate (Mg/hr)• Dry basis mercury (mg/kg) and ash (%) contents of the coal• Dry basis mercury (mg/kg) and carbon (%) contents of the bottom ash and fly ash• A best-estimate of the split between the bottom ash and fly ash fractions• The total mercury emission rate (g/hr)
An example of the mass balance calculations is shown in Section 8.3.
7.0 Qualifications
As part of the test plan, describe the sampling team’s and the analysis team’s corporate historyand experience and the qualifications of the staff participating in the emissions sampling andanalysis.
8.0 Air Emissions Testing Program Report Format
For the purposes of commonality among the various Test Reports, and to facilitate a thorough,accurate and speedy review by the scientific authorities for the UDCP, it is stronglyrecommended that all reports be prepared using the following format. The final mercuryemissions report format is described in the Table of Contents and template Tables on thefollowing pages.
Note: The Site-Specific Test Plans for the UDCP Part III - Air Emissions Testing Program, asdescribed previously in this Appendix, will contain elements which can be used as sections ofthe final test report.
8.1 Test Report Table of Contents
TABLE OF CONTENTS
Letter of Submittal to UDCP Project Manager1.0 INTRODUCTION1.1 Summary of Test Program1.2 Key Personnel and Contact Information
2.0 PLANT AND SAMPLING LOCATION DESCRIPTIONS2.1 Process Description2.2 Control Equipment Description2.3 Flue Gas Sampling Locations
UDCP Appendix E 7
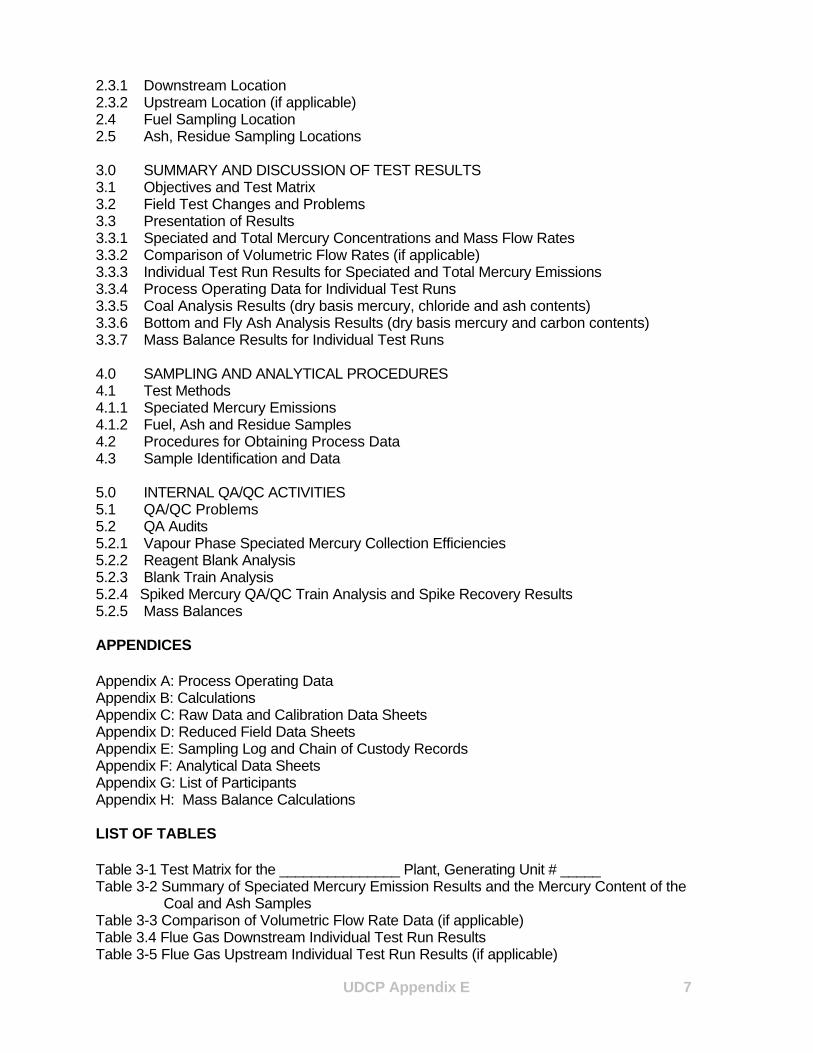
2.3.1 Downstream Location2.3.2 Upstream Location (if applicable)2.4 Fuel Sampling Location2.5 Ash, Residue Sampling Locations
3.0 SUMMARY AND DISCUSSION OF TEST RESULTS3.1 Objectives and Test Matrix3.2 Field Test Changes and Problems3.3 Presentation of Results3.3.1 Speciated and Total Mercury Concentrations and Mass Flow Rates3.3.2 Comparison of Volumetric Flow Rates (if applicable)3.3.3 Individual Test Run Results for Speciated and Total Mercury Emissions3.3.4 Process Operating Data for Individual Test Runs3.3.5 Coal Analysis Results (dry basis mercury, chloride and ash contents)3.3.6 Bottom and Fly Ash Analysis Results (dry basis mercury and carbon contents)3.3.7 Mass Balance Results for Individual Test Runs
4.0 SAMPLING AND ANALYTICAL PROCEDURES4.1 Test Methods4.1.1 Speciated Mercury Emissions4.1.2 Fuel, Ash and Residue Samples4.2 Procedures for Obtaining Process Data4.3 Sample Identification and Data
5.0 INTERNAL QA/QC ACTIVITIES5.1 QA/QC Problems5.2 QA Audits5.2.1 Vapour Phase Speciated Mercury Collection Efficiencies5.2.2 Reagent Blank Analysis5.2.3 Blank Train Analysis5.2.4 Spiked Mercury QA/QC Train Analysis and Spike Recovery Results5.2.5 Mass Balances
APPENDICES
Appendix A: Process Operating DataAppendix B: CalculationsAppendix C: Raw Data and Calibration Data SheetsAppendix D: Reduced Field Data SheetsAppendix E: Sampling Log and Chain of Custody RecordsAppendix F: Analytical Data SheetsAppendix G: List of ParticipantsAppendix H: Mass Balance Calculations
LIST OF TABLES
Table 3-1 Test Matrix for the _______________ Plant, Generating Unit # _____Table 3-2 Summary of Speciated Mercury Emission Results and the Mercury Content of the
Coal and Ash SamplesTable 3-3 Comparison of Volumetric Flow Rate Data (if applicable)Table 3.4 Flue Gas Downstream Individual Test Run ResultsTable 3-5 Flue Gas Upstream Individual Test Run Results (if applicable)

UDCP Appendix E 8
Table 3-6 Coal Usage ResultsTable 3-7 Coal Analysis Results (dry basis mercury, chloride and ash content)Table 3-8 Bottom and Fly Ash Analysis Results (dry basis mercury and carbon content)Table 5-1 Vapour Phase Speciated Mercury Collection EfficienciesTable 5-2 Reagent Blank AnalysisTable 5-3 Blank Train AnalysisTable 5-4 Spiked Mercury QA/QC Train Analysis and Spike Recovery Results
LIST OF FIGURES
Figure 2-1 Schematic of Generating Unit showing Boiler and Pollution Control EquipmentFigure 2-2 Schematic of Downstream Flue Gas Sampling LocationFigure 2-3 Schematic of Upstream Flue Gas Sampling Location (if applicable)Figure 2-4 Equal Area Traverse Points for Round or Rectangular DuctsFigure 4-1 Schematic of the Prescribed Ontario Hydro Method Sampling TrainFigure 4-2 Sample Recovery Scheme for Ontario Hydro Method Samples
8.2 Format of Data Reporting Tables
Table 3-1Test Matrix for the ___________________Plant, Generating Unit # ____
SamplingLocation
No. ofRuns
Parameters SamplingMethod
SampleRun Time(minutes)
AnalyticalMethod
AnalyticalLaboratory
Downstream1 Speciated HgDownstream MoistureDownstream FlowDownstream O2/CO2Upstream2 Speciated HgUpstream MoistureUpstream FlowUpstream O2/CO2Fuel Feed3 Hg, Cl in Fuel
1. Downstream refers to the location after the last pollution control device (usually in thestack).
2. Upstream refers to the location before the first pollution control device. These data will
not normally be required for most emission test programs
3. Fuel Feed refers to “as-fired” or “as-weighed” coal sampling location

UDCP Appendix E 9
Table 3-2Summary of Results
Samplelocation
ElementalMercury
(g/hr)
OxidizedMercury(g/hr)
Particle-boundMercury(g/hr)
Total Mercury
(g/hr)CoalRun 1Run 2Run 3Average
Not Applicable Not Applicable Not Applicable
Bottom AshRun 1Run 2Run 3Average
Not Applicable Not Applicable Not Applicable
Fly AshRun 1Run 2Run 3Average
Not Applicable Not Applicable Not Applicable
Downstream FlueGasRun 1Run 2Run 3Average
Upstream Flue Gas(if applicable)Run 1Run 2Run 3Average

UDCP Appendix E 10
Table 3-3Comparison Of Volumetric Flow Rate Data
Run No.Upstream Downstream CEMS
acm/min scm/min dscm/min
acm/min scm/min dscm/min
scm/min
Run 1Run 2Run 3Average
acm/min – actual cubic metres per minutescm/min – standard cubic metres per minute at 25°C and 101.3 kPadscm/min – dry standard cubic metres per minute at 25°C and 101.3 kPa
Note: Volumetric flow rate is a critical factor in calculating mass flow rates. Ideally, thevolumetric flow rate (corrected to standard pressure and temperature) measured at the inlet tothe pollution control device (upstream) should be the same as that measured at the stack(downstream), which should be the same as that measured by the CEMS. Table 3-3 allows acomparison of flow rates at these three locations. However, the comparisons will not beapplicable if upstream sampling is not required and there are no CEMS in operation.

UDCP Appendix E 11
Table 3-4Downstream Individual Run Results
Test Run Number: 1 2 3 AverageSource ConditionFuel Factor, dscm/109 JDateStart TimeEnd TimeElemental Mercury: µg detected µg/dscm g/hr g/109 JOxidized Mercury: µg detected µg/dscm g/hr g/109 JParticle-bound Mercury: µg detected µg/dscm g/hr g/109 JTotal Downstream Speciated Mercury µg/dscm g/hr g/109 JAverage Gas Volumetric Flow Rate: @ Flue Conditions, acm/min @ Standard conditions, dscm/min Average Gas Temperature, oC Average Gas Velocity, m/s Flue Gas Moisture, % by volume Average Flue Pressure, mm Hg Barometric Pressure, mm Hg Average % CO2 by volume, dry basis Average % O2 by volume, dry basis % Excess Air Dry Molecular Wt. Of Gas, g/g-mole Gas Sample Volume, dscm Isokinetic Variance
acm/min – actual cubic metres per minutedscm – dry standard cubic metres at 25°C and 101.3 kPadscm/min – dry standard cubic metres per minute at 25°C and 101.3 kPa

UDCP Appendix E 12
Table 3-5Upstream Individual Run Results (if applicable)
Test Run Number: 1 2 3 AverageSource ConditionFuel Factor, dscm/109 JDateStart TimeEnd TimeElemental Mercury: µg detected µg/dscm g/hr g/hr (based on outlet dscm/min) g/109 JOxidized Mercury: µg detected µg/dscm g/hr g/hr (based on outlet dscm/min) g/109 JParticle-bound Mercury: µg detected µg/dscm g/hr g/hr (based on outlet dscm/min) g/109 JTotal Upstream Speciated Mercury µg/dscm g/hr g/hr (based on outlet dscm/min) g/109 JAverage Gas Volumetric Flow Rate: @ Flue Conditions, acm/min @ Standard conditions, dscm/min Average Gas Temperature, oC Average Gas Velocity, m/s Flue Gas Moisture, % by volume Average Flue Pressure, mm Hg Barometric Pressure, mm Hg Average % CO2 by volume, dry basis Average % O2 by volume, dry basis % Excess Air Dry Molecular Wt. Of Gas, g/g-mole Gas Sample Volume, dscm Isokinetic Variance
acm/min – actual cubic metres per minutedscm – dry standard cubic metres at 25°C and 101.3 kPadscm/min – dry standard cubic metres per minute at 25°C and 101.3 kPa

UDCP Appendix E 13
Table 3-6Coal Usage Results
Test Run Number: 1 2 3 Average Source Condition Date Start Time End TimeCoal Properties: Carbon, % dry Hydrogen, % dry Nitrogen, % dry Sulphur, % dry Ash, % dry Oxygen, % dry (by difference) Moisture, % Higher Heating Value (HHV), MJ/kg Fd Factor O2 basis, dscm/109 J Fc Factor CO2 basis, scm/109 J Chloride, mg/kg dry Mercury, mg/kg dryCoal Consumption: Coal # 1, Mg/test Coal # 2, Mg/test Coal # 3, Mg/test Total Raw Coal Input, Mg/hr Total Coal Input, Mg/hr dryTotal Mercury Available in Coal: Mercury, g/hr Mercury, g/109 J
scm – standard cubic metres at 25°C and 101.3 kPadscm – dry standard cubic metres at 25°C and 101.3 kPa

UDCP Appendix E 14
Table 3-7Coal Analysis Results (dry basis)
Run No.Moisture
(%)Mercury(mg/kg)
Chloride(mg/kg)
Ash Content(%)
1.2.3.
Average
Coal moistures are for the as-fired or as-weighed samples.
Table 3-8Ash Analysis Results (dry basis)
Run No. Bottom Ash Fly Ash
Mercury (mg/kg) Carbon(%)
Mercury (mg/kg) Carbon(%)
1.2.3.
Average

UDCP Appendix E 15
Table 5-1Collection Efficiencies for Sampled Vapour Phase Mercury
Run No.Impinger Mercury
Detected(µg)
RecoveryPattern
Percent of TotalVapour Phase
Mercury1.
1. KCl2. KCl3. KClTotal Oxidized
%%%
%
4. H2O25. KMnO46. KMnO47. KMnO4Total Elemental
%%%%
%
2.1. KCl2. KCl3. KClTotal Oxidized
%%%
%
4. H2O25. KMnO46. KMnO47. KMnO4Total Elemental
%%%%
%
3.1. KCl2. KCl3. KClTotal Oxidized
%%%
%
4. H2O25. KMnO46. KMnO47. KMnO4Total Elemental
%%%%
%

UDCP Appendix E 16
Table 5-2Reagent Blank
Sample IDSample Fraction Contents Mercury
(µg)Detection Limit
(µg)
Table 5-3Blank Train Mercury Analysis
Container # Sample Fraction Contents Mercury(µg)
Detection Limit(µg)
Table 5-4Spiked Mercury QA/QC Train Analysis and Spike Recovery Results
QA/QC MercuryTrain Impingers
Spiked Quantityof Mercury
(µg)
Quantity ofMercury Found
(µg)
Recovery of Spiked Mercury
IndividualImpingers
Average forSolution Type
1. KCl2. KCl3. KCl
%%%
%
4. H2O2 %%
5. KMnO46. KMnO47. KMnO4
%%%
%
Average Recovery for the Entire QA/QC Train%

UDCP Appendix E 17
8.3 Example Mass Balance Calculation
As-fired (as-weighed) coal feed rate = 250.0 Mg/hrAs-fired (as-weighed) moisture content of the coal = 15.0%Therefore, dry-basis (DB) coal feed rate = 212.5 Mg/hr
Mercury content of the coal (DB) = 0.0750 mg/kgTherefore, inlet mercury mass flow rate = 212.5 x 0.0750
= 15.94 g/hr
Ash content of the coal (DB, carbon-free) = 15.0%Therefore, DB carbon-free ash mass flow rate = 212.5 x 0.15
= 31.88 Mg/hr
DB carbon content of the bottom ash = 5.00%DB carbon content of the fly (ESP) ash = 3.50%
Assuming a split of 25% bottom ash and 75% fly (ESP) ash,then the average carbon content of the total ash = (0.25x5.00) + (0.75x3.50)
= 3.88%
Therefore, total estimated ash mass flow rate, including carbon = 31.88 / 0.9612= 33.16 Mg/hr
At 25% of the total ash, bottom ash mass flow rate = 8.290 Mg/hrBottom ash mercury content (DB) = 0.0050 mg/kgTherefore, mercury mass flow rate released in the bottom ash = 8.290 x 0.0050
= 0.0414 g/hr
At 75% of the total ash, fly (ESP) ash mass flow rate = 24.87 Mg/hrFly (ESP) ash mercury content (DB) = 0.2000 mg/kgTherefore, mercury mass flow rate released in the fly (ESP) ash = 24.87 x 0.2000
= 4.974 g/hr
Therefore, total outlet mercury mass flow rate in the ash = 0.0414 + 4.974= 5.015 g/hr
Mercury emission rate in the flue gas = 9.500 g/hr
Therefore, total outlet mercury mass flow rate = 14.52 g/hr
Therefore, mercury mass balance, outlet versus inlet = 14.52 / 15.94 x 100= 91%
Of this, fraction found in the ash = 31%and fraction found in the flue gas = 60%
Normalized to 100%, fraction found in the ash = 35%and fraction found in the flue gas = 65%-------------------------------------------------------------------------------------------------------------------------Note: The data used in the above calculations are somewhat typical but are entirely fictional

The Canadian Uniform Data Collection Program (UDCP) for Mercury fromCoal-fired Electric Power Generation
APPENDIX F: Measurement Of Speciated Mercury Emissions InStack Gas From Coal-Fired Electric Power Generating Stations:
The Ontario Hydro Method
Prepared for the:
Canadian Uniform Data Collection Program
By:
Curtis Environmental Consulting
January 2003

UDCP Appendix F i
Foreword
The stack gas sampling method described in this report is to be used for thedetermination of the concentrations and emission rates of the different chemical forms ofmercury emitted from coal-fired electric power generating stations. The complexity of theprocedure warrants that personnel performing the tests be trained and experienced in itsuse.
This version of the method is based on the original Ontario Hydro Methoddeveloped for measuring speciated mercury emissions (1). Precision and bias data forthe method are based on US EPA Method 301 validation studies performed at theUniversity of North Dakota on behalf of the US DOE and the US EPA (2). A modifiedversion of the Ontario Hydro method has been published as an ASTM Standard (3) and isalso presently listed as a US EPA Preliminary method (4).
Analytical procedures for the determination of mercury in the collected samples arenot included in this document. The sample recovery procedure of the method results inimpinger samples that a reputable laboratory should be able to analyze by standardCVAAS or CVAFS techniques for determining mercury in water samples. Similarly, thedetermination of the mercury content of particulate matter samples should pose noproblems for most laboratories using standard analysis techniques. For further informationregarding these analytical methods, refer to either of the ASTM or US EPA proceduresreferenced above, where they are fully documented.
It is recognized that this method has not been peer reviewed and may containinconsistencies, errors, omissions or other points requiring clarification. All such requestsfor clarification or other observations should be forwarded to the UDCP Project Manager:
Mike Gilbertson, CCME Secretariat123 Main Street, Suite 360Winnipeg, MB. R3C 1A3
Telephone: (204) 948-2032Fax: (204) 948-2125
e-mail: [email protected]

UDCP Appendix F ii
Table of Contents
Foreword................................................................................................................................................................................i
Table of Contents ..................................................................................................................................................... ii
1.0 Sampling Of Stack Gases For Speciated Mercury EmissionsFrom Coal-Fired Electric Power Generating Stations .............................................1
1.1 Scope ................................................................................................................................................................................1
1.2 Principle ..........................................................................................................................................................................1
1.3 Apparatus.......................................................................................................................................................................21.3.1 Sampling Train (see Figure 1).................................................................................................................21.3.2 Sample Recovery Apparatus....................................................................................................................3
1.4 Reagents.........................................................................................................................................................................41.4.1 Sampling Train Reagents...........................................................................................................................41.4.2 Sample Recovery Reagents.....................................................................................................................4
1.5 Procedures....................................................................................................................................................................51.5.1 Cleaning of Glassware .................................................................................................................................51.5.2 Sample Collection............................................................................................................................................51.5.3 Sample Recovery.............................................................................................................................................7
1.6 Quality Assurance/Quality Control Procedures...................................................................................91.6.1 Reagent Blanks.................................................................................................................................................91.6.2 Spiked Matrix QA/QC Samples...............................................................................................................91.6.3 Collection Patterns of Samples...........................................................................................................101.6.4 Mass Balances................................................................................................................................................10
2.0 Analysis Of Mercury In The Samples From The Stack Tests .........11
2.1 References ..........................................................................................................................................................12
Figure 1. Mercury Speciation Sampling Train.........................................................................................13
Figure 2. Example of Moisture Analysis Data Sheet...........................................................................14
Appendices ...................................................................................................................................................................15

UDCP Appendix F 1
1.0 Sampling Of Stack Gases For Speciated Mercury EmissionsFrom Coal-Fired Electric Power Generating Stations
1.1 Scope
This method applies to the sampling of particulate-bound, oxidized and elemental mercuryemitted to the atmosphere from the stacks and ducts of coal-fired electric power generatingstations. Total mercury emissions are obtained from the sum of the three mercury speciesmeasured. The following stack sampling procedures, contained in the Environment CanadaStandard Reference Method for Source Testing (5), form part of this method:
- Method A - Determination of Sampling Site and Traverse Points- Method B - Determination of Stack Gas Velocity and Volumetric Flow Rate- Method C - Determination of Molecular Weight by Gas Analysis- Method D - Determination of Moisture Content- Method E - Determination of Particulate Emissions- Method F - Calibration Procedures for S-type Pitot Tube, Dry Gas Meter and
Orifice Meter
It is assumed that the users of this method are familiar with the above stack gas samplingprocedures, including all aspects of pre-test and post-test calibrations, data recording principlesand calculations of standard stack gas parameters such as velocity, moisture content,molecular weight, volumetric flue gas flow rate, etc.
The method is applicable to concentrations of total mercury in flue gas ranging fromapproximately 0.5 to 100 µg/dscm, with the lower limit being based on a minimum laboratorydetection limit of 0.01 µg of mercury per sample, or 0.0005 µg/mL in the sample solutions.
Precision and bias data pertaining to the method are available in the ASTM version of the OntarioHydro Method (4).
1.2 Principle
A representative composite stack gas sample is withdrawn isokinetically from a number oftraverse points along the stack or duct cross section. Particulate-bound mercury present in thesample is collected on a filter, while the gaseous mercury is collected in a series of seven ice-cooled impingers. The first three of these impingers contain an aqueous solution of potassiumchloride for trapping the oxidized mercury, which most likely exists as mercuric chloride in thestack gas. The last three contain an acidified solution of potassium permanganate that iscapable of trapping the elemental mercury. The fourth impinger is placed between these twosets of three impingers and contains a solution of hydrogen peroxide in nitric acid. Its solepurpose is to protect the permanganate solutions from reaction with reducing agents in the fluegas, such as sulfur dioxide. Since all of the oxidized mercury has already been removed, anymercury found in this impinger is assigned to the elemental fraction of the catch.

UDCP Appendix F 2
1.3 Apparatus
1.3.1 Sampling Train (see Figure 1)
Most of the components listed below are based on those described in Method E for particulateemissions and in US EPA Method 29 (6) for the determination of metals emissions fromstationary sources. In some cases, it may be preferable to use an in-stack filtrationconfiguration, such as described in US EPA Method 17 (7).
Nozzle: A borosilicate or quartz glass nozzle of the buttonhook design, with a sharp, taperedleading edge. Nozzles constructed from other materials that are free from contamination and donot react with the sample may be used.
Probe: A borosilicate or quartz glass liner, with a heating and temperature indicating systemcapable of maintaining a temperature of at least 121°C (250°F) or that of the flue gas, whicheveris greater. Teflon-lined probes may be used where length or strength limitations preclude theuse of a glass liner, or if a US EPA Method 17 configuration is being used.
Pitot Tube: A calibrated S-type (Strausscheibe) pitot tube, or equivalent device, mounted on theprobe assembly for monitoring stack gas velocity.
Stack Temperature Sensor: A thermocouple, or equivalent device, mounted on the probeassembly, capable of measuring stack temperatures to within 1.5% of the minimum absolutestack temperature. The temperature and corrosiveness of the stack gases will determine thetype of thermocouple to be used.
Cyclone (optional): A borosilicate glass miniature cyclone following the sampling probe andpreceding the filter may be used to collect larger particulates. The cyclone prevents thepremature build-up of particulate matter on the filter medium, thereby minimizing absorption ofgaseous mercury by the collected dust as well as allowing longer sampling runs than couldotherwise be achieved. The cyclone must be maintained at a temperature of at least 121°C(250°F) or the temperature of the flue gas, whichever is greater, to avoid condensation. Thisoption will generally be required only for sampling upstream of the first control device, before themajority of the particulate matter has been removed.
Filter Holder: A borosilicate glass or Teflon-coated stainless steel filter holder with an inert filtersupport, contained in a heated enclosure capable of maintaining a temperature of a least 121°C(250°F) or the temperature of the flue gas, whichever is greater. The filter support of shall beconstructed of Teflon or other non-metallic, non-contaminating material and a suitable gasket ofTeflon or silicone rubber shall be used.
Filter: High purity quartz fibre filters, containing less than 0.2 µg/m2 of mercury and with anefficiency of at least 99.95% for 0.3 µm diameter particles. The filters shall be free of organicbinders and be inert to sulfur dioxide (SO2) and sulfur trioxide (SO3).
Note 1. In some instances, it may be advantageous to use an in-stack filtering device,such as is described in US EPA Method 17. This precludes the need to heat the filterholder assembly. However, the connecting tubing from the filter holder to the inlet of theimpingers must still be heated to at least 121°C (250°F) or the temperature of the fluegas, whichever is greater, to prevent condensation. The sample recovered from thistubing is added to that from the first impinger.

UDCP Appendix F 3
Impingers: Eight Greenburg-Smith impingers, connected in series. All but the third impingershall be modified by replacing the tip and impaction plate of the standard design with a 1.27 cm(0.5 inch) ID glass tube extending to 1.27 cm (0.5 inch) from the bottom of the flask. The thirdimpinger shall have the standard tip and impaction plate.
Note 2. When flue gases with high moisture contents (> 20%) are sampled, it may benecessary to use either an oversized impinger in the first position, or to place anadditional empty impinger at the beginning of the series. If the latter option is used, thecontents of this impinger are recovered and added to the sample recovered from theimpinger that would otherwise be the first.
Vacuum Pump: A leakproof vacuum pump capable of maintaining an isokinetic sampling rateand continuously withdrawing a portion of the stack gases through the sampling train. The pumpis connected to the outlet of the last impinger by a vacuum line containing a vacuum gauge tomeasure the pump intake vacuum to within 1 kPa (0.5 inch Hg) and a coarse adjustment valve toregulate sample flow. A bypass valve is connected across the vacuum pump to allow for finecontrol of the sample flow.
Dry Gas Meter: A calibrated dry gas meter, temperature compensated or equipped with inletand outlet temperature indicators, for measuring the volume of flue gas sampled.
Orifice: A calibrated orifice connected to the outlet of the dry gas meter, for measuring thesampling rate of the flue gas.
Differential Pressure Gauges: Inclined manometers, or equivalent devices, for themeasurement of the pitot tube velocity pressure and the pressure drop across the calibratedorifice. They must be capable of measuring to within 0.001 kPa (0.005 inch H2O) on the 0 to0.25 kPa (0 to 1 inch H2O) scale and 0.01 kPa (0.05 inch H2O) on the 0.25 to 2.5 kPa (1 to 10inch H2O) scale.
Barometer: A barometer capable of measuring the atmospheric pressure to within 0.35 kPa(0.1 inch Hg).
1.3.2 Sample Recovery Apparatus
Probe Brush: A nylon or Teflon bristle brush with no exposed metallic parts and of a length anddiameter suitable for cleaning the interior surface of the probe liner.
Balance: A top-loading balance capable of weighing to the nearest 0.1 g with a capacity of atleast 1,500 g.
Sample Storage Containers: Petri dishes for storing and transporting filters. Pre-cleaned clearglass storage bottles (preferably wide-mouth), with Teflon-lined lids and of sufficient capacity (atleast 500 mL) to hold each sample solution plus associated rinses.
Miscellaneous: Polypropylene or Teflon wash bottles, polypropylene or Teflon-coated tweezers,dropper-type pipettes, various sized volumetric flasks and graduated cylinders.

UDCP Appendix F 4
1.4 Reagents
All chemicals used shall be reagent grade (8). Water shall be deionized and conform to thespecifications for Type II water given by ASTM (9).
1.4.1 Sampling Train Reagents
Deionized Water: For preparing the following solutions.
Potassium Chloride (1 mol/L): Dissolve 74.55 g of potassium chloride (KCl) in water and diluteto one litre in a volumetric flask.
Hydrogen peroxide (30% v/v):
Nitric acid (10% v/v): Add 100 mL of concentrated nitric acid (HNO3) to approximately 800 mLof water in a one litre volumetric flask and dilute to volume with water.
Sulfuric Acid (50% v/v): While stirring, slowly add 500 mL of concentrated sulfuric acid (H2SO4)to approximately 400 mL of water. Allow the solution to cool to room temperature and transfer toa one litre volumetric flask. Dilute to volume with water.
Potassium Permanganate (5% w/v): Dissolve 50.0 g of potassium permanganate (KMnO4) inabout 800 mL of water and stir the contents for about two hours to allow for completedissolution. Dilute to one litre with water in a one litre volumetric flask and store in an amberglass bottle, preferably in a dark place. This solution can be kept for the duration of a singlestack test program (usually about one week), but it must be thoroughly mixed prior to each use.A fresh batch must be prepared for each stack test program.
Indicating Type Silica Gel (6-16 mesh): Dried at 177°C (350°F) for 2 hours, or used fresh.
Crushed Ice: For maintaining the impinger bath at the required temperature.
1.4.2 Sample Recovery Reagents
Deionized Water: For preparing solutions and rinsing glassware.
Nitric Acid Rinse (0.1 mol/L): Add 6.3 mL of concentrated nitric acid to approximately 900 mL ofwater and dilute to one litre with water.
Potassium Dichromate (5% w/v): Dissolve 25 g of potassium dichromate (K2Cr2O7) in 500 mLof water.
Sodium Chloride (10% w/v): Dissolve 100 g of sodium chloride (NaCl) in water and dilute to onelitre (see below).
Hydroxylamine Sulfate (15% w/v): Dissolve 15.0 g of hydroxylamine sulfate in 100 mL of 10%w/v sodium chloride solution.

UDCP Appendix F 5
Hydroxylamine Sulfate (1.5% w/v): Dilute 10 mL of the 15% w/v hydroxylamine sulfate solutionto 100 mL with water.
1.5 Procedures
1.5.1 Cleaning of Glassware
Prior to any field work, all glassware must be cleaned according to the guidelines outlined inSection 5.1.1 of US EPA Method 29. Briefly, this consists of hot soapy water washing and tapwater rinses prior to soaking in 10% w/v nitric acid solution for at least 4 hours. This is followedby water rinses and finally an acetone rinse before drying.
1.5.2 Sample Collection
Preliminary: Select a suitable sampling site and determine the minimum number of samplingpoints according to the procedures described in Report EPS 1-AP-74-1 (Method A). Determinethe stack pressure, temperature, moisture and range of velocity pressures. Use this informationto determine the size of nozzle required for isokinetic sampling. Recommended minimumnozzle size is 4.76 mm (3/16 inch) ID.
Sampling Time and Volume: The total sampling time for this method should not exceed 3 hoursand the sampling volume should be restricted to not more than 4 m3 (dry, at referenceconditions). This minimizes any reaction between dissolved sulfur dioxide and the oxidizedmercury collected in the first three impingers. That reaction can cause a partial reduction fromthe oxidized form to elemental mercury, which is then collected in subsequent impingers andcauses a bias in the speciation results.
Preparation of Sampling Train: A detailed step-by-step method summary for these proceduresis given in Appendix I. Assembly of the entire train must be performed in a clean area, free fromcontamination. Place the filter in the filter holder and cap the holder openings. Using agraduated cylinder, transfer 100 mL of 1 mol/L KCl solution to each of the first three impingers.Mix 50 mL of 30% v/v hydrogen peroxide (H2O2) with 50 mL of 10% v/v HNO3 solution and placein the fourth impinger (see Note 3 below). For each of the next three impingers, mix 80 mL of5% w/v KMnO4 with 20 mL of 50% v/v H2SO4 in a measuring cylinder and add to the impinger.Mix the contents. Add approximately 200g of silica gel to the last impinger. Weigh all impingersand record these values as well as the solution volumes on the Moisture Analysis Data Sheet(for example, see Figure 2). Set up the train as shown in Figure 1.
Note 3. The above procedure results in a hydrogen peroxide (H2O2) concentration ofabout 15% v/v, a concentration that will be required only for very high SO2 sources. Anyexcess H2O2 remaining at the end of the sampling run must be destroyed prior toanalysis for mercury, either during sample recovery or in the analytical laboratory. Thisis a tedious process. It is therefore useful to pre-calculate the concentration of H2O2
required to react with the expected quantity of SO2 in the flue gas to be sampled. Thisensures that the H2O2 will be depleted at the end of the sampling, or that only a smallexcess remains which can easily be destroyed during sample recovery. When less than50 mL of the H2O2 is used, the volume is made up to 100 mL with water.
Adjust the heating system to provide a temperature at the probe and filter of at least 121°C(250°F) or the temperature of the stack gas, whichever is greater. Plug the nozzle inlet and leak

UDCP Appendix F 6
check the system at this temperature by drawing a 51 kPa (15 inch Hg) vacuum. A leakage ratenot in excess of 0.6 L/min (0.02 ft3/min) is acceptable. Record the actual leak rate (Leak Check1) on the Sampling Data Sheet (for example, see Method E). Also, leak check the pitot tube linesat this time to ensure that they are leak free.
Place crushed ice around the impingers. Add more ice during sampling to keep the temperatureof the gases leaving the last impinger as low as possible, and always below 21°C (70°F).Temperatures above 21°C (70°F) may result in damage to the dry gas meter from eithermoisture condensation or excessive heat.
Operation of Sampling Train: Verify that the heating system is providing a temperature of atleast 121°C (250°F) at the filter and the probe outlet. To begin sampling, position the samplingnozzle at the first sampling point (traverse point). Point the nozzle directly into the approachinggas stream and secure the entire apparatus. Immediately start the vacuum pump and adjust thesampling flow rate to isokinetic conditions. Sample for at least 5 minutes at each sampling point;sampling time must be the same for each point and at least 1.7 m3 (60 ft3) but not more than 4m3 (140 ft3) of sample gas must be collected during the run. Maintain isokinetic samplingthroughout the sampling period by making the necessary adjustments in the sampling flow rateas stack conditions change, or as the build-up particulate matter on the filter affects the flow.Computer programs, sampling rate equations or nomographs are available, or can beconstructed, to aid in the rapid adjustment of the sampling rate. For each run, record the datarequired on the Sampling Data Sheet.
Note 4. If the source being sampled is under negative pressure, it is necessary to startthe vacuum pump at a low flow rate before inserting the probe into the gas stream, and tothen adjust the sampling flow rate. Similarly, a low flow rate should be maintained at theend of the sampling time until the probe has been withdrawn, before turning off thevacuum pump.
To simplify recording of data in the field, values may be entered in the units for which thesampling equipment is designed. These values must then be converted to the metric unitsspecified in the equations where they are used. Instrument readings shall be recorded atintervals that are consistent with the time duration established for each point. Readings must betaken at least once at each traverse point and the time between readings must not exceed 5minutes. Record any sampling interruptions on the reverse side of the Sampling Data Sheet.When the traverse is completed, turn off the vacuum pump and record the final instrumentreadings. It is recommended that the leak check procedure described in the next paragraph befollowed before transferring the sampling apparatus to any additional port(s). Any excessiveleaks may then be corrected before the continuation of sampling. This procedure is mandatorywhenever it becomes necessary to disconnect or change sampling train components. Transferthe sampling apparatus to any additional sampling port(s) and repeat the sampling procedure.
Remove the sampling apparatus from the stack port when the test is completed. Perform a finalleak check by plugging the nozzle and drawing a vacuum equal to the maximum vacuumobserved during sampling. Record this result (Leak Check 2) on the Sampling Data Sheet. Ifthe leakage rate exceeds 0.6 L/min (0.02 ft3/min), locate and record the cause on the data sheetand consult the appropriate regulatory agency regarding the validity of the test. Leak check thepitot tube lines again to ensure they have remained leak free and the measured velocity headdata are valid.
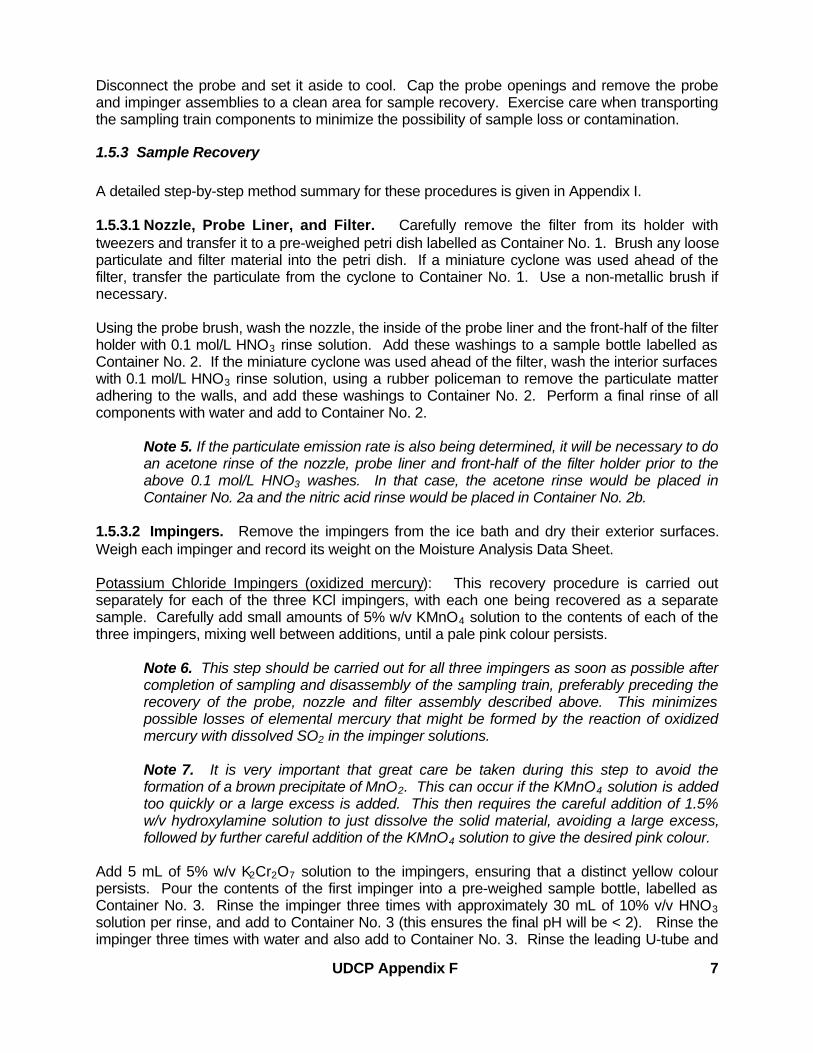
UDCP Appendix F 7
Disconnect the probe and set it aside to cool. Cap the probe openings and remove the probeand impinger assemblies to a clean area for sample recovery. Exercise care when transportingthe sampling train components to minimize the possibility of sample loss or contamination.
1.5.3 Sample Recovery
A detailed step-by-step method summary for these procedures is given in Appendix I.
1.5.3.1 Nozzle, Probe Liner, and Filter. Carefully remove the filter from its holder withtweezers and transfer it to a pre-weighed petri dish labelled as Container No. 1. Brush any looseparticulate and filter material into the petri dish. If a miniature cyclone was used ahead of thefilter, transfer the particulate from the cyclone to Container No. 1. Use a non-metallic brush ifnecessary.
Using the probe brush, wash the nozzle, the inside of the probe liner and the front-half of the filterholder with 0.1 mol/L HNO3 rinse solution. Add these washings to a sample bottle labelled asContainer No. 2. If the miniature cyclone was used ahead of the filter, wash the interior surfaceswith 0.1 mol/L HNO3 rinse solution, using a rubber policeman to remove the particulate matteradhering to the walls, and add these washings to Container No. 2. Perform a final rinse of allcomponents with water and add to Container No. 2.
Note 5. If the particulate emission rate is also being determined, it will be necessary to doan acetone rinse of the nozzle, probe liner and front-half of the filter holder prior to theabove 0.1 mol/L HNO3 washes. In that case, the acetone rinse would be placed inContainer No. 2a and the nitric acid rinse would be placed in Container No. 2b.
1.5.3.2 Impingers. Remove the impingers from the ice bath and dry their exterior surfaces.Weigh each impinger and record its weight on the Moisture Analysis Data Sheet.
Potassium Chloride Impingers (oxidized mercury): This recovery procedure is carried outseparately for each of the three KCl impingers, with each one being recovered as a separatesample. Carefully add small amounts of 5% w/v KMnO4 solution to the contents of each of thethree impingers, mixing well between additions, until a pale pink colour persists.
Note 6. This step should be carried out for all three impingers as soon as possible aftercompletion of sampling and disassembly of the sampling train, preferably preceding therecovery of the probe, nozzle and filter assembly described above. This minimizespossible losses of elemental mercury that might be formed by the reaction of oxidizedmercury with dissolved SO2 in the impinger solutions.
Note 7. It is very important that great care be taken during this step to avoid theformation of a brown precipitate of MnO2. This can occur if the KMnO4 solution is addedtoo quickly or a large excess is added. This then requires the careful addition of 1.5%w/v hydroxylamine solution to just dissolve the solid material, avoiding a large excess,followed by further careful addition of the KMnO4 solution to give the desired pink colour.
Add 5 mL of 5% w/v K2Cr2O7 solution to the impingers, ensuring that a distinct yellow colourpersists. Pour the contents of the first impinger into a pre-weighed sample bottle, labelled asContainer No. 3. Rinse the impinger three times with approximately 30 mL of 10% v/v HNO3
solution per rinse, and add to Container No. 3 (this ensures the final pH will be < 2). Rinse theimpinger three times with water and also add to Container No. 3. Rinse the leading U-tube and

UDCP Appendix F 8
the back-half of the filter holder with both 10% v/v HNO3 solution and water and add to ContainerNo. 3. Add additional K2Cr2O7 solution if necessary. Seal the container and record its weight ona Sample Recovery Data Sheet.
Note 8. If the US EPA Method 17 in-stack filtering procedure was used, the connectingtubing is also recovered by rinsing with both 10% v/v HNO3 solution and water andadding these rinses to Container No. 3.
Except for the back-half of the filter holder washings, repeat this procedure for the secondimpinger to give sample Container No. 4 and for the third impinger to give sample Container No.5.
Hydrogen Peroxide/Nitric Acid Impinger (elemental mercury): Add small amounts of 5% w/vKMnO4 solution to the contents of the impinger, mixing well between additions, until a pale pinkcolour persists. Add 5 mL of 5% w/v K2Cr2O7 solution to the impingers, ensuring that a distinctyellow colour persists. Pour the contents of the impinger into a pre-weighed sample bottle,labelled as Container No. 6. Rinse the impinger three times with approximately 30 mL of 0.1mol/L HNO3 solution per rinse, and add to Container No. 6. Rinse the impinger three times withwater and also add to Container No. 6. Rinse the leading U-tube with both 0.1 mol/L HNO3
solution and water and add to Container No. 6. Add additional K2Cr2O7 solution if necessary.Seal the container and record its weight on the Sample Recovery Data Sheet.
Note 9. If the concentration of the H2O2 has not been reduced from 15% v/v and thissample is being submitted directly to a laboratory for destruction of the excess H2O2
prior to analysis, the first two steps of this section may be omitted.
Potassium Permanganate Impingers (elemental mercury): This recovery procedure is carriedout separately for each of the three KMnO4 impingers, with each one being recovered as aseparate sample. Note and record the colour of the impinger contents (purple, brown,colourless). Rinse the leading U-tube of the fifth impinger with a small portion of the dilute 1.5%w/v hydroxylamine solution to dissolve any brown solid material, and add to the contents of theimpinger. Using a dropper, slowly add small portions of 15% w/v hydroxylamine solution, rinsingdown the sides and the stem of the impinger. Mix thoroughly between additions. Continue thisprocess until the KMnO4 solution just becomes colourless and any solid material on the wallsand stem of the impinger has dissolved. Care must be taken to avoid adding a large excess ofthe hydroxylamine. Add small portions of 5% w/v KMnO4 solution, mixing well betweenadditions, until a pale pink colour persists. Add 5 mL of 5% w/v K2Cr2O7 solution to the impinger,ensuring that a distinct yellow colour persists. Pour the contents of this impinger into a pre-weighed sample bottle labelled as Container No. 7. Rinse the impinger and its leading U-tubethree times with 0.1 mol/L HNO3 solution and three times with water and also add these rinsesto the Container No. 7. Add additional K2Cr2O7 solution if necessary. Seal the container andrecord its weight on the Sample Recovery Data Sheet.
Repeat this procedure for the sixth impinger to give sample container No. 8 and for the seventhimpinger to give sample Container No. 9. Note that the trailing U-tube from the seventh impingeris also rinsed with 0.1 mol/L HNO3 solution and water, with these washings being added tosample Container No. 9
Silica Gel Impinger: Note the colour and relative proportions of the silica gel (i.e. half blue, halfpink). Once the weight of this impinger has been recorded, its contents can be discarded, orregenerated for future use.

UDCP Appendix F 9
1.6 Quality Assurance/Quality Control Procedures
1.6.1 Reagent Blanks
At least once per set of tests, the following blanks shall be prepared and submitted for mercuryanalysis. Alternatively, a complete blank train can be prepared and recovered as describedabove, and the samples submitted for mercury analysis.
Filter Blank: Place an unused filter in a petri dish labelled as Container No. 10.
Potassium Chloride Blank: Measure 100 mL of 1 mol/L KCl solution into a pre-weighed samplebottle labelled as Container No. 11. Add 90 mL of 10% v/v HNO3 solution and 90 mL of water tothe container and mix the contents. Add small portions of 5% w/v KMnO4 solution, mixing wellbetween additions, until a pale pink colour persists. Add 5 mL of 5% w/v K2Cr2O7 solution togive a distinct yellow colour. Seal and record the weight of the container.
Hydrogen Peroxide/Nitric Acid Blank: In a measuring cylinder, mix 50 mL of 30% v/v H2O2 with50 mL of 10% v/v HNO3 solution and pour into a pre-weighed sample bottle labelled as ContainerN0. 12. If less than 50 mL of the H2O2 was used in the fourth impinger during sampling, use thesame volume for this blank and make up to 100 mL with water. Add 90 mL of 0.1 mol/L HNO3
solution and 90 mL of water, and mix the contents. Add small amounts of 5% w/v KMnO4
solution, mixing well between additions, until a pale pink colour persists. Add 5 mL of 5% w/vK2Cr2O7 solution to give a distinct yellow colour. Seal the container and record its weight. Asdescribed previously in Note 9, the addition of the KMnO4 and K2Cr2O7 solutions may be omittedif the concentration of the H2O2 has not been reduced from 15% v/v and this blank is beingsubmitted directly to a laboratory for destruction of the excess H2O2 prior to analysis.
Potassium Permanganate Blank: In a measuring cylinder, mix 80 mL of 5% w/v KMnO4 solutionwith 20 mL of 50% v/v H2SO4 solution and add to a pre-weighed sample bottle labelled asContainer No. 13. Using a dropper, slowly add small portions of 15% w/v hydroxylaminesolution, mixing thoroughly between additions. Continue this process until the KMnO4 solutionjust becomes colourless and any solid material that may have formed has dissolved. Care mustbe taken to avoid adding a large excess of the hydroxylamine. Add small portions of 5% w/vKMnO4 solution, mixing well between additions, until a pale pink colour persists. Add 5 mL of 5%w/v K2Cr2O7 solution to the impinger to give a distinct yellow colour. Seal and record the weightof the container.
1.6.2 Spiked Matrix QA/QC Samples
At least once per set of tests, a set of five QA/QC spiked matrix samples representing each ofthe three types of impinger solutions shall be prepared and submitted for mercury analysis. Ifdeemed desirable, a blank filter can also be spiked and submitted for analysis at the same time.Alternatively, a complete train of seven impingers can be prepared and the filter and eachimpinger spiked with a known quantity of mercury. This train is then recovered as describedpreviously and the samples submitted for mercury analysis.
Prepare a 1000 mg/L mercury standard by dissolving 1.3535 g of mercuric chloride (HgCl2) in0.1 mol/L HNO3 solution and diluting to one litre with the same solvent. Alternatively, acommercially available 1000 mg/L mercury standard can be used for this purpose. Dilute 2.0

UDCP Appendix F 10
mL of the 1000 mg/L standard to one litre in a volumetric flask with 0.1 mol/L HNO3 solution,adding 5 mL of 5% w/v K2Cr2O7 solution before making up to the mark. Each millilitre of thisQA/QC mercury standard contains 2.0 µg of mercury. Aliquots of between 1 to 10 mL can thenbe used to add between 2 to 20 µg of mercury to the QA/QC spiked matrix samples.
Prepare two solutions of potassium chloride, one hydrogen peroxide/nitric acid solution and twopotassium permanganate solutions, as described above in Section 1.6.1 for the reagent blanks.Prior to sealing and weighing the containers, accurately pipette a known volume of the QA/QCmercury standard into each container. Record these spike volumes. Use different volumes foreach type of matrix, and for each sample of the same matrix, attempting to simulate theexpected distribution of mercury in the actual samples. These samples are labelled asContainer No 14 to 18, respectively.
1.6.3 Collection Patterns of Samples
Since each of the seven impinger samples from each test run is analyzed separately, the resultscan be used to give information on the success of the sample collection. For example, if thetotal mercury found in the three KCl impingers was found to be distributed as 90% in the first, 8%in the second and only 2% in the third, one would be confident that the sample had beensuccessfully trapped by those impingers. By contrast, a collection pattern of 40%, 30% and 30%would strongly indicate that sample break-through had occurred and the sampling was notsuccessful.
Following receipt of the sample analysis results, assemble the data in groups of three KClimpingers and three KMnO4 impingers. Calculate the collection pattern for each set. Use thesedata to assess the success of the sample collection. Although this is a subjective judgement,results with greater than 15% of the catch in the third impinger should generally be consideredsuspect.
The fourth impinger catch, while forming part of the total elemental mercury found, does notsignificantly affect the KMnO4 collection pattern. Generally this quantity of mercury is small, atless than 2% of the total elemental mercury.
1.6.4 Mass Balances
Although not part of the stack testing methodology per se, the UDCP emission testing protocolrequires that a mass balance calculation be included in the QA/QC procedures for each totalmercury emission result. This requires that the mercury input to the boiler in the coal and themercury retained in the bottom ash and fly ash (and any other significant residues) also beknown. An example of these calculations using typical but fictional data is shown in Appendix II.Generally, a mass balance closure of between 80% to 120% would be considered an acceptableresult in support of the measured emission rate. Note that these calculations also give anestimation of the fraction of mercury retained in the plant versus that emitted in the stack gas.These data are essential for estimating power plant emissions bases on mercury in coalanalyses.

UDCP Appendix F 11
2.0 Analysis Of Mercury In The Samples From The Stack Tests
Full details of the analytical procedures for determining the mercury content of the stack testsamples are not included in this document. The sample recovery procedure of the methodresults in impinger samples that any reputable laboratory should be able to analyze by standardCVAAS or CVAFS techniques for determining mercury in water samples. However, since onlythe weight of each sample has been measured, as opposed to its volume, it is important that thelaboratory be requested to either measure the volume of each sample prior to its analysis, or todetermine the specific gravity of each type of matrix. Either procedure will then allow the totalmercury content of each sample to be calculated from its mercury concentration.
The determination of the mercury content of particulate matter samples should also pose noproblems for most laboratories using standard analysis techniques. For further informationregarding these analytical methods, refer to either of the ASTM or US EPA proceduresreferenced below, where they are fully documented.
It is essential that the laboratory be able to achieve a minimum detection limit of 0.1 µg ofmercury per sample, or 0.00005 µg/mL in solution, to allow the method to be used for very lowmercury emission sources.

UDCP Appendix F 12
References
1. Curtis, K.E., and Eagleson, K.E., “Speciation of Mercury Emissions from OntarioHydro’s Coal-Fired Generating Stations”, Ontario Hydro Technologies Report No. A-F-95-22-CON, March 1995.
2. EPRI, “Evaluation of Flue Gas Mercury Speciation Methods”, EPRI TR-108988, ElectricPower Research Institute, Palo Alto, CA, December 1997.
3. ASTM D6784-02, “Standard Test Method for Elemental, Oxidized, Particle-Bound, andTotal Mercury in Flue Gas Generated from Coal-Fired Stationary Sources (OntarioHydro Method)”,
4. US EPA Preliminary Method-003, “ibid”, Web-site address:www.epa.gov/ttn/emc/prelim/pre-003.pdf
5. Environment Canada, “Standard Reference Methods for Source Testing: Measurementof Emissions of Particulates from Stationary Sources”, Environment Canada, ReportEPS I-AP-74-1, February 1974
6. US EPA Method 29, “Determination of Metals Emissions from Stationary Sources”.
7. US EPA Method 17, “Determination of Particulate Emissions from Stationary Sources(In-Stack Filtration Method).
8. American Chemical Society, “Reagent Chemicals, American Chemical SocietySpecifications”, Washington, DC, Annual.
9. ASTM Standard D 1193, “Specifications for Reagent Water”, Annual Book of ASTMStandards, Vol. 11.01.

UDCP Appendix F 13
Fig
ure
1. S
chem
atic
of M
ercu
ry S
peci
atio
n S
ampl
ing
Tra
in

UDCP Appendix F 14
FIGURE 2
MOISTURE ANALYSIS DATA SHEET
PlantLocationTest NumberTest Conducted by
IMPINGER IMPINGER MOISTURE GAIN NUMBER CONTENTS (g,)
1 KCl Final(100 mL) Initial
Gain (a)
2 KCl Final(100 mL) Initial
Gain (b)
3 KCl Final(100 mL) Initial
Gain (c)
4 H2O2 /HNO3 Final(100 mL) Initial
Gain (d)
5 KMnO4/H2SO4 Final(100 mL) Initial
Gain (e)
6 KMnO4/H2SO4 Final(100 mL) Initial
Gain (f)
7 KMnO4/H2SO4 Final(100 mL) Initial
Gain (g)
8 Silica Gel Final(200 g) Initial
Gain (h)
Weight of water collected WH20 = a + b + c + d + e + f + g + hWH20 = g

UDCP Appendix F 15
Appendices
I. Step-by-Step Method Summary
II. Example Mass Balance Calculation

UDCP Appendix F 16
APPENDIX I
Ontario Hydro Method for the Measurement of Speciated Mercury Emissions:Sample Train Loading and Recovery Procedures
1.0 Scope
This method describes the chemical solutions required, and the impinger loading andsample recovery instructions for the Ontario Hydro Method sampling train, designed for thecollection and speciation of mercury emissions from stationary sources.
2.0 Personnel Qualifications/Experience
Laboratory experience in the handling of chemicals and preparation of solutions isessential, especially for performing the sample recovery procedure. Ability to followspecific detailed instructions is essential. Precision measurements and accurate datarecords are important.
3.0 Apparatus/Equipment/Materials
3.1 FumehoodWorkspace in a fumehood, suitable for use in preparing chemical solutions.
3.2 BalanceA top loading balance capable of measuring mass to the nearest 0.1 g is requiredfor measuring the masses of chemicals, containers and samples. A balancecapable of measuring mass to the nearest 0.0001 g is required for measuring themass of the filter.
3.3 Chemicals and SolutionsThe following chemicals and solutions are required for this method:• Potassium Chloride 1 mol/L KCl• Potassium Permanganate 5% w/V KMnO4
• Potassium Dichromate 5% w/V K2Cr2O7
• Sodium Chloride 10% w/V NaCl (see below)• Hydroxylamine Sulfate 15% w/V (NH2OH)2 •H2SO4 in10% w/V NaCl• Hydroxylamine Sulfate 1.5% w/V (NH2OH)2 •H2SO4 in 1% w/V NaCl• Nitric Acid 10% V/V HNO3 and 0.1 N HNO3
• Sulphuric Acid 50% V/V H2SO4
• Hydrogen Peroxide 30% V/V H2O2
• Acetone (CH3)2CO• Indicating Silica Gel (coarse) For moisture capture
Note: All chemicals must be of a grade suitable for mercury testing, such as Fisher BrandCertified Grade or Trace Metal Grade.
3.4 Glassware for Preparation of Chemical SolutionsGlass graduated cylinders are required for preparation of chemical solutions.Generally, 100 mL, 250 mL, 500 mL and 1 L sizes are used. Volumetric flasks of250 mL, 500 mL and 1 L capacities are also required. Larger quantities of preparedsolutions are stored in 2 L and 4 L glass jugs, which are suitable for transport to

UDCP Appendix F 17
field test sites. The stock 5% w/V KMnO4 solution should be stored in amber glass,or be wrapped in aluminum foil to protect it from light.
3.5 Sampling TrainThe sampling train consists of the following components:• pitot tube/thermocouple assembly (attached to probe)• probe liner, borosilicate or quartz glass• probe nozzle, borosilicate or quartz glass• filter holder, glass/Teflon• filter hot-box/impinger cold-box assembly• eight glass impingers connected in series with leak-free ground glass fittings
3.6 FiltersQuartz fibre filters (110 mm diameter), free of organic binders, shall be used.
3.7 Impinger StandTwo impinger stands, each capable of supporting at least 8 impingers.
3.8 Sample BottlesUse 500 mL clean clear glass bottles with Teflon lined caps. VWR “TraceCleanTall Wide-Mouth” pre-cleaned bottles meet or exceed the performance-basedquality standards of the US EPA. If pre-cleaned bottles are not available, samplebottles must be thoroughly rinsed three times with 10% nitric acid, then three timeswith deionized water.
3.9 Petri DishNew or pre-cleaned (as sample bottles above) polystyrene, 150 mm diameter, petridishes are required for storing the sample filters both before and after sampling.
3.10 Polypropylene or Teflon-Coated TweezersFor transferring the filter from the sampling train filter holder to the petri dish.
3.11 Teflon Probe BrushA probe brush made from a length of Teflon tubing that is cut at one end to createbristles and is long enough to extend down the inner length of the probe being used(or a commercially available equivalent). This is required for the quantitativerecovery of mercury and any particulate matter from the nozzle and probe liner.
3.12 LabelsLabels for identifying samples with information such as test site, test number andsample number.
3.13 Wash Bottles and PipettesPolypropylene or Teflon wash bottles and dropper-type pipettes are required for theaddition of reagents and washing of equipment during sample recovery.
3.14 Teflon TapeTeflon tape is required for capping off the open ends of the sample train prior to thesampling and again at its completion, prior to sample recovery. It may also be usedto ensure leak free seals on sample bottles.

UDCP Appendix F 18
4.0 Calibration/Check Standards
A laboratory log of all calibration records must be maintained. The dry gas meters and thepitot tube should be calibrated before and after each use, or at least every 6 months. Thetrain components (probe nozzle, pitot tube, metering system, probe heater, temperaturegauges and barometer) are calibrated according to the appropriate sections of US EPAMethod 5. If one or more flue gas analyzers are used to measure the composition of theflue gas for molecular weight determinations, they must be calibrated prior to each use withstandard calibration gas mixtures.
5.0 Test Method Laboratory Procedures
5.1 Loading Sample Train
5.1.1 FilterMeasure and record the mass of an empty, labelled petri dish to the nearest0.0001g. Place a quartz fibre filter that has been dried and stored in a desiccatorinto the petri dish and record the combined mass to 0.0001g. Prior to the test, loadthe filter into the sampling train’s glass filter holder assembly.
5.1.2 Loading Impingers #1, #2 and #3Measure and record the mass of each empty impinger to the nearest 0.1g (#1 and#2 are modified, #3 is standard).Pour 100 mL of 1.0 mol/L potassium chloride (KCl) solution into each impinger.Weigh and record to the nearest 0.1g.
5.1.3 Loading Impinger #4 (for sampling in high SO2 conditions)Measure and record the mass of the empty impinger to the nearest 0.1g (#4 ismodified).In a graduated cylinder that holds at least 100 mL, pour 50 mL of 30% v/v hydrogenperoxide (H2O2). Add 50 mL of 10% v/v nitric acid (HNO3) to make a total of 100 mLof solution. Pour into Impinger #4. Swirl the contents to ensure the solution is wellmixed. Weigh and record to the nearest 0.1g.
Note: The above procedure results in a solution with a very high H2O2 concentration of15% v/v. Any excess H2O2 remaining at the completion of sampling must be destroyedprior to analysis for mercury, either during sample recovery or in the analytical laboratory.This is a very tedious process. Given that the sole purpose of this solution is to protect thecontents of Impinger #5 (KMnO4) from being reduced by SO2, it is useful to pre-calculatethe concentration of the H2O2 required to react with the expected quantity of SO2 in the fluegas to be sampled. This ensures that the H2O2 will either be depleted just prior tocompletion of the sampling, or that only a relatively small quantity will remain which can beeasily reduced by the addition of a small volume of 5% w/V KMnO4 solution
5.1.4 Loading Impingers #5, #6 and #7Measure and record the mass of each empty impinger to the nearest 0.1 g (all aremodified). In a graduated cylinder that holds at least 100 mL, pour 80 mL of 5% w/Vpotassium permanganate (KMnO4) solution. Add 20 mL of 50% v/v sulfuric acid(H2SO4) to make a total of 100 mL of solution. Pour this mixture into Impinger #5.Swirl the contents to ensure the solution is well mixed. Repeat for Impingers #6 and#7. Weigh each impinger and record to the nearest 0.1g.

UDCP Appendix F 19
5.1.5 Loading Last ImpingerMeasure and record the mass of an empty modified impinger to the nearest 0.1g.Partially fill impinger (about 2/3 full) with fresh coarse indicating silica gel. Weigh tonearest 0.1g and record.
5.1.6 Sample Train AssemblyConnect the series of impingers with glass U-tubes, after applying an adequateamount of silicone vacuum grease to the ball and socket joints. Alternatively, Teflontape or impingers pre-fitted with Teflon O-rings can be used. Secure the joints withmetal clamps and tighten. Seal open ends with Teflon tape. Cover the assembledtrain to protect it from light that may cause degradation of the potassiumpermanganate solution.
5.2 Sample Train Recovery
5.2.1 Disassembly of Sample TrainAfter stack sampling is complete and the train has been sealed and transportedback to the on-site sample recovery facility, carefully remove the clamps anddisassemble the sampling train. Dry the exterior surfaces of the impingers andwipe away any vacuum grease (if it was used) from the ground glass fittings.Weigh and record the mass of each impinger, then place it in the impinger stand,along with its corresponding leading U-tube.
5.2.2 Filter RecoveryAllow the glass filter holder assembly to cool and then carefully remove the filter withthe tweezers and place it in a pre-weighed petri dish labelled as Sample #1. Brushany loose particulate or filter material into the container. Dry in a desiccator, thenmeasure and record the combined mass to the nearest 0.0001 g.
5.2.3 Acetone Probe RinseLet the probe cool and then rinse the nozzle and probe liner with 100 mL of acetoneinto a pre-weighed glass bottle. Brush the inside of the probe liner with a Teflonprobe brush while rinsing the probe. In the lab, rinse the front half of the filter holderwith acetone and add to the sample bottle. This sample will later be transferred to apre-weighed beaker and covered with a ribbed watch glass, which is then placed ina fumehood to allow the acetone to evaporate. Once dry, weigh and then cover thebeaker securely with parafilm. This dry sample will be labelled as Sample #2(a),and its mass will be combined with that for Sample #1 to determine the total massof particulate matter collected.
5.2.4 Nitric Acid (0.1 mol/L) Probe RinseFollowing the acetone rinse, rinse the nozzle and probe liner with 100 mL of 0.1mol/L nitric acid into a pre-weighed clear glass bottle, again brushing with the Teflonprobe brush. Perform a final rinse and brushing with deionized water and also addto the bottle. In the lab, rinse the front half of the filter holder with 0.1 mol/L nitricacid and then deionized water and add to the sample bottle. Weigh and record asSample #2(b).
5.2.5 Recovery of Potassium Chloride Impingers - Oxidized MercurySample #3: Impinger #1

UDCP Appendix F 20
Carefully add small amounts of 5% w/v potassium permanganate (KMnO4) solutionto the contents of the impinger, mixing well between additions, until a pale pinkcolour persists.
Note: It is very important that great care be taken during this step to avoid the formation ofa brown precipitate of MnO2. This can occur if the KMnO4 solution is added too quickly ora large excess is added. This then requires the careful addition of the dilute 1.5% w/vhydroxylamine solution to just dissolve the solid material, avoiding a large excess, followedby further careful addition of KMnO4 solution to give the desired pink colour.
Add 5% w/v potassium dichromate (K2Cr2O7) solution (approximately 5 mL) toimpinger contents so that a distinct yellow colour persists.Pour impinger contents into a pre-weighed clear glass bottle.Rinse Impinger #1 three times with approximately 30mL of 10% v/v HNO3 per rinse,and add to the sample bottle. This will ensure that the final pH will be <2.Rinse Impinger #1 three times with deionized water and add to sample bottle.Rinse the leading U-tube with both 10% v/v HNO3 and deionized water and also addto the sample bottle.Add additional K2Cr2O7 solution if necessary. Weigh and record as Sample #3.
Repeat the above procedure with Impinger #2 to give Sample #4 and with Impinger#3 to give Sample #5.
Note: The addition of the KMnO4 solution in Step 5.2.5 above should be done as soon aspossible after completion of sampling and the sampling train has been disassembled (Step5.2.1). This minimizes possible losses of elemental mercury that might be formed by thereaction of the oxidized species with dissolved SO2 in the impinger solutions. Wherepossible, this action should precede Steps 5.2.2 to 5.2.4.
5.2.6 Recovery of Hydrogen Peroxide Impinger - Elemental MercurySample #6: Impinger #4Add small amounts of 5% w/v potassium permanganate (KMnO4) solution to thecontents of the impinger, mixing well between additions, until a pale pink colourpersists.Add 5% w/v potassium dichromate (K2Cr2O7) solution (approximately 5 mL) to theimpinger contents so that a distinct yellow colour persists.Pour impinger contents into a pre-weighed clear glass bottle.Rinse Impinger #4 three times with approximately 30 mL of 0.1 N HNO3 per rinse,and add to sample bottle.Rinse the impinger with deionized water three times and add to bottle. Rinse theleading U-tube with nitric acid and deionized water and add to the bottle. Weigh andrecord as Sample #6.
Note: If the concentration of the hydrogen peroxide has not been reduced from 15% v/vand this sample is being submitted directly to the laboratory for destruction of the excessperoxide prior to analysis, the first two steps of this section can be omitted.
5.2.7 Potassium Permanganate Impingers - Elemental MercurySample #7: Impinger #5Note and record the colour of the solution (purple, brown, colourless).Rinse the leading U-tube with a small portion of the dilute 1.5% w/v hydroxylaminesulfate in 1.0% w/v sodium chloride solution to dissolve any brown solid material, andadd to the contents of the impinger.

UDCP Appendix F 21
Using a wash bottle or dropper-type pipette, carefully add small portions of 15% w/vhydroxylamine sulfate 10% w/v sodium chloride solution, rinsing down the sides andstem of the impinger. Mix the solution thoroughly between additions.Continue this process until the potassium permanganate solution in the impingerbecomes colourless and the solid material on the walls and stem of the impingerhas dissolved. Avoid adding a large excess of the hydroxylamine. Then add smallportions of 5% w/V potassium permanganate solution to the contents of theimpinger, mixing well between additions, until a pale pink colour persists.Add 5% w/V potassium dichromate (K2Cr2O7) solution (approximately 5 mL) toimpinger contents so that a distinct yellow colour persists.Pour the contents into a pre-weighed 500 mL clear glass bottle.Rinse Impinger #5 and the U-tube three times with approximately 30 mL of 0.1mol/L HNO3 per rinse, and add to the bottle.Rinse the impinger and U-tube three times with deionized water and add to bottle.Add additional K2Cr2O7 solution to sample bottle if necessary. Weigh and record asSample #7.
Repeat this procedure with Impinger #6 to give Sample #8 and with Impinger #7 togive Sample #9. Note that for Impinger #7 there are both the leading and followingU-tubes to be included in the sample.
5.2.8 Moisture CollectionNote colour and relative portions of the silica gel (i.e. half pink, half blue).After the weight of Impinger #7 has been recorded, empty out and discard orregenerate the used silica gel.Determine the mass difference for each impinger (before test versus after test) andadd the results together to calculate total moisture gained.
6.0 Quality Control
All data are recorded on data sheets that are checked, signed and kept for future reference.Reagent blanks and filter blanks are submitted for mercury analysis. In addition, samplescan be recovered from a blank train that is run at the test site in the leak check area andsubmitted for analysis.Spiked blank impinger solution samples that are recovered on site are used for controlsamples.
7.0 Records/Reports
Excel spreadsheet can be used for final calculations. A final report is issued to the client.
8.0 Other Requirements
Job Safety Analysis forms relating to this work should be prepared and reviewed by allparticipating personnel.
9.0 Bibliography
US EPA Preliminary Method 003US EPA Method 5Ontario Ministry of the Environment Source Testing CodeManufacture’s Isokinetic Stack Sampling Equipment Operating Manual

UDCP Appendix F 22
APPENDIX II
Example Mass Balance Calculation
As-fired (as-weighed) coal feed rate = 250.0 Mg/hrAs-fired (as-weighed) moisture content of the coal = 15.0%Therefore, dry-basis (DB) coal feed rate = 212.5 Mg/hr
Mercury content of the coal (DB) = 0.0750 mg/kgTherefore, inlet mercury mass flow rate = 212.5 x 0.0750
= 15.94 g/hr
Ash content of the coal (DB, carbon-free) = 15.0%Therefore, DB carbon-free ash mass flow rate = 212.5 x 0.15
= 31.88 Mg/hr
DB carbon content of the bottom ash = 5.00%DB carbon content of the fly (ESP) ash = 3.50%
Assuming a split of 25% bottom ash and 75% fly (ESP) ash,then the average carbon content of the total ash = (0.25x5.00) + (0.75x3.50)
= 3.88%
Therefore, total estimated ash mass flow rate, including carbon = 31.88 / 0.9612= 33.16 Mg/hr
At 25% of the total ash, bottom ash mass flow rate = 8.290 Mg/hrBottom ash mercury content (DB) = 0.0050 mg/kgTherefore, mercury mass flow rate released in the bottom ash = 8.290 x 0.0050
= 0.0414 g/hr
At 75% of the total ash, fly (ESP) ash mass flow rate = 24.87 Mg/hrFly (ESP) ash mercury content (DB) = 0.2000 mg/kgTherefore, mercury mass flow rate released in the fly (ESP) ash = 24.87 x 0.2000
= 4.974 g/hr
Therefore, total outlet mercury mass flow rate in the ash = 0.0414 + 4.974= 5.015 g/hr
Mercury emission rate in the flue gas = 9.500 g/hr
Therefore, total outlet mercury mass flow rate = 14.52 g/hr
Therefore, mercury mass balance, outlet versus inlet = 14.52 / 15.94 x 100= 91%
Of this, fraction found in the ash = 31%and fraction found in the flue gas = 60%
Normalized to 100%, fraction found in the ash = 35%and fraction found in the flue gas = 65%----------------------------------------------------------------------------------------------------------------------Note: The data used in the above calculations are somewhat typical but are entirely fictional


