The Bruins I.C.E. Schoolbruins.nhl.com/v2/ext/pdfs/iceschool/201112/G8_Math.pdf · to fill the...
15
Math 8 th Grade The Bruins I.C.E. School Lesson 1: Area and Volume of a Cylinder Lesson 2: Using and Applying the Pythagorean Theorem Lesson 3: Investigating patterns of association in bivariate data Lesson 4: Investigating patterns of association in bivariate data Lesson 5: Understanding the connections between proportional relationships
Transcript of The Bruins I.C.E. Schoolbruins.nhl.com/v2/ext/pdfs/iceschool/201112/G8_Math.pdf · to fill the...

Math 8th Grade
The Bruins I.C.E. School
Lesson 1: Area and Volume of a Cylinder
Lesson 2: Using and Applying the Pythagorean Theorem
Lesson 3: Investigating patterns of association in bivariate data
Lesson 4: Investigating patterns of association in bivariate data
Lesson 5: Understanding the connections between proportional relationships

Math 8th Grade
Lesson 1: Area and Volume of a Cylinder
Concept/Topic to Teach: Students will find the area and volume of a hockey puck. They will than use that information to find how many hockey pucks will cover the area of the ice and how many pucks it would take to fill the playing area of a professional hockey rink. Standards Addressed: 8.G- Solve real-world and mathematical problems involving volume of cylinders, cones and spheres.
General Goal(s): Students will learn how to find the area and volume of a cylinder.
Specific Objectives: Students will find the area of a cylinder (hockey puck) and use that information to see how many pucks will fit on the surface of the ice. Students will also find the volume of a puck and find out how many will fill the playing area.
Required Materials:
• Link: http://www.nhl.com/ice/page.htm?id=27011
• Paper
• Pencil
• Calculator
• Tape
• Hockey puck, if available
• Cube
• Box
Introduction: Inform students that they are going to use the dimensions of a hockey puck to find how many will fill the surface of the arena that the Boston Bruins play on and how many pucks it will take to fill the playing area. Ask students what information they are going to need in order to solve these problems, and how they can go about answering the questions.

Math 8th Grade
Modeling/Explanation
• Review with the students how to find the area and volume of a cube.
• Using a cube, demonstrate how the area of the base takes up space of a larger area.
• Ask the students how then can figure out how many it would take to cover the surface of a desk.
• Using the same cube, demonstrate how the cube takes up space inside a box. Ask how they can figure out how many cubes it would take to fill the box.
Independent Practice
• Give the students a few minutes to use the link above to find the dimensions of a hockey puck, the rink and the boards and glass. You can have them work in pairs if you would like.
• Have them find the formulas to find the area and volume of a cylinder and a rectangle.
• Once they have the dimensions of the puck, have them use that to find the area and volume of the puck.
• Have them then answer the following questions:
• How many hockey pucks does it take to cover surface of the ice in the TD Garden? Please show your work or explain how you solved this problem.
• How many hockey pucks will it take to fill in the playing surface, from the ice to the top of the boards and glass at the TD Garden? Please show your work or explain how you solved this problem.
Differentiated Instruction: Adaptations (For Students with Learning Disabilities)
• Give them the formulas that they need to work with.
• Give the students the area of the ice and the volume of the playing area.
Extensions (For Gifted Students)
• Have the students find the dimensions of the TD Garden and find out how many pucks it would take to fill the whole TD Garden.
Check for understanding Walk around to see that the students have the right formulas for area and volume of cylinders and rectangles Closure/Wrap-Up Have students share their answers with the class to see how close they are to each other's answers. Evaluation Check the students’ work.

Math 8th Grade
Lesson 2: Using and Applying the Pythagorean Theorem
Concept/Topic to Teach: Students will find the unknown length of right triangles formed on the Boston Bruins hockey rink. Standards Addressed: 8.G- Apply the Pythagorean Theorem to determine unknown side lengths in right triangles in real-world and mathematical problems in two and three dimensions. General Goal(s): Students will be able to apply the Pythagorean Theorem to various mathematical problems involving two and three dimensions.
Specific Objectives: Using the hockey rink and player height to find the unknown length in right triangles.
Required Materials:
• Link: http://www.nhl.com/ice/page.htm?id=26458
• Link: http://bruins.nhl.com/club/gallery.htm
• Link: http://bruins.nhl.com/club/roster.htm
• paper
• pencil
• calculator
• ruler
• marker or colored pencil
• a printed copy of the hockey rink
Introduction: Discuss with the students the properties of right triangles. See how many students know the formula for the Pythagorean theorem. Modeling/Explanation:
• Put the formula on the board and ask students how to solve for the unknown length.
• Ask students what can be learned from finding the unknown length.

Math 8th Grade
Independent Practice
• Give each student a copy of the hockey rink and have him or her draw different right triangles on the paper and find the unknown length of each triangle. If you would rather draw the right triangles before giving them the paper you may do so. Have them draw at least two different triangles, more if they time allows.
• Have each student pick a different player from the Bruins line up and find that players height. Use the following link: http://bruins.nhl.com/club/roster.htm to pick their player.
• Inform them that the player is standing at center ice and ask them find the hypotenuse that is formed from the top of the player and the center of the goal. Ask them how would that change if the player is wearing skates (if a student would like to find the how much height is added when the player is wearing and recalculate their hypotenuse, that would get them bonus points).
• Have each student select an image from the Bruins photo gallery and find a right triangle in that image. Using a marker, have them outline the triangle and find the length of each side and create a problem that they can give to another student to solve.
• When all students are done creating their problem, have them switch with another student and solve that problem, showing all of their work.
Differentiated Instruction: Extensions (for gifted students): Have students use the coordinate grid and plot their points to find the slope of the hypotenuse of the player standing at the center of the ice and the center of the goal.
Check for Understanding: Walk around to see that the students are using the formula correctly. Closure/Wrap-Up: Ask students how the can use the Pythagorean Theorem to solve different problems in the real-world Evaluation: Look at each students work from the image and see if they used the formula correctly.
Math 8th Grade
Lesson 3: Investigate patterns of association in bivariate data
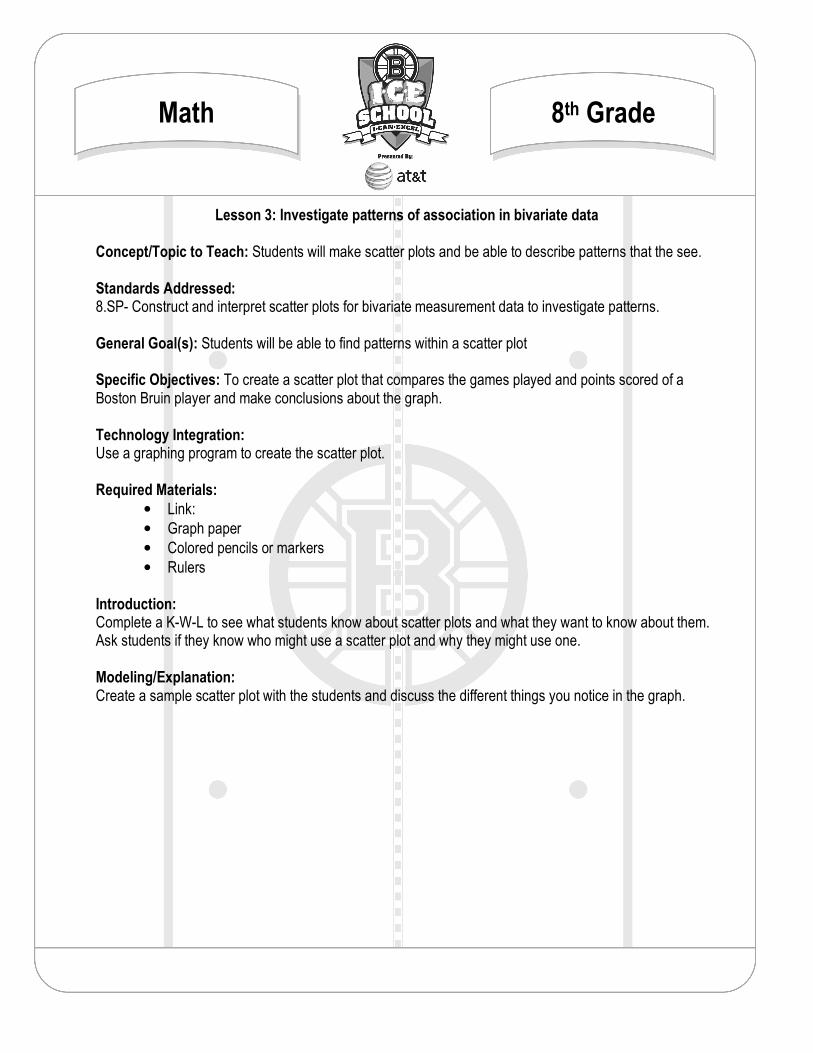
Concept/Topic to Teach: Students will make scatter plots and be able to describe patterns that the see. Standards Addressed: 8.SP- Construct and interpret scatter plots for bivariate measurement data to investigate patterns. General Goal(s): Students will be able to find patterns within a scatter plot Specific Objectives: To create a scatter plot that compares the games played and points scored of a Boston Bruin player and make conclusions about the graph.
Technology Integration: Use a graphing program to create the scatter plot. Required Materials:
• Link:
• Graph paper
• Colored pencils or markers
• Rulers
Introduction: Complete a K-W-L to see what students know about scatter plots and what they want to know about them. Ask students if they know who might use a scatter plot and why they might use one. Modeling/Explanation: Create a sample scatter plot with the students and discuss the different things you notice in the graph.

Math 8th Grade
Independent Practice
• Have each student pick an offensive player from the Bruins roster. Use the following link: http://bruins.nhl.com/club/stats.htm (If they would like to pick a retired Bruins player they may do so.) Have them pick a player that has played for at least 5+ years. Their time does not have to be completely with the Bruins.
• Have each student create a chart that lists the number of games played for each season, and the number of points scored. Remind students that if the player was with 2 different teams for one season that they need to add the games played and points scored from each team together.
• Have them use the information gathered to create a scatter plot. They can use a graphing program to create or create the scatter plot by hand. Inform them that they need to have all components of graph.
• Ask each student to describe at least 3 things they notice from the graph. Differentiated Instruction: Adaptations (For Students with Learning Disabilities)
Give them the graph in which to make their scatter plot
Extensions (For Gifted Students) Have them create two different scatter plots, one for an offensive player and one for defensive player and make comparisons about the players they choose.
Check for Understanding: Walk around to see their graphs and make sure they are plotting the points correctly. Closure/Wrap-Up: Ask students how this might be helpful information to have and how it could be used to make a trade. Evaluation: Check each student's graph and their descriptions make sense.
Math 8th Grade
Lesson 4: Investigate Patterns of Association in Bivariate Data
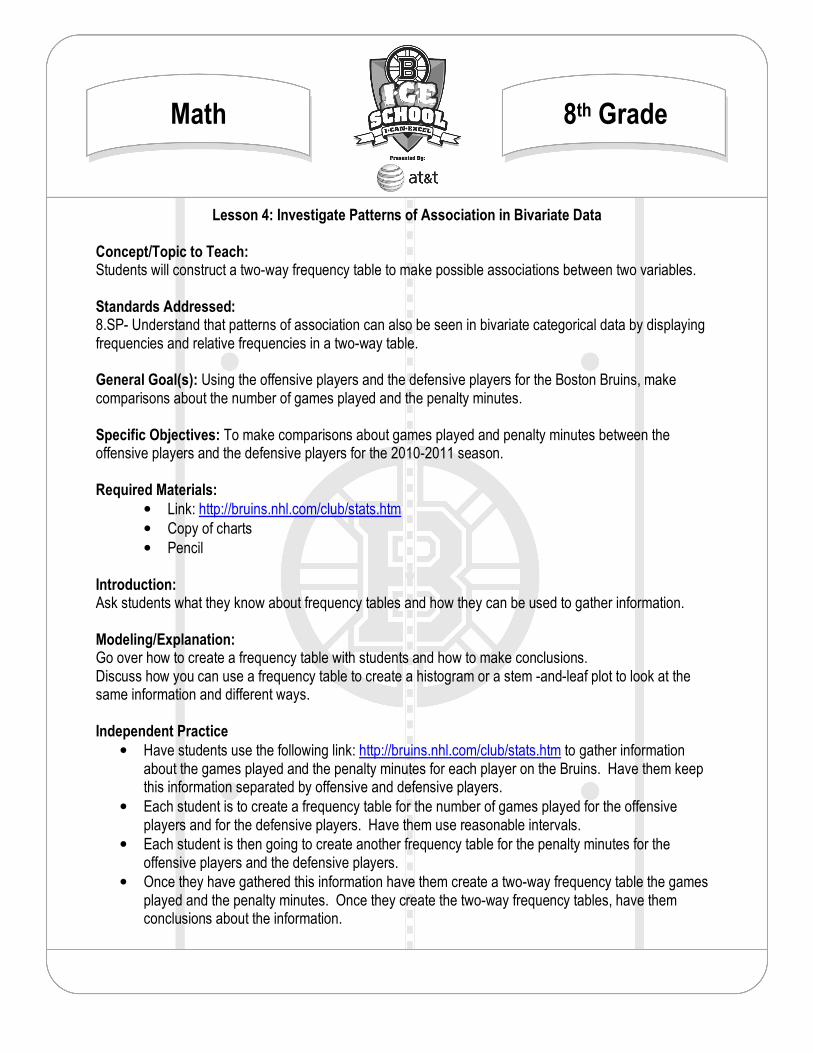
Concept/Topic to Teach: Students will construct a two-way frequency table to make possible associations between two variables. Standards Addressed: 8.SP- Understand that patterns of association can also be seen in bivariate categorical data by displaying frequencies and relative frequencies in a two-way table. General Goal(s): Using the offensive players and the defensive players for the Boston Bruins, make comparisons about the number of games played and the penalty minutes. Specific Objectives: To make comparisons about games played and penalty minutes between the offensive players and the defensive players for the 2010-2011 season. Required Materials:
• Link: http://bruins.nhl.com/club/stats.htm
• Copy of charts
• Pencil Introduction: Ask students what they know about frequency tables and how they can be used to gather information.
Modeling/Explanation: Go over how to create a frequency table with students and how to make conclusions. Discuss how you can use a frequency table to create a histogram or a stem -and-leaf plot to look at the same information and different ways. Independent Practice
• Have students use the following link: http://bruins.nhl.com/club/stats.htm to gather information about the games played and the penalty minutes for each player on the Bruins. Have them keep this information separated by offensive and defensive players.
• Each student is to create a frequency table for the number of games played for the offensive players and for the defensive players. Have them use reasonable intervals.
• Each student is then going to create another frequency table for the penalty minutes for the offensive players and the defensive players.
• Once they have gathered this information have them create a two-way frequency table the games played and the penalty minutes. Once they create the two-way frequency tables, have them conclusions about the information.

Math 8th Grade Differentiated Instruction: Adaptations (For Students with Learning Disabilities) Give students copies of each graph to be filled in. Extensions (For Gifted Students) Have students make histograms and stem-and-leaf plots for their frequency tables. Closure/Wrap-Up: Ask students how this information might be helpful. Evaluation: Check to see that their intervals are even and that the information from their frequency tables match that of the two-way frequency tables.

Math 8th Grade
Offensive Players
Games Played Tally Mark # of players
0-19
20-39
40-59
60-79
80-99
Penalty Minutes Tally Marks # of players
0-29
30-59
60-89
90-119
120-149

Math 8th Grade
Defensive Players
Games Played Tally Mark # of players
0-19
20-39
40-59
60-79
80-99
Penalty Minutes Tally Marks # of players
0-29
30-59
60-89
90-119
120-149

Math 8th Grade
Games Played
0-19 20-39 40-59 60-79 80-99 total
Offensive players
Defensive players
Total
Penalty Minutes
0-29 30-59 60-89 90-119 120-149 total
Offensive players
Defensive players
Total

Math 8th Grade
Lesson 5: Understand the Connections Between Proportional Relationships Concept/Topic to Teach: Students will create two different graphs, and find the slope of each section and make comparisons between the two graphs. Standards Addressed: 8.EE- Graph proportional relationships, interpreting the unit rate as the slope of a graph.
General Goal(s) – To use unit rate to find the slope of various sections of a graph.
Specific Objectives: Using a Boston Bruins goalie that has played for at least 5 years, use the information about their games played to their games won and their games played to their games lost to create graphs and find the connections between them. Technology Integration: Use a graphing program to create graphs and find the slopes. Required Materials:
• Link: http://bruins.nhl.com/club/stats.htm
• Graph paper
• Pencil
• Ruler
• Chart to fill in
Introduction
• Find out what students know about proportions and how to use them to write unit rates.
• Discuss what a unit rate is and how you can use that information to create a graph.
• Ask the students if they know how to find the slope of a line and what the slope tells us. Independent Practice
• Have students fill in the charts for one of the Bruins goalies. The more years they play, the more difficult the graph.
• Once they fill in the charts, have them find the unit rate for each year on the chart.
• Have students make a graph, plotting the year and the unit rate. Once they plot and connect their points, have them find the slope of each section.
• Once both graphs are complete, have them describe any connections they see between the two graphs.

Math 8th Grade
Differentiated Instruction: Adaptations: Have students work in pairs or give them the charts filled in with the games played, games won and games lost. Also, you could provide them with a pre-drawn graph. Extensions: Have students pick any player and find data that can be written as a unit rate and create a graph. Check for Understanding Walk around while the students are creating their graphs to make sure that they are plotting their points correctly. Closure/Wrap-Up Ask students to give an example of how this information can be used. Evaluation Look at the graphs and the comparisons that they made.

Math 8th Grade
Season
Games played
Games won
Unit rate
Season
Games played
Games lost
Unit rate