The Availability and Utilization of 401(k) Loans Files/loans_ced4e8f6-4b31-4170-ab1d...The...
35
The Availability and Utilization of 401(k) Loans John Beshears Stanford University and NBER James J. Choi Yale University and NBER David Laibson Harvard University and NBER Brigitte C. Madrian Harvard University and NBER May 31, 2011 Abstract: We document the loan provisions in 401(k) savings plans and how participants use 401(k) loans. Although only about 22% of savings plan participants who are allowed to borrow from their 401(k) have such a loan at any given point in time, almost half had used a 401(k) loan over a longer, seven-year horizon. The probability of having a loan follows a hump-shaped pattern with respect to age, job tenure, account balance, and salary, but conditional on having a loan, loan size as a fraction of 401(k) balances declines with respect to these variables. Participants are less likely to use loans in plans that charge a higher interest rate, and loans are smaller when plans allow fewer simultaneously outstanding loans, impose a shorter maximum possible loan duration, or charge a lower interest rate. The research reported in this paper was supported by a grant from the U.S. Social Security Administration (SSA), administered by the Retirement Research Consortium (RRC). Additional financial support from the National Institute on Aging (grants R01-AG021650 and T32- AG00186) is gratefully acknowledged. The findings and conclusions expressed are solely those of the authors and do not represent the views of SSA, the NIA, any other agency of the Federal Government, the NBER, or the RRC. See the authors’ websites for a list of their outside activities. We thank Gopi Shah Goda for useful comments on the paper. We also thank Aon Hewitt for providing data and insights into 401(k) loans from the perspective of a plan administrator. We are particularly grateful to Pam Hess, Yan Xu, and Kirsten Bradford for their feedback. We are also indebted to Yeguang Chi, Eric Zwick, Anna Blank, Patrick Turley, John Klopfer, Jung Sakong, Gwendolyn Reynolds, and Chelsea Zhang for their research assistance.
Transcript of The Availability and Utilization of 401(k) Loans Files/loans_ced4e8f6-4b31-4170-ab1d...The...

The Availability and Utilization of 401(k) Loans
John Beshears Stanford University and NBER
James J. Choi
Yale University and NBER
David Laibson Harvard University and NBER
Brigitte C. Madrian
Harvard University and NBER
May 31, 2011 Abstract: We document the loan provisions in 401(k) savings plans and how participants use 401(k) loans. Although only about 22% of savings plan participants who are allowed to borrow from their 401(k) have such a loan at any given point in time, almost half had used a 401(k) loan over a longer, seven-year horizon. The probability of having a loan follows a hump-shaped pattern with respect to age, job tenure, account balance, and salary, but conditional on having a loan, loan size as a fraction of 401(k) balances declines with respect to these variables. Participants are less likely to use loans in plans that charge a higher interest rate, and loans are smaller when plans allow fewer simultaneously outstanding loans, impose a shorter maximum possible loan duration, or charge a lower interest rate. The research reported in this paper was supported by a grant from the U.S. Social Security Administration (SSA), administered by the Retirement Research Consortium (RRC). Additional financial support from the National Institute on Aging (grants R01-AG021650 and T32-AG00186) is gratefully acknowledged. The findings and conclusions expressed are solely those of the authors and do not represent the views of SSA, the NIA, any other agency of the Federal Government, the NBER, or the RRC. See the authors’ websites for a list of their outside activities. We thank Gopi Shah Goda for useful comments on the paper. We also thank Aon Hewitt for providing data and insights into 401(k) loans from the perspective of a plan administrator. We are particularly grateful to Pam Hess, Yan Xu, and Kirsten Bradford for their feedback. We are also indebted to Yeguang Chi, Eric Zwick, Anna Blank, Patrick Turley, John Klopfer, Jung Sakong, Gwendolyn Reynolds, and Chelsea Zhang for their research assistance.

2
Borrowing from defined contribution savings plans, including 401(k) plans, has long
been permissible. Nevertheless, the impact of this borrowing on economic outcomes has only
recently begun to attract attention in the academic and policy worlds. The growth of 401(k)
loans, coupled with the introduction of the 401(k) debit card,1 motivated Senators Herb Kohl and
Michael Enzi to propose legislation that would limit the number of outstanding 401(k) loans to
three per participant and ban 401(k) debit cards outright.2 The concern is that easy access to
one’s retirement nest egg will lead to excessive consumption in the present at the expense of
future financial security.
This paper is the first step in a research agenda on how the availability of 401(k) loans
affects retirement wealth accumulation. The aims of the current paper are descriptive. We
document both the widespread availability and utilization of 401(k) loans. About 90% of 401(k)
participants are in plans that offer a loan option. Within those plans, about one in five eligible
participants has a loan outstanding at a given point in time. Loan utilization rates follow hump-
shaped patterns with respect to age, tenure, compensation, and plan balances, reaching peaks for
participants in their 40s, those with 10 to 20 years of tenure, those earning $40,000 to $60,000
per year, and those with $20,000 to $30,000 in plan balances. Conditional on having a loan, the
loan balance to 401(k) balance ratio is declining in age, tenure, compensation, and 401(k) plan
balance.
Despite the prevalence of 401(k) loans, they constitute only 2.5% of total plan assets
among plans with a loan option (Profit Sharing/401(k) Council of America, 2010). For some
individuals, however, 401(k) loans can be an important source of credit. Our empirical analysis
finds that 401(k) loan utilization is correlated with the types of loan rules adopted by firms.
Loans are more likely to be used in plans that charge low interest rates, and conditional on taking
a loan, loan sizes are larger when multiple loans are allowed to be outstanding simultaneously,
the maximum loan duration allowed is long, and the loan interest rate is high.
The rest of the paper is organized as follows. In Section I, we describe the various
sources of data that we use. Section II discusses the availability of 401(k) loans. In Section III,
we explain how 401(k) loans work and describe the loan features that plan sponsors offer.
Section IV assesses how savings plan participants utilize 401(k) loans. Section V concludes.
1 See Burton (2008) on the 401(k) debit card. 2 The Savings Enhancement by Alleviating Leakage in 401(k) Savings Act of 2011 (SEAL) was submitted to the Senate on May 18, 2011 (http://www.govtrack.us/congress/bill.xpd?bill=s112-1020).
3
I. Data on 401(k) Loans
We exploit several different sources of data on 401(k) loans in this paper: published
statistics, household survey data, firm-level 401(k) plan documents, and participant-level 401(k)
administrative data. We briefly describe each primary data source and its strengths and
weaknesses.
The first source of data is published statistics from a joint data collection effort by the
Employee Benefit Research Institute (EBRI) and the Investment Company Institute (ICI). The
EBRI/ICI database contains administrative data on 401(k) participants and their 401(k) plans
from thousands of firms that are affiliated with either EBRI or ICI. In 1996, the first year for
which such data were collected, the EBRI/ICI database included almost 28,000 401(k) plans with
over 6.5 million plan participants, representing 9% of all 401(k) plans, 18% of all 401(k)
participants, and 31% of all 401(k) assets (VanDerhei et al., 1999). Over time, the coverage of
the EBRI/ICI database has expanded: in 2009, it included almost 52,000 plans covering 21
million participants, representing 10% of all plans, 42% of all participants, and 44% of all assets
(Holden, VanDerhei, and Alonso, 2010). Although the EBRI/ICI database is not a random or
stratified random sample of either 401(k) plans or 401(k) participants, its distributions of total
plan assets and number of plan participants are very similar to those of the entire universe of
401(k) plans,3 making the data fairly representative at least on those dimensions. The 401(k) loan
statistics published for the EBRI/ICI database include the fraction of firms offering 401(k) loans,
the fraction of 401(k) participants utilizing such loans, and the average outstanding balance of
401(k) loans, all reported separately by plan size and by participant demographic characteristics.
The strengths of the EBRI/ICI statistics include their broad coverage of the 401(k) market and
their consistent reporting over the 1996 to 2009 time period. Their weakness is that the sample of
firms included in the calculations is neither constant nor completely representative over time, so
it is never clear whether differences over time and across plan and participant characteristics
represent true differences or just different selection into the sample.
The second source of data is published tabulations from the Employee Benefits Surveys
(EBS) conducted by the Bureau of Labor Statistics. These surveys, which have been conducted
3 Holden, VanDerhei, and Alonso (2009) benchmark the representativeness of the EBRI/ICI database to data published by Cerulli Associates on the entire universe of 401(k) plans.

4
periodically since the early 1980s, were designed to be nationally representative of certain types
of occupations in certain types of firms. The number of firms surveyed is substantially smaller
than the number of firms in the EBRI/ICI database (totaling in the low thousands rather than the
tens of thousands). The strength of these data is their representativeness for the population
covered by the survey design. The weaknesses of the EBS data are several: (1) the survey
population covered is somewhat limited,4 (2) there is a high non-response rate both for firms and
for the questions specific to retirement plans among the firms that did respond,5 (3) the only
statistic reported related to 401(k) loans is the fraction of 401(k) plan participants who are in
plans with a loan option,6 and (4) this statistic was only reported in the 1993, 1995, and 1997
surveys.
The third source of data is published statistics from the Profit Sharing/401(k) Council of
America (PSCA). The PSCA data are derived from a survey of employers offering either profit-
sharing or 401(k) plans and have two advantages over other data. First, they offer a long
historical perspective on loan availability, loan provisions, and loan utilization, with data going
back to 1990 for 401(k) loans.7 Second, the PSCA surveys collect extensive information on the
loan provisions at sampled firms. As with the EBRI/ICI data, the primary weakness of this data
source is that the sample of firms included is neither representative nor constant over time.
The fourth source of data we use is the Survey of Consumer Finances (SCF), a triennial
survey of households. The primary advantages of these data are that the sampling is designed to
be nationally representative (when appropriately weighted), the data are publicly available at the
individual level (as opposed to available only at the aggregate level in the form of summary
statistics, as is the case with the previous three data sources), the data include information about
portions of the household balance sheet other than the employer-sponsored savings plan, and the 4 The survey population is limited to certain occupations in private, non-agricultural, non-household establishments with 100 or more employees. The published numbers on savings plans with a loan option are limited to full-time workers. The Bureau of Labor Statistics (1998) reports that 33.4 million full-time workers fell within the scope of the 1995 survey tabulations, which is much less than half of the full-time private sector labor force in 1995. 5 The Bureau of Labor Statistics (1998) reports that 60% of the establishments selected for the 1995 survey responded. Among responding establishments, 30% of the retirement plan participants represented in the data had their retirement plan provisions imputed due to missing data. 6 A handful of loan-related provisions for other categories of defined contribution savings plans (e.g. savings and thrift plans, deferred profit sharing plans) are reported. These include whether loans are restricted to cases of hardship, whether participants’ full account balances are available to be borrowed, and the length of the repayment period. The vast majority of savings and thrift plans are also 401(k) plans, but the converse is less likely to be true. 7 The PSCA first began surveying firms offering profit-sharing plans in 1957. Over time, as regulatory changes led many profit-sharing plans to incorporate a 401(k) component, the survey framework was adjusted to incorporate 401(k) plans as well as profit-sharing plans.

5
data include questions on savings plan loans going back to 1989. The primary disadvantage of
the SCF is that the questions on savings plan loans are asked only of savings plan participants
(and not of those eligible to participate but not currently participating) and are fairly limited.
Nonetheless, it is the only source of information on the reasons why individuals borrow from
their savings plans.
Our final two sources of data come from Aon Hewitt, a firm that administers many
401(k) plans. The first consists of plan descriptions from years ranging from 2002 to 2004 for 87
401(k) plans that offer loans at 79 large companies. The primary advantage of these data is the
level of detail they give about the loan provisions in these 401(k) plans. The primary
disadvantages are the limited number of firms in the sample and the fact that they are not
representative of the universe of firms offering 401(k) loans, although they may be somewhat
representative of large firms that offer 401(k) loans.
Our second source of data from Aon Hewitt is a series of year-end cross-sections from
2002 to 2008. The cross-sections include individual-level data on all employees eligible to
participate in their companies’ 401(k) plans. They contain demographic information such as birth
date, hire date, gender, and compensation.8 They also contain information on each individual’s
401(k), including participation status in the plan at year-end, date of first participation, monthly
contribution rates, asset allocation, plan balances, and 401(k) loans outstanding at the end of the
year. For participants with a loan, we know the date on which each loan was taken out, the loan
terms (interest rate, amount due per payment, scheduled payment frequency, and total number of
payments due), and whether the loan was delinquent or had been converted to a taxable
withdrawal due to non-payment. The primary advantage of this data source is the amount of
information on loans and other aspects of individuals’ 401(k) accounts. This allows us to
examine in greater detail how 401(k) participants utilize 401(k) loans.
II. Availability of 401(k) Loans
The regulation of 401(k) loans is shared by the Department of the Treasury and the
Department of Labor, the two agencies that jointly regulate tax-favored savings plans.9 Under the
Internal Revenue Code, qualified retirement savings plans may (but are not required to) provide
8 The data on compensation are not reported for all companies. 9 See U.S. GAO (2009) for a summary of the laws that regulate 401(k) loans.

6
plan participants with the option of obtaining one or more loans against their plan balances.10 If
plans do make loans available, they must be made available to all participants on a reasonably
equivalent basis.
There are two sources of data on the fraction of 401(k) plans with a loan option: the
EBRI/ICI database and the PSCA surveys. Using the EBRI/ICI database (which covers many
more firms than the PSCA surveys), Holden, VanDerhei, and Alonso (2010) calculate that 61%
of plans in 2009 include a loan provision. Loan availability is much higher in the PSCA data,
with 88% of plan respondents offering a loan option in 2009 (Profit Sharing/401(k) Council of
America, 2010). Both data sources indicate some increase in the availability of loans over time
(Figure 1). Large plans are more likely to offer a loan provision than small plans (Figure 2). In
the 2009 EBRI/ICI data, 94% of plans with more than 10,000 participants offered loans,
compared to only 35% of plans with 10 or fewer participants (Holden, VanDerhei, and Alonso,
2010). The patterns in the PSCA surveys are similar, although the gradient with respect to plan
size is much smaller.
Because most individuals work in large companies and large plans are more likely to
offer loans, the fraction of 401(k) participants whose plan offers loans is much higher than the
fraction of 401(k) plans that offer loans. In the most current EBRI/ICI data year (2009), 89% of
401(k) participants belong to a plan offering loans, even though only 61% of the plans in the data
offer loans (Holden, VanDerhei, and Alonso, 2010). The fraction of plans with a loan provision
has increased only slightly in the past decade, but the EBRI/ICI data suggest that the fraction of
participants whose savings plan offers a loan option has increased substantially during that time,
from 70% in 1996 to 89% in 2009 (Figure 3). The EBS also collected data on the fraction of
401(k) participants with a loan option during the 1990s. Although the prevalence of loans in the
EBS is much lower than in the EBRI/ICI data, the EBS also shows an increase in loan access
from 43% of participants in 1993 to 51% in 1997 (Bureau of Labor Statistics, 1995, 1998 and
1999).
Note that in 1997, the one year when the two data sources overlap, there is a sizeable
discrepancy in the fraction of participants reported to belong to a plan with a loan option: 51% in
the EBS data versus 79% in the EBRI/ICI data. It is not obvious how to interpret this
10 Qualified plans are those that satisfy the requirements of I.R.C. 401(a), annuity plans that satisfy 403(a) or 403(b), and governmental plans (Internal Revenue Service, 2011). Loans are not permitted from IRAs, SEPs, or other similar plans.

7
discrepancy. Neither sample is completely representative of all 401(k) plans. The EBS is
designed to be representative of certain occupations in private establishments with at least 100
employees, so small employers (and thus small savings plans) and workers in several
occupations are necessarily excluded. The EBRI/ICI database, while not designed to be
representative, does include small plans and appears to be fairly representative of the 401(k) plan
universe on several dimensions; it also covers a sizeable share of the total market. The fact that
the EBRI/ICI number is higher than the EBS number is puzzling given the exclusion of smaller
firms from the EBS data, since loans are less likely to be offered in smaller plans than in larger
ones. If the EBS survey had included smaller firms, the gap between the EBS and EBRI/ICI
estimates of loan availability would have been even larger. Both data sources indicate that 401(k)
loan availability has grown over time, but what is less clear is exactly how many participants had
a loan option available at any particular point in time.
III. 401(k) Loan Provisions
The terms of a 401(k) loan are set by individual savings plans within certain regulatory
bounds. When a loan is made to a 401(k) participant, the plan liquidates some of its assets to
make the loan disbursement. The participant is then responsible for the timely repayment of the
loan. Loan payments, which include both principal and interest, are made with after-tax dollars
and are credited to the participant’s account, transferring principal back into the participant’s
investments.
There are no regulatory restrictions on how the proceeds from a 401(k) loan may be used;
nor are borrowers required to demonstrate financial need.11 Plan sponsors have discretion to
impose such restrictions if desired, but most do not. The PSCA (1999) reports that among
savings plans with a loan option, 82% place no restrictions on how loan proceeds may be
utilized.12 Of the 18% of plans with restrictions, most allow loans for home purchases, education,
and medical expenses.
11 In contrast, hardship withdrawals—which plans are allowed but not required to offer—are limited by regulation to be used for “immediate and heavy” expenditures for which no other resources are available. Allowable expenditures include medical expenses, educational expenses, burial or funeral expenses, expenditures related to the purchase of a home, and payments necessary to forestall eviction or foreclosure. 12 Restrictions are more common in profit sharing plans (27%) than in 401(k) plans (16%), and are more common in smaller plans than in larger ones (Profit Sharing/401(k) Council of America). Similarly, data from the EBS suggest that only 7% of savings and thrift plans place restrictions on how loan proceeds may be used (most savings and thrift plans are 401(k) plans).

8
There are, however, regulations on the maximum size of 401(k) loans. The total
outstanding principal of all unpaid loans can be no larger than the minimum of 50% of a
participant’s vested account balance and $50,000 (employers can place additional size limits).13
The only information we have on the actual maximum limits that plan sponsors place on 401(k)
loan size comes from our sample of Aon Hewitt plan descriptions. In this sample, all plans
adhere to the statutory limits, although some do so with some minor modifications.14
Plans can also place restrictions on the minimum loan size. In the 2009 PSCA annual
survey, only 3% of plans report having no minimum loan limit. Twelve percent of plans report a
positive limit of $500 or less; 84% report a limit between $501 and $1,000; and the remaining
2% report some other limit. In our sample of Aon Hewitt plan descriptions (Table 1), the
minimum loan amounts are roughly in line with those in the PSCA survey: 28% have a minimum
loan amount of $500 or less15; 69% have a minimum loan amount between $501 and $1,000; and
3% have a minimum loan amount greater than $1,000.
Plans are allowed to charge both an application fee and an annual service fee for each
401(k) loan. Survey data from the PSCA suggest that such fees are becoming more common. In
the 1990 PSCA survey, only 26% of plans reported having loan fees; in the 2009 survey, this
number had risen to 90%. The most common fee is a loan origination or application fee, which
85% of 2009 PSCA plans report having; among these plans, the median application fee is $75.
Twenty-eight percent of plans report charging an annual maintenance fee, with a median amount
of $25. Ten percent of plans report charging some other sort of fee. In our sample of Aon Hewitt
plan descriptions, 43% either report having no fees or make no mention of any fees (Table 1). Of
the remaining plans, none report having any fees other than application fees, which range from
$25 to $100 for general purpose loans, with a median of $50.16
13 The regulatory language also suggests that employers have discretion to allow loans of up to $10,000, even if this exceeds the limit of 50% of a participant’s vested balance. Conversations with plan administrators suggest that in practice this is rarely allowed because of concerns that doing so could violate regulatory provisions in ERISA. Participants affected by the 2005 hurricanes Katrina, Rita, or Wilma face a higher limit: the lesser of $100,000 or 100% of the participant’s account balance. 14 Other restrictions included additional limits on loan amounts for participants with assets allocated to a self-directed brokerage window or employer stock. 15 Only one firm in the Aon Hewitt sample has a loan minimum of less than $500. 16 Two of the plans in the Aon Hewitt sample have a higher fee for primary residence loans than for general purpose loans. One company has a higher fee for loans requested through a benefits representative than for loans requested on the benefits website, and we use the lower fee for Table 1.
9
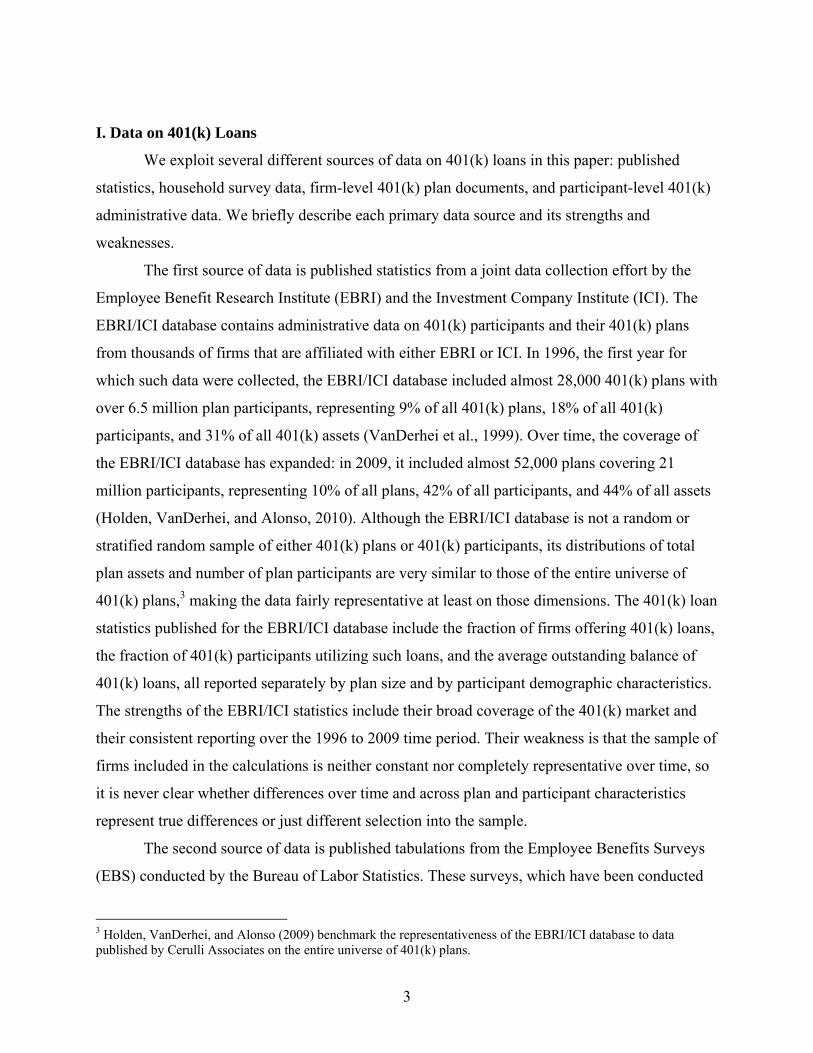
Employers may allow participants to have more than one loan outstanding
simultaneously, although the loans would in total be subject to the maximum loan size
restrictions noted previously. In the latest PSCA survey, about half of plans allow participants to
have more than one loan outstanding. Large plans are much more likely to allow multiple loans
than small plans: for example, 38% of plans with fewer than 50 participants allow multiple loans,
while 57% of plans with over 5,000 participants do. Figure 4 shows the distribution of the
maximum number of loans allowed in the 2009 PSCA survey.17 Most (52%) allow only one
loan, 37% allow two loans, and 8% allow three loans. Only 3% of plans allow four or more
loans. In our sample of Aon Hewitt plan descriptions, 33% restrict participants to only one loan,
56% allow participants to take out two loans, and 10% allow three or more loans (Table 1).
Employers have some discretion in establishing loan repayment procedures. Regulations
require that loan payments be made at least quarterly and pay down both principal and interest.
In practice, many companies use automatic payroll deduction for loan repayments, so loan
payments are made on a monthly or biweekly basis. The amortization period for a 401(k) loan
can typically be chosen by participants within a set of constraints established by the plan. These
constraints are dictated in part by regulatory requirements. One such requirement is that general
purpose loans must be repaid within five years, although employers can choose a shorter
maximum repayment horizon. Employers can establish a longer repayment period for loans
taken for investment in a primary residence. Early repayment of loans (potentially with a
prepayment penalty) is also allowed.18
Our source of information on the distribution of both minimum and maximum loan
amortization periods is the sample of Aon Hewitt plan descriptions (Table 1). In this sample,
about two-thirds of plans have a minimum duration of more than six months for general purpose
loans; the rest either do not specify a minimum repayment period or specify a shorter minimum
repayment period (usually one or six months). Almost three-quarters of plans have a maximum
repayment period of five years for general purpose loans, the statutory maximum; the remaining
quarter either do not specify a maximum repayment period or specify a shorter repayment
period, usually between four and five years. 17 This figure includes both profit-sharing and 401(k) plans, as the PSCA does not report the distribution of permissible loans separately by defined contribution plan type. The fraction of plans that allow more than one loan is reported separately by plan type, and this fraction is similar for both types of plans. 18 Prepayment penalties appear to be rare. None of the plans in our Aon Hewitt sample of plan descriptions imposes a prepayment penalty.

10
Of the plans in the Aon Hewitt plan description sample, all offer general purpose loans,
and 74% allow both primary residence and general purpose loans (Table 1). The main distinction
between general purpose and primary residence loans is that the latter can have a longer
repayment period and the plan must verify that the loan is being used for a primary residence.
Primary residence loans require both additional documentation from applicants and additional
processing by plan sponsors.19 As with general purpose loans, the modal minimum repayment
period for primary residence loans is twelve months, but plans often stipulate a longer minimum
loan duration. Forty-two percent of the Aon Hewitt plans have a minimum repayment period
exceeding twelve months for a primary residence loan, and a minimum repayment period of five
to six years is the most common within this subset of plans. The maximum repayment period for
primary residence loans varies widely across plans, ranging from 117 months to 360 months. The
modal maximum repayment duration is 180 months (fifteen years).
Loan repayments are made with after-tax dollars and are not counted as plan
contributions (and thus do not count against annual plan contribution limits), even though both
the principal and interest payments are credited to participants’ accounts. Interest payments are
not tax deductible, even if the purpose of the loan was for a primary residence, because the loan
is not secured by the residence as the IRS requires for mortgage interest tax deductibility.
Plans have discretion in determining the interest rate for 401(k) loans, although the
interest rate chosen must be reasonable, meaning that it must be similar to what other financial
institutions are charging for similar types of loans. In practice, most savings plans that allow
loans peg their interest rate to the prime rate. In the most recent PSCA survey that reports how
plans determine their 401(k) loan interest rate, 86% of plans report pegging their interest rate to
the prime rate. In our sample of Aon Hewitt plan descriptions, 91% of plans peg their interest
rate to the prime rate (Table 1). There is, however, variation in the spread between the prime rate
and the 401(k) loan rate. Twenty-five percent of Aon Hewitt plans set their interest rate equal to
the prime rate, 60% set it to the prime rate plus 0 to 1% (not including 0), and 6% set it to the
prime rate plus 1 to 2% (not including 1). There is also some variation in the frequency with
which 401(k) loan interest rates are updated. Most (54%) of the Aon Hewitt plans adjust their
19 In plans that do not offer both general purpose and primary residence loans, participants can apply for a general purpose loan and use the proceeds for their primary residence. Such a loan would not require additional documentation regarding its purpose and would have to be repaid in five years (or less, if the plan has a shorter maximum loan duration).

11
interest rate monthly, but 33% adjust only quarterly, 5% adjust daily, and the rest adjust at some
other frequency (including one plan that adjusts only once a year). This increases variation in
401(k) loan interest rates across plans during periods when the prime rate is changing frequently.
We can look at the participant-level data from our sample of Aon Hewitt plans to get a
sense for how 401(k) interest rates vary across firms and how they have evolved over time. We
use the set of 27 plans at 25 companies for which we have year-end data in every year from 2002
to 2008. For each company, we calculate the modal interest rate of loans originated in each
month.20 Because we have data not only on newly originated loans, but also on all loans
outstanding at year-end, we can examine interest rates prevailing before the initial 2002 cross-
section to the extent that loans taken out before that time have not yet been fully repaid by year-
end 2002. This gives us a long time series of interest rates. Figure 5A shows, across these 27
plans, the median, 25th, and 75th percentile of firm-level modal interest rates by loan origination
month. The difference between the 25th and 75th percentile interest rates across firms is almost
always 100 basis points. As expected, given how 401(k) loan interest rates are set, the median
interest rate tracks the prime interest rate fairly closely, as seen in Figure 5B.
If a participant defaults on his or her loan, the outstanding balance at the time of default is
treated as a taxable distribution from the plan and is subject to the 10% early withdrawal penalty
for participants under the age of 59½.21 If a participant’s employment is terminated, most
companies stipulate that the loan must be repaid in full within a reasonable period of time, or the
outstanding loan balance is treated as a taxable distribution from the plan. Some companies,
however, may allow terminated employees to continue repaying their 401(k) loans over a longer
period of time. The Aon Hewitt plan descriptions show some heterogeneity across firms as to
when a loan is deemed to be in default and when it becomes a taxable distribution, but generally,
terminated participants have 60 to 90 days to repay a loan before it becomes a taxable
distribution. Current employees of the company have a similar amount of time to become current
on a loan whose payments are in arrears.
20 There tends to be little heterogeneity in interest rates among loans originated in a particular plan in a given month. However, loan interest rates can vary within a plan for a given month due to within-month movements in the prime rate, differential delays between loan application and disbursement, and participants of acquired firms who took out loans under their former plans. This is why we use the modal interest rate, which is almost always identical to the median interest rate (and often is also the 5th percentile and 95th percentile interest rate) among loans originated in a particular plan-month. 21 Plans may suspend loan payments for employees on active military duty. They may also suspend payments for employees on non-military leave for up to one year.

12
IV. 401(k) Loan Utilization
We now turn to an assessment of how individuals use 401(k) loans. Figure 6 plots the
fraction of 401(k) participants in plans with a loan option who have at least one outstanding
401(k) loan, as reported by the PSCA, as reported by the Investment Company Institute (using
the EBRI/ICI data), and from our own calculations using the Aon Hewitt participant-level data.
In the EBRI/ICI data, the fraction of participants with a loan has been relatively stable over time,
ranging between 16% and 21%. The fraction of participants with a loan is somewhat higher in
the PSCA surveys, ranging from 19% to 33%, although it stabilized around 24% during the past
several years. In the Aon Hewitt data, a nearly constant 21% to 22% of participants have an
outstanding loan at year-end between 2002 and 2008.22 If we restrict the Aon Hewitt sample to
participants who remain employed at the same company for all seven years, an average of 31%
have a loan in any given year, but a much higher 44% have a loan at some point during the entire
seven-year period. Annual loan utilization figures are thus likely to substantially understate the
fraction of participants who could be affected by a change in plan loan policies or federal
regulations of 401(k) loans.
In the first two columns of Table 2, we report, separately by demographic characteristics,
the fraction of participants who have a 401(k) loan in 401(k) plans that allow loans. The numbers
in column 1 are from the EBRI/ICI data for calendar year 2008, and the numbers in column 2 are
from the Aon Hewitt participant-level data at year-end 2008. Loan utilization follows a hump
pattern with respect to age, peaking in the 40s at 22% in the EBRI/ICI data and 26% in the Aon
Hewitt data. Employees in their 20s or 60s have substantially lower loan utilization rates
(between 10% and 14%). Loan utilization also follows a hump pattern with respect to tenure,
peaking at 26% in the EBRI/ICI data and 33% in the Aon Hewitt data for employees with 10 to
20 years of tenure. Employees with two or fewer years of tenure have very low utilization rates,
likely reflecting the fact that employees must accumulate some balances in their savings plan
before they can take out a loan. Loan utilization rates are fairly flat around 25% (EBRI/ICI) and
30% (Aon Hewitt) across much of the distribution of plan assets, but show a marked decline
once plan balances exceed $200,000 or fall below $10,000. For low-balance participants, loan
22 These numbers are very similar to the results of internal calculations by Aon Hewitt on the fraction of their plan participants with a 401(k) loan over the same time period (Aon Hewitt, 2011).

13
utilization is limited by institutional constraints. First, in most firms, taking out a loan is not
feasible until participants have reached a certain level of balances due to restrictions on the
minimum loan size (see Table 1). Second, loans are restricted to be no more than 50% of vested
balances. This restriction, coupled with application fees, means that a 401(k) loan may be
economically unattractive for participants with low plan balances. Loan utilization rates are
highest for middle-income participants ($40,000 to $60,000 in annual compensation) and lower
for those with very low incomes or very high incomes.
Figure 7 plots the time series of average total outstanding loan balances divided by plan
balances among participants who have an outstanding 401(k) loan.23 In the EBRI/ICI data, loan
balances as a fraction of balances have varied between 12% and 16% over the 1996 to 2009 time
period but exhibit no clear trend. Our sample of Aon Hewitt participants shows a similar pattern
during the years it overlaps with the EBRI/ICI data, although the average loan-to-balance ratio is
higher, ranging from 19% to 23%.
As with loan utilization, there are significant differences in the size of outstanding loan
balances relative to 401(k) balances across different demographic groups. These are shown in the
third column of Table 2 using the EBRI/ICI data from 2008 and in the fourth column using the
Aon Hewitt data at year-end 2008. In both data sets, loan balances relative to plan balances
decrease with age, tenure, plan balances, and salary.
Figure 8 shows the average nominal dollar value of outstanding 401(k) loan balances as
reported by the PSCA, reported by the Investment Company Institute (using the EBRI/ICI data),
and from our own calculations using the Aon Hewitt data. Average outstanding balances are very
similar across all three data sources and are about $7,500 in 2008. They have increased slightly
over time in the EBRI/ICI data and somewhat more substantially in the PSCA data.
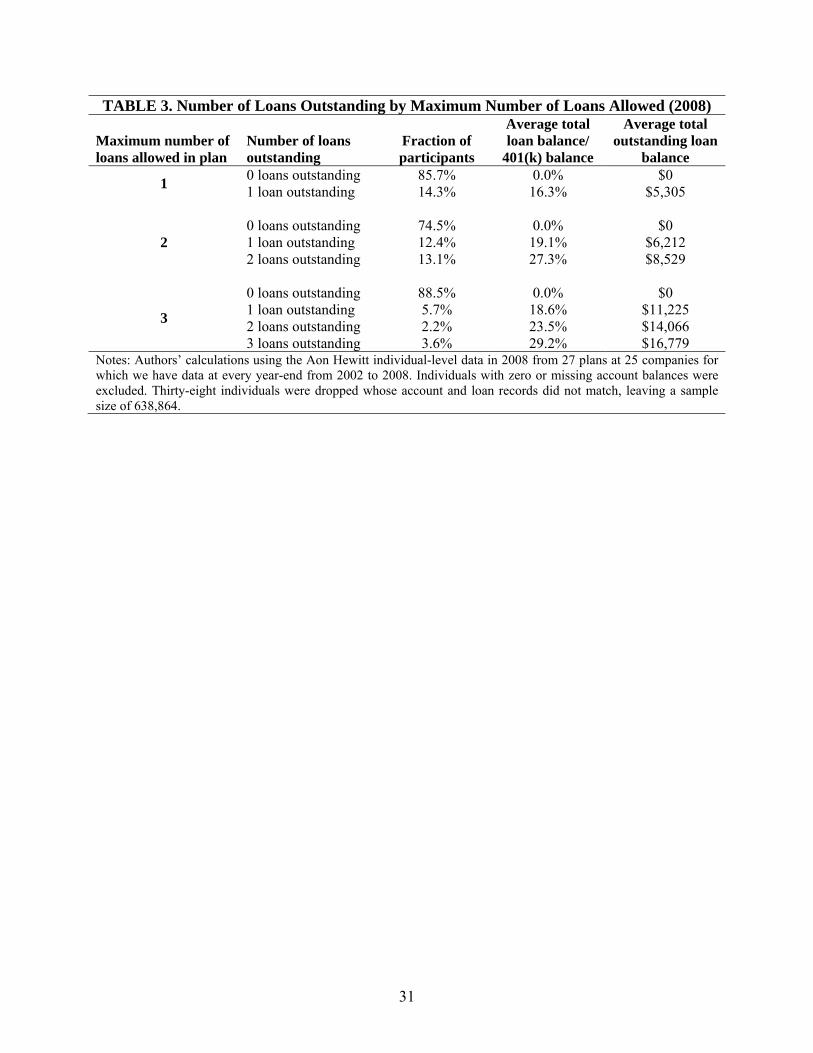
Table 3 shows the distribution of the number of loans per participant in our 2008 Aon
Hewitt participant-level sample, separately by the maximum number of loans allowed by the
plan. There is no clear relationship between the number of loans allowed by a plan and the
fraction of participants with an outstanding loan; loan utilization is highest in the plans that allow
a maximum of two loans. The last two columns of Table 3 show the average total outstanding
23 For participants with more than one 401(k) loan outstanding at a given time, the numerator sums loan balances across all the participant’s outstanding loans. The denominator reflects total plan balances that do not net out outstanding loan balances. Private correspondence with Jack VanDerhei indicates that the Investment Company Institute reports erroneously describe the EBRI/ICI denominator as netting out loan balances.

14
loan to balance ratio and the average total outstanding loan balance by the number of outstanding
loans held by participants. Both the loan to balance ratio and the total outstanding loan balance
increase with the number of loans outstanding. Among participants with only one outstanding
loan, loans represent 16% to 19% of total balances; among participants with two outstanding
loans, loans represent 24% to 27% of total balances; and among participants with three
outstanding loans, loans represent 29% of total balances. Average outstanding loan balances
range from $5,305 to $11,225 among participants with only one loan to $16,779 among
participants with three loans.
Because many of the demographic characteristics associated with loan utilization and the
size of loan balances are highly correlated with each other, Table 4 reports results from
regressions of loan utilization and loan balances as a fraction of total balances (conditional on
having a loan outstanding) on demographic and plan characteristics using the Aon Hewitt
participant-level data from the year-end closest to the date of the plan description that we have
(2002, 2003 or 2004).24 The sample in these regressions—participants in 87 plans at 79
companies that offer loans—is much larger than in our previous analysis because we do not
require continuous data coverage from 2002 to 2008. Columns 1 and 2 show linear probability
regression coefficients and standard errors where the dependent variable is a dummy for having a
401(k) loan outstanding and the only explanatory variables are dummies for demographic
characteristics. Columns 3 and 4 add a set of plan loan feature dummy variables: whether the
plan offers primary residence loans, the maximum number of loans permitted by the plan, how
the loan interest rate is set, whether there is an application fee, whether the minimum loan
amount for a general purpose loan is greater than $500, the minimum loan duration for a general
purpose loan, and whether the maximum loan duration for a general purpose loan is less than
five years. In columns 5 and 6, the dependent variable is loan balances as a fraction of total
balances, and the only explanatory variables are demographic variables; columns 7 and 8 add
plan feature controls.
Some of the coefficients on the demographic variables show patterns that differ from
those shown in Table 2. Instead of following a hump shape, the probability of having a loan
24 Because plans change their provisions over time, restricting the data to the year-end extract that is closest to the plan description date reduces measurement error in the plan variables. This means that the data in the regression come from different years. The statistics on loan utilization in the Aon Hewitt and EBRI/ICI data are fairly stable over time, so some mixing across the relatively short span of three years should not be problematic.

15
increases with tenure and decreases with compensation. The loan-to-total balance ratio is hump-
shaped with respect to age and increasing with respect to compensation, rather than decreasing
with respect to these variables. Using administrative data from Vanguard, Mitchell and Lu
(2010) find similar relationships between demographic characteristics and loan utilization. The
patterns of the demographic coefficients do not change much when the plan feature controls are
added.
A few interesting patterns emerge from the coefficients on the 401(k) loan features in
columns 3 and 7 of Table 4. Conditional on demographic characteristics, the probability of
having a loan outstanding decreases with the loan interest rate; participants in plans that charge
more than prime plus one are 10 percentage points less likely to borrow against their balances
than participants in plans that charge only the prime rate. However, the size of loans that do get
taken out are slightly larger (4% of total balances) in plans that charge more than prime plus one
than in plans that charge the prime rate. Mitchell and Lu (2010) also find that a higher loan
interest rate is related to a lower probability of having a 401(k) loan but a higher loan balance
conditional on having a loan. Imposing a maximum general purpose loan duration of less than
five years is associated with a decrease in loan size of 2% of total balances, and allowing more
loans outstanding is associated with larger loan-to-balance ratios. Surprisingly, the probability of
having a loan is highest in plans that allow up to two loans outstanding as compared to plans that
allow either only one or more than two loans outstanding. It is difficult to think of a causal
mechanism running from number of loans allowed to loan utilization that would generate this
pattern. Similarly, the negative correlation between the probability of loan utilization and the
option to take out a primary residence loan seems unlikely to be caused by the loan rule.
Table 5 reports the distribution of characteristics for 401(k) loans originated from 2002 to
2008 in our Aon Hewitt participant-level data. The sample is again restricted to the 27 plans for
which we have continuous data coverage over the entire time span. The vast majority of loans—
97%—are general purpose loans rather than primary residence loans.25 The administrative data
give no further insights into the purposes for which individuals take out 401(k) loans. The
Survey of Consumer Finances, however, does collect more detailed information on the reasons
why individuals borrow from their retirement savings plans. These are presented in Table 6 for
25 Utkus and Young (2010) and Lu and Mitchell (2010) report that a similarly high fraction of loans in Vanguard administered savings plan are general purpose loans.
16
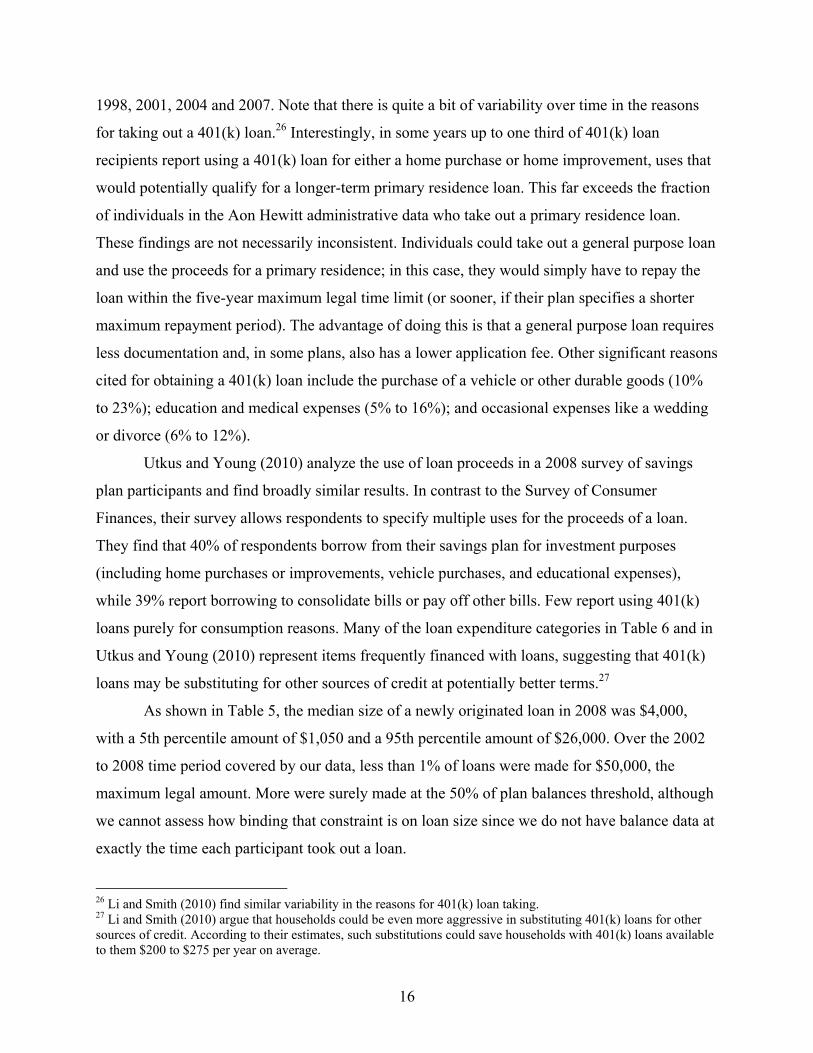
1998, 2001, 2004 and 2007. Note that there is quite a bit of variability over time in the reasons
for taking out a 401(k) loan.26 Interestingly, in some years up to one third of 401(k) loan
recipients report using a 401(k) loan for either a home purchase or home improvement, uses that
would potentially qualify for a longer-term primary residence loan. This far exceeds the fraction
of individuals in the Aon Hewitt administrative data who take out a primary residence loan.
These findings are not necessarily inconsistent. Individuals could take out a general purpose loan
and use the proceeds for a primary residence; in this case, they would simply have to repay the
loan within the five-year maximum legal time limit (or sooner, if their plan specifies a shorter
maximum repayment period). The advantage of doing this is that a general purpose loan requires
less documentation and, in some plans, also has a lower application fee. Other significant reasons
cited for obtaining a 401(k) loan include the purchase of a vehicle or other durable goods (10%
to 23%); education and medical expenses (5% to 16%); and occasional expenses like a wedding
or divorce (6% to 12%).
Utkus and Young (2010) analyze the use of loan proceeds in a 2008 survey of savings
plan participants and find broadly similar results. In contrast to the Survey of Consumer
Finances, their survey allows respondents to specify multiple uses for the proceeds of a loan.
They find that 40% of respondents borrow from their savings plan for investment purposes
(including home purchases or improvements, vehicle purchases, and educational expenses),
while 39% report borrowing to consolidate bills or pay off other bills. Few report using 401(k)
loans purely for consumption reasons. Many of the loan expenditure categories in Table 6 and in
Utkus and Young (2010) represent items frequently financed with loans, suggesting that 401(k)
loans may be substituting for other sources of credit at potentially better terms.27
As shown in Table 5, the median size of a newly originated loan in 2008 was $4,000,
with a 5th percentile amount of $1,050 and a 95th percentile amount of $26,000. Over the 2002
to 2008 time period covered by our data, less than 1% of loans were made for $50,000, the
maximum legal amount. More were surely made at the 50% of plan balances threshold, although
we cannot assess how binding that constraint is on loan size since we do not have balance data at
exactly the time each participant took out a loan.
26 Li and Smith (2010) find similar variability in the reasons for 401(k) loan taking. 27 Li and Smith (2010) argue that households could be even more aggressive in substituting 401(k) loans for other sources of credit. According to their estimates, such substitutions could save households with 401(k) loans available to them $200 to $275 per year on average.
17
Despite the fact that most plans do allow participants to take out a general purpose loan
for the full legal maximum duration of five years, most participants choose a much shorter
repayment period. In 2008, 19% of loans were taken out with a repayment period of less than
two years; another 18% had a repayment period of two to three years. Only 26% had a
repayment period of five years or more.
The distribution of interest rates for new loans originated between 2002 and 2008 is also
shown in Table 5.28 Over the entire 2002 to 2008 period, interest rates largely fall in the range of
4.00% to 9.25%. The median monthly repayment amount for new loans is $130 in 2008, but the
5th percentile repayment amount is just $31 per month, whereas the 95th percentile repayment
amount is $603 per month.
V. Conclusion
This paper has documented the types of loan provisions in 401(k) savings plans and how
participants use 401(k) loans. While a minority of savings plan participants use 401(k) loans at
any given point in time—about 22% in our calculations based on participant-level data from Aon
Hewitt—a much higher fraction will use a 401(k) loan over a longer period of time—slightly
fewer than half of those whom we observe over a seven-year period from 2002 through 2008.
401(k) loan utilization varies with demographic characteristics. The fraction of
participants with a loan at a point in time follows a hump-shaped pattern with respect to age,
tenure, salary, and plan balances, whereas the size of outstanding loan balances as a fraction of
plan balances (conditional on having a loan outstanding) is decreasing in these characteristics.
When these variables are controlled for simultaneously in a regression, the probability of having
a loan is still hump-shaped with respect to age and balances, but it is increasing in tenure and
decreasing in compensation; normalized loan size conditional on having a loan is still decreasing
with respect to tenure and balances, but hump-shaped with respect to age and increasing with
respect to compensation. Some plan characteristics are also correlated with loan utilization.
Participants are less likely to use a loan in plans that charge a higher interest rate, and conditional
on having a loan, total loan balances are smaller as a fraction of plan balances when fewer loans
can be outstanding at once, the interest rate is low, and the maximum loan duration allowed is
28 This distribution differs from that shown in Figure 5 in that Figure 5 counts each plan-month mode as one observation, whereas Table 5 counts each loan as one observation.

18
short. However, these correlations must be interpreted with caution, since some of them—such
as the negative correlation between a plan offering a primary residence loan and the probability
that its participants take out a loan—seem inconsistent with a causal mechanism running from
the plan feature to loan utilization.
19
References Burton, Jonathan (2008). “Critics Detail the Ills of 401(k) Debit Cards,” Wall Street Journal, July
22, 2008, page D6, http://online.wsj.com/article/SB121668972397572373.html (accessed August 1, 2008).
Bureau of Labor Statistics (1995, 1998, 1999). “Employee Benefits in Medium and Large Private
Establishments.” Washington, DC: U.S. Department of Labor, Bureau of Labor Statistics. Aon Hewitt (2011). Leakage of Participants DC Assets: How Loans, Withdrawals, and Cashouts
are Eroding Retirement Income. http://www.aon.com/attachments/thought-leadership/survey_asset_leakage.pdf (accessed May 26, 2011).
Holden, Sarah, Jack VanDerhei and Luis Alonso (2009). “401(k) Plan Asset Allocation, Account
Balances, and Loan Activity in 2008.” Investment Company Institute Research Perspective, Vol. 15, No. 2 (October 2009) http://www.ici.org/pdf/per15-02.pdf (accessed September 27, 2010).
Holden, Sarah, Jack VanDerhei, and Luis Alonso (2010). “401(k) Plan Asset Allocation,
Account Balances, and Loan Activity in 2009.” Investment Company Institute Research Perspective, Vol. 16, No. 3 (November 2010) http://www.ici.org/pdf/per16-03.pdf (accessed April 27, 2011).
Internal Revenue Service, United States Department of Treasury (2011). “Retirement Plans
FAQs Regarding Loans.” http://www.irs.gov/retirement/article/0,,id=162415,00.html (accessed April 20, 2011)
Li, Geng and Paul A. Smith (2010). “401(k) Loans and Household Balance Sheets.” National
Tax Journal 63(3), pp. 479-508. Lu, Timothy Jun and Olivia S. Mitchell (2010). “Borrowing from Yourself: The Determinants of
401(k) Loan Patterns.” University of Michigan Retirement Research Center Working Paper No. 2010-221.
Profit Sharing/401(k) Council of America (1999). “Plan Loan Restriction Study.”
(http://www.psca.org/RESEARCHDATA/PlanLoanRestrictionStudy/tabid/176/Default.aspx (accessed July 10, 2008).
Profit Sharing/401(k) Council of America (various). “Annual Survey of Profit Sharing and
401(k) Plans.” Profit Sharing/401(k) Council of America, Chicago, IL. Profit Sharing/401(k) Council of America. “401(k) Loans: When you need your money NOW.”
http://www.401k.org/401kloans.html (accessed July 10, 2008) Utkus, Stephen P. and Jean A. Young (2010). “Financial Literacy and 401(k) Loans.” Pension
Research Council Working Paper WP2010-28.

20
U.S. Government Accountability Office (2009). “401(k) Plans: Policy Changes Could Reduce
the Long-Term Effects of Leakage on Workers’ Retirement Savings,” GAO-09-715. VanDerhei, Jack, Russell Galer, Carol Quick, and John Rea (1999). “401(k) Plan Asset
Allocation, Account Balances, and Loans.” Investment Company Institute Perspective, Vol. 5, No. 1 (January 1999) http://www.ici.org/perspective/per05-01.pdf (accessed July 9, 2008).

21
0
20
40
60
80
100
1990 1992 1994 1996 1998 2000 2002 2004 2006 2008
Fraction
of 4
01(k) P
lans with
a Loan
Option
Year
FIGURE 1. Fraction of 401(k) Plans with a Loan Option (1990‐2009)
EBRI/ICI PSCA
Notes: EBRI/ICI statistics come from a series of Investment Company Institute reports starting in 1999, including the first report by VanDerhei et al. (1999) and the most recent report by Holden, VanDerhei, and Alonso (2010). PSCA statistics come from various issues of the Profit Sharing/401(k) Council of America’s “Annual Survey of Profit Sharing and 401(k) Plans.”

22
35
5970
7580 83
88 88 91 90 94
0
20
40
60
80
100
1 to 10
11 to
25
26 to
50
51 to
100
101 to 250
251 to 500
501 to 100
0
1001
to 250
0
2501
to 500
0
5001
to 100
00
>10000Fraction
of 4
01(k) P
lans with
a Loan
Option
Plan Size (number of participants)
FIGURE 2A. 401(k) Loan Availability by Plan Size: EBRI/ICI (2009)
Notes: Holden, VanDerhei, and Alonso (2010).
89 8691 92 92
0
20
40
60
80
100
1‐49
50‐199
200‐99
9
1000
‐499
9
5000
+
Fraction
of 4
01(k) P
lans with
a Loan
Option
Plan Size (number of participants)
FIGURE 2B. 401(k) Loan Availability by Plan Size: PSCA (2009)
Notes: Profit Sharing/401(k) Council of America, “Annual Survey of Profit Sharing and 401(k) Plans.”

23
0
20
40
60
80
100
1990 1992 1994 1996 1998 2000 2002 2004 2006 2008
Fraction
of 4
01(k) P
articipa
nts
Year
FIGURE 3. Fraction of 401(k) Participants in a Plan with a Loan Option (1990‐2009)
EBRI/ICI EBS
Notes: EBRI/ICI statistics come from a series of Investment Company Institute reports starting in 1999, including the first report by VanDerhei et al. (1999), and the most recent report by Holden, VanDerhei and Alonso (2010). EBS statistics come from various issues of the Department of Labor’s “Employee Benefits in Medium and Large Private Establishments.”

24
52
37
8
0 1 2
0
10
20
30
40
50
60
1 2 3 4 5 6+
Fraction
of p
rofit‐sharing an
d 401(k) p
lans
Maximum number of loans
FIGURE 4. Maximum Number of Loans Allowed: PSCA (2009)
Notes: PSCA statistics come from the Profit Sharing/401(k) Council of America’s “Annual Survey of Profit Sharing and 401(k) Plans.”

25
0
2
4
6
8
10
12
Jan‐97
Jul‐9
7
Jan‐98
Jul‐9
8
Jan‐99
Jul‐9
9
Jan‐00
Jul‐0
0
Jan‐01
Jul‐0
1
Jan‐02
Jul‐0
2
Jan‐03
Jul‐0
3
Jan‐04
Jul‐0
4
Jan‐05
Jul‐0
5
Jan‐06
Jul‐0
6
Jan‐07
Jul‐0
7
Jan‐08
Jul‐0
8
Loan
Interest Rates
(25th, 50th, and
75th pe
rcen
tile)
Loan Origination Date
FIGURE 5A. Distribution of 401(k) Loan Interest Rates:1997‐2008
Notes: Authors’ calculations using the Aon Hewitt loan-level data on 531,126 loans from 27 plans at 25 companies for which we have data at every year-end from 2002 to 2008. 1997 is the origination year for the oldest general-purpose loans in the dataset. Individuals with zero or missing account balances are excluded.
0
2
4
6
8
10
12
Jan‐97
Jul‐9
7
Jan‐98
Jul‐9
8
Jan‐99
Jul‐9
9
Jan‐00
Jul‐0
0
Jan‐01
Jul‐0
1
Jan‐02
Jul‐0
2
Jan‐03
Jul‐0
3
Jan‐04
Jul‐0
4
Jan‐05
Jul‐0
5
Jan‐06
Jul‐0
6
Jan‐07
Jul‐0
7
Jan‐08
Jul‐0
8
Interest Rate
Loan Origination Date
Figure 5B. Median 401(k) Loan Interest Rates and the Prime Rate (1997‐2008)
Median 401(k) Loan Rate Prime Rate Notes: Authors’ calculations using the Aon Hewitt loan-level data on 531,126 loans from 27 plans at 25 companies for which we have data at every year-end from 2002 to 2008. 1997 is the origination year for the oldest general-purpose loans in the dataset. Individuals with zero or missing account balances are excluded.

26
Notes: EBRI/ICI statistics come from a series of Investment Company Institute reports starting in 1999, including the first report by VanDerhei et al. (1999), and the most recent report by Holden, VanDerhei, and Alonso (2010). PSCA statistics come from various issues of the Profit Sharing/401(k) Council of America’s “Annual Survey of Profit Sharing and 401(k) Plans.” Aon Hewitt statistics come from the authors’ calculations using 3,896,412 employee-year observations from 27 plans at 25 companies for which we have data at every year-end from 2002 to 2008. Individuals with zero or missing account balances are excluded.
0
5
10
15
20
25
30
35
1992 1994 1996 1998 2000 2002 2004 2006 2008
Fraction
of 4
01(k) P
articipa
nts
Year
FIGURE 6. Fraction of Participants with an Outstanding 401(k) Loan (1992‐2009)
EBRI/ICI PSCA Aon Hewitt

27
Notes: EBRI/ICI statistics come from a series of Investment Company Institute reports starting in 1999, including the first report by VanDerhei et al. (1999), and the most recent report by Holden, VanDerhei, and Alonso (2010). Aon Hewitt statistics come from the authors’ calculations using 833,433 employee-year observations from 27 plans at 25 companies for which we have data at every year-end from 2002 to 2008. Individuals with zero or missing account balances are excluded. In the Aon Hewitt data, we winsorize the top and bottom 0.5% of the loan-to-balance observations in order to reduce the impact of outliers on the average.
0
5
10
15
20
25
1996 1998 2000 2002 2004 2006 2008
Average
Loa
n Ba
lance as a
Fraction
of 4
01(k) A
ccou
nt Balan
ce
Year
FIGURE 7. Outstanding Loan Balances as a Fraction of 401(k) Balances (1996‐2009)
(Conditional on Having Loan Balances)
EBRI/ICI Aon Hewitt

28
Notes: EBRI/ICI statistics come from a series of Investment Company Institute reports starting in 1999, including the first report by VanDerhei et al. (1999), and the most recent report by Holden, VanDerhei, and Alonso (2010). PSCA statistics come from various issues of the Profit Sharing/401(k) Council of America’s “Annual Survey of Profit Sharing and 401(k) Plans.” Aon Hewitt statistics come from the authors’ calculations using 833,433 employee-year observations from 27 plans at 25 companies for which we have data at every year-end from 2002 to 2008. Individuals with zero or missing account balances are excluded.
0
2000
4000
6000
8000
10000
1992 1994 1996 1998 2000 2002 2004 2006 2008
Average
Oustand
ing
401(k) Loa
n Ba
lance
Year
FIGURE 8. Average Outstanding 401(k) Loan Balances (1992‐2009)
EBRI/ICI PSCA Aon Hewitt

29
TABLE 1. Firm-Level 401(k) Loan Provisions (2002-2004) General provisions Loan duration Offers a 401(k) loan option Minimum, general purpose For general purpose 100.0% ≤ 1 months 13.8% For a primary residence 73.6% > 1 to 6 months 16.1% Maximum number of loans outstanding > 6 to 12 months 65.5% 1 33.3% Not specified 4.6% 2 56.3% Maximum, general purpose ≥ 3 10.4% < 5 years 21.8% Application fee, general purpose 5 years 73.6% $0 5.8% Not specified 4.6% > $0 to $25 5.8% Minimum, primary residence > $25 to $50 34.5% ≤ 1 months 10.5% > $50 to $75 13.8% > 1 to 6 months 9.0% > $75 3.5% > 6 to 12 months 34.3% Not specified 36.8% > 12 to 60 months 16.4% Minimum loan amount, general purpose > 60 to 72 months 25.4% < $500 1.1% Not specified 4.5% $500 26.4% Maximum, primary residence > $500 to $1,000 69.0% < 10 years 3.0% > $1,000 3.4% 10 years 31.3% 15 years 46.3% Interest rate provisions 20 to 25 years 6.0% Interest rate 30 years 9.0% Prime 25.3% Not specified 4.5% > Prime to prime + 1 59.8% > Prime + 1 to prime + 2 5.8% Other 5.8% Not specified 3.5% Interest rate update frequency Daily 4.6% Monthly 54.0% Quarterly 33.3% Annually 1.1% Other frequency 1.1% Not specified 5.8% Source: Authors’ calculations from the Aon Hewitt plan documentation for 87 plans at 79 companies for which we have documentation from one year between 2002 and 2004. Percentages sometimes do not add up to 100% due to rounding.

30
TABLE 2. 401(k) Loan Utilization and Balances by Demographic Characteristics (2008)
Fraction of Participants with a
401(k) Loan Average Loan Balance
as a Fraction of Balances EBRI/ICI Aon Hewitt EBRI/ICI Aon Hewitt Overall 18% 21% 16% 23% Age 20s 10% 10% 29% 28% 30s 20% 23% 25% 26% 40s 22% 26% 18% 23% 50s 19% 23% 13% 20% 60s 11% 14% 11% 22% Tenure (years) 0 to 2 6% 3% 25% 27% > 2 to 5 15% 13% 26% 27% > 5 to 10 23% 28% 24% 26% > 10 to 20 26% 33% 17% 23% > 20 to 30 25% 30% 12% 16% > 30 18% 26% 9% 14% Plan balance ≤ $10,000 12% 13% 39% 30% > $10,000 to $20,000 26% 31% 33% 25% > $20,000 to $30,000 26% 32% 29% 23% > $30,000 to $40,000 26% 31% 26% 22% > $40,000 to $50,000 25% 31% 24% 21% > $50,000 to $60,000 24% 30% 21% 20% > $60,000 to $70,000 23% 31% 19% 19% > $70,000 to $80,000 22% 29% 18% 19% > $80,000 to $90,000 21% 29% 16% 18% > $90,000 to $100,000 20% 28% 15% 16% > $100,000 to $200,000 18% 25% 11% 12% > $200,000 12% 17% 5% 6% Compensation ≤ $40,000 19% 15% 21% 23% > $40,000 to $60,000 27% 23% 19% 22% > $60,000 to $80,000 24% 23% 17% 20% > $80,000 to $100,000 20% 23% 14% 19% > $100,000 14% 16% 11% 17% Participants -- 638,902 -- 134,584 Notes: EBRI/ICI statistics come from Holden, VanDerhei, and Alonso (2009). Aon Hewitt statistics come from the authors’ calculations using the Aon Hewitt individual-level data in 2008 from 27 plans at 25 companies for which we have data at every year-end from 2002 to 2008. Individuals with zero or missing account balances are excluded. Seven plans at five companies are dropped from the salary range rows due to missing salary data. A small number of individuals are dropped from the age and tenure rows due to missing age or tenure data. The first two columns show the fraction of 401(k) participants with an outstanding loan at year-end. The last two columns show outstanding loan balances as a fraction of total 401(k) balances at year-end among participants with an outstanding loan. In the Aon Hewitt data, we winsorize the top and bottom 0.5% of the loan-to-balance observations in order to reduce the impact of outliers.
31
TABLE 3. Number of Loans Outstanding by Maximum Number of Loans Allowed (2008) Maximum number of loans allowed in plan
Number of loans outstanding
Fraction of participants
Average total loan balance/
401(k) balance
Average total outstanding loan
balance
1 0 loans outstanding 85.7% 0.0% $0 1 loan outstanding 14.3% 16.3% $5,305
2 0 loans outstanding 74.5% 0.0% $0 1 loan outstanding 12.4% 19.1% $6,212 2 loans outstanding 13.1% 27.3% $8,529
3
0 loans outstanding 88.5% 0.0% $0 1 loan outstanding 5.7% 18.6% $11,225 2 loans outstanding 2.2% 23.5% $14,066 3 loans outstanding 3.6% 29.2% $16,779
Notes: Authors’ calculations using the Aon Hewitt individual-level data in 2008 from 27 plans at 25 companies for which we have data at every year-end from 2002 to 2008. Individuals with zero or missing account balances were excluded. Thirty-eight individuals were dropped whose account and loan records did not match, leaving a sample size of 638,864.

TABLE 4. The Association of Demographic Characteristics and Plan Features with 401(k) Loan Utilization (2002-2004)
Has a 401(k) Loan
Outstanding Loan Balance as a
Fraction of Total Balances Coefficient SE Coefficient SE Coefficient SE Coefficient SE Constant 0.0449** (0.0177) 0.0846** (0.0391) 0.2806*** (0.0113) 0.2301*** (0.0193) Demographic Controls Age 20s (omitted) 30s 0.0308*** (0.0059) 0.0334*** (0.0043) 0.0079*** (0.0025) 0.0074*** (0.0021) 40s 0.0166** (0.0082) 0.0202*** (0.0065) 0.0095*** (0.0033) 0.0096*** (0.0031) 50s -0.0249** (0.0121) -0.0192* (0.0114) 0.0037 (0.0038) 0.0047 (0.0036) 60s -0.1131*** (0.0141) -0.1045*** (0.0131) -0.0073 (0.0051) -0.0032 (0.0044) Tenure (years) 0 to 2 (omitted) > 2 to 5 0.1094*** (0.0107) 0.1114*** (0.0114) -0.0272*** (0.0074) -0.0177** (0.0071) > 5 to 10 0.2244*** (0.0208) 0.2283*** (0.0194) -0.0310*** (0.0103) -0.0152* (0.0084) > 10 to 20 0.2933*** (0.0271) 0.2986*** (0.0256) -0.0306** (0.0120) -0.0147 (0.0089) > 20 to 30 0.3187*** (0.0262) 0.3196*** (0.0253) -0.0234** (0.0106) -0.0109 (0.0090) > 30 0.3101*** (0.0286) 0.3038*** (0.0289) -0.0273** (0.0106) -0.0167* (0.0090) Plan balance ≤ $10,000 (omitted) > $10,000 to $20,000 0.0896*** (0.0091) 0.0852*** (0.0099) -0.0397*** (0.0038) -0.0430*** (0.0034) > $20,000 to $30,000 0.0778*** (0.0108) 0.0722*** (0.0106) -0.0570*** (0.0050) -0.0632*** (0.0042) > $30,000 to $40,000 0.0604*** (0.0135) 0.0538*** (0.0129) -0.0702*** (0.0061) -0.0781*** (0.0052) > $40,000 to $50,000 0.0443*** (0.0155) 0.0374** (0.0146) -0.0799*** (0.0064) -0.0889*** (0.0055) > $50,000 to $60,000 0.0291* (0.0174) 0.0218 (0.0160) -0.0908*** (0.0068) -0.1010*** (0.0057) > $60,000 to $70,000 0.0210 (0.0187) 0.0129 (0.0170) -0.0997*** (0.0071) -0.1107*** (0.0057) > $70,000 to $80,000 0.0074 (0.0206) -0.0010 (0.0189) -0.1091*** (0.0077) -0.1204*** (0.0060) > $80,000 to $90,000 0.0054 (0.0227) -0.0031 (0.0204) -0.1188*** (0.0076) -0.1309*** (0.0060) > $90,000 to $100,000 -0.0065 (0.0221) -0.0162 (0.0204) -0.1282*** (0.0077) -0.1408*** (0.0064) > $100,000 to $200,000 -0.0332 (0.0271) -0.0450* (0.0252) -0.1621*** (0.0083) -0.1758*** (0.0067) > $200,000 -0.1166*** (0.0323) -0.1294*** (0.0307) -0.2186*** (0.0094) -0.2341*** (0.0073)

33
Compensation ≤ $40,000 (omitted) > $40,000 to $60,000 -0.0367 (0.0244) -0.0364* (0.0211) 0.0053 (0.0127) 0.0050 (0.0094) > $60,000 to $80,000 -0.0126 (0.0114) -0.0174* (0.0095) 0.0101** (0.0047) 0.0102*** (0.0032) > $80,000 to $100,000 -0.0306* (0.0174) -0.0395*** (0.0146) 0.0198*** (0.0065) 0.0205*** (0.0045) > $100,000 -0.0544*** (0.0207) -0.0641*** (0.0172) 0.0244*** (0.0067) 0.0249*** (0.0046) Missing -0.0890*** (0.0214) -0.0970*** (0.0197) 0.0341*** (0.0072) 0.0322*** (0.0050) Plan Loan Features Primary residence loans -0.0643*** (0.0213) 0.0051 (0.0081) Maximum number of loans 1 (omitted) 2 0.0896*** (0.0213) 0.0239*** (0.0074) ≥ 3 -0.0101 (0.0301) 0.0683*** (0.0111) Interest rate Prime (omitted) > Prime to prime + 1 -0.0277 (0.0212) 0.0059 (0.0081) > Prime + 1 to prime + 2 -0.1015*** (0.0317) 0.0399*** (0.0132) Other 0.0366 (0.0397) -0.0093 (0.0138) Application fee -0.0097 (0.0203) -0.0068 (0.0072) Minimum loan amount > $500 0.0009 (0.0191) 0.0100 (0.0097) Minimum loan duration ≤ 1 month (omitted) > 1 to 6 months -0.0332 (0.0406) 0.0232 (0.0163) > 6 to 12 months -0.0127 (0.0310) 0.0202 (0.0141) Maximum loan duration < 5 years 0.0072 (0.0186) -0.0167** (0.0066) Participants 1,376,025 1,376,025 314,033 314,033 Plans 87 87 87 87 Companies 79 79 79 79 R2 0.0755 0.0856 0.1787 0.2002 Notes: Authors’ calculations from the Aon Hewitt individual-level data for 87 plans at 79 companies for which we have data in one year between 2002 and 2004. Individuals with zero or missing account balances are excluded. A small number of individuals are dropped from the regression due to missing age or tenure data. Standard errors are clustered at the plan level. We winsorize the top and bottom 0.5% of the loan-to-balance observations in order to reduce the impact of outliers. * p<0.10, ** p<0.05, *** p<0.01
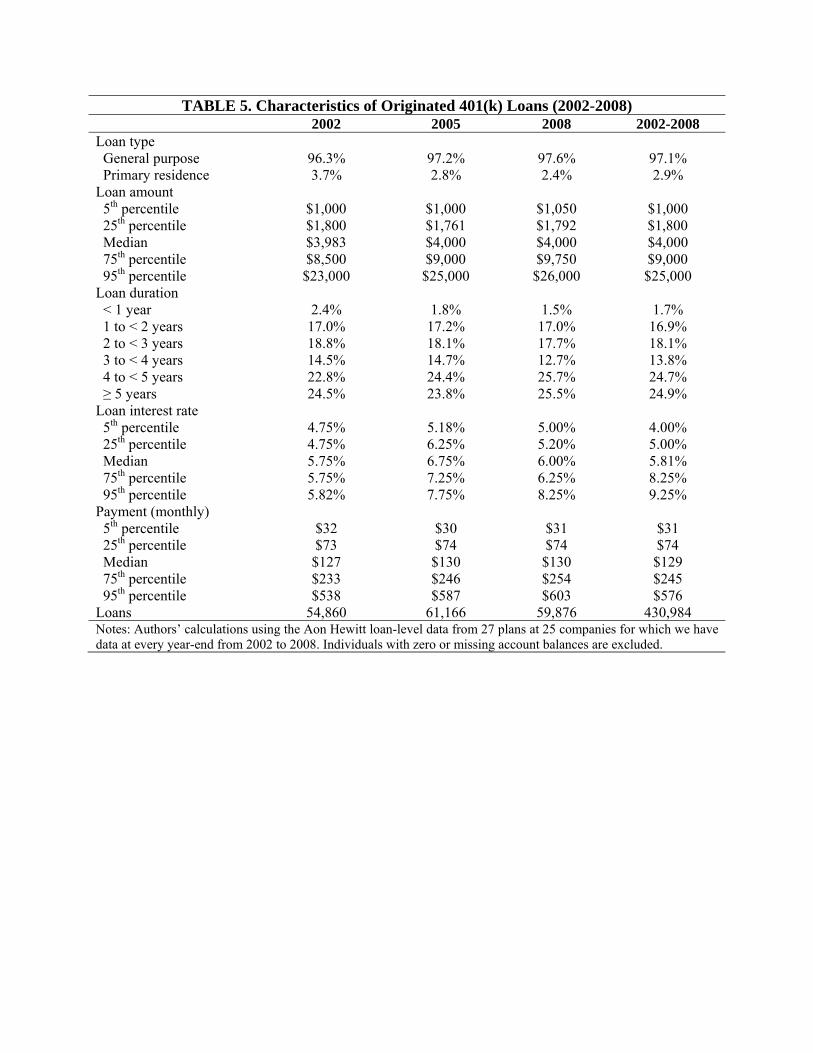
TABLE 5. Characteristics of Originated 401(k) Loans (2002-2008) 2002 2005 2008 2002-2008 Loan type General purpose 96.3% 97.2% 97.6% 97.1% Primary residence 3.7% 2.8% 2.4% 2.9% Loan amount 5th percentile $1,000 $1,000 $1,050 $1,000 25th percentile $1,800 $1,761 $1,792 $1,800 Median $3,983 $4,000 $4,000 $4,000 75th percentile $8,500 $9,000 $9,750 $9,000 95th percentile $23,000 $25,000 $26,000 $25,000 Loan duration < 1 year 2.4% 1.8% 1.5% 1.7% 1 to < 2 years 17.0% 17.2% 17.0% 16.9% 2 to < 3 years 18.8% 18.1% 17.7% 18.1% 3 to < 4 years 14.5% 14.7% 12.7% 13.8% 4 to < 5 years 22.8% 24.4% 25.7% 24.7% ≥ 5 years 24.5% 23.8% 25.5% 24.9% Loan interest rate 5th percentile 4.75% 5.18% 5.00% 4.00% 25th percentile 4.75% 6.25% 5.20% 5.00% Median 5.75% 6.75% 6.00% 5.81% 75th percentile 5.75% 7.25% 6.25% 8.25% 95th percentile 5.82% 7.75% 8.25% 9.25% Payment (monthly) 5th percentile $32 $30 $31 $31 25th percentile $73 $74 $74 $74 Median $127 $130 $130 $129 75th percentile $233 $246 $254 $245 95th percentile $538 $587 $603 $576 Loans 54,860 61,166 59,876 430,984 Notes: Authors’ calculations using the Aon Hewitt loan-level data from 27 plans at 25 companies for which we have data at every year-end from 2002 to 2008. Individuals with zero or missing account balances are excluded.

35
TABLE 6. Reasons For Obtaining a 401(k) Loan (1998-2007) Reason 1998 2001 2004 2007Home Purchase/improvement 35.1% 35.9% 23.4% 14.3% Investments and other real estate 1.6 5.9 1.6 3.4 Vehicles, appliances and other durables 11.2 23.4 20.0 10.2 Education and medical expenses 15.9 4.6 12.7 11.8 Occasional expenses (e.g. wedding, divorce) 7.8 6.0 6.1 11.7 Other 28.5 24.3 36.2 48.7
Notes: Authors’ calculations from the Survey of Consumer Finances.