Sugar, grain and milling measurement and inventory control solutions

THE AUTHENTIC LEADERSHIP INVENTORY:
MEASUREMENT INVARIANCE IN SELECTED
INDUSTRIES IN SOUTH AFRICA
L VAN DER VAART
(MCom)
Mini-dissertation submitted in partial fulfilment of the requirements for the degree
Master of Commerce in Industrial Psychology at the Vaal Triangle Campus of the North-West
University
Supervisor: Prof. M. W. Stander
Vanderbijlpark
May 2016

ii
COMMENTS
The reader is reminded of the following:
• The editorial style in the first and last chapters of this mini-dissertation follows the format
prescribed by the Programme in Industrial Psychology of the North-West University (Vaal
Triangle Campus).
• The references and page numbers in this mini-dissertation follow the format prescribed by
the Publication Manual (6th edition) of the American Psychological Association (APA).
This practice is in line with the policy of the Programme in Industrial Psychology of the
North-West University (Vaal Triangle Campus) to use APA style in all scientific
documents.
• This mini-dissertation is submitted in the form of a research article. The editorial style
specified by the South African Journal of Industrial Psychology is used in the second
chapter.

iii
DECLARATION
I, Leoni van der Vaart, hereby declare that “Authentic Leadership Inventory: Measurement
invariance in selected industries in South Africa” is my own work and that both the views and
the opinions expressed in this mini-dissertation are my own and those of the authors as
referenced in the text and indicated in the reference lists. I furthermore declare that this work
will not be submitted to any other academic institution for qualification purposes.
LEONI VAN DER VAART OCTOBER 2015

iv
DECLARATION OF LANGUAGE EDITING
I hereby declare that I was responsible for the language editing of the mini-dissertation
Authentic Leadership Inventory: Measurement invariance in selected industries in South
Africa submitted by Leoni van der Vaart.
DR ELSABé DIEDERICKS BA Hons HED Hons MA PhD
28 September 2015

v
ACKNOWLEDGEMENTS
I wish to thank the following individuals for their assistance with this research project:
• God, my Saviour, for the love, wisdom and perseverance He has granted me.
• Prof. Marius Stander, my mentor and research supervisor. You are an epitome of the
perfect people developer. You always walk the extra mile with your students and I am
grateful that you have sacrificed your own work-life balance and that you always have
an open door policy. You have played a key role in my personal development.
• I would like to offer my gratitude to Prof. Ian Rothmann for assisting me with the data
analyses and providing guidance in the interpretation of the results. You have made an
enormous contribution to this project despite your own workload; investing a
significant amount of your time and effort in my research career. You are truly an
inspiration.
• A special thank you to Danie Bosman for his unwavering support. To support someone
through one research project is admirable; supporting them through a second one is
beyond comprehension. Words cannot describe how grateful I am to have you in my
life.
• My brother and sister for your words of encouragement and putting up with my
continued absence. My parents, I am where I am today because of your support and the
sacrifices you have made throughout my journey as a student.
• My manager, Dr Elrie Botha, thank you for allowing me the opportunity to progress
academically and for being my “psychologist”. My circle of support at the office -
Christiaan, Lynn and Zama - thank you for everything, especially the coffee.
• Dr Elsabé Diedericks, for the professional and efficient way in which you have
conducted the language editing. You are more than just my language editor; your
support and motivation are priceless.

vi
TABLE OF CONTENTS
List of Tables vii
Summary viii
CHAPTER 1: INTRODUCTION
1.1 Problem Statement 1
1.2 Research Questions 11
1.3 Research Aims 11
1.3.1 General Aim 11
1.3.2 Specific Aims 12
1.4 Research Method 12
1.4.1 Research Approach and Design 12
1.4.2 Participants 13
1.4.3 Measuring Instruments 13
1.4.4 Procedure 14
1.4.5 Statistical Analysis 15
1.5 Ethical Considerations 17
1.6 Expected Contributions of the Study 17
1.6.1 Expected Contributions for the Individual 17
1.6.2 Expected Contributions for the Organisation 17
1.6.3 Expected Contributions for I/O Psychology Research 18
1.7 Chapter Division 19
References 20

vii
CHAPTER 2: RESEARCH ARTICLE 30
References 63
CHAPTER 3: CONCLUSIONS, LIMITATIONS AND RECOMMENDATIONS
3.1 Conclusions from Literature and Empirical Results 73
3.2 Limitations 77
3.3 Recommendations 77
3.3.1 Recommendations for Future Research 77
3.3.2 Recommendations for Practice 78
3.4 Chapter Summary 79
References 80

viii
LIST OF TABLES
Table Description Page
Table 1 Characteristics of the Participants (N = 877) 43
Table 2
Fit Statistics for the Competing Measurement Models of the ALI and WTS
(N = 244)
46
Table 3 Post-hoc Analyses on the One-Factor Model: Fit Statistics 47
Table 4 Fit Indices for Invariance Tests (Gender) 51
Table 5 Standardised Loadings of the Revised Scalar Model (Gender) 51
Table 6 Fit Indices for Invariance Tests (Organisations) 54
Table 7 Standardised Loadings of the Revised Scalar Model (Organisations) 55

ix
SUMMARY
Title: The Authentic Leadership Inventory: Measurement invariance in selected industries in
South Africa.
Key terms: Authentic leadership, extreme contexts, gender, mining, public health care, trust
in leader, validation
A need exists for validating the authentic leadership construct across different contexts and
ensuring measurement invariance of the Authentic Leadership Inventory (ALI) in different
groups. Despite this need, few attempts have been made in a South African context to evaluate
the psychometric properties of this instrument and to demonstrate whether it is invariant. This
is important given the fact that South Africa differs significantly from Western countries where
the majority of theorising and empirical testing of the construct was performed. These
differences may influence the way in which individuals interpret observed indicators.
Furthermore, leadership is socially constructed and context-dependent, influencing both the
interpretation of leadership behaviour as well as the effectiveness thereof in different
organisational contexts.
The aim of this study was to evaluate measurement invariance of the ALI in two organisations
from different industries, after the construct and concurrent validity of the instrument had been
investigated. A cross-sectional survey with two convenience samples, namely mining (N =
244) and public health care (N = 633), was used. The ALI, a sub-scale of the Workplace Trust
Scale (WTS), and a biographical questionnaire were administered. The results showed that a
one-factor model fitted the data best in the mining organisation. This is contradictory to the
original conceptualisation of authentic leadership which is considered to be a higher-order
construct comprising four lower-order dimensions, namely self-awareness, balanced
processing, internalised moral perspective and relational transparency. Results indicated that
authentic leadership significantly predicted followers’ trust in the leader; thereby establishing
the concurrent validity of the instrument. The instrument was also found to be reliable (i.e.
internally consistent) in the two organisations.

x
Measurement invariance by gender and organisational groups was evaluated and in both
instances only partial (configural and scalar) invariance could be established, indicating the
biasness of certain items in the measure. Finally, no significant differences existed in terms of
the mean levels of authentic leadership for the respective gender and organisational groups.
The results highlighted the importance of evaluating the equivalence of an instrument in
different contexts, especially instruments measuring leadership behaviour.
Recommendations were made for organisations and further research.

1
CHAPTER 1
INTRODUCTION
The aim of this mini-dissertation was to determine whether the Authentic Leadership Inventory
(ALI) is equivalent, from a measurement perspective, across two organisations from different
industries. This chapter comprises the problem statement, objectives of the study and the
methodology used, both for data collection and data analysis.
1.1 PROBLEM STATEMENT
Changing, dynamic and complex global business environments pose significant challenges for
contemporary businesses that not only need to survive, but also to thrive (Barton, Grant, &
Horn, 2012). When these businesses wish to create real change, effective leadership is needed
(Satell, 2014), for effective leadership is the bridge between business strategy and optimal
organisational performance (Dinwoodie, Quinn, & McGuire, 2014). During the last half of the
20th century, businesses were structured hierarchically with a top-down leadership approach.
Businesses, however, need leadership in the 21st century that will create learning organisations
(George, 2010). Learning organisations are organisations that are able to align employees with
their strategy, empower their leaders, focus on customer service delivery, and facilitate
collaboration among employees throughout the organisation (George, 2010). Organisations are
also under pressure to have more open and transparent processes and systems (Avolio &
Luthans, 2006). Openness and transparency are evident in the popularity of websites such as
WikiLeaks and glassdoor.com (Avolio & Walumbwa, 2014). In the context of the current
emphasis on ethical business practices and positive forms of leadership, authentic leadership is
considered to be important for organisations (Algera & Lips-Wiersma, 2012; Onorato & Zhu,
2014).
Through leading with integrity and values, authentic leaders enable employees to create
meaning (Algera & Lips-Wiersma, 2012) with suitable follower outcomes (Pues, Wesche,
Streicher, Braun, & Frey, 2012) such as increased organisational commitment (Walumbwa,
Avolio, Gardner, Wernsing, & Peterson, 2008); job satisfaction (Amunkete & Rothmann,
2015; Giallonardo, Wong, & Iwasiw, 2010; Walumbwa et al., 2008); work engagement (Du
Plessis, 2014; Roux, 2010; Wang & Hsieh, 2013); psychological safety (Walumbwa &

2
Schaubroek, 2009); well-being (Illies, Morgeson, & Nahrgang, 2005); employee performance
(Clapp-Smith, Vogelsang, & Avey, 2009; Walumbwa et al., 2008); extra effort (Walumbwa et
al., 2008); voice (speaking up to share ideas) behaviour (Wong, Laschinger, & Cummings,
2010); lower burnout (Laschinger & Fida, 2014; Read & Laschinger, 2013); workplace
bullying (Laschinger & Fida, 2014); and psychological capital (Amunkete & Rothmann, 2015).
Authentic leadership has also been linked to ensuring long-term sustainability for organisations
(Maldanado, 2013; Neider & Schriesheim, 2011).
Avolio (2007), Avolio and Walumbwa (2014), and Haddon, Loughlin, and McNally (2015)
postulate that leadership should not be taken out of the context in which it operates. According
to these authors, leadership may influence the context, but in turn, the effectiveness of the
leader also depends on the context (Avolio, 2007; Avolio & Walumbwa, 2014; Haddon et al.,
2015). Besides being context-dependent, leadership is also socially constructed, making the
measurement thereof challenging (Haddon et al., 2015). Although authentic leadership, as a
construct, has been used in a variety of contexts and with a variety of groups (Northouse, 2013;
Onorato & Zhu, 2014), the fact that the field is in its early stages of operationalisation warrants
more attention to studies focusing on the validation of the construct (Gardner, Cogliser, Davis,
& Dickens, 2011). Validity - the instrument measures what it intends to measure - is an
important criterion to be met before instruments may be utilised (Anastasi & Urbina, 1997;
Roodt, 2013).
Validation studies in non-Western contexts are even more important because development of
the construct and empirical evaluation were mainly performed in Western contexts (Avolio &
Walumbwa, 2014; Gardner et al., 2011). Byrne and Watkins (2003) criticise research that
indiscriminately applies concepts from one context to the next. According to them, these
researchers ignore the fact that managerial behaviour is conceptualised differently, individuals
interpret items differently and they respond differently to the response scales of the
instrument/s (Byrne & Watkins, 2003). This indicates that measures may not be invariant (or
equivalent) across contexts and one cannot assume equivalence. Measurement invariance is
defined by Horn and McArdle (1992) as the ability of scales to measure the same phenomena
when these phenomena are studied under different conditions. According to Roodt (2013), the
aim of measurement invariance is to determine if scales measure the same construct across
different contexts; it is determined through a specific factor analysis procedure. Measurement
invariance enables researchers to maximise the validity of the conclusions they make based on

3
test scores (Roodt, 2013). The elimination of measurement bias (ensuring equivalence)
facilitates the achievement of this goal (Van De Vijver & Leung, 2011). Without validation in
different contexts, consequent authentic leadership development risks being considered a “fad”
without any long-term sustainable impact on individuals and organisations (Avolio &
Walumbwa, 2014). South Africa differs significantly from Western countries in terms of
economic indicators, geography, language, political perspectives and social indicators
(Joshanloo, Wissing, Khumalo, & Lamers, 2013) which may potentially influence the way in
which observed indicators are interpreted.
Studies utilising authentic leadership, as measured by the Authentic Leadership Questionnaire
(ALQ), in an African context (excluding South Africa) were conducted in Kenya with working
adults from eleven different American multinational companies (see Walumbwa et al., 2008);
and in Namibia with employees from a state-owned enterprise (Amunkete & Rothmann, 2015).
In a South African context, published research included a private sector health care
organisation (Du Plessis, 2014), and two manufacturing organisations (Munyaka, 2012; Roux,
2010). The ALQ was developed by Walumbwa et al. (2008) and it was the first measuring
instrument designed to measure authentic leadership based on the most current definition.
Contradicting findings were reported in studies that utilised this instrument in South Africa:
Munyaka (2012) reported that a two-factor model fitted the data best and Du Plessis (2014)
reported that a four-factor model had a poor fit with the data, supporting the need for validation
studies in different contexts.
The Authentic Leadership Inventory (ALI; Neider & Schriesheim, 2011) was developed by
Neider and Schriesheim in reaction to some concerns they had with the ALQ (Walumbwa et
al., 2008). These concerns were three-fold: (1) The instrument was not available for
commercial use - future use for research purposes was going to become challenging; (2) content
analysis was very subjective - rigorous procedures should be used to determine the validity and
reliability of instruments in the field of leadership (Schriesheim & Cogliser, 2009), before
subsequent research is conducted with these measures (Neider & Schriesheim, 2011); and (3)
Walumbwa et al. (2008) found that a second-order factor model fitted the data significantly
better than a first-order factor model. Their results - a better fitting higher-order model - might
have been inflated by using two correlated errors or “garbage parameters” (Neider &
Schriesheim, 2011). Consequently, Neider and Schriesheim developed the ALI - based on the
four dimensions conceptualised and operationalised by Walumbwa et al. (2008) to address

4
these concerns by using more rigorous assessment procedures for content and convergent
validity and to test competing models without “garbage parameters”.
Authenticity is not a new concept and dates back as early as 1966 when Sartre defined it as
“being true to oneself” and “not deceiving oneself” (as cited in Avolio & Mhathre, 2012). In
1983, Henderson and Hoy first attempted to define leader authenticity, referring to leadership
authenticity and inauthenticity respectively as:
the extent to which subordinates perceive their leader to demonstrate the acceptance of
organizational and personal responsibility for actions, outcomes, and mistakes; to be non-
manipulating of subordinates; and to exhibit salience of self over role. Leadership
inauthenticity is defined as the extent to which subordinates perceive their leader to be
‘passing the buck’ and blaming others and circumstances for errors and outcomes; to be
manipulative of subordinates; and to be demonstrating a salience of role over self (pp. 67-
68).
In a review of literature, Gardner et al. (2011) stated that various researchers have since defined
both authenticity and authentic leadership. Currently, authentic leadership is a higher-order
construct - based on a description initially advanced by Kernis and Goldman (2006) - that is
defined as leadership that “draws on positive psychological capacities and positive ethical
climate to foster the four core dimensions of authentic leadership, enabling positive follower
self-development” (Walumbwa et al., 2008, p. 94). Authentic leadership originated from
positive psychology which is defined as the scientific study of the factors that enable people
and institutions to flourish, such as well-being, positive traits and institutions (Seligman &
Csikszentmihalyi, 2000).
Positive institutions have been studied from different disciplines such as positive
organisational scholarship (POS; Cameron & Spreitzer, 2012) and positive organisational
behaviour (POB; Luthans, 2002a). Luthans (2002b) defines POB as “the study and application
of positively oriented human resource strengths and psychological capacities that can be
measured, developed and effectively managed for performance improvement in today’s
workplace” (p. 59). POB refers to individual level characteristics (Luthans, 2002a); whereas
POS refers to organisational characteristics (Cameron, 2005). More recently, Zbierowski and
Góra (2014) placed positive leadership on the organisational level. According to them, positive

5
leadership leads to positive organisations and positive behaviour. Authenticity is one of the
core attributes that a positive leader should have (Mishra & Mishra, 2012).
Conceptualising the construct authentic leadership, Walumbwa et al. (2008) proposed a higher-
order structure consisting of four dimensions for authentic leadership which were used in the
development of the ALQ. The first dimension, self-awareness refers to a process of reflection
which enables the leader to gain insight into various intrapersonal characteristics (i.e. values,
strengths, personality) and the impact thereof on followers (Kernis, 2003). The second
dimension, internalised moral perspective refers to strong moral convictions which guide
behaviour and decision making from a self-regulation perspective (Gardner, Avolio, Luthans,
May, & Walumbwa, 2005). Decision making is also influenced by balanced processing, the
third dimension, in which the individual gathers information and reaches decisions as
objectively as possible, often challenging his/her own deeply held beliefs and values (Gardner
et al., 2005). Working from the inside out, it allows leaders to share their inner feelings and
thoughts openly, referring to relational transparency (Kernis, 2003), the fourth dimension.
The ALI was developed with four items for each of the four dimensions using the two sample
items - for each of the dimensions - provided by Walumbwa et al. (2008). This was done to
ensure alignment with the theoretical conceptualisation of authentic leadership and yielded
sixteen items in total. Both the newly constructed instruments and the original eight sample
items from the ALQ were administered with the sample. The respondents had to indicate to
what extent the items reflected the behaviour as defined in the four dimensions (Neider &
Schriesheim, 2011). The procedure was based on a technique developed by Schriesheim,
Cogliser, Scandura, Lankau, and Powers (1999) and Schriesheim, Powers, Scandura, Gardiner,
& Lankau (1993). Subsequently, ANOVA and t-tests were performed in order to determine
which item should be assigned to which dimension. Data was also subjected to principal
component analysis to determine the number of factors (underlying dimensions) that should be
extracted. After removing two problematic items, the final version of the ALI consists of 14
items: Three items measuring relational transparency and three items measuring self-
awareness; four items measuring internalised moral perspective; and four items measuring
balanced processing (Neider & Schriesheim, 2011).
After obtaining positive results for content validity, the ALI was subjected to reliability testing
as well as tests for empirical factor structure in order to determine whether the theoretically

6
distinct dimensions are also perceived as distinct by the respondents, a critical step
recommended by Hinkin (1998). The developers also measured the extent to which the ALI is
likely to be contaminated by social desirability and or impression management. Preliminary
results from their second study supported internal consistency, content, construct and
discriminant validity and freedom from impression management (Neider & Schriesheim,
2011). Notable differences were detected in the factor structures for the two groups in the
preliminary study. In their final assessment of the factor structure, overall support was found
for a higher-order factor. The developers concluded that the appropriateness of considering
authentic leadership a higher-order (global) construct depends on who is described (Neider &
Schriesheim, 2011). In a recent study conducted by Stander, De Beer, and Stander (2015),
authentic leadership as measured by the ALI was found to consist of only one factor with all
fourteen items loading onto the one factor. Based on the contradictory findings within and
between these two studies, findings on the construct validity of this instrument remain
inconsistent and warrant further investigation. The current study added to this investigation by
evaluating the construct validity of the ALI in a mining organisation. This evaluation also
guided the establishment of baseline models for the separate organisations in this study; a pre-
requisite for invariance testing as stipulated by Wang and Wang (2012).
When assessing the validity of an instrument, attention is paid to three types of validity:
Content-description, construct-identification, and criterion-prediction (Anastasi & Urbina,
1997). Content-description falls largely outside the scope of the current study. Establishing the
factorial validity is one way of determining whether the measure actually measures what it says
it measures and forms part of construct-identification validity (Roodt, 2013). The third type,
criterion-prediction, includes concurrent validity and can be defined as the extent to which the
independent variable accurately predicts a dependent variable at the specific moment. These
three types of validity should be evaluated in the stated sequence in order to provide a holistic
“validity picture” of the measure (Roodt, 2013).
The perceived lack of ethical decision making, discussed earlier, leads to a breakdown in trust.
Trust is a core requirement for leaders to influence their followers (Beddoes-Jones, 2012; Wang
& Hsieh, 2013). Theories, such as the Social Exchange Theory (Blau, 1964), suggest that
leaders have a positive impact on employees through workplace trust. Trust is defined as “an
individual’s willingness to act on the basis of his/her perception of a trust referent (peer,
supervisor/manager or organisation) being supportive/caring, ethical, competent and cognisant

7
of others’ performance” (Ferres, 2003, p. 8). Ferres (2003) distinguished between three
referents when investigating trust. For the purpose of this study, trust in the leader (direct
supervisor) was investigated. Trust in authentic leaders not only transpires from consistency
between the words and actions of the leader, but also when followers perceive the leader to be
morally grounded (Wang & Hsieh, 2013).
Hannah, Uhl-Bien, Avolio, and Cavaretta (2009) believe that extreme contexts entail unique
circumstances creating unique challenges for leaders, furthering the argument for the
investigation of the outcomes of authentic leadership in different contexts. This investigation
also establishes the concurrent validity of the ALI. Even though concurrent validity has been
established with other variables (trust in organisation, optimism and work engagement) in a
health care organisation (Stander et al., 2015), it - to date - has not been established in the
mining organisation; a research gap that has been addressed by the current study. This also sets
this stage for evaluating the measurement invariance of the ALI which has not been done to
date.
Roodt (2013) suggests that, in an attempt to generalise validity, validation studies should follow
a sequential process where one conducts validation studies in a specific organisation and then
gradually expand them to industries; ultimately including multiple countries and cultures.
Therefore, the current study investigated the construct validity of authentic leadership in the
mining organisation before continuing with measurement invariance testing across the two
organisations from two different industries. Roodt (2013) furthermore postulated that certain
variables may have an impact on the validity of a measuring instrument. Paustian-Underdahl,
Walker, and Woehr (2014) included the type of organisation as one (contextual) variable that
should be considered. According to Hannah et al. (2009), extreme contexts entail more risks -
psychologically and physically - and require a good leader to support and guide them in facing
stressors which arise before, during or after stressful events and situations (Hannah et al.,
2009). The current study included two organisations which differ in terms of risks that
employees face (physical versus psychological), and also regarding profit bearing versus non-
profit bearing.
One such (psychologically) extreme context and non-profit organisation is the public health
care sector. Insecure working (practice) environments, work overload due to understaffing and
limited learning and promotional opportunities led to a significant number of workers in this

8
sector feeling ill-equipped to deal with the pressures flowing from dealing with a vast number
of patients (George, Atujuna, & Gow, 2013). The demanding practice environment results in
work-related ill-health and negatively impacts these individuals’ ability to serve the community
(Aiken et al., 2012). Leadership research in this context has received increasing attention in
order to enhance insight into the impact on organisational outcomes (Jooste, 2004; Kumar,
2013; Mosadeghrad, 2014). The “10 Point Plan” of the South African Department of Health
(DoH; 2009 – 2014) was developed with the aim to improve the quality of health care services
in South Africa. This sets the stage for “National Core Standards” against which institutions
providing health care services will be evaluated. These standards consist of seven dimensions,
of which leadership (strategic direction through proactive leadership) is one (DoH, 2011).
Another extreme (physically and for profit) context can be found in the mining industry.
According to Paul and Maiti (2005), mining in South Africa is one of the toughest and most
dangerous occupations. The mining industry, in general, contributes significantly to the
economy by being an important role player in developing infrastructure, ensuring economic
sustainability and creating jobs (Chamber of Mines, 2014). The country relies heavily on
mineral resources and mines are confronted by many challenges (Deloitte, 2013). Besides the
macro-economic challenges (e.g. economic downturn) that national mines are facing, a number
of micro- and meso-level challenges – labour unrest, uncertain regulatory environment, and
increasing demands from government – are also being faced (Deloitte, 2013;
PricewaterhouseCoopers, 2014).
Both these industries are currently being faced by challenges that require significant changes,
and therefore, effective leadership. Leadership in health care might still align better with female
attitudinal descriptors - explained by Appelbaum, Audet, and Miller (2003) - such as
“consideration, participative, and people-orientated”; whereas leadership in mining might align
better with male attitudinal descriptors explained as “structure, instruction-giving and business-
orientated” (p. 48). In a meta-analysis conducted by Paustian-Underdahl et al. (2014), the type
of organisation mattered in the event of it being a male-dominated industry; however, not in
the event of it being a female-dominated industry.
Although these organisations can be labelled as male- and female-dominated respectively, the
role that differences between these organisations play should not be ignored. Vecchio (2002)
and Avolio and Walumbwa (2014) advocated considering the total context in which leaders

9
operate, beyond the normative gender characteristics which offer a too simplistic view.
According to Balasubramanian and Krishnan (2012), gender differences in leadership styles
depend on the context in which these genders work. According to the open systems theory
(Boulding, 1956; Miller, 1965), subsystems exist within larger systems (Katz & Kahn, 1978).
In this study the two different organisations can be considered two subsystems within the larger
system, the country. Similarities within these subsystems may lead to similar preferences
(Gilbert, Burnett, Phau, & Haar, 2010). The similarities shared by employees in this instance
are the respective elements of their organisational cultures. The organisational culture consists
of four elements: Assumptions, beliefs and values, norms, and artefacts (Armstrong & Taylor,
2014). The expression of individual values can be influenced by organisational values (Câmara
& Pereira-Guizzo, 2015), even though individual values are considered to be one’s most stable
and enduring characteristics (Rothmann & Cooper, 2015). Previous research (Roe & Ester,
1999) has indicated that social categories (such as organisations) display similar value profiles.
Another contextual variable, that influences followers’ responses to authentic leadership, is
followers’ characteristics (Avolio & Walumbwa, 2014; Woolley, Caza, & Levy, 2011) such as
gender (Avolio, Mhatre, Norman, & Lester, 2009; McColl-Kennedy & Andersen, 2005). From
a research perspective, it is important that the potential impact of gender differences when
measuring unobserved constructs is understood. Gender is a biological category and males and
females differ visibly from one another (Balasubramanian & Krishnan, 2012). Men and women
respond differently to a number of social aspects and these responses can be categorised as
agentic or communal (Bakan, 1996; Eagly, 1987; Koenig, Eagly, Mitchell, & Ristikari, 2011;
Schein, 1973, 2007). The communal category – with higher mean scores for women – focuses
on interpersonal relationships and caring for others. The agentic category – with higher mean
scores for men – focuses on tasks, individualism and assertiveness (Eagly, 1987, 2009; Spence
& Buckner, 2000). It is assumed that women would prefer leadership styles that are more
democratic as opposed to males who prefer autocratic leadership styles (Eagly, Johannesen-
Schmidt, & Van Engen, 2003). In general, based on the operational definition of authentic
leadership, this way of leading seems to incorporate what Koenig et al. (2011) refer to as
feminine interpersonal qualities such as “warmth, sensitivity and understanding” (p. 634). Du
Plessis (2014) found significantly higher mean scores for males on the balanced processing
dimension, ascribing it to gender stereotypes in which males value objective, rational thinking
more than females and, consequently, place more value on this dimension of authentic
leadership (Du Plessis, 2014).

10
These differences are supported by the Social Role Theory that postulates that men and women
both display and value different behaviours (Eagly, 1987; Eagly & Johannesen-Schmidt, 2001).
Leaders need to understand these differences in behaviours in today’s diverse business world
in order to be successful (Nguyen, Ermasova, Geyfman, & Mutjaba, 2014). Given the
increasing number of women in leadership positions (PricewaterhouseCoopers, 2013), it would
only make sense to investigate how authentic leadership is perceived by men and women and
if there are any differences (Avolio & Walumbwa, 2014). This is also important considering
the aim of both the Employment Equity Act 55 of 1998 and the Broad-Based Black Economic
Empowerment Amendment Act 46 of 2013, namely rectifying the inequalities of the past by
ensuring that both genders are equally represented in the workplace; even more so advocating
for Black female leadership (Gobind, 2013). The current study also aimed at evaluating the
measurement invariance of the ALI across gender groups and to compare the mean scores of
males and females on the dimensions of the ALI, before proceeding with measurement
invariance testing across organisations.
Paustian-Underdahl et al. (2014) state that more research should be done to understand how
the expectations of followers regarding leaders’ behaviour can influence (perceived) leadership
effectiveness. Since leadership is considered to be “in the eye of the beholder”,
psychometrically sound instruments are required and data should be collected from multiple
samples in order to draw firm conclusions about the factor structure of the ALI (Neider &
Schriesheim, 2011). Researchers (Dimitrov, 2010; Ding, Ng, & Wang, 2014; Van De Schoot,
Lugtig, & Hox, 2012) furthermore strongly advocate for measurement invariance tests in the
context of comparing groups. Van De Vijver and Leung (1997) emphasised the importance of
conducting tests of measurement invariance before comparisons are made between and with-
in groups. This is especially true for the social and behavioural sciences where self-report
measures are utilised to assess the dynamics of human behaviour (Van De Schoot et al., 2012;
Van De Vijver & Leung, 1997). Only once measurement invariance has been established, the
antecedents and outcomes of latent factor scores can be compared (Van De Schoot et al., 2012).
The aims of this study were to (a) determine construct and concurrent validity and reliability;
(b) test the assumptions of invariance of the ALI in two different organisations after having
tested it in the two gender groups; and (c) compare latent means of the different dimensions of
authentic leadership in these different gender and organisational groups. Exploring these
11
differences might facilitate a better understanding of the variable under study. If measurement
invariance of an instrument is not confirmed, cross-gender and cross-organisational
comparisons cannot be meaningfully interpreted (Dimitrov, 2010; Van De Vijver & Leung,
1997). Hannah et al. (2009) believe that extreme contexts are unique, furthering the argument
for the investigation of the outcomes (such as trust) of authentic leadership in these contexts.
1.2 RESEARCH QUESTIONS
The following research questions arise from the problem statement:
• How are authentic leadership and validation methods conceptualised in literature?
• Is authentic leadership, as measured by the ALI, a four-factor structure in the mining
organisation?
• Is the internal consistency or reliability of the ALI acceptable in the mining organisation?
• Is authentic leadership, as measured by the ALI, a significant predictor of trust in the leader
in the mining organisation?
• Is authentic leadership, as measured by the ALI, invariant across gender groups?
• Is authentic leadership, as measured by the ALI, invariant across two organisations?
• Do gender and organisations differ significantly across the dimensions of authentic
leadership?
• What recommendations can be made for future research and practice?
1.3 RESEARCH AIMS
1.3.1 General Aim
The general aim of the study is to establish measurement invariance for the ALI across two
South African organisations from two different industries.

12
1.3.2 Specific Aims
The specific objectives of the study are to:
• Conceptualise authentic leadership and validation methods according to literature;
• Determine whether authentic leadership, as measured by the ALI, is a four-factor construct
in the mining organisation;
• Evaluate whether the internal consistency or reliability of the ALI is acceptable in the
mining organisation;
• Determine whether authentic leadership, as measured by the ALI, is a significant predictor
of trust in the leader in the mining organisation;
• Investigate whether authentic leadership, as measured by the ALI, is invariant across
gender groups;
• Investigate whether authentic leadership, as measured by the ALI, is invariant across two
organisations;
• Evaluate whether mean scores for gender and organisations differ significantly across the
dimensions of authentic leadership; and
• Make recommendations for future research and practice.
1.4 RESEARCH METHOD
1.4.1 Research Approach and Design
The research was performed from a quantitative approach. De Vos, Strydom, Fouché, and
Delport (2011) explain that quantitative research utilises measuring instruments which generate
numerical data which is used to compare and analyse different variables. A cross-sectional
survey research design was used. According to De Vos et al. (2011), a cross-sectional design
entails collection of data at a specific moment and it is most often utilised when the researcher
aims to describe differences in a population at that particular moment. Data was collected by
means of questionnaires (surveys). The study’s objectives were both descriptive and
exploratory in nature. The study aimed to describe the relationship between authentic
leadership and trust in the leader, but explored the factor structure and measurement invariance
of the instrument. Primary (health care) and secondary data (mining) were used in this study.

13
1.4.2 Participants
The data generated in the health care organisation formed part of a more comprehensive
research project of the North-West University, Vaal Triangle Campus, investigating the work-
related well-being of health care professionals in the public sector. The research population in
the health care organisation comprises approximately 2000 public health care employees in the
Sedibeng region (this includes clinics and hospitals located in and around Heidelberg,
Sebokeng, Vanderbijlpark, and Vereeniging). For the purpose of this study, data was obtained
through non-probability sampling, being convenience sampling in accordance with the
procedure described by De Vos et al. (2011). In the first stage, participants who were more
easily accessible (those who were on duty at the time) were asked to complete the
questionnaire. The second stage involved that a gatekeeper at each facility was asked to
distribute questionnaires to those that were not on duty. This method was repeated until a
representative sample of participants had completed the questionnaire. The final sample
consisted of 633 employees.
Non-probability, specifically convenience sampling, was used in the mining organisation. The
data was generated as part of a bigger research project of the university. The final sample
included 244 employees from different departments within the Free State operations. A pre-
requisite for both samples was English literacy. Kline (2011) considers 200 the typical sample
size in SEM studies; therefore, the current study followed this broad guideline. It is important
to note that an appropriate sample size depends on a number of factors and differs from one
situation to the next (Múthen & Múthen, 2002). Factors such as the size of the model, the
distribution (spread) and reliability (internal consistency) of the variables, the number of
missing data, the strength of the relationships between the variables, and statistical power
requirements influence the sample size (Múthen & Múthen, 2002).
1.4.3 Measuring Instruments
The following measuring instruments were utilised:
Biographical Questionnaire
A biographical questionnaire was used to determine the demographics of the research
participants in order to not only provide a detailed description of the study population, but also

14
to evaluate group differences on certain variables. These characteristics include age, gender,
home language, race, level of education, tenure, position, and job level in current organisation.
Authentic Leadership Inventory (ALI; Neider & Schriesheim, 2011)
The ALI was utilised for the purpose of measuring employees’ perception of their direct
supervisor as “authentic leader”, and was based on four first-order factors: Self-awareness,
balanced processing, internalised moral perspective and relational transparency. The ALI
consists of fourteen items. Example items include “My leader solicits feedback for improving
his/her dealings with others” and “My leader encourages others to voice opposing points of
view”. The items are scored on a five-point Likert-type scale ranging from 1 (disagree strongly)
to 5 (agree strongly). Cronbach’s alpha coefficients indicated that the scale in general is reliable
(α = .74 to .85; Neider & Schriesheim, 2011). After testing competing models in different
groups with different individuals rated as the leader, mixed results had been obtained. In one
group, a 14-item model with four first-order factors had the best fit with the data; whilst in the
other two groups, a second-order factor model fitted the data best. ALI item 9 had a mediocre
loading on its assigned factor (.46), compared to the rest of the items; and had a high level of
measurement error (.79; Neider & Schriesheim, 2011). In a South African context, the ALI
proved to be a reliable measure (α = .93; Stander et al., 2015).
Workplace Trust Survey (WTS: Ferres, 2003)
The WTS was used to measure trust in the leader. This subscale consists of nine items. An
example item includes “I act on the basis that my manager displays integrity in his/her actions”.
Items are recorded on a seven-point Likert scale ranging from 1 (strongly disagree) to 7
(strongly agree). Ferres and Travaglione (2003) demonstrated that the internal reliability was
consistently high (α = .96).
1.4.4 Procedure
After permission had been obtained from a representative of the Department of Health in the
Sedibeng district, information regarding the project and a consent letter requesting participation
were attached to the questionnaires. The information letter explained the objectives and
importance of the study as well as voluntary participation in the research. Participants were
allowed to complete the questionnaire at a venue of their choice after which they submitted the

15
completed questionnaires in a secured box at each medical facility. The gatekeeper identified
other suitable participants in the organisation who could participate in the study.
After permission had been obtained from management at the mining organisation, a consent
form explaining the objectives of the study was attached to the questionnaire and distributed to
the different managers. The managers were requested to disseminate the questionnaire among
their subordinates, which took approximately 30 minutes to complete. The participants had two
weeks to complete the questionnaire and reminder emails were sent one week after distribution
of the questionnaires. Completed questionnaires were submitted in a secure box located at the
Human Resource division. Participation in the study was voluntary and anonymity and
confidentiality were ensured.
1.4.5 Statistical Analysis
Mplus 7.31 (Muthén & Muthén, 1998-2012) was used for data analyses. Kline (2011) suggests
two steps to evaluate models when performing structural equation modelling (SEM) – also
known as latent variable modelling. Firstly, to test the factorial validity of the measurement
model, confirmatory factor analysis (CFA) was performed. The structural model was evaluated
next by adding the regression relationships in line with the hypotheses (Byrne, 2012). The best
fitting measurement model (indicating correlational relationships) was used as basis for the
structural models. The models were validated by obtaining estimates of the parameters of the
models and by determining whether the models provided good fit to the data (Byrne, 2012).
According to Kline (2011), a valid measurement model is needed before one can proceed to
specify the structural model and, therefore, all variables should be included in the measurement
model. It is important to note that competing models were tested with a Maximum Likelihood
Robust estimator (MLR), which takes into account the spread of the data (i.e. skewness and
kurtosis; Wang & Wang, 2012).
The following indices were used to assess the model fit in both steps: Chi-square (χ²); degrees
of freedom (df); Root Mean Square Error of Approximation (RMSEA); the Standardised Root
Mean Square Residual (SRMR); and incremental fit indices, including the Comparative Fit
Index (CFI) and the Tucker-Lewis Index (TLI). CFI and TLI values higher than .95 are
considered acceptable (Hu & Bentler, 1999). RMSEA values lower than .08 indicate acceptable
fit between the model and the data (Hair, Black, Babin, & Andersen, 2010). SRMR values

16
closer to zero are ideal, but values lower than .08 are acceptable (West, Taylor, & Wu, 2012).
Both the Akaike Information Criterion (AIC) and the Bayes Information Criteria (BIC) were
used to compare the measurement models; the lower the value, the better the model (Hair et
al., 2010). Chi-square values cannot be used directly to compare models; therefore the Satorra-
Bentler chi-square difference test was performed (Satorra & Bentler, 2001, 2010). The
reliabilities of the scales were calculated by means of composite reliability coefficients (ρ), a
confirmatory-based estimate of scale reliability recommended by Raykov (2009). The .70
guideline was used as cut-off value for reliability (Wang & Wang, 2012).
Measurement invariance testing was used where the hypotheses determined whether an
assessment instrument operated in the same way in different groups, and by determining
whether the underlying construct had the same meaning for each demographic (gender and
organisation) group. This is an important prerequisite for comparing groups on a certain
construct (Dimitrov, 2010). Three types of invariance need to be addressed, namely configural,
metric, and scalar. In the case of configural invariance, a baseline model for the multi-group
is identified (Byrne, 2012). Metric invariance refers to equal factor loadings across groups
which ensure the relationships between a latent factor and its items are equivalent; whereas
scalar invariance refers to intercepts being equivalent across groups, that is, item bias is not
present (Byrne, 2012; Dimitrov, 2010).
Measurement invariance is evaluated on three levels, namely weak (metric invariance is
required), strong (metric- and scalar invariance are required) and strict (metric-, scalar- and
invariance of item uniqueness are required) (Byrne, 2012; Dimitrov, 2010). In each case,
configural invariance was determined first, followed by metric invariance (Byrne, 2012;
Dimitrov, 2010). Parametrisation methods recommended by Van De Schoot et al. (2012) were
used. Invariance is accepted if the chi-square difference is not statistically significant when
comparing nested models (Byrne, 2012). A change of less than .01 in the CFI value is
recommended (Wang & Wang, 2012). In order to assess differences between gender and
organisational groups, differences in the mean scores were compared by means of t-tests. Only
in the event of significant differences, Cohen’s d was calculated to determine the practical
significance of such differences. Cohen’s d can be interpreted as follows: Trivial effect size (≤
0.20), small effect size (> 0.20), moderate effect size (≥ 0.50), or large effect size (≥ 0.80;
Cohen, 1988).

17
1.5 ETHICAL CONSIDERATIONS
An ethics application was submitted to the Ethics Committee of the North-West University for
approval prior to data collection in the health care organisation as part of a larger research
project (NWU-HS-2014-0146). Ethical approval was also obtained prior to data collection in
the mining organisation (OPT-2014-006). An ethics application was also submitted to obtain
permission for the use of primary data (health care) and secondary data (mining) for this
particular study (NWU-HS-2014-0253). The data collected in both these studies was done
anonymously. Ethical considerations that guided these research projects entailed that
participants were informed that their participation was voluntary; they gave informed consent;
and they were assured of anonymity and confidentiality of their responses. The primary
investigators took care not to cause harm to participants and to respect the rights and dignity
of all participants.
1.6 EXPECTED CONTRIBUTIONS OF THE STUDY
1.6.1 Expected Contributions for the Individual
In order for followers to perceive their leader as authentic (Weischer, Weibler, & Petersen,
2013), the leader’s thoughts and actions should reflect all four dimensions of authentic
leadership (Gardner et al., 2005; Illies et al., 2005). The value added by the four dimensions
collectively is also more than the sum of the individual dimensions; thus indicating synergy
(Du Plessis, 2014). It is, therefore, important to investigate whether the construct operates in
the same way in different groups and whether it has the same meaning for all, since it may
explain differences in the experiences and outcomes of authentic leadership. If it is found to be
a valid and reliable instrument, it can become a useful tool and guide for leadership
development in these organisations.
1.6.2 Expected Contributions for the Organisation
In the 2015 Human Capital Trends Report for South Africa, participants indicated that
leadership is one of the top five human capital trends that they perceive as important (Deloitte,
2015). Rothmann and Cooper (2015) support this by emphasising the importance of leadership
based on the number of publications on the topic. A comprehensive understanding of an

18
effective leadership “prototype” requires a sound understanding of the context in which leaders
operate. This is becoming increasingly important in a business environment where change is
inevitable (Haddon et al., 2015). Authentic leadership has been associated with a number of
positive outcomes for the organisation (Pues et al., 2012), as previously mentioned. Authentic
leadership development (ALD) is worth investing in for the organisation. However, Avolio and
Walumbwa (2014) emphasise that evidence-based interventions (such as ALD) should be
based on well-validated models and methods. Clapp-Smith et al. (2009) highlight the
importance of good research by stating that organisations turn to literature when making
decisions in terms of leadership development and selection. The results of the present study
may subsequently facilitate the tailoring of interventions for the specific organisation and
gender groups that participated.
1.6.3 Expected Contributions for I/O Psychology Research
In science, research cannot separate the “what” from the “how”. The knowledge one gains is
interlinked with the method used to acquire the knowledge (Nunnaly & Bernstein, 1994) and
valid measurement is at the core of explaining, studying and understanding phenomena,
especially leadership (Schriesheim & Cogliser, 2009). The study contributes to literature by
evaluating the validity (construct and concurrent) of the ALI in a South African mine. The
current study is the first study to date that establishes whether the ALI is equivalent across both
gender groups. If this can be demonstrated, future studies utilising this instrument can compare
the scores of gender groups on the authentic leadership construct.
Du Plessis (2014) assessed a variety of demographic differences when utilising the ALQ to test
some of the theoretical assumptions proposed by Eagly (2005) and Gardiner (2011). However,
a “less than perfect model fit” of the measurement model for authentic leadership in the study
led to subsequent analyses being interpreted with caution. Measurement invariance was also
not evaluated before the mean scores were compared. In a recent review of leadership and
leadership development, Day, Fleenor, Atwater, Sturm, and McKee (2014) highlighted the
unique challenges of developing female leaders. Eagly (2005) stated that it is even more
challenging for females, due to their minority status, to demonstrate relational authenticity, a
prerequisite for the social identification process through which followers are influenced.
Cooper, Scandura, and Schriesheim (2005) cautioned against rushing authentic leadership
development in practice before some of these core assumptions had been tested empirically.

19
The current study aims to test some of these assumptions empirically by comparing males and
females on different dimensions of authentic leadership, before making recommendations for
female leadership development.
Du Plessis (2014) proposed that future studies should examine measurement invariance of the
authentic leadership construct across different samples and occupational levels. In line with
this, the current study also paves the way for structural equivalence testing by being the first to
date to evaluate measurement invariance of the ALI across two different organisations.
According to Wang and Wang (2012), measurement invariance is a prerequisite for structural
invariance. In line with the recommendations provided by Roodt (2013), the current study
contributes to the process of generalising validity across countries and cultures by investigating
it in two different organisations.
1.7 CHAPTER DIVISION
Chapter 1: Introduction
Chapter 2: Research article
Chapter 3: Conclusions, limitations and recommendations

20
References
Aiken, L. H., Sermeus, W., Van den Heede, K., Sloane, D. M., Busse, R., McKee, M., &
Kutney Lee, A. (2012). Patient safety, satisfaction, and quality of hospital care: Cross-
sectional surveys of nurses and patients in 12 countries in Europe and the United States.
British Medical Journal, 344, 1–14. doi:10.1136/bmj.e1717
Algera, P. M., & Lips-Wiersma, M. (2012). Radical authentic leadership: Co-creating the
conditions under which all members of the organization can be authentic. The Leadership
Quarterly, 23(1), 118–131. doi:10.1016/j.leaqua.2011.11.010
Amunkete, S., & Rothmann, S. (2015). Authentic leadership, psychological capital, job
satisfaction and intention to leave in state-owned enterprises. Journal of Psychology in
Africa, 25(4), 271–281. doi:10.1080/14330237.2015.1078082
Anastasi, A., & Urbina, S. (1997). Psychological testing (7th ed.). Upper Saddle River, NJ:
Prentice-Hall.
Appelbaum, S. H., Audet, L., & Miller, J. C. (2003). Gender and leadership? Leadership and
gender? A journey through the landscape of theories. Leadership and Organization
Development Journal, 24(1), 43–51. doi:10.1108/ 01437730310457320
Armstrong, M., & Taylor, T. (2014). Amstrong's handbook of human resource management
practice (13th ed.). London, England: Kogan Page.
Avolio, B. J. (2007). Promoting more integrative strategies for leadership theory-building.
American Psychologist, 62(1), 25–33. doi:10.1037/0003-066X.62.1.25
Avolio, B. J., & Luthans, F. (2006). The high impact leader: Moments matter in accelerating
authentic leadership development. New York, NY: McGraw-Hill.
Avolio, B. J., & Mhatre, K. H. (2012). Advances in theory and research on authentic leadership.
In K. S. Cameron & G. M. Spreitzer (Eds.), The Oxford handbook of positive
organizational scholarship (pp. 773–783). New York, NY: Oxford University Press.
Avolio, B. J., Mhatre, K., Norman, S. M., & Lester, P. (2009). The moderating effect of gender
on leadership intervention impact: An exploratory review. Journal of Leadership &
Organizational Studies, 15(4), 325–341. doi:10.1177/1548051809333194
Avolio, B. J., & Walumbwa, F. O. (2014). Authentic leadership theory, research and practice:
Steps taken and steps that remain. In D. V. Day (Ed.), The Oxford handbook of leadership
and organizations (pp. 331–356). New York, NY: Oxford University Press.
Bakan, D. (1966). The duality of human existence: An essay on psychology and religion.
Skokie, IL: Rand McNally.

21
Balasubramanian, P., & Krishnan, V. R. (2012). Impact of gender and transformational
leadership on ethical behaviors. Great Lakes Herald, 6(1), 45–58.
Barton, D., Grant, A., & Horn, M. (2012). Leading in the 21st century: Six global leaders
confront the personal and professional challenges of a new era of uncertainty. Retrieved
from
http://www.mckinsey.com/insights/leading_in_the_21st_century/leading_in_the_21st_ce
ntury
Beddoes-Jones, F. (2012). Authentic leadership: The key to building trust. People
Management, 44–47.
Blau, P. M. (1964). Exchange and power in social life. New York, NY: John Wiley & Sons
Inc.
Boulding, K. E. (1956). General systems theory – the skeleton of science. Management
Science, 2(3), 197–208.
Byrne, B. M. (2012). Structural equation modeling with Mplus: Basic concepts, applications
and programming. New York, NY: Routledge Taylor & Francis Group.
Byrne, B. M., & Watkins, D. (2003). The issue of measurement invariance revisited. Journal
of Cross-Cultural Psychology, 34(2), 155–175. doi:10. 1177/0022022102250225
Câmara, J. R. S., & Pereira-Guizzo, C. (2015). Work-related values and organizational values
from the perspective of university professors: A correlational study. Estudos de Psicologia
(Campinas), 32(2), 259–268. doi:10.1590/0103-166x2015000200010
Cameron, K. S. (2005). Organizational effectiveness: Its demise and re-emergence through
positive organisational scholarship. In K. G. Smith & M. A. Hitt (Eds.), Great minds in
management: The process of theory development (pp. 304–330). New York, NY: Oxford
University Press.
Cameron, K., & Spreitzer, G. M. (2012).What is positive about positive organizational
scholarship? In K. Cameron & G. M. Spreitzer (Eds.), The Oxford handbook of positive
organizational scholarship (pp. 1–16). New York, NY: Oxford University Press.
Chamber of Mines. (2014). The mining industry in South Africa. Retrieved from
http://chamberofmines.org.za/mining-industry/comsa-members
Clapp-Smith, R., Vogelgesang, G. R., & Avey, J. B. (2009). Authentic leadership and positive
psychological capital: The mediating role of trust at the group level of analysis. Journal
of Leadership & Organizational Studies, 15(3), 227–240. doi:10.
10.1177/1548051808326596

22
Cohen, J. (1988). Statistical power analysis for the behavioral sciences (2nd ed.). Hillsdale,
NJ: Lawrence Erlbaum Associates.
Cooper, C. D., Scandura, T. A., & Schriesheim, C. A. (2005). Looking forward but learning
from our past: Potential challenges to developing authentic leadership theory and authentic
leaders. The Leadership Quarterly, 16(3), 475–493. doi:10.1016/j.leaqua.2005.03.008
Deloitte. (2013). Tough choices facing the South African mining industry. Retrieved from
http://deloitteblog.co.za/wp-content/uploads/2013/08/Tough-choices-facing-the-South-
African-mining-industry.pdf
Deloitte. (2015). 2015 Human capital trends report for South Africa: Leading in the new world
of work. Retrieved from http://www2.deloitte.com/content/dam/Deloitte/za
/Documents/human-capital/ZA_2015_HCTrends_SAvs4_120615.pdf
Day, D. V., Fleenor, J. W., Atwater, L. E., Sturm, R. E., & McKee, R. A. (2014). Advances in
leader and leadership development: A review of 25 years of research and theory. The
Leadership Quarterly, 25(1), 63–82. doi:10.1016/j.leaqua.2013.11.004
De Vos, A. S., Strydom, H., Fouché, C. B., & Delport, C. S. L. (2011). Research at grass roots
for the social sciences and human service professions (4th ed.). Pretoria, South Africa:
Van Schaik.
Dimitrov, D. M. (2010). Testing for factorial invariance in the context of construct validation.
Measurement and Evaluation in Counseling and Development, 43(2), 121–149.
doi:10.1177/0748175610373459
Ding, Z., Ng, F., & Wang, J. (2014). Testing trust scale measurement invariance in project
teams. Journal of Engineering, Design and Technology, 12(2), 209–222. doi:10.1108/jedt-
04-2012-0017
Dinwoodie, D. L., Quinn, L., & McGuire, J. B. (2014). Bridging the strategy/performance gap:
How leadership strategy drives business results. Retrieved from http://solutions-
sgd.ccl.org/leadership/pdf/research/BridgingTheStrategy.pdf
DoH (2011). National core standards for health establishments in South Africa. Retrieved from
http://www.sarrahsouthafrica.org/LinkClick.aspx?fileticket=YnbSHfR8S6Q=
Du Plessis, M. (2014). The relationship between authentic leadership, psychological capital,
followership and work engagement (Doctoral thesis). Retrieved from
http://etd.uwc.ac.za/xmlui/handle/11394/3903
Eagly, A. H. (1987). Sex differences in social behavior: A social-role interpretation. Hillsdale,
NJ: Erlbaum.

23
Eagly, A. H. (2005). Achieving relational authenticity: Does gender matter? The Leadership
Quarterly, 16, 459–474. doi:10.1016/j.leaqua.2005.03.007
Eagly, A. H. (2009). The his and hers of prosocial behavior: An examination of the social
psychology of gender. American Psychologist, 64(8), 644–658.
Eagly, A. H., & Johannesen-Schmidt, M. C. (2001). The leadership styles of men and women.
Journal of Social Issues, 57(4), 781–797. doi:10.1111/0022-4537.00241
Eagly, A. H., Johannesen-Schmidt, M. C., & Van Engen, M. L. (2003). Transformational,
transactional, and laissez-faire leadership styles: A meta-analysis comparing men and
women. Psychological Bulletin, 129(4), 569–591. doi:10.1037/0033-2909.129.4.569
Ferres, N. (2003). The development and validation of the Workplace Trust Survey (WTS):
Combining qualitative and quantitative methodologies (Unpublished master’s thesis).
University of Newcastle, Australia.
Ferres, N., & Travaglione, T. (2003, December). The development and validation of the
workplace trust survey (WTS): Combining qualitative and quantitative methodologies.
Paper presented at APROS, Mexico.
Gardiner, R. A. (2011). A critique of the discourse of authentic leadership. International
Journal of Business and Social Science, 2(15), 99–104.
Gardner, W. L., Avolio, B. J., Luthans, F., May, D. R., & Walumbwa, F. O. (2005). “Can you
see the real me?” A self-based model of authentic leader and follower development. The
Leadership Quarterly, 16, 343–372. doi:10.1016/j.leaqua.2005.03.003
Gardner, W. L., Cogliser, C. C., Davis, K. M., & Dickens, M. P. (2011). Authentic leadership:
A review of the literature and research agenda. The Leadership Quarterly, 22(6), 1120–
1145. doi:10.1016/j.leaqua.2011.09.007
George, B. (2010). The new 21st century leaders. Retrieved from https://hbr.org/2010/04/the-
new-21st-century-leaders-1/
George, G., Atujuna, M., & Gow, J. (2013). Migration of South African health workers: The
extent to which financial considerations influence internal flows and external movements.
BMC Health Services Research, 13(1), 297–310. doi:10.1186/1472-6963-13-297
Giallonardo, L. M., Wong, C. A., & Iwasiw, C. L. (2010). Authentic leadership of preceptors:
Predictor of new graduate nurses’ work engagement and job satisfaction. Journal of
Nursing Management, 18(8), 993–1003. doi:10.1111/j.1365-2834.2010.01126.x
Gilbert, G. R., Burnett, M. F., Phau, I., & Haar, J. (2010). Does gender matter? A review of
work‐related gender commonalities. Gender in Management: An International Journal,
25(8), 676–699. doi:10.1108/17542411011092336

24
Gobind, J. (2013). The Employment Equity Act has failed women. In A. Bosch (Ed.), South
African Board for People Practices women’s report 2013 (pp. 8–13). Parktown, South
Africa: SABPP.
Haddon, A., Loughlin, C., & McNally, C. (2015). Leadership in a time of financial crisis: what
do we want from our leaders? Leadership & Organization Development Journal, 36(5),
612–627. doi:10.1108/lodj-12-2013-0166
Hair, J. F., Black, W. C., Babin, B. J., & Anderson, R. E. (2010). Multivariate data analysis:
A global perspective. Upper Saddle River, NJ: Pearson.
Hannah, S. T., Uhl-Bien, M., Avolio, B. J., & Cavaretta, F. L. (2009). A framework for
examining leadership in extreme contexts. The Leadership Quarterly, 20, 897–919.
doi:10.1016/j.leaqua.2009.09.006
Henderson, J. E., & Hoy, W. K. (1983). Leader authenticity: The development and test of an
operational measure. Educational and Psychological Research, 3(2), 63–75.
Hinkin, T. R. (1998). A brief tutorial on the development of measures for use in survey
questionnaires. Organizational Research Methods, 1, 104–121.
Horn, J. L., & McArdle, J. J. (1992). A practical and theoretical guide to measurement
invariance in aging research. Experimental Aging Research, 18(3-4), 117–144. Retrieved
from
http://nwulib.nwu.ac.za/login?url=http://search.ebscohost.com/login.aspx?direct=true&d
b=edselc&AN=edselc.2-52.0-0026481045&site=eds-live
Hu, L., & Bentler, P. M. (1999). Cut-off criteria for fit indexes in covariance structure analysis:
Conventional criteria versus new alternatives. Structural Equation Modeling, 6(1), 1–55.
doi:10.1080/10705519909540118
Illies, R., Morgeson, F. P., & Nahrgang, J. D. (2005). Authentic leadership and eudamonic
well-being: Understanding leader-follower outcomes. The Leadership Quarterly, 16, 373–
394. doi:10.1016/j.leaqua.2005.03.002
Jooste, K. (2004). Leadership: A new perspective. Journal of Nursing Management, 12(3),
217–23. doi:10.1111/j.1365-2834.2003.00450
Joshanloo, M., Wissing, M. P., Khumalo, I. P., & Lamers, S. M. A. (2013). Measurement
invariance of the Mental Health Continuum-Short-Form (MHC-SF) across three cultural
groups. Personality and Individual Differences, 55(7), 755–759. doi:10.
1016/j.paid.2013.06.002
Katz, D., & Kahn, R. L. (1978). The social psychology of organizations (2nd ed.). New York,
NY: Wiley.

25
Kernis, M. H. (2003). Toward a conceptualization of optimal self-esteem. Psychological
Inquiry, 14(1), 1–26. doi:10.1207/s15327965pli1401_01
Kernis, M. H., & Goldman, B. M. (2006). A multicomponent conceptualization of authenticity:
Theory and research. Advances in Experimental Social Psychology, 38, 283–348.
doi:10.1016/S0065-2601(06)38006-9
Kline, R. B. (2011). Principles and practice of structural equation modeling (3rd ed.). New
York, NY: The Guilford Press.
Koenig, A. M., Eagly, A. H., Mitchell, A. A., & Ristikari, T. (2011). Are leader stereotypes
masculine? A meta-analysis of three research paradigms. Psychological Bulletin, 137,
616–642. doi:10.1037/a0023557
Kumar, R. D. C. (2013). Leadership in health care. Anaesthesia and Intensive Care Medicine,
14, 39–41. doi:10.1016/j.mpaic.2012.11.006
Laschinger, H. K. S., & Fida, R. (2014). A time-lagged analysis of the effect of authentic
leadership on workplace bullying, burnout, and occupational turnover intentions.
European Journal of Work and Organizational Psychology, 23(5), 739–753.
doi:10.1080/1359432X.2013.804646
Luthans, F. (2002a). The need for and meaning of positive organizational behavior. Journal of
Organizational Behavior, 23(6), 695–706. doi:10.1002/job.165
Luthans, F. (2002b). Positive organizational behaviour: Developing and managing
psychological strengths. Academy of Management Executive, 16(1), 57–72.
Maldanado, M. L. (2013, March). How authentic is your leadership development? Chief
Learning Officer, 26–29.
McColl-Kennedy, J. R., & Andersen, R. D. (2005). Subordinate-manager gender combination
and perceived leadership style’s influence on emotions, self-esteem and organizational
commitment. Journal of Business Research, 58, 115–125. doi: http://dx.doi.org/10.
1016/S0148-2963(03)00112-7
Miller, J. G. (1965). Living systems: Basic concepts. Behavioral Science, 10(3), 193–237.
doi:10.1002/bs.3830100302
Mishra, A. K., & Mishra, K. E. (2012). Positive organizational scholarship and trust in leaders.
In K. S. Cameron & G. M. Spreitzer (Eds.), The Oxford handbook of positive
organizational scholarship (pp. 449–461). New York, NY: Oxford.
Mosadeghrad, A. M. (2014). Factors influencing health care service quality. International
Journal of Health Policy and Management, 3(2), 77–89. doi:10.15171/ijhpm.2014.65

26
Munyaka, S. A. (2012). The relationship between authentic leadership, psychological capital
and, psychological climate, team commitment and the intention to quit in a South African
manufacturing organisation (Unpublished doctoral dissertation). Nelson Mandela
Metropolitan University, Port Elizabeth.
Múthen, L. K., & Múthen, B. O. (1998–2012). Mplus user’s guide (7th ed.). Los Angeles, CA:
Múthen & Múthen.
Múthen, L. K., & Múthen, B. O. (2002). How to use a Monte Carlo study to decide on sample
size and determine power. Retrieved from
http://www.statmodel.com/bmuthen/articles/Article_096.pdf
Neider, L. L., & Schriesheim, C. A. (2011). The Authentic Leadership Inventory (ALI):
Development and empirical tests. The Leadership Quarterly, 22(6), 1146–1164.
doi:10.1016/j.leaqua.2011.09.008
Nguyen, L. D., Ermasova, N., Geyfman, V., & Mutjaba, B. G. (2014). Leadership orientation
of Russian working adults: Do age, gender, education, and government work experience
make a difference? Public Organization Review, 1–15. doi:10.1007/s11115-014-0279-6
Northouse, P. G. (2013). Leadership, theory and practice (6th ed.). Thousand Oaks, CA:
SAGE.
Nunnally, J. C., & Bernstein, I. H. (1994). Psychometric theory (3rd ed.). New York, NY:
McGraw-Hill.
Onorato, M., & Zhu, J. (2014). An empirical study on the relationships between authentic
leadership and organizational trust by industry segment. SAM Advanced Management
Journal, 79(1), 26–39.
Paul, P. S., & Maiti, J. (2005). Development and test of a sociotechnical model for
accident/injury occurrences in underground coal mines. Journal of South African Institute
of Mining and Metallurgy, 105(1), 43–55.
Paustian-Underdahl, S. C., Walker, L. S., & Woehr, D. J. (2014). Gender and perceptions of
leadership effectiveness – A meta-analysis of contextual moderators. Journal of Applied
Psychology, 99(6), 1129–1145. doi:10.1037/a0036751
PricewaterhouseCoopers. (2013). Mending the gender gap – Advancing tomorrow’s women
leaders. Retrieved from http://www.pwc.co.za/en/press-room/gender-pay.jhtml
PricewaterhouseCoopers. (2014). SA Mine: Highlighting trends in the South African mining
industry. Retrieved from http://www.pwc.co.za/en_ZA/za/assets/pdf/sa-mine-2014-6th-
edition-21-nov.pdf

27
Pues, C., Wesche, J. S., Streicher, B., Braun, S., & Frey, D. (2012). Authentic leadership: An
empirical test of its antecedents, consequences, and mediating mechanisms. Journal of
Business Ethics, 107, 331–348. doi:10.1007/s10551-011-1042-3
Raykov, T. (2009). Evaluation of scale reliability for unidimensional measures using latent
variable modeling. Measurement and Evaluation in Counseling and Development, 42(3),
223–232. doi:10.1177/0748175609344096
Read, E., & Laschinger, H. K. (2013). Correlates of new graduate nurses’ experiences of
workplace mistreatment. Journal of Nursing Administration, 43(4), 221–228.
doi:10.1097/NNA.0b013e3182895a90
Roe, R. A., & Ester, P. (1999). Values and work: Empirical findings and theoretical
perspective. Applied Psychology: An International Review, 48(1), 1–21.
Roodt, G. (2013). Validity: Basic concepts and measures. Introduction to psychological
assessment in the South African context (4th ed.). Cape Town, South Africa: Oxford
University Press.
Rothmann, S., & Cooper, C. L. (2015). Work and organizational psychology (2nd ed.). East
Sussex, England: Routledge.
Roux, S. (2010). The relationsip between authentic leadership, optimism, self-efficacy and
work engagement: An exploratory study (Master's thesis). Retrieved from
https://scholar.sun.ac.za/handle/10019.1/2182
Satell, G. (2014, April). To create change, leadership is more important than authority.
Retrieved from https://hbr.org/2014/04/to-create-change-leadership-is-more-important-
than-authority/
Satorra, A., & Bentler, P. M. (2001). A scaled difference chi-square test statistic for moment
structure analysis. Psychometrika, 66(4), 507–514.
Satorra, A., & Bentler, P. M. (2010). Ensuring positiveness of the scaled difference chi-square
test statistic. Psychometrika, 75, 243–248. doi:10.1007/S11336-009-9135-Y
Schein, V. E. (1973). The relationship between sex role stereotypes and requisite management
characteristics. Journal of Applied Psychology, 57(2), 95–100. doi:10.1037/h0037128
Schein, V. E. (2007). Women in management: Reflections and projections. Women in
Management Review, 22(1), 6–18. doi:10.1108/09649420710726193
Schriesheim, C. A., & Cogliser, C. C. (2009). Construct validation in leadership research:
Explication and illustration. The Leadership Quarterly, 20(5), 725–736.
doi:10.1016/j.leaqua.2009.06.004

28
Schriesheim, C. A., Cogliser, C. C., Scandura, T. A., Lankau, M. J., & Powers, K. J. (1999).
An empirical comparison of approaches for quantitatively assessing the content adequacy
of paper-and-pencil measurement instruments. Organizational Research Methods, 2, 140–
156. doi:10.1177/109442819922002
Schriesheim, C. A., Powers, K. J., Scandura, T. A., Gardiner, C. C., & Lankau, M. J. (1993).
Improving construct measurement in management research: Comments and a quantitative
approach for assessing the theoretical content adequacy of paper-and-pencil survey-type
instruments. Journal of Management, 19, 385–417. doi:10.1177/014920639301900208
Seligman, M. E. P., & Csikszentmihalyi, M. (2000). Positive psychology: An introduction.
American Psychologist, 55(1), 5–14. doi:10.1037//003-066X.55.1.5
Spence, J. T., & Buckner, C. E. (2000). Instrumental and expressive traits, trait stereotypes,
and sexist attitudes: What do they signify? Psychology of Women Quarterly, 24(1), 44–
53. doi:10.1111/j.1471-6402.2000.tb01021.x
Stander, F. W., De Beer, L. T., & Stander, M. W. (2015). Authentic leadership as a source of
optimism, trust in the organisation and work engagement in the public health care sector.
South African Journal of Human Resource Management, 13(1), Art. #675, 12 pages.
doi:10.4102/sajhrm.v13i1.675
Van De Schoot, R., Lugtig, P., & Hox, J. (2012). A checklist for testing measurement
invariance. European Journal of Developmental Psychology, 9(4), 486–492.
doi:10.1080/17405629.2012.686740
Van De Vijver, F. J. R., & Leung, K. (1997). Methods and data analysis of comparative
research. In J. W. Berry, Y. H. Poortinga, & J. Pandey (Eds.), Handbook of cross-cultural
psychology, Vol. 1: Theory and method (2nd ed., pp. 257–300). Needham Heights, MA:
Allyn & Bacon.
Van De Vijver, F. J. R., & Leung, K. (2011). Equivalence and bias: A review of concepts,
models, and data analytic procedures. In D. Matsumoto & F. J. R. Van De Vijver (Eds.),
Cross-cultural research methods in psychology (pp. 17–45). New York, NY: Cambridge
University Press.
Vecchio, R. P. (2002). Leadership and gender advantage. The Leadership Quarterly, 13(6),
643–671. doi:10.1016/S1048-9843(02)00156
Walumbwa, F. O., Avolio, B. J., Gardner, W. L., Wernsing, T. S., & Peterson, S. J. (2008).
Authentic leadership: Development and validation of a theory-based measure. Journal of
Management, 34(1), 89–126. doi:10.1177/0149206307308913

29
Walumbwa, F. O., & Schaubroeck, J. (2009). Leader personality traits and employee voice
behaviors: Mediating roles of ethical leadership and work group psychological safety.
Journal of Applied Psychology, 94(5), 1275–1286. doi:10.1037/a0015848
Wang, D-S., & Hsieh, C-C. (2013). The effect of authentic leadership on employee trust and
employee engagement. Social Behavior and Personality: An international Journal, 41(4),
613-624. doi:10.2224/sbp.2013.41.4.613
Wang, J., & Wang, X. (2012). Structural equation modeling: Applications using Mplus.
Chichester, England: Wiley.
Weischer, A. E., Weibler, J., & Petersen, M. (2013). "To thine own self be true": The effects
of enactment and life storytelling on perceived leader authenticity. The Leadership
Quarterly, 24(4), 477–495. doi:10.1016/j.leaqua.2013.03.003
West, S. G., Taylor, A. B., & Wu, W. (2012). Model fit and model selection in structural
equation modeling. In R. D. Hoyle (Ed.), Handbook of structural equation modeling (pp.
209–231). New York, NY: The Guilford Press.
Wong, C. A., Laschinger, H. K. S., & Cummings, G. G. (2010). Authentic leadership and
nurses’ voice behaviour and perceptions of quality care. Journal of Nursing Management,
18, 889–900. doi:10.1111/j.1365-2834.2010.01113
Woolley, L., Caza, A., & Levy, L. (2011). Authentic leadership and follower development:
Psychological capital, positive work climate, and gender. Journal of Leadership &
Organizational Studies, 18(4), 438–448. doi:10.1177/1548051810382013
Zbierowski, P., & Góra, K. (2014). Positive leadership: Its nature, antecedents and
consequences. Journal of Positive Management, 5(1), 85–99.
doi:10.12775/JPM.2014.008

30
CHAPTER 2
RESEARCH ARTICLE

31
Authentic Leadership Inventory (ALI): Measurement invariance in selected industries
in South Africa
Abstract
A need exists for validating the authentic leadership construct across different contexts and
ensuring measurement invariance of the Authentic Leadership Inventory (ALI) in different
groups. Despite this need, few attempts have been made in a South African context to evaluate
the psychometric properties of this instrument and to demonstrate its invariance. The aim of
this study was to evaluate measurement invariance of the ALI in two organisations from
different industries, after the construct and concurrent validity of the instrument had been
investigated. A cross-sectional survey with two convenience samples, namely mining (N =
244) and public health care (N = 633) was used. The ALI, a sub-scale of the Workplace Trust
Scale (WTS), and a biographical questionnaire were administered. The results showed that a
one-factor model fitted the data best in the mining organisation and that authentic leadership
significantly predicted followers’ trust in the leader. Measurement invariance was evaluated
by gender and organisational groups and in both instances only partial invariance could be
established. Finally, no significant differences existed in terms of the mean levels of authentic
leadership for the respective gender and organisational groups. This has important implications
for both researchers and practitioners utilising the ALI.
Keywords
Authentic leadership, extreme contexts, gender, mining, public health care, trust in leader,
validation

32
Introduction
Organisations are continuously reviewing leadership research in search of empirical support
that will inform their decisions when they select and develop leaders (Clapp-Smith,
Vogelgesang, & Avey, 2009). These evidence-based decisions enable organisations to achieve
strategic goals by creating a convincing vision and influencing followers (House, Dorfman,
Javidan, Hanges, & Sully De Luque, 2013). In science, the way in which one gains knowledge
cannot be separated from the manner in which knowledge has been obtained (Nunnally &
Bernstein, 1994). This emphasises the importance of valid measurement when explaining,
studying and understanding phenomena (Liden et al., 2015; Schriesheim & Cogliser, 2009) -
authentic leadership in this case. Valid measurement is complicated by (a) the fact that
leadership behaviour is defined differently, individuals understand items differently and
respond differently to instrument response scales in different contexts (Byrne & Watkins,
2003); and (b) unobservable constructs - such as authentic leadership - are then hypothesised
to be related to other constructs (Nunnally & Bernstein, 1994), for example trust. Despite
previous research confirming the ability of authentic leaders to create trust, a one-size-fits-all
approach in applying these findings is not recommended because leadership is in the “eye of
the beholder” (Avolio & Walumbwa, 2014; Paustian-Underdahl, Walker, & Woehr, 2014).
Organisations too often assume that a leadership approach that is effective in one
organisation will automatically be effective in another organisation and continued research
should be done to examine leadership models across different contexts (Haddon, Loughlin, &
McNally, 2015). In line with this, the current study endeavours to investigate invariance
(equivalence) of the authentic leadership construct in two extreme contexts. During times of
prolonged stress, such as in these contexts, trust in the leader is a determining factor for
follower persistence and performance (Sweeney, Thompson, & Blanton, 2009) and authentic
leadership has the potential to make a difference in these contexts.
Measurement invariance (equivalence) would mean that individuals interpret both the
observed indicators (items) and the underlying latent factor in the same manner (Van De
Schoot, Lugtig, & Hox, 2012). One needs to investigate the factor structure (factorial validity)
in different groups before one can proceed to measurement invariance testing (Byrne, 2012;
Wang & Wang, 2012). The validity of a measurement is concerned with what the test measures
and how well it measures what it says it measures (Anastasi & Urbina, 1997). The investigation

33
of validity usually starts with a theoretical definition of the construct, thereafter determining
its relationship with other constructs (Ghiselli, Campbell, & Zedeck, 1981; Roodt, 2013).
Specifically, construct validity is considered to be a fundamental validity concept, as it reflects
the operationalisation of a theoretical construct and the degree to which directly observable
indicators reflect the underlying theory (Anastasi & Urbina, 1997). Although three major
subtypes of validity – content-description, construct-identification and criterion-prediction –
can be distinguished, construct validity seems to be the most fundamental in leadership
research (Schriesheim & Cogliser, 2009).
The conceptualisation of authentic leadership has been challenged by a variety of
perspectives on the construct, leading to fragmentation (Gardner, Cogliser, Davis, & Dickens,
2011; Khilji, Keilson, Shakir, & Shrestha, 2015); with empirical data supporting the well-
known model of authentic leadership (see Walumbwa, Avolio, Gardner, Wernsing, & Peterson,
2008) being subjected to negative criticism (Beddoes-Jones & Swailes, 2015; Neider &
Schriesheim, 2011). Given that the construct is fairly under-researched, Gardner et al. (2011)
argued that more internal and external validation studies should be conducted. The present
study, subsequently, investigated the construct validity of authentic leadership as
operationalised by the Authentic Leadership Inventory (ALI), as well as the concurrent validity
by means of its relationship with trust.
The present study focuses on two organisations from different industries, namely mining
and public health care. These two industries differ in terms of the risks that they pose, physical
versus psychological, but they can also be contrasted as male- versus female-dominated. Liu,
Cutcher, and Grant (2015) advocate that leadership is not gender neutral and leaders need to
understand gender differences in order to be successful in the contemporary business
environment (Nguyen, Ermasova, Geyfman, & Mujtaba, 2014). Differences in the value that
males and females attach to certain leadership behaviours may influence the extent to which
leaders are perceived as being effective (Avolio, Mhatre, Norman, & Lester, 2009; McColl-
Kennedy & Anderson, 2005). Other researchers (Avolio & Walumbwa, 2014; Vecchio, 2002),
however, are of the opinion that consideration of normative gender characteristics offers a too
simplistic view and the context should also be taken into account. Paustian-Underdahl et al.
(2014) included the type of organisation as one such contextual variable. Once measurement
invariance has been established, latent means of multiple groups can be compared (Byrne,
2012; Wang & Wang, 2012). The current study subsequently attempted to demonstrate if ALI

34
is invariant across gender groups and if significant differences exist between the two gender
groups on the dimensions of authentic leadership. If invariant and no gender differences exist,
differences may be ascribed to the organisational (extreme) context.
Hannah, Uhl-Bien, Avolio, and Cavarretta (2009) define extreme contexts as:
…an environment where one or more extreme events are occurring or are likely to occur
that may exceed the organisation's capacity to prevent and result in an extensive and
intolerable magnitude of physical, psychological, or material consequences to - or in
close physical or psycho-social proximity to - organisation members (p. 898).
The aforementioned authors are of the opinion that extreme contexts, contexts which pose
significant risks, require good leadership to guide and support employees in dealing with these
risks (Hannah et al., 2009). Effective leaders who have authentic relationships with followers
would display care for both the physical and psychological well-being of their employees
(Birkeland Nielsen, Eid, Mearns, & Larsson, 2013); well-being that is significantly at risk in
these contexts. Leadership theory cannot be loosely applied due to the inherent differences
between these contexts (Hannah et al., 2009). This is supported by research stating that
organisational values differ, depending on the sphere of activity (public versus private sector,
as cited in Diskienė & Goštautas, 2010) which in turn forms an important element of the culture
of the organisation (Schein, 1985). The main aim of the present study was to investigate
measurement invariance and mean differences between these contexts in terms of authentic
leadership. As required, the researcher started off with the investigation of construct and
concurrent validity of the instrument as well as accounting for the possible impact of gender
non-equivalence and mean differences.
Literature review
Internal consistency, construct and concurrent validity of the ALI
The concept of authentic leadership has its origin in positive psychology (Seligman &
Csikszentmihalyi, 2000) and, more recently, is considered a characteristic of positive leaders
(Mishra & Mishra, 2012; Zbierowski & Góra, 2014). Authentic leadership is defined as
leadership that “draws on positive psychological capacities and positive ethical climate to
35
foster the four core dimensions of authentic leadership, enabling positive follower self-
development” (Walumbwa et al., 2008, p. 94).
In order to understand what the authentic leadership definition should entail, Walumbwa et
al. (2008) used earlier conceptualisations by Avolio and Gardner (2005); Gardner, Avolio,
Luthans, May, and Walumbwa (2005); Kernis and Goldman (2006); and Ilies, Morgeson, and
Nahrgang (2005), which, after both theoretical and empirical refinement, culminated into four
dimensions. The first dimension, self-awareness, refers to a process of reflection which enables
the leader to gain insight into various intrapersonal characteristics (i.e. values, strengths,
personality) and the impact thereof on followers (Kernis, 2003). The second dimension,
internalised moral perspective, refers to strong moral convictions which guide behaviour and
decision making from a self-regulation perspective (Gardner et al., 2005). Decision making is
also influenced by balanced processing, the third dimension, in which the individual gathers
information and reaches decisions as objectively as possible, often challenging his/her own
deeply held beliefs and values (Gardner et al., 2005). Working from the inside out, it allows
leaders to share their inner feelings and thoughts openly, referring to relational transparency
(Kernis, 2003), the fourth dimension. These four latent factors form the lower-order factors
measured by the ALQ (Walumbwa et al., 2008).
Owusu-Bempah, Addison, and Fairweather (2014) illustrate that “authenticity” is a title
given to the leader when there is alignment between the leader’s behaviour and values, also
between the expectations of the leader and followers, and when the integrity of the leader leads
to positive outcomes for both followers and the organisation. These three conditions can only
be met when there is interaction between the leaders and followers and the interaction is
construed based on the followers’ understanding of authenticity and authentic leadership
(Owusu-Bempah et al., 2014). Gardner et al. (2005) and Ilies et al. (2005) state that authentic
leaders’ actions and thoughts should reflect all four dimensions in order to be considered
authentic. According to Neider and Schriesheim (2011), theoretically distinct dimensions are
not always perceived as distinct and separate by the respondents. This has important
implications if one considers the fact that our knowledge regarding abstract concepts is
restricted by the extent to which the observed indicators are an accurate reflection of the
underlying theory (Schriesheim & Cogliser, 2009).

36
The creation of the well-known model of authentic leadership was followed by the
development of the widely used Authentic Leadership Questionnaire (ALQ) by Walumbwa
and his colleagues to operationalise the construct (Walumbwa et al., 2008). Neider and
Schriesheim (2011) developed the ALI in response to three major critiques on the ALQ: The
analysis of the content was too subjective, the parameters used may have possibly inflated
model fit, and access to the instrument may be limited. Subsequently, they developed four
items for each of the dimensions based on the two example items for each dimension provided
of the ALQ, yielding sixteen items in total. The researchers proceeded with content validation
in Study 1, and concluded theoretical content validity for the new scale with the suggested
exclusion of items 1 and 6 in the final version. Study 2 tested reliability as well as construct
and divergent validity, as well as freedom from impression management. Results confirmed
internal consistency, freedom from impression management and divergent validity (Neider &
Schriesheim, 2011). Construct validity yielded mixed findings between the two participating
groups. The third study focused on formally testing convergent, discriminant and concurrent
validity. Study 3 confirmed the higher-order factor structure of authentic leadership. The final
version of the ALI contains fourteen items (Neider & Schriesheim, 2011). A number of
concerns were highlighted in their study. Several measurement models were tested with
differential results depending on the leader that was described, with authentic leadership being
a lower-order four-factor model as well as a high-order global variable consisting of four lower-
order factors (Neider & Schriesheim, 2011).
The present study adds to previous research by investigating the validity of the ALI in a
South African context. South Africa differs significantly from Western countries on a variety
of aspects impacting the way in which observable indicators may be interpreted (Joshanloo,
Wissing, Khumalo, & Lamers, 2013). The majority of authentic leadership validation studies
so far have been conducted in Western contexts with the ALQ (Avolio & Walumbwa, 2014;
Owusu-Bempah et al., 2014). Limited studies conducted in the South African context (see Du
Plessis, 2014; Munyaka, 2012; Roux, 2010) have also utilised the ALQ. Mixed findings
(Neider & Schriesheim, 2011), and poor (Du Plessis, 2014) or no model fit (Munyaka, 2012)
also necessitate more research on the construct validity of authentic leadership, especially in
multicultural contexts.
In a study conducted by Stander, De Beer, and Stander (2015) in a health care organisation,
authentic leadership, as measured by the ALI, was estimated as one factor and significantly
37
predicted trust in the organisation. These authors also found the ALI to be a reliable measure
within this organisation (Stander et al., 2015). Based on the original theoretical and operational
definition of authentic leadership, the current study will evaluate the factorial validity,
concurrent validity and reliability of the ALI in the mining industry. In line with this, the first
and second hypotheses of the study are as follows:
Hypothesis 1: Authentic leadership, as measured by the ALI, comprises four latent
variables, namely balanced processing, internalised moral perspective, relational
transparency and self-awareness which all load onto a higher-order latent variable in the
mining organisation.
Hypothesis 2: Authentic leadership, as measured by the ALI, has acceptable internal
consistency, i.e. reliability in the mining organisation.
Concurrent validity of the ALI will show promise for future use to predict consequences of
authentic leadership such as trust. Trust is defined as “an individual’s willingness to act on the
basis of his/her perception of a trust referent (peer, supervisor/manager or organisation) being
supportive/caring, ethical, competent and cognisant of others’ performance” (Ferres, 2003, p.
8). For the purpose of this study, the focus is on trust in the leader (manager). Gaining trust is
challenging during turbulent times (Norman, Avolio, & Luthans, 2010), yet important for the
process of influencing followers (Wang & Hsieh, 2013). The actions and words of leaders
determine whether trust will be created, both now and in future (Kasper-Fuehrer & Ashkanasy,
2001) and authentic leaders influence followers’ behaviours through trust in the leader (Clapp-
Smith et al., 2009; Hassan & Ahmed, 2011; Wang & Hsieh, 2013). The Social Exchange
Theory posits that reciprocal relationships cannot exist without trust (Blau, 1964). If there is
consistency between leaders’ actions and thoughts and if leaders act with integrity, followers
will more likely trust their leaders (Wang & Hsieh, 2013). The third hypothesis of this study is
as follows:
Hypothesis 3: Authentic leadership, as measured by the ALI, is a significant predictor of
trust in the leader in the mining organisation.

38
Authentic leadership and gender
Despite more research on authentic leadership, Liu et al. (2015) state that research on gender
and authenticity is at infancy stage. Luthans and Avolio (2003) explained that leader-follower
interactions are influenced by both leaders’ and followers’ expectations, perceptions, and the
values with which they enter the organisation. During these interactions, followers specifically
evaluate whether the behaviour displayed by the leader reflects the leader’s values,
subsequently judging whether the leader is authentic. This judgement, however, is influenced
by followers’ characteristics (Owusu-Bempah et al., 2014).
This is in line with the recognition-based approach to distinguish leaders from non-leaders
which postulates that follower characteristics influence the evaluation of a central person
(Keller, 1999). One such characteristic is gender (Avolio et al., 2009; McColl-Kennedy &
Anderson, 2005). Previous research on gender and social interaction has focused on the
communalities between male and female responses respectively, which can then be categorised
as agentic and communal (Eagly, 1987; Haddon et al., 2015; Koenig, Eagly, Mitchell, &
Ristikari, 2011). Females have higher mean scores on the communal category, whereas males
score higher on the agentic category (Eagly, 1987, 2009; Spence & Buckner, 2000). Typical
communal characteristics are mainly concerned with the welfare of others (i.e. being helpful,
kind, and interpersonally sensitive), as opposed to agentic characteristics that are mainly
concerned with the welfare of the self (i.e. assertiveness, confidence, and control; Eagly &
Karau, 2002). These differences are supported by the Social Role Theory which postulate that
men and women display and value different behaviours in social situations in accordance with
existing stereotypes (Eagly, 1987). Sex trait stereotypes refer to both the psychological
characteristics and the behavioural traits which are more (or less) characteristic of one gender
as opposed to the other (Rudman & Goodwin, 2004; Williams & Best, 1990), and stereotypes
are broadly accepted and pervasive (Broverman, Vogel, Broverman, Clarkson, & Rosenkrantz,
1972; Hyde, 2014; Merchant, 2012; Williams & Best, 1990) from a very young age (Merchant,
2012; Mulvey & Killen, 2015).
Authentic leaders are characterised by being true to themselves, being transparent regardless
of the costs to themselves and having the interests of others at heart (Avolio, Gardner,
Walumbwa, Luthans, & May, 2004; Gardner et al., 2005; Kernis, 2003; Luthans & Avolio,
2003). Based on the characteristics identified as communal, one would expect authentic leaders

39
to conform more toward what one would describe as “feminine” characteristics - being valued
more by females. Eagly and Karau (2002) described this as similarity between perceivers’
stereotypes of a certain gender and their prototypes of leaders. Bellou (2011) concluded that
there are differences in leadership preferences for male and female followers, with females
valuing communal behaviours such as interdependence and openness to change.
In a study on leadership empowerment behaviour, Zikalala (2014) found no significant
differences in males and females’ overall interpretation of the construct. Mitonga-Monga,
Coetzee, and Cilliers (2012) found statistically significant mean differences between males and
females on perceived leadership style. Specifically relating to authentic leadership, Du Plessis
(2014) only found significant mean differences between genders on the balanced processing
dimension of the authentic leadership construct. Before one can compare the latent means of
different groups, measurement invariance needs to be established (Dimitrov, 2010; Van De
Schoot et al., 2012) to indicate that males and females interpret the items and construct of
authentic leadership the same. It is important to note that neither Mitonga-Monga and his
colleagues nor Du Plessis established measurement invariance before comparing mean scores.
Therefore, the fourth and fifth hypotheses of this study are:
Hypothesis 4: Authentic leadership, as measured by the ALI, is equivalent across gender
groups.
Hypothesis 5: There are significant mean differences on the dimensions of the ALI for males
and females.
Authentic leadership and organisational context
Avolio and Walumbwa (2014) and Paustian-Underdahl et al. (2014) argue that it is important
to consider leadership in context. Compared to the mining industry which is male-dominated,
the health care industry is more female-dominated. Liu et al. (2015) criticise gendered
leadership research as being similar to research on authentic leadership in that it considers both
gender and authentic leadership as a characteristic - something that one has, as opposed to
something that one does. From a performativity perspective (Butler, 1988, 1999), social norms
and conventions influence the development of gender identity and also prescribe how different
genders should behave (Butler, 1993). This means that men and women can adopt “masculine”

40
or “feminine” traits irrespective of their biological gender (Billing & Alvesson, 2000),
depending on the dominating norms and conventions in any given context.
Balasubramanian and Krishnan (2012) support this by saying that the type of organisation
in which males or females work determine differences in leadership styles. This gives rise to
the notion that leaders can be identified and evaluated not only from a gender perspective, but
also from an organisational (context) perspective as proposed by Baumgardner, Lord, and
Maher (1991). Roe and Ester (1999) are of the opinion that people’s activities in the work
domain are in fact more strongly determined by work values than personal values; thus
influenced by the work context. This is in line with research on values that indicate that
individual values guide the selection and evaluation of actions, people and events (Rokeach,
1979; Schwartz, 2005); yet organisational values can also influence the expression of
individual values (Câmara & Pereira-Guizzo, 2015; Rokeach, 1979).
In line with this, extreme contexts contain unique dynamics in terms of causations,
constraints and incidents and therefore leadership requirements may be unique (Hannah et al.,
2009). These contexts and their requirements subsequently have the potential to influence
leadership effectiveness (Avolio, 2007; Avolio & Walumbwa, 2014). Just as extreme contexts
differ from non-extreme contexts, extreme contexts also differ from one another. Hannah et al.
(2009) are of the opinion that leadership theory cannot be loosely generalised in these contexts.
They form this opinion based on the fact that these contexts differ on dimensions such as (a)
time (levels of extremity escalate as threats escalate); (b) the chance of consequences occurring;
(c) the extent of the consequences when they do occur; (d) proximity (physical, psychological
and social); and (e) form of threat (Hannah et al., 2009). Specifically relating to this last
dimension, the mining industry is considered to contain more physical risks such as death,
injury or exhaustion, as opposed to psychological risks such as post-traumatic stress which
employees in the health care industry are confronted with.
Research in extreme contexts (Gartzia, Ryan, Balluerka, & Aritzeta, 2012; Gladstein &
Reilly, 1985; Hannah et al., 2009; Van Wart & Kapucu, 2011) found that individuals want
leaders to take charge in times of overwhelming threats and to take action on their behalf.
Burgess, Riddle, Hall, and Salas (1992) found that leaders were more effective in these
situations if they considered followers’ efforts and input; were open and less intimidating;
communicated more; and explained their decisions. Haddon et al. (2015) found that both

41
communal and agentic traits are preferred when people are led through difficult times.
Although beyond the scope of this study, before structural equivalence (i.e. the degree to which
the impact of authentic leadership on individual and organisational outcomes is the same for
different groups) can be evaluated, measurement invariance has to be demonstrated (Byrne,
2012; Wang & Wang, 2012). This may provide more clarity on differences in the value attached
to authentic leadership or the effectiveness thereof in current organisations, perhaps eliminating
further contradictory empirical findings.
Due to the inherent differences between the two organisations in the current study and the
proposed impact of these differences on both the interpretation of observed indicators and the
construct as a whole, measurement invariance of the instrument has to be established. Once
measurement invariance has been established, mean scores can be compared which can provide
an indication of followers’ perceptions of the degree to which leaders are being perceived as
being authentic. This has important implications for development of interventions in these two
organisations. The sixth and seventh hypotheses of this study are as follows:
Hypothesis 6: Authentic leadership, as measured by the ALI, is equivalent across the public
health care and mining organisations.
Hypothesis 7: There are significant mean differences on the dimensions of the ALI for the
different organisations.
Method
Participants
A convenience sample of 244 employees from a mine in the Free State province and 633
employees from various institutions in the public health care sector in the Gauteng province
was drawn from an existing database at an accredited university. The data obtained in the public
health care sector formed part of a more comprehensive research project. The characteristics
of the participants are provided in Table 1. Approximately half of the participants in the mining
organisation are in possession of at least a Grade 12 certificate (50.4%), and the majority have
been working in the organisation for up to ten years (56.6%). In the public health care facilities,
29.8% of participants are in possession of a Grade 12 certificate, 70.2% are in possession of a

42
diploma or higher qualification, and the majority (60.2%) of participants have been working in
the organisation for less than ten years.

43
Table 1
Characteristics of the Participants (N = 877)
Item Frequency Percentage Frequency Percentage
Mine (N = 244) Health (N = 633)
Gender Male 212 86.9 121 19.12
Female 32 13.1 473 74.72
Missing - - 39 6.16
Cultural group Black 133 54.41 522 82.46
White 104 42.62 49 7.74
Coloured 4 1.64 8 1.26
Indian 2 0.82 10 1.58
Other 1 0.41 5 0.79
Missing - - 39 6.16
Age 18 – 25 24 9.84 40 6.32
26 – 35 78 31.97 161 25.43
36 – 45 73 29.92 108 17.06
46 – 55 52 21.31 148 23.38
56 – 65 16 6.56 95 15.01
66+ - - 10 1.58
Missing 1 0.41 71 11.22
Home language English 23 9.43 39 6.16
Afrikaans 87 35.66 42 6.64
Setswana 11 4.51 43 6.79
isiXhosa 18 7.38 40 6.32
Xitsonga 5 2.05 6 0.95
isiZulu 17 6.97 113 17.85
Sesotho 71 29.10 263 41.55
isiNdebele 1 0.41 3 0.47
Tshivenda 1 0.41 3 0.47
SiSwati 3 1.23 7 1.11
Sepedi 5 2.05 21 3.32
Other 2 0.82 9 1.42
Missing - - 43 6.79

44
Procedure and ethical considerations
In order to obtain the initial data, the purpose and objectives of the study were stipulated on an
information letter accompanying the self-report questionnaires which were distributed to the
participants together with the informed consent letters. Participants were also informed
regarding the procedure, anticipated risks and benefits of the studies as well as the intended
usage of the data. The project complied with the ethical requirements as stipulated by the Health
and Human Research Ethics Committee (HHREC) from the North-West University.
Participants who agreed to participate in the study completed and submitted the questionnaires.
Measuring instruments
The Authentic Leadership Inventory (ALI; Neider & Schriesheim, 2011) was utilised for the
purpose of measuring employees’ perception of their immediate manager as “authentic leader”,
based on four first order factors: Self-awareness, balanced processing, internalised moral
perspective and relational transparency. The ALI comprises fourteen items. Example items
include “My leader solicits feedback for improving his/her dealings with others” and “My
leader encourages others to voice opposing points of view”. The items are scored on a five-
point Likert-type scale ranging from 1 (disagree strongly) to 5 (agree strongly).
The Workplace Trust Survey (WTS; Ferres, 2003) was used to measure trust in the leader.
This subscale consists of nine items. An example item includes “I act on the basis that my
manager displays integrity in his/her actions”. Items are recorded on a seven-point Likert-type
scale ranging from 1 (strongly disagree) to 7 (strongly agree).
Data analysis
Mplus 7.31 (Múthen & Múthen, 1998-2012) was used to perform latent variable modelling
analyses in line with the two-step approach proposed by Kline (2011). The robust maximum
likelihood estimator (MLR) was used which takes the spread of the data into account (i.e.
skewness and kurtosis) (Wang & Wang, 2012). The following indices were used to assess the
model fit in both steps: Chi-square (χ²), degrees of freedom (df), Root Mean Square Error of
Approximation (RMSEA), the Standardised Root Mean Square Residual (SRMR), and
incremental fit indices, including the Comparative Fit Index (CFI) and the Tucker-Lewis Index

45
(TLI). CFI and TLI values higher than .95 are considered acceptable (Hu & Bentler, 1999);
however, values higher than .90 are commonly accepted in practice (Wang & Wang, 2012).
RMSEA values lower than .08 indicate acceptable fit between the model and the data (Hair,
Black, Babin, & Anderson, 2010). SRMR values closer to 0 are ideal, although values smaller
or equal to .08 are acceptable (West, Taylor, & Wu, 2012). Both the Akaike Information
Criterion (AIC) and the Bayes Information Criteria (BIC) were used to compare the goodness-
of-fit of the measurement models. The lower the value, the better the model (Hair et al., 2010),
as the AIC and BIC values serve as an index for model parsimony (Kline, 2011). Chi-square
values cannot be used to directly compare models, therefore the Satorra-Bentler chi-square
difference test was performed (Satorra & Bentler, 2001, 2010). The reliabilities of the scales
were calculated by means of composite reliability coefficients (ρ; Raykov, 2009). The .70
guideline was used as cut-off value for reliability (Wang & Wang, 2012).
Measurement invariance testing was used in instances where the hypotheses involved
determined whether an assessment instrument operated in the same way in different groups,
also when trying to determine whether the underlying construct had the same meaning for each
group (gender and organisation). This is an important prerequisite for comparing groups on a
certain construct (Dimitrov, 2010). Three types of invariance need to be addressed: Configural,
metric, and scalar. In the case of configural invariance, a baseline model for each group is
identified (Byrne, 2012) separately; thereafter a combined configural model is tested (Wang &
Wang, 2012). Metric invariance refers to equal factor loadings across groups which ensure an
equivalent relationship between a latent factor and its items; whereas scalar invariance refers
to equal intercepts across groups - item bias is not present (Byrne, 2012; Dimitrov, 2010).
Measurement invariance is evaluated based on three levels – weak (metric invariance is
required), strong (metric- and scalar invariance are required) and strict (metric-, scalar- and
invariance of item uniqueness are required). In each case, configural invariance is determined
first, after which metric invariance is determined (Byrne, 2012; Dimitrov, 2010). Invariance is
accepted if the chi-square difference is not statistically significant when comparing nested
models (Byrne, 2012). Based on the guidelines provided by Wang and Wang (2012), a change
of less than .01 in the CFI is also recommended. In order to assess differences between gender
and industry groups, differences in the mean scores were evaluated by means of t-tests. Only
in the event of significant differences, Cohen’s d is calculated to determine the practical
significance of such differences. Cohen’s d can be interpreted as follows: Trivial effect size (≤

46
0.20), small effect size (> 0.20), medium effect size (≥ 0.50), or large effect size (≥ 0.80; Cohen,
1988).
Results
Evaluating construct and concurrent validity
For the purposes of evaluating the construct and concurrent validity of the ALI, analyses were
only performed on the mining sample. These two types of validity have already been
established in the health care organisation by Stander et al. (2015). Using the full set of items
of 14 ALI items and nine WTS items, three alternative measurement models were tested (see
fit statistics in Table 2):
1. Model 1: One-factor model of authentic leadership with all 14 items loading onto the
same factor and a one-factor model of trust in the leader with all nine items loading
onto the same factor.
2. Model 2: A four-factor model of authentic leadership, namely self-awareness,
internalised moral perspective, balanced processing and relational transparency and a
one-factor model of trust in the leader.
3. Model 3: A second-order factor model of authentic leadership, with four first-order
factors, namely self-awareness, internalised moral perspective, balanced processing
and relational transparency and a one-factor model of trust in the leader.
Table 2
Fit Statistics for the Competing Measurement Models of the ALI and WTS (N = 244)
Model χ² df p ∆ χ²SB CFI TLI RMSEA 90% CI p > .05
SRMR AIC BIC
Model 1 411.62 229 .00 - .93 .92 .06 .05-.07
.09
.05 14841.63 15086.40
Model 2 398.22 220 .00 13.22 .93 .92 .06 .05-.07
.08
.05 14841.31 15117.60
Model 3 407.71 225 .00 3.84 .93 .92 .06 .05-.07
.08
.05 14844.11 15102.90
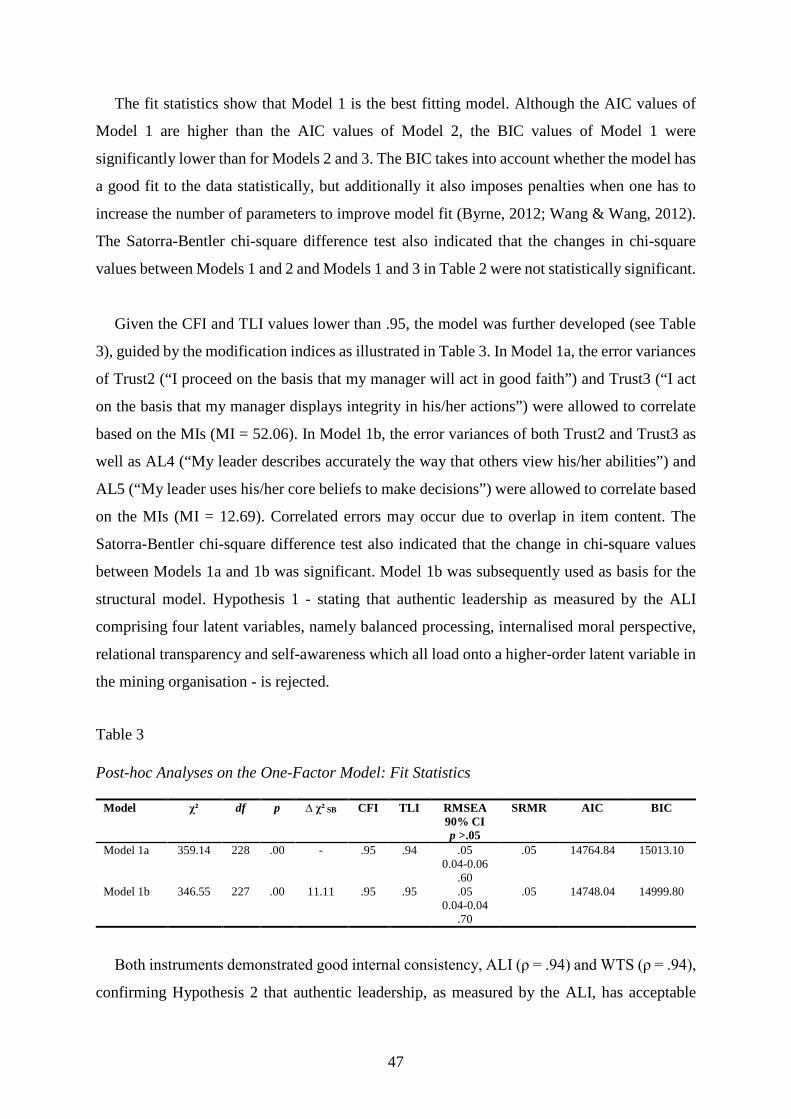
47
The fit statistics show that Model 1 is the best fitting model. Although the AIC values of
Model 1 are higher than the AIC values of Model 2, the BIC values of Model 1 were
significantly lower than for Models 2 and 3. The BIC takes into account whether the model has
a good fit to the data statistically, but additionally it also imposes penalties when one has to
increase the number of parameters to improve model fit (Byrne, 2012; Wang & Wang, 2012).
The Satorra-Bentler chi-square difference test also indicated that the changes in chi-square
values between Models 1 and 2 and Models 1 and 3 in Table 2 were not statistically significant.
Given the CFI and TLI values lower than .95, the model was further developed (see Table
3), guided by the modification indices as illustrated in Table 3. In Model 1a, the error variances
of Trust2 (“I proceed on the basis that my manager will act in good faith”) and Trust3 (“I act
on the basis that my manager displays integrity in his/her actions”) were allowed to correlate
based on the MIs (MI = 52.06). In Model 1b, the error variances of both Trust2 and Trust3 as
well as AL4 (“My leader describes accurately the way that others view his/her abilities”) and
AL5 (“My leader uses his/her core beliefs to make decisions”) were allowed to correlate based
on the MIs (MI = 12.69). Correlated errors may occur due to overlap in item content. The
Satorra-Bentler chi-square difference test also indicated that the change in chi-square values
between Models 1a and 1b was significant. Model 1b was subsequently used as basis for the
structural model. Hypothesis 1 - stating that authentic leadership as measured by the ALI
comprising four latent variables, namely balanced processing, internalised moral perspective,
relational transparency and self-awareness which all load onto a higher-order latent variable in
the mining organisation - is rejected.
Table 3
Post-hoc Analyses on the One-Factor Model: Fit Statistics
Model χ² df p ∆ χ² SB CFI TLI RMSEA 90% CI p >.05
SRMR AIC BIC
Model 1a 359.14 228 .00 - .95 .94 .05 0.04-0.06
.60
.05 14764.84 15013.10
Model 1b 346.55 227 .00 11.11 .95 .95 .05 0.04-0.04
.70
.05 14748.04 14999.80
Both instruments demonstrated good internal consistency, ALI (ρ = .94) and WTS (ρ = .94),
confirming Hypothesis 2 that authentic leadership, as measured by the ALI, has acceptable

48
internal consistency, i.e. reliability in the mining organisation. A structural model including the
hypothesised relationship between authentic leadership and trust in the leader was specified on
the basis of the best fitting measurement model. According to Kline (2011), a valid
measurement model is needed before one can proceed to specify the structural model and
therefore all variables should be included in the measurement model. Results indicated a good
model fit: χ2 (227, N = 244), 346.55, p < .001; CFI = .95; TLI = .95; RMSEA = .05; SRMR =
.05. The regression path from authentic leadership to trust in the leader was statistically
significant (β = .73, p < .001). This means that leaders who are perceived as authentic will
influence followers’ trust in the leader, supporting concurrent validity. Hypothesis 3 - stating
authentic leadership, as measured by the ALI, is a significant predictor of trust in the leader in
the mining organisation - was accepted.
Testing measurement invariance for gender
The first step was to test a first-order CFA measurement model. Based on the findings from
the analyses in the previous section in the mining organisation, it was decided to use the one-
factor structure for the baseline models. The data used for modelling was the mining sample
(N = 244) and a random sample selected from the public health care sector (N = 313). Similar
sample sizes eliminate the possibility of encountering dilemmas with statistical power that is
linked to sample size (Field, 2013). The two samples were combined and genders from both
groups were combined to form two gender groups: Females (n = 264) and males (n = 272).
Twenty-one individuals in the public health care facilities did not indicate their gender and
were excluded from further analyses.
CFA models were used to fit the female and male samples separately. The parsimonious and
meaningful model for each group was defined as the baseline model as recommended by Wang
and Wang (2012). Similar, but not completely identical, baseline models have been identified.
According to Wang and Wang (2012), the two baseline models should have the same number
of factors with the same pattern of fixed and free factor loadings. For females, Model 1 - with
all fourteen items of the ALI loading onto one factor - did not fit the data well: RMSEA = .10,
90% CI = [.09, .12], close-fit test p-value = .00, CFI = .86, TLI = .83, SRMR = .06, AIC =
9432.73 and BIC = 9582.44. For males, Model 1 - with all fourteen items of the ALI loading
onto one factor - fitted the data well: RMSEA = .08, 90% CI = [.04, .07], close-fit test p-value
= .21, CFI = .95, TLI = .94, SRMR = .04, AIC = 12118.93 and BIC = 12270.38. To improve
49
model fit, AL3 (“My leader asks for ideas that challenge his/her core beliefs”) and AL5 (“My
leader uses his/her core beliefs to make decisions”) had to be removed from the female group
and AL3 had to be removed from the male group, based on the z-scores for covariances. Múthen
and Múthen (1998-2012) define z-scores as “standardised errors which are computed as the
difference between the value of the observed sample statistic and its model estimated value
divided by the standard deviation of the difference between the value of the observed sample
statistic and its model estimated value” (p. 724). In this instance, the statistic refers to the
model-implied correlation/covariance and is compared to the observed covariance. In a
normally distributed sample, 99% of z-scores should lie between (±) 2.58 and 99.9% between
(±) 3.29. Standardised residuals of higher than 3 are reason for concern due to the fact that
chances of this happening are highly unlikely to occur in the average sample (Field, 2013).
Large values indicate local dependency, which means that responses on these items are linked
and that the items are therefore redundant (Kim, Chung, Amtmann, Revicki, & Cook, 2013).
In both groups, the error variances of AL1 and AL2 were allowed to correlate (MI = 24.7 in
the female group) in order to obtain similar baseline models. The results of the two baseline
models show that the items of the ALI are highly loaded onto their underlying factor in the two
samples, and model fit to data is acceptable for females and very good for males. The model
fit indices for females are: RMSEA = .07, 90% CI = [.06, .09], close-fit test p-value = .01, CFI
= .93, TLI = .92, SRMR = .05, AIC = 8048.10 and BIC = 8180.41. The corresponding model
fit indices for males are: RMSEA = .03, 90% CI = [.00, .05], close-fit test p-value = .93, CFI =
.99, TLI = .98, SRMR = .03, AIC = 8623.67 and BIC = 8767.90.
After the baseline models had been determined for each gender group, the models were
combined into one multi-group (gender) model to form a configural model. The same number
of factors and the same pattern of fixed and free factor loadings are specified in each of the
groups, but no equality restrictions are imposed on the parameters (Wang & Wang, 2012). Due
to the non-invariance of items 3 and 5 in the baseline models of the separate groups,
equivalence tests were further conducted without these items. Partial configural invariance is
accepted for the total instrument, meaning that the same pattern of factor loadings exists only
partially. Fit indices in Table 4 indicate the model fits the data well. In order to identify models,
one factor loading must be fixed. Usually it is the first item of each factor, referred to as the
marker item, but in order to ensure that the marker item is also invariant across groups, another
item should be fixed (Wang & Wang, 2012). The second (fixing AL2 to 1 and all other factor

50
loadings to be freely estimated) and third (fixing equality constraints on the factor loadings of
AL1) phases of the configural model demonstrate invariance of marker items as stipulated by
Wang and Wang (2012). A difference test was conducted in each of these two phases to
evaluate whether there was a meaningful difference in the χ² SB statistic between these two
marker item models and the configural model (Wang & Wang, 2012). There was no statistically
significant change in the χ² SB statistic and the change in CFI is smaller than .01.
Next, measurement invariance was investigated (see Table 4 for the fit indices), according
to a series of hierarchical steps as recommended by Wang and Wang (2012). In the first step,
called metric (or weak) invariance, a model with factor loadings constrained to be equal across
groups is specified, but the intercepts are allowed to differ. Since the metric model is nested in
the configural model, the difference test is used to test model difference. There was no
significant change in the χ² SB statistic between the configural model and the current model (∆χ²
SB = 8.23, ∆df = 11, p = .69). In addition, there was no change in CFI. Thus, the null hypothesis
of metric invariance cannot be rejected, meaning factor loadings are invariant across the two
groups. It can be concluded that responses to the ALI items and their underlying factor are not
significantly different across the two groups.
In the next step, called scalar (or strong) invariance, both factor loadings and intercepts are
constrained to be equal across groups. There was a significant change in the χ² SB statistic
between the configural model and the current model (∆χ² SB = 43.30, ∆df = 23, p = .01). In
addition, there is a .01 change in the CFI. Thus, only partially strong (scalar) invariance could
be established between the two groups. The result indicates that females and males differ on
the intercepts of item 8 (“My leader openly shares information with others”), with males having
a higher starting point than females. Due to the inability to demonstrate strong (scalar)
invariance, strict invariance testing is not feasible. In practice, error invariance testing is of
little interest and is often not performed (Wang & Wang, 2012). Hypothesis 4, stating authentic
leadership as measured by the ALI, is equivalent across gender groups is only partially
supported.

51
Table 4
Fit Indices for Invariance Tests (Gender)
Model χ² (df)
∆χ² SB (∆df)
CFI (∆CFI)
TLI RMSEA (p ≤ .05)
RMSEA (90% CI)
SRMR
Configural model 201.77 (106)
- .96 .95 .06 (.14)
.05-.07 .04
Testing invariance of marker item factor loadings (phase 2)
201.77 (106)
- .96 -
.95 .06 (.14)
.05-.07 .04
Testing invariance of marker item factor loadings (phase 3)
204.43 (107)
2.66 (1) .96 -
.95 .06 (.13)
.05-.07 .04
Metric (weak) invariance 212.91 (117)
8.23 (11)
.96 -
.95 .06 (.22)
.04-.07 .05
Scalar (strong) invariance 245.19 (129)
43.30* (23)
.95 (-.01)
.95 .06 (.12)
.05-.07 .05
Revised scalar (strong) invariance (Intercept of item 8 non-invariant)
235.89 (128)
31.54 (23)
.95 (-.01)
.95 .06 (.18)
.05-.07 .05
*p < .01
The standardised factor loadings for the final model are displayed in Table 5.
Table 5
Standardised Loadings of the Revised Scalar Model (Gender)
Group 1: Females Group 2: Males
Estimate S.E EST/S.E P Estimate S.E EST/S.E p
Authentic leadership
AL1 .70 .04 16.15 .00 .69 .03 20.13 .00
AL2 .69 .04 19.06 .00 .74 .04 19.60 .00
AL4 .67 .04 18.72 .00 .71 .03 22.08 .00
AL6 .80 .03 27.00 .00 .79 .03 32.05 .00
AL7 .76 .04 20.73 .00 .75 .04 20.15 .00
AL8 .81 .03 30.87 .00 .79 .03 27.50 .00
AL9 .49 .05 10.46 .00 .54 .05 10.44 .00
AL10 .82 .03 30.72 .00 .81 .03 32.03 .00
AL11 .70 .04 16.08 .00 .71 .04 19.08 .00
AL12 .78 .04 22.45 .00 .80 .03 27.61 .00
AL13 .71 .04 20.09 .00 .72 .03 22.55 .00
AL14 .72 .04 20.19 .00 .74 .03 21.87 .00
Note: All p-values were significant (p < .01)

52
Testing gender group differences
Given the fact that at least two items (AL3 and AL5) are invariant at configural level and one
item (AL8) on scalar level, these three items were excluded from the analysis as recommended
by Cheung (2008). Also, given the fact that all items loaded onto one factor, mean differences
between the gender groups can only be compared on the total ALI score. A revision of the
descriptive statistics of the ALI data revealed that the ALI scores are normally distributed.
Therefore, the researcher proceeded with the independent-samples t-test in IBM SPSS 22 to
compare the mean authentic leadership scores for females and males. The significance value
for Levene’s test is larger than .05, meaning that the assumption of equal variances has not
been violated (Pallant, 2013). Further inspection of the significance (two-tailed) value revealed
that this value is above the cut-off of .05. This means that the difference between the authentic
leadership scores for female followers (M = 3.48, SD = 0.86) and male followers (M = 3.41,
SD = 0.82) is not significant [t (502) = .92, p = .36, two-tailed]. No support was found for
Hypothesis 5 which states that there are significant mean differences on the dimensions of the
ALI for males and females.
Testing measurement invariance for industry
The first step was to test a first-order CFA measurement model. Based on the results from this
study and that of Stander et al. (2015), it was decided to use the one-factor structure of authentic
leadership for the baseline models. The data used for modelling included both the public health
care sector (N = 633) and the mining (N = 244) industry.
CFA models were used to fit the health care and mining samples separately. The
parsimonious and meaningful model for each group was defined as the baseline model for each
group as recommended by Wang and Wang (2012). Similar, yet not identical baseline models
have been identified. According to Wang and Wang (2012), the two baseline models should
have the same factor with the same pattern of fixed and free factor loadings. For health, Model
1 - with all fourteen items of the ALI loading onto one factor - did not fit the data well: RMSEA
= .09, 90% CI = (.08, .10), close-fit test p-value = .00, CFI = .88, TLI = .86, SRMR = .05, AIC
= 22558.93 and BIC = 22744.98. For mining, Model 1 - with all fourteen items of the ALI
loading onto one factor - fitted the data well: RMSEA = .04, 90% CI = (.03, .06), close-fit test
p-value = .69, CFI = .97, TLI = .97, SRMR = .04, AIC = 8109.15 and BIC = 8256.03. To

53
improve model fit, AL2 (“My leader shows consistency between his/her beliefs and actions”),
AL3 (“My leader asks for ideas that challenge his/her core beliefs”), AL5 (“My leader uses
his/her core beliefs to make decisions”), AL6 (“My leader carefully listens to alternative
perspectives before reaching a conclusion”) and AL14 (“My leader expresses his/her ideas and
thoughts clearly to others”) had to be removed from the health group, based on the z-scores.
Large values indicate local dependency, which means that responses on these items are linked
and that the items are therefore redundant (Kim et al., 2013). The results of the two baseline
models show that the items of the ALI are highly loaded onto their underlying factor in the two
samples, and model fit to the data of the revised model is acceptable for health. The model fit
indices for health are: RMSEA = .04, 90% CI = (.02, .05), close-fit test p-value = .92, CFI =
.99, TLI = .98, SRMR = .98, AIC = 14646.23 and BIC = 1456.83.
After the baseline models had been determined for each organisational group, the models
were combined into one multi-group (organisational) model to form a configural model. The
same number of factors and the same pattern of fixed and free factor loadings were specified
in each of the groups, but no equality restrictions were imposed on the parameters (Wang &
Wang, 2012). Due to the non-invariance of items 2, 3, 5, 6 and 14 in the baseline models of the
separate groups, equivalence tests were further conducted without these items. Partial
configural invariance was accepted for the total instrument. Fit indices in Table 6 indicate the
model fitted the data well. Once again, in order to identify models, one factor loading had to
be fixed. The second (fixing AL4 to 1 and all other factor loadings to be freely estimated) and
third (fixing equality constraints on the factor loadings of AL1) phases of configural model
demonstrated invariance of marker items. A difference test was conducted in each of these two
phases to evaluate if there was a meaningful difference in the χ² SB statistic between these two
marker item models and the configural model (Wang & Wang, 2012). There was no statistically
significant change in the χ² SB statistic and the change in CFI was smaller than .01. Therefore,
item 1 was accepted as an invariant marker item.
Next, measurement invariance was investigated (see Table 6 for the fit indices). The same
steps were followed as explained in the gender group invariance testing section. In the first
step, metric (or weak) invariance was tested. There was no significant change in the χ² SB
statistic between the configural model and the current model (∆χ² SB = 12.01, ∆df = 8, p = .15).
In addition, there was no change in CFI. Thus, the null hypothesis of metric invariance cannot
be rejected, meaning that factor loadings are invariant across the two groups. It can be

54
concluded that responses to the ALI items and their underlying factor are not significantly
different across the two groups. In the next step, scalar (or strong) invariance was tested. There
was a significant change in the χ² SB statistic between the configural model and the current model
(∆χ² SB = 66.39, ∆df = 17, p = .00). In addition, there was a .02 change in the CFI. Thus, strong
(scalar) invariance could not be established between the two groups. The result indicates that
employees of the two organisations differ on the intercepts of items 1 (“My leader clearly states
what he/she means”), 4 (“My leader describes accurately the way that others view his/her
abilities”) and 12 (“My leader expresses his/her ideas and thoughts clearly to others”), with
employees from the health care organisation having higher starting points than those in the
mining organisation on item 1. Employees from the mining organisation have higher starting
points than those in the health care organisation on items 4 and 12. Findings suggest that
respondents from the different groups may be using different conceptual frames of reference
when responding to items 1, 4 and 12. Due to the inability to demonstrate strong (scalar)
invariance, strict invariance testing is not feasible. In practice, error invariance testing is of
little interest and many times not performed (Wang & Wang, 2012). Only partial support was
found for Hypothesis 6 stating that authentic leadership, as measured by the ALI, is equivalent
across the public health care and mining industries.
Table 6
Fit Indices for Invariance Tests (Organisations)
Model χ² (df)
∆χ² SB (∆df)
CFI (∆CFI)
TLI RMSEA (p ≤ .05)
RMSEA (90% CI)
SRMR
Configural model 77.08 (54)
- .99 (-)
.99 .03 (.98)
.01-.05 .02
Testing invariance of marker item factor loadings (phase 2)
77.08 (54)
(-) .99 (-)
.99 .03 (.98)
.01-.05 .02
Testing invariance of marker item factor loadings (phase 3)
78.23 (55)
.95 (1)
.99 (-)
.99 .03 (.98)
.01-.05 .03
Metric (weak) invariance 88.97 (62)
12 (8)
.99 .99 .03 (.99)
.02-.05 .04
Scalar (strong) invariance 133.56 (71)
66.39* (17)
.97 (.02)
.97 .05 (.74)
.03-.06 .06
Revised scalar (strong) invariance (Intercept of item 12 non-invariant)
128.98 (70)
60.67* (16)
.97 (.02)
.97 .04 (.78)
.03-.06 .06
Revised scalar (strong) invariance (Intercept of items 4 and 12 non-invariant)
117.73 (69)
46.51* (15)
.98 (.01)
.98 .04 (.90)
.03-.05 .06
Revised scalar (strong) invariance (Intercept of items 1, 4 and 12 non-invariant)
104.13 (68)
29.22 (14)
.98 (.01)
.98 .04 (.97)
.02-.05 .04
*p < .01

55
The standardised factor loadings for the final model are displayed in Table 7.
Table 7
Standardised Loadings of the Revised Scalar Model (Organisations)
Group 1: Health Group 2: Mining
Estimate S.E EST/S.E p Estimate S.E EST/S.E p
Authentic leadership
AL1 .68 .03 23.45 .00 .72 .03 22.15 .00
AL4 .67 .03 25.28 .00 .70 .03 22.69 .00
AL7 .76 .03 29.43 .00 .76 .03 22.65 .00
AL8 .79 .02 38.33 .00 .77 .03 26.00 .00
AL9 .52 .04 14.98 .00 .55 .04 12.48 .00
AL10 .81 .02 41.36 .00 .80 .03 27.50 .00
AL11 .71 .03 24.90 .00 .69 .04 19.64 .00
AL12 .81 .02 39.25 .00 .81 .03 26.20 .00
AL13 .66 .03 26.19 .00 .71 .03 20.84 .00
Testing industry group differences
Given the fact that at least five items are invariant (AL2, AL3, AL5, AL6 and AL14) at
configural level and three items (AL1, AL4 and AL12) on scalar level, these eight items were
excluded from the analysis. This is a pre-requisite for testing mean differences across groups
(Cheung, 2008). All items loaded onto one factor which means that group means can only be
compared on the total ALI score. A revision of the descriptive statistics of the ALI data revealed
that the ALI scores are normally distributed. Therefore, the researcher proceeded with the
independent-samples t-test in IBM SPSS 22 to compare the authentic leadership scores for
health care and mining. The significance value for Levene’s test is larger than .05, meaning
that the assumption of equal variances has not been violated (Pallant, 2013). Further inspection
of the significance (two-tailed) value revealed that this value is above the cut-off point of .05.
This means that the difference between the authentic leadership scores for health care followers
(M = 3.42, SD = 0.87) and mining followers (M = 3.48, SD = 0.82) is not significant [t (829) =
-.97, p = .33, two-tailed]. No support was found for Hypothesis 7 stating that there are

56
significant differences in the evaluation of leaders in terms of their authenticity in the two
different organisations.
Discussion
The main aim of this study was to investigate the measurement invariance of the ALI for
employees from different organisations. It is assumed that questionnaires and self-report
instruments measure some latent variable, and these tools are used to compare groups or to
perform longitudinal measurements on phenomena which are not directly observable
(Dimitrov, 2010; Van De Schoot et al., 2012). For meaningful and valid comparisons, a
questionnaire should measure identical constructs with the same factor structure across
different groups. The aim of measurement invariance is to demonstrate that the participants
interpret the observed indicators and the underlying latent factor in the same way (Dimitrov,
2010; Van De Schoot et al., 2012). Conversely, if one cannot prove measurement invariance,
it indicates that groups or individuals interpret the items differently and as a consequence mean
scores cannot be compared (Jöreskog, 1971; Vandenberg & Lance, 2000). According to Ding,
Ng, and Wang (2014), comparing groups without proving measurement invariance is just as
detrimental as not being able to demonstrate reliability and validity.
Contrary to previous research (Neider & Schriesheim, 2011) and in line with South African
research (Stander et al., 2015) on authentic leadership, the findings supported a one-factor
construct of the ALI in the mining organisation. This means that employees in the mining
organisation interpreted the observed indicators differently from what was theoretically
proposed. Instead of items being interpreted as indicators of balanced processing, internalised
moral perspective, self-awareness, and relational transparency respectively, the items were
indicators of authentic leadership. Apart from the validity studies conducted by Neider and
Schriesheim (2011) - the original developers of the ALI - only Stander and his colleagues have
investigated the factor structure of this instrument to date. Other studies utilising the ALQ in
South Africa found support for a two-factor construct (Munyaka, 2012) or poor model fit for
the higher-order construct of authentic leadership (Du Plessis, 2014). The findings of the
current study reiterate the importance of evaluating the construct validity of measuring
instruments in different contexts. The ALI was found to be reliable, as was the case in the
studies of Neider and Schriesheim (2011) and Stander et al. (2015). Authentic leadership was
also a significant predictor of trust in the leader supporting the ALI’s concurrent validity.

57
Previous international studies have also found a significant relationship between authentic
leadership and trust in the leader (Clapp-Smith et al., 2009; Hassan & Ahmed, 2011; Wong &
Cummings, 2009).
It was important to investigate the impact of gender since the mining and health care
organisations also differ in terms of being more female as opposed to more male-dominated.
Previous research (Du Plessis, 2014) indicated differences on one of the authentic leadership
dimensions. Items 3 (“My leader asks for ideas that challenge his/her core beliefs”) and 5 (“My
leader uses his/her core beliefs to make decisions) were configurally non-invariant across
genders. This indicates that males and females attach different meanings when evaluating the
use of core beliefs by leaders in their leadership approach, since these two items both contain
the concept of belief. Consequently, comparing male and female responses on these items may
lead to misinterpretations. Merchant (2012) stated that females communicate differently and
attempt to influence others differently than their male counterparts. Females tend to be more
hesitant to share in distant interpersonal relationships and will only share personally
meaningful information - such as core beliefs - but only when they feel they have formed a
close bond with others (Heyns & Rothmann, 2015; Payne, 2001). These differences may
impact on the way in which the different genders perceive others when they have to share
beliefs. The results of this study also suggest that items 3 and 5 may be locally dependent,
meaning that responses on these items are linked as explained by Kim et al. (2013), resulting
in biased parameters (Steinberg & Thissen, 1996; Yen, 1993).
No differences were found on the factor loadings or intercepts of the remaining items, with
the exception of item 8 (“My leader openly shares information with others”), which had a
higher intercept for males than for females. This finding suggests that males and females use
different conceptual frames of reference when they evaluate the sharing of information by their
leader. Heyns and Rothmann (2015) are of the opinion that males and females attach different
connotations to the meaning of “sharing”. This might be due to the fact that females have higher
expectations in terms of sharing feelings, emphasising the fact that sharing is more than just
the sharing of information (Costa, Terracciano, & McCrae, 2001) or the cognitive aspect of
sharing (Heyns & Rothmann, 2015). Even though only partial measurement invariance could
be established, this is most often the case in reality (Wang & Wang, 2012).

58
Depending on the aims of a particular study, different levels of measurement invariance are
required (Crocetti et al., 2015). If the aim is to compare the structure of constructs across
groups, configural- and metric invariance are sufficient. Scalar invariance, on the other hand,
is required when comparing latent means because item means and intercepts are involved
(Cheung, 2008). Byrne, Shavelson, and Muthén (1989) and Van De Schoot et al. (2012)
maintain that when at least two indicators of a latent variable are invariant on scalar level, latent
means can be compared across groups. In future, when utilising the ALI to compare gender
groups in terms of latent means in these two organisations, items 3 and 5 should be excluded
from analyses comparing construct equivalence, and item 8 should be excluded when group
means are compared.
The fact that both genders rated their leaders as equally authentic after biased items had
been removed is partly in line with Du Plessis' (2014) findings. In her study, no significant
differences on the mean scores were found on three of the dimensions of the authentic
leadership construct. The findings of the current study support gender similarity, rather than
differences, when evaluating their leaders’ authenticity. This means that the organisations in
the current study do not need to differentiate, based on gender, when leaders are being
developed to be more authentic overall. As long as the leader is perceived to be authentic,
gender has little impact. This is in line with the argument of Hyde (2014) who postulates that
there are more similarities than differences between males and females. These differences hold
little practical value for leaders (Gilbert, Burnett, Phau, & Haar, 2010).
Items 2 (“My leader shows consistency between his/her beliefs and actions”), 3 (“My leader
asks for ideas that challenge his/her core beliefs”), 5 (“My leader uses his/her core beliefs to
make decisions”), 6 (“My leader carefully listens to alternative perspectives before reaching a
conclusion”), and 14 (“My leader encourages others to voice opposing points of view) were
configurally non-invariant across industries. Once again, future studies that wish to compare
construct equivalence should be cautious when including these five items. This indicates that
mining and health care employees attach different meanings when evaluating the role of beliefs
(self-regulation) as well as objective decision making (and the inclusion of alternative
opinions).
Drawing on the open systems theory (Boulding, 1956; Miller, 1965), one can speculate as
to some of the reasons why organisations differ in the evaluation of their leaders. This theory

59
holds that subsystems exist within larger systems and are unique from the larger system (Katz
& Kahn, 1978). Applying this theory to the current study, the subsystems would refer to the
respective organisations and these subsystems differ from the larger system - which is the
country as a whole - and therefore there are more similarities than differences within the
subsystems. Employees working for the mining organisation show more similarity, but are
different from those working in the health care sector. It is these similarities that may lead to
similar preferences (Gilbert et al., 2010) and evaluations of the leader.
The main differences between these two organisations may be ascribed to the differences in
organisational culture. According to Armstrong and Taylor (2014), culture consists of four
components: Assumptions, values and beliefs, behavioural norms, and artefacts. In terms of
values and beliefs, Merchant (2012) states that leadership is the result of an interaction between
leaders and followers and this interaction is influenced by individuals’ psychological process
including values (that which is important) associated with and expected from these roles.
According to Câmara and Pereira-Guizzo (2015), organisational values can influence the
expression of individual values. Based on difference in perceived importance, this may explain
the differences between the two organisations in terms of how their employees perceive the
observed indicators measuring authentic leadership and the construct as a whole.
If the relationship between a leader and follower is one of the most imperative components
of the leadership style (Merchant, 2012), differences in how this relationship develops and
manifests may be evident in profit versus not-for-profit types of organisations. Culture refers
to the created patterns of relating in the organisation (Rothmann & Cooper, 2015) which will
differ from organisation to organisation. If safety and production targets are the main focus of
mines and effective service delivery to patients is the main focus of health care, these leaders
may differ in terms of the emphasis they place on tasks versus relationships (assumptions and
values), which may lead to differences in the expression of beliefs and the inclusion of others’
opinions in decision making (assumptions and behavioural norms). This refers to both the
assumptions (what is important and how problems are solved) and behavioural norms (rules
governing behaviour) components of organisational culture (Armstrong & Taylor, 2014),
which in turn might influence how leaders are perceived by their followers.
Differences were found in the factor loadings or intercepts of items 1, 4, and 12. Health care
employees had higher intercepts on item 1 (“leaders clearly state what they mean”), but

60
employees from the mining organisation had higher intercepts on both items 4 (“leaders
accurately describe the way that others view their abilities”), and 12 (“leaders express their
ideas and thoughts clearly to others”). This finding suggests that employees from these
respective organisations use different conceptual frames of reference when they evaluate how
their leaders communicate. All three these items share verbs such as “state”, “describe” and
“express” when referring to communication. These differences may be ascribed to the way in
which the leaders communicate in these respective organisations, with communication being
more direct and tasks being more predictable in the mining organisation. Work-related
information can therefore be communicated with more certainty in the mining organisation as
opposed to the uncertainties prevalent in the health care organisation.
An important difference between the two organisations is the representation of different
cultural groups. The health care sample consisted of mainly Black, Sesotho-speaking
individuals, whereas in the mining organisation, White individuals were almost equally
represented when compared to Black individuals. A number of researchers have previously
advocated for the investigation of how authentic leadership manifests in different cultures
(Avolio & Walumbwa, 2014; Gardner et al., 2011; Khilji et al., 2015). The difference in
cultural values, specifically, cannot be ignored in this study. Roe and Ester (1999)
demonstrated that different social categories (e.g. nations, countries, ethnic, cultures) display
different value profiles and patterns. White (Western) individuals may place more emphasis on
individualistic values, such as success and achievement (Duckitt & Foster, 1991), whereas the
opposite may be true for Black individuals with a focus on collectivistic values such as
conformity and traditions (Smith & Bond, 1993). Van De Vijver and Leung (1997) and
Vandenberg and Lance (2000) advocate that it is important to evaluate measurement invariance
in cross-cultural research.
When utilising the ALI to compare mean levels in these two organisations, items 1, 2, 3, 4,
5, 6, 12 and 14 should be excluded from analyses. As previously discussed, scalar invariance
is a pre-requisite for comparing means (Cheung, 2008). The fact that both organisations rated
their leaders as equally authentic after biased items had been removed, means that no
differentiation based on context needs to be made when developing leaders to be more
authentic overall. The current study highlighted which parts of the construct are not invariant
across these two groups. Given the number of items that need to be excluded, care should be
taken when using this instrument to compare organisational groups for mean differences.

61
Practical implications
Khilji et al. (2015) distinguish between the “self” attributes - referring to the leader knowing
him/herself - and the “other” attributes - referring to the follower-leader interaction. The
findings in the present study support the idea that both gender and organisational context play
a role in the interpretation of items measuring relational or other attributes of authentic
leadership. This is even more so in the case of different organisations, where the majority of
items were either non-invariant on configural or scalar level. Even though the non-invariance
of items 3 and 5 could be attributed to the impact of gender differences, the majority of the
other non-invariant items (items 1, 2, 4, 6, 12 and 14) could be attributed to contextual
differences. This confirms the impact of organisational values above and beyond individual
(gender) values. When reviewing leadership literature, organisations should take care not to
apply findings from studies invariantly to their organisations.
Despite the challenges posed with the measuring instrument, authentic leadership is a
significant predictor of trust in the leader. Specifically in the mining organisation, the
development of authentic leaders can result in increased trust levels with resultant positive
outcomes for both the organisation and individuals. Furthermore, in designing interventions
towards developing authentic leaders, these two organisations can ignore the impact of gender
differences. Even though some items were interpreted differently, the overall structure of
authentic leadership is the same for both genders. The same is applicable when taking
contextual differences into account.
Limitations and future directions
This study had several limitations. Comparison of the findings of this study is difficult because
limited empirical research exists on the validation of the ALI within different contexts. The
study focused on the validation of the ALI in two very specific contexts and because leadership
should be investigated in context, results cannot be generalised to other contexts without first
testing the validity of the ALI in the new context. Future research should focus on validating
the ALI in other contexts, especially multicultural contexts such as in South Africa. Second,
the gender of the leader was not controlled for. As previous research suggests, the leader’s
gender may play an important role (Liu et al., 2015; Wang, Chiang, Tsai, Lin, & Cheng, 2013).

62
Future research should match the responses of participants with the leader-subordinate gender-
pair to provide more insights into the information obtained. Third, the ALI was administered
in English, and the majority of respondents did not indicate it as their home language. This has
implications for the interpretation and understanding of items. Future studies should consider
translating the ALI into other African languages. Fourth, the differences in sample sizes
between the two organisations may have implications. Statistical power is influenced by sample
size and size has the ability to influence whether or not statistically significant differences are
found (Field, 2013).
Fifth, future studies could extend these analyses by using an Items Response Theory (IRT)
framework to test measurement invariance and then compare the results of the two methods
(CFA versus IRT). Differential item functioning (DIF) means that items function differently
on item level, which is investigated using IRT (Stark, Chernyshenko, & Drasgow, 2006). Sixth,
The study investigated competing measurement models to determine whether several highly
related domains (self-awareness, balanced processing, relational transparency and internalised
moral perspective) comprise of a general factor (authentic leadership) running through the
items. These competing models represent what Reise, Moore, and Haviland (2010) label as
“unidimensional”, “correlated traits”, and “second-order” models respectively. The current
study did not investigate a fourth alternative, the “bifactor” model (Holzinger & Swineford,
1937; Schmid & Leiman, 1957). According to Reise et al. (2010), a bifactor model may be a
useful alternative “to the more commonly used unidimensional, correlated traits, or second-
order representations of a measure’s latent structure” (p. 545). In the bifactor model, each item
loads onto the general factor and in additional to the general factor, two (or more) orthogonal
group factors are specified that are able to explain variance in item responses not accounted for
by the general factor (Reise et al., 2010). It is recommended that future studies focus on
utilising this technique in validity studies pertaining to the ALI. Last, no causal inferences may
be made with regard to the impact of authentic leadership on trust, due to the cross-sectional
nature of the study. Future studies should employ longitudinal designs to establish causality
and to determine reciprocal effects. Given the invariance challenges associated with this
instrument, future research in a South African context, especially, should consider developing
a model of authentic leadership which is unique to our context. Beddoes-Jones and Swailes
(2015) pursued this avenue and developed a new model using “real” leaders in various British
organisations. This is also important if we claim that leadership is contextually unique (Haddon
et al., 2015).

63
References
Anastasi, A., & Urbina, S. (1997). Psychological testing (7th ed.). Upper Saddle River, NJ:
Prentice–Hall.
Armstrong, M., & Taylor, T. (2014). Amstrong's handbook of human resource management
practice (13th ed.). London, England: Kogan Page.
Avolio, B. J. (2007). Promoting more integrative strategies for leadership theory-building.
American Psychologist, 62(1), 25–33. doi:10.1037/0003-066X.62.1.25
Avolio, B. J., & Gardner, W. L. (2005). Authentic leadership development: Getting to the root
of positive forms of leadership. The Leadership Quarterly, 16(3), 315–338.
doi:10.1016/j.leaqua.2005.03.001
Avolio, B. J., Gardner, W. L., Walumbwa, F. O., Luthans, F., & May, D. R. (2004). Unlocking
the mask: A look at the process by which authentic leaders impact follower attitudes and
behaviors. The Leadership Quarterly, 15(6), 801–823. doi:10.1016/j.leaqua.2004.09.003
Avolio, B. J., Mhatre, K., Norman, S. M., & Lester, P. (2009). The moderating effect of gender
on leadership intervention impact: An exploratory review. Journal of Leadership &
Organizational Studies, 15(4), 325–341. doi:10.1177/1548051809333194
Avolio, B. J., & Walumbwa, F. O. (2014). Authentic leadership theory, research and practice:
Steps taken and steps that remain. In D. V. Day (Ed.), The Oxford Handbook of Leadership
and Organizations (pp. 331–356). New York, NY: Oxford University Press.
Balasubramanian, P., & Krishnan, V. R. (2012). Impact of gender and transformational
leadership on ethical behaviors. Great Lakes Herald, 6(1), 45–58.
Baumgardner, T. L., Lord, R. G., & Maher, K. J. (1991). Perceptions of women in management
In R. G. Lord & K. J. Maher (Eds.), Leadership and information processing (pp. 95–113).
Boston, MA: Unwin Hyman.
Beddoes-Jones, F., & Swailes, S. (2015). Authentic leadership: Development of a new three
pillar model. Strategic HR Review, 14(3), 94–99. doi:10.1108/shr-04-2015-0032
Bellou, V. (2011). Do women followers prefer a different leadership style than men? The
International Journal of Human Resource Management, 22(13), 2818–2833.
doi:10.1080/09585192.2011.599677
Billing, Y. D., & Alvesson, M. (2000). Questioning the notion of feminine leadership: A critical
perspective on the gender labelling of leadership. Gender, Work and Organization, 7(3),
144–157. Retrieved from

64
http://nwulib.nwu.ac.za/login?url=http://search.ebscohost.com/login.aspx?direct=true&d
b=edselc&AN=edselc.2-52.0-0033936941&site=eds-live
Birkeland Nielsen, M., Eid, J., Mearns, K., & Larsson, G. (2013). Authentic leadership and its
relationship with risk perception and safety climate. Leadership & Organization
Development Journal, 34(4), 308–325. doi:10.1108/lodj-07-2011-0065
Blau, P. M. (1964). Exchange and power in social life. New York, NY: John Wiley & Sons
Inc.
Boulding, K. E. (1956). General systems theory – the skeleton of science. Management
Science, 2(3), 197–208.
Broverman, I. K., Vogel, S. R., Broverman, D. M., Clarkson, F. E., & Rosenkrantz, P. S.
(1972). Sex-role stereotypes: A current appraisal. Journal of Social Issues, 28 (2), 59–78.
Burgess, K. A., Riddle, D. L., Hall, J. K., & Salas, E. (1992). Principles of team leadership
under stress. Paper presented at the 38th Annual Meeting of the Southeastern
Psychological Association, Knoxville, TN.
Butler, J. (1988). Performative acts and gender constitution: An essay in phenomenology and
feminist theory. Theatre Journal, 40(4), 519–531. Retrieved from
http://nwulib.nwu.ac.za/login?url=http://search.ebscohost.com/login.aspx?direct=true&d
b=edsjsr&AN=edsjsr.10.2307.3207893&site=eds-live
Butler, J. (1993). Bodies that matter: On the discursive limits of 'sex'. New York, NY:
Routledge.
Butler, J. (1999). Gender trouble: Feminism and the subversion of identity. New York, NY:
Routledge.
Byrne, B. M. (2012). Structural equation modeling with Mplus: Basic concepts, applications,
and programming. New York, NY: Routledge Taylor & Francis Group.
Byrne, B. M., Shavelson, R. J., & Muthén, B. (1989). Testing for the equivalence of factor
covariance and mean structures: The issue of partial measurement invariance.
Psychological Bulletin, 105(3), 456–466. doi:10.1037/0033-2909.105.3.456
Byrne, B. M., & Watkins, D. (2003). The issue of measurement invariance revisited. Journal
of Cross-Cultural Psychology, 34(2), 155–175. doi:10.1177/0022022102250225
Câmara, J. R. S., & Pereira-Guizzo, C. (2015). Work-related values and organizational values
from the perspective of university professors: A correlational study. Estudos de Psicologia
(Campinas), 32(2), 259–268. doi:10.1590/0103-166x2015000200010
65
Cheung, G. W. (2008). Testing equivalence in the structure, means, and variances of higher-
order constructs with structural equation modeling. Organizational Research Methods,
11(3), 593–613. doi:10.1177/1094428106298973
Clapp-Smith, R., Vogelgesang, G. R., & Avey, J. B. (2009). Authentic leadership and positive
psychological capital: The mediating role of trust at the group level of analysis. Journal
of Leadership & Organizational Studies, 15(3), 227–240.
doi:10.1177/1548051808326596
Cohen, J. (1988). Statistical power analysis for the behavioral sciences (2nd ed.). Hillsdale,
NJ: Lawrence Erlbaum Associates.
Costa, P., Jr., Terracciano, A., & McCrae, R. R. (2001). Gender differences in personality traits
across cultures: Robust and surprising findings. Journal of Personality and Social
Psychology, 81(2), 322–331. doi:10.1037//0022-3514.81.2.322
Crocetti, E., Cieciuch, J., Gao, C. H., Klimstra, T., Lin, C. L., Matos, P. M., . . . Meeus, W.
(2015). National and gender measurement invariance of the Utrecht-Management of
Identity Commitments Scale (U-MICS): A 10-nation study with university students.
Assessment, 1–16. doi:10.1177/1073191115584969
Dimitrov, D. M. (2010). Testing for factorial invariance in the context of construct validation.
Measurement and Evaluation in Counseling and Development, 43(2), 121–149.
doi:10.1177/0748175610373459
Ding, Z., Ng, F., & Wang, J. (2014). Testing trust scale measurement invariance in project
teams. Journal of Engineering, Design and Technology, 12(2), 209–222. doi:10.1108/jedt-
04-2012-0017
Diskienė, D., & Goštautas, V. (2010). Relationship between individual and organizational
values and employee job satisfaction. Verslo Ir Teisės Aktualijos, 5(2), 295–319.
doi:10.5200/1822-9530.2010.13
Du Plessis, M. (2014). The relationship between authentic leadership, psychological capital,
followership and work engagement (Doctoral dissertation). Retrieved from
http://etd.uwc.ac.za/xmlui/handle/11394/3903
Duckitt, J., & Foster, D. (1991). Introduction to the special issue: Race, social attitudes, and
prejudice. South African Journal of Psychology, 21(4), 199–202. Retrieved from
http://nwulib.nwu.ac.za/login?url=http://search.ebscohost.com/login.aspx?direct=true&d
b=awn&AN=21354&site=eds-live
Eagly, A. H. (1987). Sex differences in social behavior: A social-role interpretation. Hillsdale,
NJ: Lawrence Erlbaum Associates.

66
Eagly, A. H. (2009). The his and hers of prosocial behavior: An examination of the social
psychology of gender. American Psychologist, 64(8), 644–658. doi:10.1037/0003-
066X.64.8.644
Eagly, A. H., & Karau, S. J. (2002). Role congruity theory of prejudice toward female leaders.
Psychological Review, 109(3), 573–598. doi:10.1037//0033-295x.109.3.573
Ferres, N. (2003). The development and validation of the Workplace Trust Survey (WTS):
Combining qualitative and quantitative methodologies. (Unpublished master's thesis),
University of New Castle, Australia.
Field, A. (2013). Discovering statistics using IBM SPSS statistics (4th ed.). London, England:
SAGE.
Gardner, W. L., Avolio, B. J., Luthans, F., May, D. R., & Walumbwa, F. (2005). “Can you see
the real me?” A self-based model of authentic leader and follower development. The
Leadership Quarterly, 16(3), 343–372. doi:10.1016/j.leaqua.2005.03.003
Gardner, W. L., Cogliser, C. C., Davis, K. M., & Dickens, M. P. (2011). Authentic leadership:
A review of the literature and research agenda. The Leadership Quarterly, 22(6), 1120–
1145. doi:10.1016/j.leaqua.2011.09.007
Gartzia, L., Ryan, M. K., Balluerka, N., & Aritzeta, A. (2012). Think crisis–think female:
Further evidence. European Journal of Work and Organizational Psychology, 21(4), 603–
628. doi:10.1080/1359432x.2011.591572
Ghiselli, E. E., Campbell, J. P., & Zedeck, S. (1981). Measurement theory for the behavioral
sciences. San Francisco, CA: Freeman.
Gilbert, G. R., Burnett, M. F., Phau, I., & Haar, J. (2010). Does gender matter? A review of
work‐related gender commonalities. Gender in Management: An International Journal,
25(8), 676–699. doi:10.1108/17542411011092336
Gladstein, D. L., & Reilly, N. P. (1985). Group decision-making under threat: The tycoon
game. Academy of Management Journal, 28(3), 613–627.
Haddon, A., Loughlin, C., & McNally, C. (2015). Leadership in a time of financial crisis: What
do we want from our leaders? Leadership & Organization Development Journal, 36(5),
612–627. doi:10.1108/lodj-12-2013-0166
Hair, J. F., Black, F. C., Babin, B. J., & Anderson, R. E. (2010). Multivariate data analysis: A
global perspective (7th ed.). Upper Saddle River, NJ: Pearson Education.
Hannah, S. T., Uhl-Bien, M., Avolio, B. J., & Cavarretta, F. L. (2009). A framework for
examining leadership in extreme contexts. The Leadership Quarterly, 20(6), 897–919.
doi:10.1016/j.leaqua.2009.09.006
67
Hassan, A., & Ahmed, F. (2011). Authentic leadership, trust and work engagement.
International Journal of Social, Behavioral, Educational, Economic and Management
Engineering, 5(8), 150–156.
Heyns, M., & Rothmann, S. (2015). Comparing trust levels of male and female managers:
Measurement invariance of the behavioural trust inventory. South African Journal of
Psychology, 46(1), 74-87. doi:10.1177/0081246315596732
Holzinger, K. J., & Swineford, R. (1937). The bifactor method. Psychometrika, 2(1), 41-54.
House, R. J., Dorfman, P., Javidan, M., Hanges, P. W., & Sully De Luque, M. (2013). Strategic
leadership across cultures: The GLOBE study of CEO leadership behavior and
effectiveness in 24 countries. Thousand Oaks, CA: SAGE.
Hu, L., & Bentler, P. M. (1999). Cutoff criteria for fit indexes in covariance structure analysis:
Conventional criteria versus new alternatives. Structural Equation Modeling: A
Multidisciplinary Journal, 6(1), 1–55. doi:10.1080/10705519909540118
Hyde, J. S. (2014). Gender similarities and differences. Annual Review of Psychology, 65, 373–
398. doi:10.1146/annurev-psych-010213-115057
Ilies, R., Morgeson, F. P., & Nahrgang, J. D. (2005). Authentic leadership and eudaemonic
well-being: Understanding leader–follower outcomes. The Leadership Quarterly, 16(3),
373–394. doi:10.1016/j.leaqua.2005.03.002
Jöreskog, K. G. (1971). Simultaneous factor analysis in several populations. Psychometrika,
36(4), 409–426. doi:10.1007/BF02291366
Joshanloo, M., Wissing, M. P., Khumalo, I. P., & Lamers, S. M. A. (2013). Measurement
invariance of the Mental Health Continuum-Short Form (MHC-SF) across three cultural
groups. Personality and Individual Differences, 55(7), 755–759.
doi:10.1016/j.paid.2013.06.002
Kasper-Fuehrer, E. C., & Ashkanasy, N. M. (2001). Communicating trustworthiness and
building trust in interorganizational virtual organizations. Journal of Management, 27(3),
235–254.
Katz, D., & Kahn, R. L. (1978). The social psychology of organizations (2nd ed.). New York,
NY: Wiley.
Keller, T. (1999). Images of the familiar: Individual differences and implicit leadership
theories. The Leadership Quarterly, 10(4), 589–607. doi:10.1016/S1048-9843(99)00033-
8
Kernis, M. H. (2003). Toward a conceptualization of optimal self-esteem. Psychological
Inquiry, 14(1), 1–26. doi:10.1207/s15327965pli1401_01

68
Kernis, M. H., & Goldman, B. M. (2006). A multicomponent conceptualization of authenticity:
Theory and research. Advances in Experimental Social Psychology, 38, 283–348.
doi:10.1016/S0065-2601(06)38006-9
Khilji, S. E., Keilson, B., Shakir, F. Y., & Shrestha, B. K. (2015). Self, follower, organization
and the context – a cross cultural view of authentic leadership. South Asian Journal of
Global Business Research, 4(1), 2–26. doi:10.1108/sajgbr-12-2014-0084
Kim, J., Chung, H., Amtmann, D., Revicki, D. A., & Cook, K. F. (2013). Measurement
invariance of the PROMIS pain interference item bank across community and clinical
samples. Quality of Life Research, 22(3), 501–507. doi:10.1007/s11136-012-0191
Kline, R. B. (2011). Principles and practice of structural equation modeling (3rd ed.). New
York, NY: The Guilford Press.
Koenig, A. M., Eagly, A. H., Mitchell, A. A., & Ristikari, T. (2011). Are leader stereotypes
masculine? A meta-analysis of three research paradigms. Psychological Bulletin, 137(4),
616–642. doi:10.1037/a0023557
Liden, R. C., Wayne, S. J., Meuser, J. D., Hu, J., Wu, J., & Liao, C. (2015). Servant leadership:
Validation of a short form of the SL-28. The Leadership Quarterly, 26(2), 254–269.
doi:10.1016/j.leaqua.2014.12.002
Liu, H., Cutcher, L., & Grant, D. (2015). Doing authenticity: The gendered construction of
authentic leadership. Gender, Work and Organization, 22(3), 237–255.
doi:10.1111/gwao.12073
Luthans, F., & Avolio, B. J. (2003). Authentic leadership: A positive developmental approach.
In K. S. Cameron, J. E. Dutton, & R. E. Quinn (Eds.), Positive organizational scholarship
(pp. 241–261). San Francisco, CA: Barrett-Koehler.
McColl-Kennedy, J. R., & Anderson, R. D. (2005). Subordinate–manager gender combination
and perceived leadership style influence on emotions, self-esteem and organizational
commitment. Journal of Business Research, 58(2), 115–125. doi:10.1016/s0148-
2963(03)00112-7
Merchant, K. (2012). How men and women differ: Gender differences in communication styles,
influence tactics, and leadership styles. Retrieved from
http://scholarship.claremont.edu/cgi/viewcontent.cgi?article=1521&context=cmc_theses
Miller, J. G. (1965). Living systems: Basic concepts. Behavioral Science, 10(3), 193–237.
doi:10.1002/bs.3830100302

69
Mishra, A. K., & Mishra, K. E. (2012). Positive organizational scholarship and trust in leaders.
In K. S. Cameron & G. M. Spreitzer (Eds.), The Oxford handbook of positive
organizational scholarship (pp. 449–461). New York, NY: Oxford University Press.
Mitonga-Monga, J., Coetzee, M., & Cilliers, F. V. N. (2012). Perceived leadership style and
employee participation in a manufacturing company in the Democratic Republic of
Congo. African Journal of Business Management, 6(15), 5389–5398.
doi:10.5897/ajbm11.2443
Mulvey, K. L., & Killen, M. (2015). Challenging gender stereotypes: Resistance and exclusion.
Child Development, 86(3), 681–694. doi:10.1111/cdev.12317
Munyaka, S. A. (2012). The relationship between authentic leadership, psychological capital
and, psychological climate, team commitment and the intention to quit in a South African
manufacturing organisation (Unpublished doctoral dissertation). Nelson Mandela
Metropolitan University, Port Elizabeth.
Múthen, L. K., & Múthen, B. O. (1998-2012). Mplus user’s guide (7th ed.). Los Angeles, CA:
Múthen & Múthen.
Neider, L. L., & Schriesheim, C. A. (2011). The Authentic Leadership Inventory (ALI):
Development and empirical tests. The Leadership Quarterly, 22(6), 1146–1164.
doi:10.1016/j.leaqua.2011.09.008
Nguyen, L. D., Ermasova, N., Geyfman, V., & Mujtaba, B. G. (2014). Leadership orientations
of Russian working adults: Do age, gender, education, and government work experience
make a difference? Public Organization Review, 1–15. doi:10.1007/s11115-014-0279-6
Norman, S. M., Avolio, B. J., & Luthans, F. (2010). The impact of positivity and transparency
on trust in leaders and their perceived effectiveness. The Leadership Quarterly, 21(3),
350–364. doi:10.1016/j.leaqua.2010.03.002
Nunnally, J. C., & Bernstein, I. H. (1994). Psychometric theory. New York, NY: McGraw-
Hill.
Owusu-Bempah, J., Addison, R., & Fairweather, J. (2014). Commonalities and specificities of
authentic leadership in Ghana and New Zealand. Educational Management
Administration & Leadership, 42(4), 536–556. doi:10.1177/1741143213502198
Pallant, J. (2013). SPSS survival manual: A step by step guide to data analysis using IBM SPSS
(5th ed.). Berkshire, England: Open University Press.
Paustian-Underdahl, S. C., Walker, L. S., & Woehr, D. J. (2014). Gender and perceptions of
leadership effectiveness: A meta-analysis of contextual moderators. Journal of Applied
Psychology, 99(6), 1129–1145. doi:10.1037/a0036751

70
Payne, K. E. (2001). Different but equal: Communication between the sexes Connecticut, NE:
Praeger.
Raykov, T. (2009). Evaluation of scale reliability for unidimensional measures using latent
variable modeling Measurement and Evaluation in Counseling and Development, 42(3),
223–232. doi:10.1177/0748175609344096
Reise, S. P., Moore, M., & Haviland, M. G. (2010). Bifactor models and rotations: Exploring
the extent to which multidimensional data yield univocal scale scores. Journal of
Personality Assessment, 92(6), 544-559. doi:10.1080/00223891.2010.496477
Roe, R. A., & Ester, P. (1999). Values and work: Empirical findings and theoretical
perspective. Applied Psychology: An International Review, 48(1), 1–21.
Rokeach, M. (1979). Understanding human values. New York, NY: The Free Press.
Roodt, G. (2013). Validity: Basic concepts and measures. Introduction to psychological
assessment in the South African context (4th ed.). Cape Town, South Africa: Oxford
University Press.
Rothmann, S., & Cooper, C. L. (2015). Work and organizational psychology (2nd ed.). East
Sussex, England: Routledge.
Roux, S. (2010). The relationsip between authentic leadership, optimism, self-efficacy and
work engagement: An exploratory study (Master's thesis). Retrieved from
https://scholar.sun.ac.za/handle/10019.1/2182
Rudman, L. A., & Goodwin, S. A. (2004). Gender differences in automatic in-group bias: Why
do women like women more than men like men? Journal of Personality and Social
Psychology, 87(4), 494–509. doi:10.1037/0022-3514.87.4.494
Satorra, A., & Bentler, P. M. (2001). A scaled difference chi-square test statistic for moment
structure analysis. Psychometrika, 66(4), 507–514.
Satorra, A., & Bentler, P. M. (2010). Ensuring positiveness of the scaled difference chi-square
test statistic. Psychometrika, 75(2), 243–248. doi:10.1007/s11336-009-9135-y
Schein, E. H. (1985). Organizational culture and leadership. San Francisco, CA: Jossey-Bass.
Schmid, J., & Leiman, J. (1957). The development of hierarchical factor solutions.
Psychometrika, 22(1), 53-61.
Schriesheim, C. A., & Cogliser, C. C. (2009). Construct validation in leadership research:
Explication and illustration. The Leadership Quarterly, 20(5), 725–736.
doi:10.1016/j.leaqua.2009.06.004

71
Schwartz, S. H. (2005). Basic human values: Their content and structure across countries. In
A. Tamayo & J. B. Porto (Eds.), Valores e comportamento nas organizacoes [Values and
behavior in organizations] (pp. 21–55). Petropolis, Brazil: Vozes.
Seligman, M. E. P., & Csikszentmihalyi, M. (2000). Positive psychology: An introduction.
American Psychologist, 55(1), 5–14. doi:10.1037//003-066X.55.1.5
Smith, P. B., & Bond, M. H. (1993). Social psychology across cultures. Cambridge, England:
Harvester Wheatsheaf.
Spence, J. T., & Buckner, C. E. (2000). Instrumental and expressive traits, trait stereotypes,
and sexist attitudes: What do they signify? Psychology of Women Quarterly, 24(1), 44-62.
Retrieved from
http://nwulib.nwu.ac.za/login?url=http://search.ebscohost.com/login.aspx?direct=true&d
b=edselc&AN=edselc.2-52.0-0034396391&site=eds-live
Stander, F. W., De Beer, L. T., & Stander, M. W. (2015). Authentic leadership as a source of
optimism, trust in the organisation and work engagement in the public health care sector.
South African Journal of Human Resource Management, 13(1), Art. #675, 12 pages.
doi:10.4102/sajhrm.v13i1.675
Stark, S., Chernyshenko, O. S., & Drasgow, F. (2006). Detecting differential item functioning
with confirmatory factor analysis and item response theory: Toward a unified strategy.
Journal of Applied Psychology, 91(6), 1292–1306. doi:10.1037/0021-9010.91.6.1292
Steinberg, L., & Thissen, D. (1996). Uses of item response theory and the testlet concept in the
measurement of psychopathology. Psychological Methods, 1, 81–97.
Sweeney, P. J., Thompson, V., & Blanton, H. (2009). Trust and influence in combat - An
interdependence model. Journal of Applied Social Psychology, 39(1), 235-264.
doi:10.1111/j.1559-1816.2008.00437
Van De Schoot, R., Lugtig, P., & Hox, J. (2012). A checklist for testing measurement
invariance. European Journal of Developmental Psychology, 9(4), 486–492.
doi:10.1080/17405629.2012.686740
Van De Vijver, R. F., & Leung, K. (1997). Methods and data analyis for cross-cultural
research. Thousand Oaks, CA: SAGE.
Van Wart, M., & Kapucu, N. (2011). Crisis management competencies. The case of emergency
managers in the USA. Public Management Review, 13(4), 489–511.
doi:10.1080/14719037.2010.525034

72
Vandenberg, R. J., & Lance, C. E. (2000). A review and synthesis of the measurement
invariance literature: Suggestions, practices and recommendations for organizational
research. Organizational Research Methods, 3(1), 4–70.
Vecchio, R. P. (2002). Leadership and gender advantage. The Leadership Quarterly, 13(6),
643–671. doi:10.1016/S1048-9843(02)00156
Walumbwa, F. O., Avolio, B. J., Gardner, W. L., Wernsing, T. S., & Peterson, S. J. (2008).
Authentic leadership: Development and validation of a theory-based measure. Journal of
Management, 34(1), 89–126. doi:10.1177/0149206307308913
Wang, A.-C., Chiang, J. T.-J., Tsai, C.-Y., Lin, T.-T., & Cheng, B.-S. (2013). Gender makes
the difference: The moderating role of leader gender on the relationship between
leadership styles and subordinate performance. Organizational Behavior and Human
Decision Processes, 122(2), 101–113. doi:10.1016/j.obhdp.2013.06.001
Wang, D.-S., & Hsieh, C.-C. (2013). The effect of authentic leadership on employee trust and
employee engagement. Social Behavior and Personality, 41(4), 613–624.
doi:10.2224/sbp.2013.41.4.613
Wang, J., & Wang, X. (2012). Structural equation modeling: Applications using Mplus.
Chichester, United Kingdom: Wiley.
West, S. G., Taylor, A. B., & Wu, W. (2012). Model fit and model selection in structural
equation modeling. In R. D. Hoyle (Ed.), Handbook of structural equation modeling (pp.
209–231). New York, NY: The Guilford Press.
Williams, J. E., & Best, D. L. (1990). Measuring sex stereotypes: A multination study. Newbury
Park, CA: SAGE
Wong, C. A., & Cummings, G. G. (2009). The influence of authentic leadership behaviors on
trust and work outcomes of health care staff. Journal of Leadership Studies, 3(2), 6–23.
doi:10.1002/jls.20104
Yen, W. M. (1993). Scaling performance assessments: Strategies for managing local item
dependence. Journal of Educational Measurement, 30, 187–213. Retrieved from
http://nwulib.nwu.ac.za/login?url=http://search.ebscohost.com/login.aspx?direct=true&d
b=edsjsr&AN=edsjsr.1435043&site=eds-live
Zbierowski, P., & Góra, K. (2014). Positive leadership: Its nature, antecedents and
consequences. Journal of Positive Management, 5(1), 85–99. doi:10.12775/jpm.2014.008
Zikalala, D. (2014). Psychometric evaluation of a leadership empowerment questionnaire in
selected organisations in South Africa (Unpublished master's thesis). North-West
University, Vanderbijlpark, South Africa.

73
CHAPTER 3
CONCLUSIONS, LIMITATIONS AND RECOMMENDATIONS
This chapter presents the theoretical and empirical conclusions of the study, according to the
objectives, concluding with the limitations of the study and recommendations made for future
research and practice.
3.1 CONCLUSIONS FROM LITERATURE AND EMPIRICAL RESULTS
The general aim of this study was to establish measurement invariance for the Authentic
Leadership Inventory (ALI) across two South African organisations from two different
industries.
The first objective was to conceptualise authentic leadership and validation methods according
to literature. In a review of the literature conducted by Gardner, Cogliser, Davis, and Dickens
(2011), they elaborated on the development of both the authentic leader and authentic
leadership constructs. They stated that the original conceptualisations in an organisational
context dated back to 1967 (Gardner et al., 2011). Henderson and Hoy were the first to
conceptualise leader authenticity in 1983 when they distinguished between leader authenticity
versus leader inauthenticity. A number of years elapsed before authentic leadership, per se, was
defined in the social sciences and gained momentum (Gardner et al., 2011). Several other
authors are known for their contributions in defining the construct of authentic leadership
(George, 2003; Ilies, Morgeson, & Nahrgang, 2005; Kernis, 2003; Kernis & Goldman, 2006;
Luthans & Avolio, 2003) that eventually leads to dimensions of “self-awareness, positive self-
regulation, positive self-development, and/or a positive moral perspective” (Gardner et al.,
2011, p. 4). The most widely accepted definition to date is the one that was developed and
operationalised by Walumbwa, Avolio, Gardner, Wernsing, and Peterson (2008) for the
purposes of developing the Authentic Leadership Questionnaire (ALQ).
Walumbwa (2008) and his colleagues defined authentic leadership as leadership that “draws
on positive psychological capacities and positive ethical climate to foster the four core
dimensions of authentic leadership, enabling positive follower self-development” (p. 94).
74
Subsequently, they concluded that authentic leadership can be operationalised in terms of four
dimensions, conceptualised by Kernis and Goldman (2006). First, self-awareness means that
the leader knows him/herself and the impact he/she has on others, including an understanding
of how one creates meaning (makes sense) of the world with implications for self-awareness
(Kernis, 2003; Walumbwa et al., 2008). Second, relational transparency means that the leader
is authentic in dealing with others by displaying their true thoughts and emotions in
interpersonal interactions (Kernis, 2003; Walumbwa et al., 2008). Third, balanced processing
means that the leader takes into account the views of others when making decisions in order to
reach an objective decision, even if it challenges their beliefs and feelings (Gardner, Avolio,
Luthans, May, & Walumbwa, 2005; Walumbwa et al., 2008). Last, internalised moral
perspective means that the leader acts and makes decisions in accordance with his or her beliefs
and values, regulating him/herself from the inside out instead of being controlled by the
environment (Avolio & Gardner, 2005; Gardner et al., 2005; Walumbwa et al., 2008).
Neider and Schriesheim (2011) developed the Authentic Leadership Inventory (ALI) with these
four dimensions as the basis, in response to a variety of critique on the ALQ threatening the
internal and external validity of the construct. According to Anastasi and Urbina (1997) as well
as Roodt (2013), three types of validity can be distinguished: Content-description, construct-
identification and criterion-prediction. Content validity falls largely outside of the scope of this
study, but refers to whether the content of the measuring instrument covers a sufficient part of
the construct that one wishes to measure and is partly conducted by subject matter experts as
opposed to statistical procedures (Roodt, 2013). Construct validity refers to a psychometric
property indicating the extent to which the measuring instrument measures the construct it was
designed to measure and factorial validity is one form of this (Anastasi & Urbina, 1997; Roodt,
2013). By means of factorial analysis, the interrelationships between constructs are determined
and used when the measure is validated in a context in which it has never been used (Roodt,
2013). Schriesheim and Cogliser (2009) are of the opinion that construct validity plays an
important role in the leadership domain. The final type of validity that can be distinguished is
criterion-prediction of which concurrent validity forms part. This refers to the ability of the
instrument being used to predict an outcome (Anastasi & Urbina, 1997; Roodt, 2013).
Measurement invariance is an aspect of validity and is defined as the extent to which an
instrument measures the same construct when administered in different contexts (Horn &
McArdle, 1992). Measurement invariance clusters with construct validation procedures as the

75
former is described as factorial analytic procedures that are used for the purpose of determining
the equivalence (invariance) of instruments across groups (Roodt, 2013). This will mean that
individuals, from different groups, interpret items and constructs the same (Dimitrov, 2010;
Ding, Ng, & Wang, 2014; Van De Schoot, Lugtig, & Hox, 2012; Van De Vijver & Leung,
1997). Depending on the aims of a particular study, different levels of measurement invariance
are needed (Cheung, 2008; Crocetti et al., 2015). Dimitrov (2010), Van De Schoot et al. (2012),
and Wang and Wang (2012) distinguish between three levels of measurement invariance,
namely metric (or weak), scalar (or strong) and strict. In order to compare latent means across
groups, scalar invariance should be established (Cheung, 2008).
The second objective was to determine whether authentic leadership, as measured by the ALI,
is a four-factor construct in the mining organisation. The results of this study indicated that a
one-factor model fitted the data best. This is in line with previous research (Stander, De Beer,
& Stander, 2015) on the ALI that concluded that authentic leadership, as measured by the ALI,
is a one-factor construct. This contradicts the findings of Neider and Schriesheim (2011) that
authentic leadership, as measured by the ALI, is a four-factor model loading onto one higher-
order factor.
The third objective was to evaluate if the internal consistency of the ALI is acceptable in the
mining organisation. Results confirmed the internal consistency of the ALI (ρ = .94) and this
is in line with previous research (Neider & Schriesheim, 2011; Stander et al., 2015).
The fourth objective of the study was to determine if authentic leadership, as measured by the
ALI, is a significant predictor of trust in the leader in the mining organisation. In line with
previous research indicating the ability of authentic leadership to predict followers’ trust in the
leader (Clapp-Smith, Vogelgesang, & Avey, 2009; Hassan & Ahmed, 2011; Wong &
Cummings, 2009), the results of the current study confirmed the ability of authentic leaders to
influence trust (β = .73, p < .001).
The fifth objective of the study was to investigate if authentic leadership, as measured by the
ALI, is invariant across gender groups. Results of the study indicated that authentic leadership
is only partially configurally invariant, which means that the basic structural model is only
partially invariant. This indicates differences in the way that different groups conceptualise the
construct (Milfont & Fischer, 2010). Specifically, items 3 and 5 were non-invariant and had to

76
be excluded for further analysis. Metric invariance could be established, meaning that the factor
loadings onto the construct were equivalent across the gender groups. Only partial scalar
invariance could be established due to the differences in the intercepts between the two groups
on item 8. The results indicated that items 3, 5 and 8 were biased. Gender differences in the
interpretation of items can be traced back to the differences in information sharing which is
more than just the cognitive aspect thereof for females (Costa, Terracciano, & McCrae, 2001;
Heyns & Rothmann, 2015).
The sixth objective of the study was to investigate whether authentic leadership, as measured
by the ALI, is invariant across two organisations. Results of the study indicated that authentic
leadership is only partially configurally invariant, which means that the basic structural model
is only partially invariant. Items 2, 3, 5, 6 and 14 were configurally non-invariant. Although
the bias of items 3 and 5 cannot be ascribed to organisational differences, the bias of the rest
of the items (items 2, 6 and 14) potentially derives from differences between the organisations.
Once again, only partial scalar invariance could be established across the two organisational
groups due to differences in the intercepts of items 1, 4 and 12. In total, eight of the items of
the ALI were non-invariant across the two organisational groups. Differences in the
interpretation of the items can be traced back to differences in the organisational cultures
governing beliefs and values, and behavioural norms as explained by Armstrong and Taylor
(2014).
The seventh objective of the study was to evaluate if there are significant mean differences on
the dimensions of authentic leadership as measured by the ALI for different gender and
organisational groups. The results indicated no significant mean differences between the two
different gender groups or between the two organisational groups after biased items had been
removed. The absence of gender differences is partially in line with the study of Du Plessis
(2014) that only found significant differences on the balanced processing dimension of the
authentic leadership construct. A meta-analysis conducted by Hyde (2014) on gender
differences and similarities, indicated more similarities than differences. No previous research
on differences between different organisations with the ALI has been reported to date. The
current results may confirm that extreme contexts such as these organisations share risks,
whether being psychological or physical, as postulated by Hannah, Uhl-Bien, Avolio, and
Cavarretta (2009); therefore rating their leaders equally which hint at more similarities than
differences.

77
3.2 LIMITATIONS
The study had several limitations which should be kept in mind when interpreting the results.
The study was conducted in two specific organisations and cannot be generalised to other
contexts. The study was cross-sectional in nature and no conclusions may be drawn in terms
of the “cause-and-effect” of authentic leadership and trust in the leader. There were differences
in the sample sizes between the two organisations, and the questionnaires were administered
in English which is not the first language (mother tongue) of most of the participants.
Furthermore, the impact of certain other demographic variables was not considered, such as
age, race, and education. Roodt (2013) describes these as moderator variables which have the
potential to influence validity. In terms of gender, only the gender of the followers was taken
into account. Lastly, only self-report measures were used. According to Podsakoff, MacKenzie,
Lee, and Podsakoff (2003), bias results when the sources that provide feedback on the criterion
and predictor variable are the same. However, in this study the aim was to evaluate the
followers’ perceptions of their leaders as being both authentic and trustworthy. Self-report
measures were deemed most appropriate for this aim.
3.3 RECOMMENDATIONS
Based on the findings of this study, several recommendations can be made for future research
and practice which were the last objective of this study.
3.3.1 Recommendations for Future Research
No single accepted definition of authentic leadership exists and scholarly debates are still on-
going (Beddoes-Jones & Swailes, 2015; Gardner et al., 2011; Khilji, Keilson, Shakir, &
Shrestha, 2015; Kinsler, 2014), complicating consensus in construct measurement. What
complicates matters even more is the fact that followers may understand both authentic
leadership and authenticity differently (Owusu-Bempah, Addison, & Fairweather, 2014).
Given the fact that South Africa differs significantly from other (Western) countries on a
variety of aspects (Joshanloo, Wissing, Khumalo, & Lamers, 2013) - where leadership is in the
“eye of the beholder” and is influenced by context (Avolio & Walumbwa, 2014; Neider &
Schriesheim, 2011; Paustian-Underdahl, Walker, & Woehr, 2014) - the development of a
unique definition of authentic leadership is important.

78
Future research should investigate structural invariance in these two organisations in order to
resolve the debate on whether authentic leadership is equally preferred or effective. Haddon,
Loughlin, and McNally (2015) are of the opinion that existing literature does not provide a
clear understanding of leadership preferences in crisis versus non-crisis contexts.
Several researchers (De Hoogh, Den Hartog, & Nevicka, 2015; Heyns & Rothmann, 2015)
advocate for the investigation of the interaction between the gender of the follower and the
gender of the leader. Future studies should investigate this leader-subordinate dyad. The
leader’s gender might also have an impact on the effectiveness of leadership (Liu, Cutcher, &
Grant, 2015; Wang, Chiang, Tsai, Lin, & Cheng, 2013). Future research may therefore include
the leader’s gender as a moderating variable between followers’ perceptions of the leader and
individual or organisational outcomes.
3.3.2 Recommendations for Practice
In today’s business environments, trust between leaders and followers is considered to be an
important relational element (Caza, Zhang, Wang, & Bai, 2015; Norman, Avolio, & Luthans,
2010). Authentic leaders can influence followers’ perceptions of trust (Avolio & Walumbwa,
2014; Norman et al., 2010) with resultant desirable and positive outcomes on individual, team
and organisational levels, even during turbulent times (Algera & Lips-Wiersma, 2012; Onorato
& Zhu, 2014). This legitimises authentic leadership as a construct worthy of attention in
research. In line with the recommendation of Avolio and Walumbwa (2014) to base leadership
development on empirical evidence, the current study demonstrated the impact of authentic
leadership on followers’ trust in the leader, and the mining organisation in particular can invest
in authentic leadership development for its leaders.
Interventions may include developing leaders’ psychological capital (hope, optimism, self-
efficacy and resilience) through specific interventions (Avolio, Griffith, Wernsing, &
Walumba, 2010) as part of positive self-development (Avolio & Gardner, 2005; Luthans &
Avolio, 2003). These interventions may include, but are not limited to mindfulness – being
aware of the present (Brown & Ryan, 2003), adaptive self-reflection linked to narrative
processing (Avolio et al., 2010), dramaturgy (Ladkin & Taylor, 2010), and triggering events
(in the form of feedback, major life events and perceived failures or successes). Coaching and
mentoring (Kinsler, 2014; Maldanado, 2013) and formal training events with positive

79
developmental interventions (“what went right?”; Avolio et al., 2010) may also facilitate the
development of leader authenticity. In order for followers to be able to provide feedback to
leaders, strengths-based development of followers (Avolio et al., 2010) - also known as
dialogical communication (Berkovich, 2014) - may be utilised.
In the absence of significant differences between followers’ evaluation of their leaders as
authentic, both across gender and organisational groups, the two respective organisations do
not need to tailor interventions based on gender characteristics when training their leaders to
be authentic. Similar, authentic leadership interventions designed for one organisation could
work equally well in the other organisation.
3.4 CHAPTER SUMMARY
In this chapter the conclusions were provided on each of the objectives of the study from
empirical and theoretical perspectives, depending on the nature of the respective objective. The
chapter concluded with the limitations of the current study as well as the recommendations for
future research and practice.

80
References
Algera, P. M., & Lips-Wiersma, M. (2012). Radical authentic leadership: Co-creating the
conditions under which all members of the organization can be authentic. The Leadership
Quarterly, 23(1), 118–131. doi:10.1016/j.leaqua.2011.11.010
Avolio, B. J., Griffith, J., Wernsing, T. S., & Walumba, F. O. (2010). What is authentic
leadership development? In P. A. Linley, S. Harrington, & N. Garcea, Oxford handbook
of positive psychology and work (pp. 39–51). New York, NY: Oxford University Press.
Anastasi, A., & Urbina, S. (1997). Psychological testing (7th ed.). Upper Saddle River, NJ:
Prentice-Hall.
Armstrong, M., & Taylor, T. (2014). Amstrong's handbook of human resource management
practice (13th ed.). London, England: Kogan Page.
Avolio, B. J., & Gardner, W. L. (2005). Authentic leadership development: Getting to the root
of positive forms of leadership. The Leadership Quarterly, 16(3), 315–338.
doi:10.1016/j.leaqua.2005.03.001
Avolio, B. J., & Walumbwa, F. O. (2014). Authentic leadership theory, research and practice:
Steps taken and steps that remain. In D. V. Day (Ed.), The Oxford Handbook of Leadership
and Organizations (pp. 331–356). New York, NY: Oxford University Press.
Beddoes-Jones, F., & Swailes, S. (2015). Authentic leadership: Development of a new three
pillar model. Strategic HR Review, 14(3), 94–99. doi:10.1108/shr-04-2015-0032
Berkovich, I. (2014). Between person and person: Dialogical pedagogy in authentic leadership
development. Academy of Management Learning & Education, 13(2), 245–264.
doi:10.5465/amle.2012.0367
Brown, K. W., & Ryan, M. (2003). The benefits of being present: Mindfulness and its role in
psychological well-being. Journal of Personality & Social Psychology, 84(4), 822–848.
Caza, A., Zhang, G., Wang, L., & Bai, Y. (2015). How do you really feel? Effect of leaders'
perceived emotional sincerity on followers' trust. The Leadership Quarterly, 26(4), 518–
531. doi:10.1016/j.leaqua.2015.05.008
Cheung, G. W. (2008). Testing equivalence in the structure, means, and variances of higher-
order constructs with structural equation modeling. Organizational Research Methods,
11(3), 593–613. doi:10.1177/1094428106298973
Clapp-Smith, R., Vogelgesang, G. R., & Avey, J. B. (2009). Authentic leadership and positive
psychological capital: The mediating role of trust at the group level of analysis. Journal
of Leadership & Organizational Studies, 15(3), 227–240.
doi:10.1177/1548051808326596

81
Costa, P., Jr., Terracciano, A., & McCrae, R. R. (2001). Gender differences in personality traits
across cultures: Robust and surprising findings. Journal of Personality and Social
Psychology, 81(2), 322–331. doi:10.1037//0022-3514.81.2.322
Crocetti, E., Cieciuch, J., Gao, C. H., Klimstra, T., Lin, C. L., Matos, P. M., . . . Meeus, W.
(2015). National and gender measurement invariance of the Utrecht-Management of
Identity Commitments Scale (U-MICS): A 10-nation study with university students.
Assessment, 1–16. doi:10.1177/1073191115584969
De Hoogh, A. H. B., Den Hartog, D. N., & Nevicka, B. (2015). Gender differences in the
perceived effectiveness of narcissistic leaders. Applied Psychology: An International
Review, 64(3), 473–498. doi:10.1111/apps.12015
Dimitrov, D. M. (2010). Testing for factorial invariance in the context of construct validation.
Measurement and Evaluation in Counseling and Development, 43(2), 121–149.
doi:10.1177/0748175610373459
Ding, Z., Ng, F., & Wang, J. (2014). Testing trust scale measurement invariance in project
teams. Journal of Engineering, Design and Technology, 12(2), 209–222. doi:10.1108/jedt-
04-2012-0017
Du Plessis, M. (2014). The relationship between authentic leadership, psychological capital,
followership and work engagement. (Doctoral dissertation). Retrieved from
http://etd.uwc.ac.za/xmlui/handle/11394/3903
Gardner, W. L., Avolio, B. J., Luthans, F., May, D. R., & Walumbwa, F. (2005). “Can you see
the real me?” A self-based model of authentic leader and follower development. The
Leadership Quarterly, 16(3), 343–372. doi:10.1016/j.leaqua.2005.03.003
Gardner, W. L., Cogliser, C. C., Davis, K. M., & Dickens, M. P. (2011). Authentic leadership:
A review of the literature and research agenda. The Leadership Quarterly, 22(6), 1120–
1145. doi:10.1016/j.leaqua.2011.09.007
George, W. (2003). Authentic leadership: Rediscovering the secrets to creating lasting value.
San Francisco, CA: Jossey–Bass.
Haddon, A., Loughlin, C., & McNally, C. (2015). Leadership in a time of financial crisis: What
do we want from our leaders? Leadership & Organization Development Journal, 36(5),
612–627. doi:10.1108/lodj-12-2013-0166
Hannah, S. T., Uhl-Bien, M., Avolio, B. J., & Cavarretta, F. L. (2009). A framework for
examining leadership in extreme contexts. The Leadership Quarterly, 20(6), 897–919.
doi:10.1016/j.leaqua.2009.09.006
82
Hassan, A., & Ahmed, F. (2011). Authentic leadership, trust and work engagement.
International Journal of Social, Behavioral, Educational, Economic and Management
Engineering, 5(8), 150–156.
Henderson, J. E., & Hoy, W. K. (1983). Leader authenticity: The development and test of an
operational measure. Educational and Psychological Research, 3(2), 63–75.
Heyns, M., & Rothmann, S. (2015). Comparing trust levels of male and female managers:
Measurement invariance of the behavioural trust inventory. South African Journal of
Psychology, 46(1), 74-87. doi:10.1177/0081246315596732
Horn, J. L., & McArdle, J. J. (1992). A practical and theoretical guide to measurement
invariance in aging research. Experimental Aging Research, 18(3-4), 117–144. Retrieved
from
http://nwulib.nwu.ac.za/login?url=http://search.ebscohost.com/login.aspx?direct=true&d
b=edselc&AN=edselc.2-52.0-0026481045&site=eds-live
Hyde, J. S. (2014). Gender similarities and differences. Annual Review of Psychology, 65, 373–
398. doi:10.1146/annurev-psych-010213-115057
Ilies, R., Morgeson, F. P., & Nahrgang, J. D. (2005). Authentic leadership and eudaemonic
well-being: Understanding leader-follower outcomes. The Leadership Quarterly, 16(3),
373–394. doi:10.1016/j.leaqua.2005.03.002
Joshanloo, M., Wissing, M. P., Khumalo, I. P., & Lamers, S. M. A. (2013). Measurement
invariance of the Mental Health Continuum-Short Form (MHC-SF) across three cultural
groups. Personality and Individual Differences, 55(7), 755–759.
doi:10.1016/j.paid.2013.06.002
Kernis, M. H. (2003). Toward a conceptualization of optimal self-esteem. Psychological
Inquiry, 14(1), 1–26. doi:10.1207/s15327965pli1401_01
Kernis, M. H., & Goldman, B. M. (2006). A multicomponent conceptualization of authenticity:
Theory and research. Advances in Experimental Social Psychology, 38, 283–348.
doi:10.1016/S0065-2601(06)38006-9
Khilji, S. E., Keilson, B., Shakir, F. Y., & Shrestha, B. K. (2015). Self, follower, organization
and the context – a cross cultural view of authentic leadership. South Asian Journal of
Global Business Research, 4(1), 2–26. doi:10.1108/sajgbr-12-2014-0084
Kinsler, L. (2014). Born to be me...who am I again? The development of authentic leadership
using evidence-based leadership coaching and mindfulness. International Coaching
Psychology Review, 9(1), 92–105.

83
Ladkin, D., & Taylor, S. S. (2010). Enacting the "true self": Towards a theory of embodied
authentic leadership. The Leadership Quarterly, 21(1), 64–74.
doi:10.1016/j.leaqua.2009.10.005
Liu, H., Cutcher, L., & Grant, D. (2015). Doing authenticity: The gendered construction of
authentic leadership. Gender, Work and Organization, 22(3), 237–255.
doi:10.1111/gwao.12073
Luthans, F., & Avolio, B. J. (2003). Authentic leadership: A positive developmental approach.
In K. S. Cameron, J. E. Dutton, & R. E. Quinn (Eds.), Positive organizational scholarship
(pp. 241–261). San Francisco, CA: Barrett-Koehler.
Maldanado, M. L. (2013, March). How authentic is your leadership development? Chief
Learning Officer, 26–29.
Milfont, T. L., & Fischer, R. (2010). Testing measurement invariance across groups:
Applications in cross-cultural research. International Journal of Psychological Research,
3(1), 111–121.
Neider, L. L., & Schriesheim, C. A. (2011). The Authentic Leadership Inventory (ALI):
Development and empirical tests. The Leadership Quarterly, 22(6), 1146–1164.
doi:10.1016/j.leaqua.2011.09.008
Norman, S. M., Avolio, B. J., & Luthans, F. (2010). The impact of positivity and transparency
on trust in leaders and their perceived effectiveness. The Leadership Quarterly, 21(3),
350–364. doi:10.1016/j.leaqua.2010.03.002
Onorato, M., & Zhu, J. (2014). An empirical study on the relationships between AL and
organisational trust by industry segment. SAM Advanced Management Journal, 26–39.
Owusu-Bempah, J., Addison, R., & Fairweather, J. (2014). Commonalities and specificities of
authentic leadership in Ghana and New Zealand. Educational Management
Administration & Leadership, 42(4), 536–556. doi:10.1177/1741143213502198
Paustian-Underdahl, S. C., Walker, L. S., & Woehr, D. J. (2014). Gender and perceptions of
leadership effectiveness: A meta-analysis of contextual moderators. Journal of Applied
Psychology, 99(6), 1129–1145. doi:10.1037/a0036751
Podsakoff, P. M., MacKenzie, S. B., Lee, J. Y., & Podsakoff, N. P. (2003). Common method
biases in behavioral research: A critical review of the literature and recommended
remedies. Journal of Applied Psychology, 88(5), 879–903. doi:10.1037/0021-
9010.88.5.879

84
Roodt, G. (2013). Validity: Basic concepts and measures Introduction to psychological
assessment in the South African context (4th ed.). Cape Town, South Africa: Oxford
University Press.
Schriesheim, C. A., & Cogliser, C. C. (2009). Construct validation in leadership research:
Explication and illustration. The Leadership Quarterly, 20(5), 725–736.
doi:10.1016/j.leaqua.2009.06.004
Stander, F. W., De Beer, L. T., & Stander, M. W. (2015). Authentic leadership as a source of
optimism, trust in the organisation and work engagement in the public health care sector.
SA Journal of Human Resource Management, 13(1). doi:10.4102/sajhrm.v13i1.675
Van De Schoot, R., Lugtig, P., & Hox, J. (2012). A checklist for testing measurement
invariance. European Journal of Developmental Psychology, 9(4), 486–492.
doi:10.1080/17405629.2012.686740
Van De Vijver, R. F., & Leung, K. (1997). Methods and data analyis for cross-cultural
research. Thousand Oaks, CA: SAGE.
Walumbwa, F. O., Avolio, B. J., Gardner, W. L., Wernsing, T. S., & Peterson, S. J. (2008).
Authentic leadership: Development and validation of a theory-based measure. Journal of
Management, 34(1), 89–126. doi:10.1177/0149206307308913
Wang, A.-C., Chiang, J. T.-J., Tsai, C.-Y., Lin, T.-T., & Cheng, B.-S. (2013). Gender makes
the difference: The moderating role of leader gender on the relationship between
leadership styles and subordinate performance. Organizational Behavior and Human
Decision Processes, 122(2), 101–113. doi:10.1016/j.obhdp.2013.06.001
Wang, J., & Wang, X. (2012). Structural equation modeling: Applications using Mplus.
Chichester, United Kingdom: Wiley.
Wong, C. A., & Cummings, G. G. (2009). The influence of authentic leadership behaviors on
trust and work outcomes of health care staff. Journal of Leadership Studies, 3(2), 6–23.
doi:10.1002/jls.20104