The Asian Population: 2010 - Census · made for people of Asian descent. In 1860, the first Asian...
24
U.S. Department of Commerce Economics and Statistics Administration U.S. CENSUS BUREAU The Asian Population: 2010 2010 Census Briefs By Elizabeth M. Hoeffel, Sonya Rastogi, Myoung Ouk Kim, and Hasan Shahid C2010BR-11 Issued March 2012 INTRODUCTION According to the 2010 Census, the Asian population grew faster than any other race group in the United States between 2000 and 2010. This was observed for the population who reported Asian alone (increased 43 percent), as well as for the popu- lation who reported Asian alone or in combination with another race (increased 46 percent). The Asian population continued to be concen- trated in the West, and the Chinese population was the largest detailed Asian group. This report provides a portrait of the Asian population in the United States and discusses that population’s distri- bution at the national level and at lower levels of geography. 1 It is part of a series that analyzes population and housing data collected from the 2010 Census. The data for this report are based on the 2010 Census Redistricting Data (Public Law 94-171) Summary File, which was the first 2010 Census data product released with data on race and Hispanic origin, including information on the Asian popu- lation, and was provided to each state for use in drawing boundaries for legislative districts. 2 Data for this report also come from the 2010 Census Summary File 1, which was one of the first 2010 Census 1 This report discusses data for the 50 states and the District of Columbia, but not Puerto Rico. 2 Information on the 2010 Census Redistricting Data (Public Law 94-171) Summary File is available online at <http://2010.census.gov/2010census/data /redistricting-data.php>. data products to provide information on selected detailed groups, such as Asian Indians, Koreans, and Filipinos. 3 UNDERSTANDING RACE DATA FROM THE 2010 CENSUS The 2010 Census used federal standards to collect and present data on race. For the 2010 Census, the question on race was asked of individuals living in the United States (see Figure 1). An individual’s response to the race question was based upon self-identification. The U.S. Census Bureau collects information on race following the guidance of the U.S. Office of Management and Budget’s (OMB) 3 Information on the 2010 Census Summary File 1 is available online at <http://2010.census.gov/news /press-kits/summary-file-1.html>. Figure 1. Reproduction of the Question on Race From the 2010 Census Source: U.S. Census Bureau, 2010 Census questionnaire.
Transcript of The Asian Population: 2010 - Census · made for people of Asian descent. In 1860, the first Asian...

U.S. Department of Commerce Economics and Statistics Administration U.S. CENSUS BUREAU
The Asian Population: 20102010 Census Briefs
By Elizabeth M. Hoeffel, Sonya Rastogi,Myoung Ouk Kim,and Hasan Shahid
C2010BR-11
Issued March 2012
INTRODUCTION
According to the 2010 Census, the Asian population grew faster than any other race group in the United States between 2000 and 2010. This was observed for the population who reported Asian alone (increased 43 percent), as well as for the popu-lation who reported Asian alone or in combination with another race (increased 46 percent). The Asian population continued to be concen-trated in the West, and the Chinese population was the largest detailed Asian group.
This report provides a portrait of the Asian population in the United States and discusses that population’s distri-bution at the national level and at lower levels of geography.1 It is part of a series that analyzes population and housing data collected from the 2010 Census.
The data for this report are based on the 2010 Census Redistricting Data (Public Law 94-171) Summary File, which was the first 2010 Census data product released with data on race and Hispanic origin, including information on the Asian popu-lation, and was provided to each state for use in drawing boundaries for legislative districts.2 Data for this report also come from the 2010 Census Summary File 1, which was one of the first 2010 Census
1 This report discusses data for the 50 states and the District of Columbia, but not Puerto Rico.
2 Information on the 2010 Census Redistricting Data (Public Law 94-171) Summary File is available online at <http://2010.census.gov/2010census/data /redistricting-data.php>.
data products to provide information on selected detailed groups, such as Asian Indians, Koreans, and Filipinos.3
UNDERSTANDING RACE DATA FROM THE 2010 CENSUS
The 2010 Census used federal standards to collect and present data on race.
For the 2010 Census, the question on race was asked of individuals living in the United States (see Figure 1). An individual’s response to the race question was based upon self-identification. The U.S. Census Bureau collects information on race following the guidance of the U.S. Office of Management and Budget’s (OMB)
3 Information on the 2010 Census Summary File 1 is available online at <http://2010.census.gov/news /press-kits/summary-file-1.html>.
Figure 1.Reproduction of the Question on Race From the 2010 Census
Source: U.S. Census Bureau, 2010 Census questionnaire.
2 U.S. Census Bureau
DEFINITION OF ASIAN USED IN THE 2010 CENSUS
According to OMB, “Asian” refers to a person having origins in any of the original peoples of the Far East, Southeast Asia, or the Indian subcontinent, including, for example, Cambodia, China, India, Japan, Korea, Malaysia, Pakistan, the Philippine Islands, Thailand, and Vietnam.
The Asian population includes people who indicated their race(s) as “Asian” or reported entries such as “Asian Indian,” “Chinese,” “Filipino,” “Korean,” “Japanese,” and “Vietnamese” or provided other detailed Asian responses.
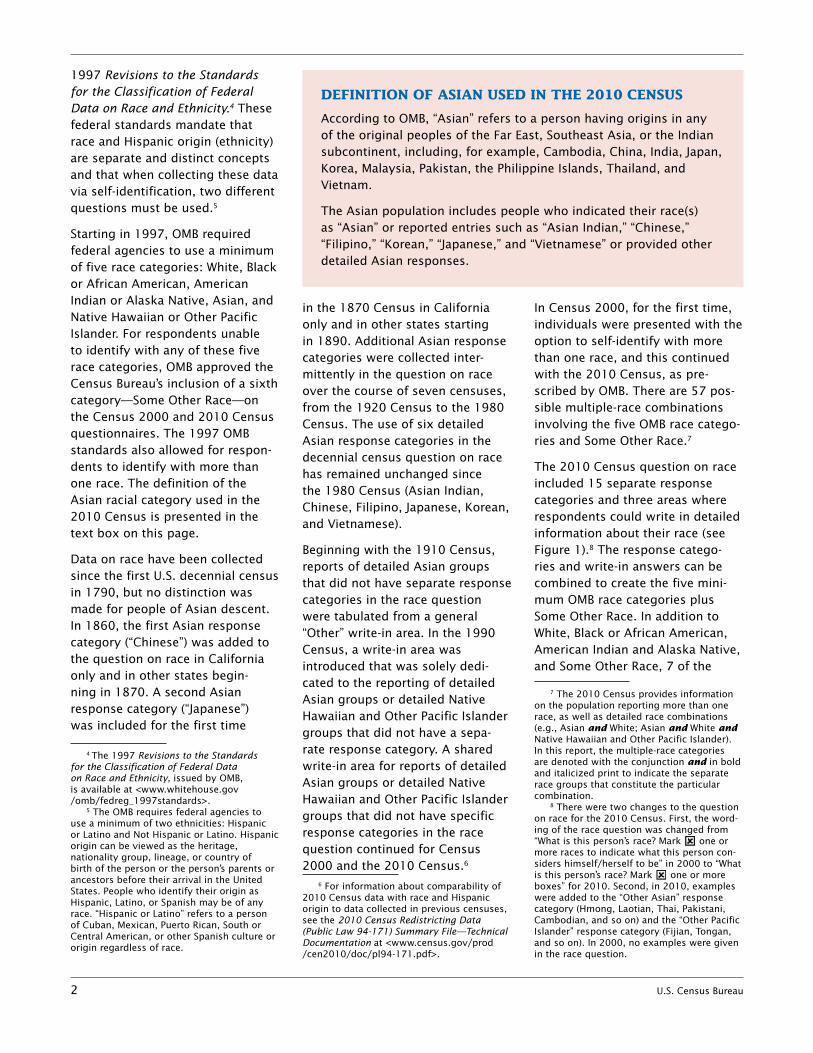
1997 Revisions to the Standards for the Classification of Federal Data on Race and Ethnicity.4 These federal standards mandate that race and Hispanic origin (ethnicity) are separate and distinct concepts and that when collecting these data via self-identification, two different questions must be used.5
Starting in 1997, OMB required federal agencies to use a minimum of five race categories: White, Black or African American, American Indian or Alaska Native, Asian, and Native Hawaiian or Other Pacific Islander. For respondents unable to identify with any of these five race categories, OMB approved the Census Bureau’s inclusion of a sixth category—Some Other Race—on the Census 2000 and 2010 Census questionnaires. The 1997 OMB standards also allowed for respon-dents to identify with more than one race. The definition of the Asian racial category used in the 2010 Census is presented in the text box on this page.
Data on race have been collected since the first U.S. decennial census in 1790, but no distinction was made for people of Asian descent. In 1860, the first Asian response category (“Chinese”) was added to the question on race in California only and in other states begin-ning in 1870. A second Asian response category (“Japanese”) was included for the first time
4 The 1997 Revisions to the Standards for the Classification of Federal Data on Race and Ethnicity, issued by OMB, is available at <www.whitehouse.gov /omb/fedreg_1997standards>.
5 The OMB requires federal agencies to use a minimum of two ethnicities: Hispanic or Latino and Not Hispanic or Latino. Hispanic origin can be viewed as the heritage, nationality group, lineage, or country of birth of the person or the person’s parents or ancestors before their arrival in the United States. People who identify their origin as Hispanic, Latino, or Spanish may be of any race. “Hispanic or Latino” refers to a person of Cuban, Mexican, Puerto Rican, South or Central American, or other Spanish culture or origin regardless of race.
in the 1870 Census in California only and in other states starting in 1890. Additional Asian response categories were collected inter-mittently in the question on race over the course of seven censuses, from the 1920 Census to the 1980 Census. The use of six detailed Asian response categories in the decennial census question on race has remained unchanged since the 1980 Census (Asian Indian, Chinese, Filipino, Japanese, Korean, and Vietnamese).
Beginning with the 1910 Census, reports of detailed Asian groups that did not have separate response categories in the race question were tabulated from a general “Other” write-in area. In the 1990 Census, a write-in area was introduced that was solely dedi-cated to the reporting of detailed Asian groups or detailed Native Hawaiian and Other Pacific Islander groups that did not have a sepa-rate response category. A shared write-in area for reports of detailed Asian groups or detailed Native Hawaiian and Other Pacific Islander groups that did not have specific response categories in the race question continued for Census 2000 and the 2010 Census.6
6 For information about comparability of 2010 Census data with race and Hispanic origin to data collected in previous censuses, see the 2010 Census Redistricting Data (Public Law 94-171) Summary File—Technical Documentation at <www.census.gov/prod /cen2010/doc/pl94-171.pdf>.
In Census 2000, for the first time, individuals were presented with the option to self-identify with more than one race, and this continued with the 2010 Census, as pre-scribed by OMB. There are 57 pos-sible multiple-race combinations involving the five OMB race catego-ries and Some Other Race.7
The 2010 Census question on race included 15 separate response categories and three areas where respondents could write in detailed information about their race (see Figure 1).8 The response catego-ries and write-in answers can be combined to create the five mini-mum OMB race categories plus Some Other Race. In addition to White, Black or African American, American Indian and Alaska Native, and Some Other Race, 7 of the
7 The 2010 Census provides information on the population reporting more than one race, as well as detailed race combinations (e.g., Asian and White; Asian and White and Native Hawaiian and Other Pacific Islander). In this report, the multiple-race categories are denoted with the conjunction and in bold and italicized print to indicate the separate race groups that constitute the particular combination.
8 There were two changes to the question on race for the 2010 Census. First, the word-ing of the race question was changed from “What is this person’s race? Mark one or more races to indicate what this person con-siders himself/herself to be” in 2000 to “What is this person’s race? Mark one or more boxes” for 2010. Second, in 2010, examples were added to the “Other Asian” response category (Hmong, Laotian, Thai, Pakistani, Cambodian, and so on) and the “Other Pacific Islander” response category (Fijian, Tongan, and so on). In 2000, no examples were given in the race question.
U.S. Census Bureau 3
15 response categories are Asian groups, and 4 are Native Hawaiian and Other Pacific Islander groups.9 The 7 Asian response categories are Asian Indian, Chinese, Filipino, Japanese, Korean, Vietnamese, and Other Asian.
For a complete explanation of the race categories used in the 2010 Census, see the 2010 Census Brief, Overview of Race and Hispanic Origin: 2010.10
RACE ALONE, RACE IN COMBINATION, AND RACE ALONE-OR-IN-COMBINATION CONCEPTS
This report presents data for the Asian population and focuses on results for three major conceptual groups.
First, people who responded to the question on race by indicating only one race are referred to as the race alone population, or the group who reported only one race. For exam-ple, respondents who reported a single detailed Asian group, such as “Asian Indian” or “Korean,” would be included in the Asian alone pop-ulation. Respondents who reported more than one detailed Asian group, such as “Asian Indian” and “Korean” would also be included in the Asian alone population. This is because the detailed groups in the example combination are part of the larger Asian race category. The Asian alone population can be viewed as the minimum number of people reporting Asian.
9 The race categories included in the census questionnaire generally reflect a social definition of race recognized in this country and are not an attempt to define race biologi-cally, anthropologically, or genetically. In addi-tion, it is recognized that the categories of the race question include race and national origin or sociocultural groups.
10 Humes, K., N. Jones, and R. Ramirez. 2011. Overview of Race and Hispanic Origin: 2010, U.S. Census Bureau, 2010 Census Briefs, C2010BR-02, available at <www .census.gov/prod/cen2010/briefs /c2010br-02.pdf>.
Second, individuals who chose more than one of the six race cat-egories are referred to as the race in combination population, or as the group who reported more than one race. For example, respondents who reported they were Asian and White or reported they were Asian and White and Native Hawaiian and Other Pacific Islander would be included in the Asian in combina-tion population. This population is also referred to as the multiple-race Asian population.
Third, the maximum number of people reporting Asian is reflected in the Asian alone-or-in- combination population. One way to define the Asian population is to combine those respondents who reported Asian alone with those who reported Asian in combination with one or more other races. The addition of these two groups creates the Asian alone-or-in- combination population. Another way to think of the Asian alone-or-in-combination population is the total number of people who reported Asian, whether or not they reported any other race(s).
Throughout the report, the dis-cussion of the Asian popula-tion includes results for each of these groups and highlights the diversity within the entire Asian population.11
THE ASIAN POPULATION: A SNAPSHOT
The 2010 Census showed that the U.S. population on April 1, 2010, was 308.7 million. Out of the total U.S. population, 14.7 million
11 As a matter of policy, the Census Bureau does not advocate the use of the alone population over the alone-or-in-combination population or vice versa. The use of the alone population in sections of this report does not imply that it is a preferred method of pre-senting or analyzing data. The same is true for sections of this report that focus on the alone-or-in-combination population. Data on race from the 2010 Census can be presented and discussed in a variety of ways.
people, or 4.8 percent, were Asian alone (see Table 1). In addition, 2.6 million people, or another 0.9 percent, reported Asian in com-bination with one or more other races.12 Together, these two groups totaled 17.3 million people. Thus, 5.6 percent of all people in the United States identified as Asian, either alone or in combination with one or more other races.
The Asian population increased more than four times faster than the total U.S. population.
The total U.S. population grew by 9.7 percent, from 281.4 million in 2000 to 308.7 million in 2010 (see Table 1). In comparison, the Asian alone population increased more than four times faster than the total U.S. population, growing by 43 percent from 10.2 million to 14.7 million.13, 14
The Asian alone-or-in-combination population experienced slightly more growth than the Asian alone population, growing by 46 per-cent from 11.9 million in 2000 to 17.3 million in 2010. In fact, the Asian population grew at a faster
12 For the purposes of this report, the terms “reported,” “identified,” and “classi-fied” are used interchangeably to refer to the response provided by respondents as well as responses assigned during the editing and imputation process.
13 Percentages shown in text generally are rounded to the nearest integer, while those shown in tables and figures are shown with decimals. All rounding is based on unrounded calculations. Thus, due to rounding, some percentages shown in tables and figures ending in “5” may round either up or down. For example, unrounded numbers of 14.49 and 14.51 would both be shown as 14.5 in a table, but would be cited in the text as 14 and 15, respectively.
14 The observed changes in the race counts between Census 2000 and the 2010 Census could be attributed to a number of factors. Demographic change since 2000, which includes births and deaths in a geo-graphic area and migration in and out of a geographic area, will have an impact on the resulting 2010 Census counts. Additionally, some changes in the race question’s word-ing and format since Census 2000 could have influenced reporting patterns in the 2010 Census.

4 U.S. Census Bureau
Table 1. Asian Population: 2000 and 2010(For information on confidentiality protection, nonsampling error, and definitions, see www.census.gov/prod/cen2010/doc/pl94-171.pdf)
Race
2000 2010 Change, 2000 to 2010
Number
Percentage of total
population Number
Percentage of total
population Number Percent
Total population . . . . . . . . . . . . . . . . . . . . . . . . 281,421,906 100 .0 308,745,538 100 .0 27,323,632 9 .7Asian alone or in combination . . . . . . . . . . . . . . . . . . . . . 11,898,828 4 .2 17,320,856 5 .6 5,422,028 45 .6 Asian alone . . . . . . . . . . . . . . . . . . . . . . . . . . . . . . . . . 10,242,998 3 .6 14,674,252 4 .8 4,431,254 43 .3 Asian in combination . . . . . . . . . . . . . . . . . . . . . . . . . . 1,655,830 0 .6 2,646,604 0 .9 990,774 59 .8 Asian; White . . . . . . . . . . . . . . . . . . . . . . . . . . . . . . . 868,395 0 .3 1,623,234 0 .5 754,839 86 .9 Asian; Some Other Race . . . . . . . . . . . . . . . . . . . . . 249,108 0 .1 234,462 0 .1 -14,646 –5 .9 Asian; Black or African American . . . . . . . . . . . . . . . 106,782 – 185,595 0 .1 78,813 73 .8 Asian; Native Hawaiian and Other Pacific Islander . . 138,802 – 165,690 0 .1 26,888 19 .4 Asian; White; Native Hawaiian and Other Pacific Islander . . . . . . . . . . . . . . . . . . . . . . . . . . . . . . . . . . 89,611 – 143,126 – 53,515 59 .7 All other combinations including Asian . . . . . . . . . . . 203,132 0 .1 294,497 0 .1 91,365 45 .0Not Asian alone or in combination . . . . . . . . . . . . . . . . . . 269,523,078 95 .8 291,424,682 94 .4 21,901,604 8 .1
– Percentage rounds to 0 .0 .
Note: In Census 2000, an error in data processing resulted in an overstatement of the Two or More Races population by about 1 million people (about 15 percent) nationally, which almost entirely affected race combinations involving Some Other Race . Therefore, data users should assess observed changes in race combinations involving Some Other Race between Census 2000 and the 2010 Census with caution . Changes in specific race combinations not involving Some Other Race, such as Asian and White or Asian and Black or African American, generally should be more comparable .
Sources: U .S . Census Bureau, Census 2000 Redistricting Data (Public Law 94-171) Summary File, Table PL1; and 2010 Census Redistricting Data (Public Law 94-171) Summary File, Table P1 .
rate than all race groups in the country.15
MULTIPLE-RACE REPORTING AMONG THE ASIAN POPULATION
About 15 percent of the Asian population reported multiple races.
Of the 17.3 million people who reported Asian, 14.7 million or 85 percent, identified as Asian alone (see Table 1). An additional 2.6 million people reported Asian in combination with one or more addi-tional races, representing about 15 percent of the Asian alone-or-in-combination population. Of the five OMB race groups, the Asian
15 Information on national-level 2010 Census redistricting data (Public Law 94-171) for race groups is available online at <http://2010.census.gov/news/press-kits /redistricting.html>.
population had the third-largest percentage reporting more than one race.16
Asians who reported multiple races grew at a faster rate than the Asian alone population.
From 2000 to 2010, the Asian multiple-race population grew by about 1 million people. The multiple-race Asian population grew at a faster rate than the Asian alone population, growing by 60 percent in size since 2000 (see Table 1).
Among Asians, the largest multiple-race combination was Asian and White.
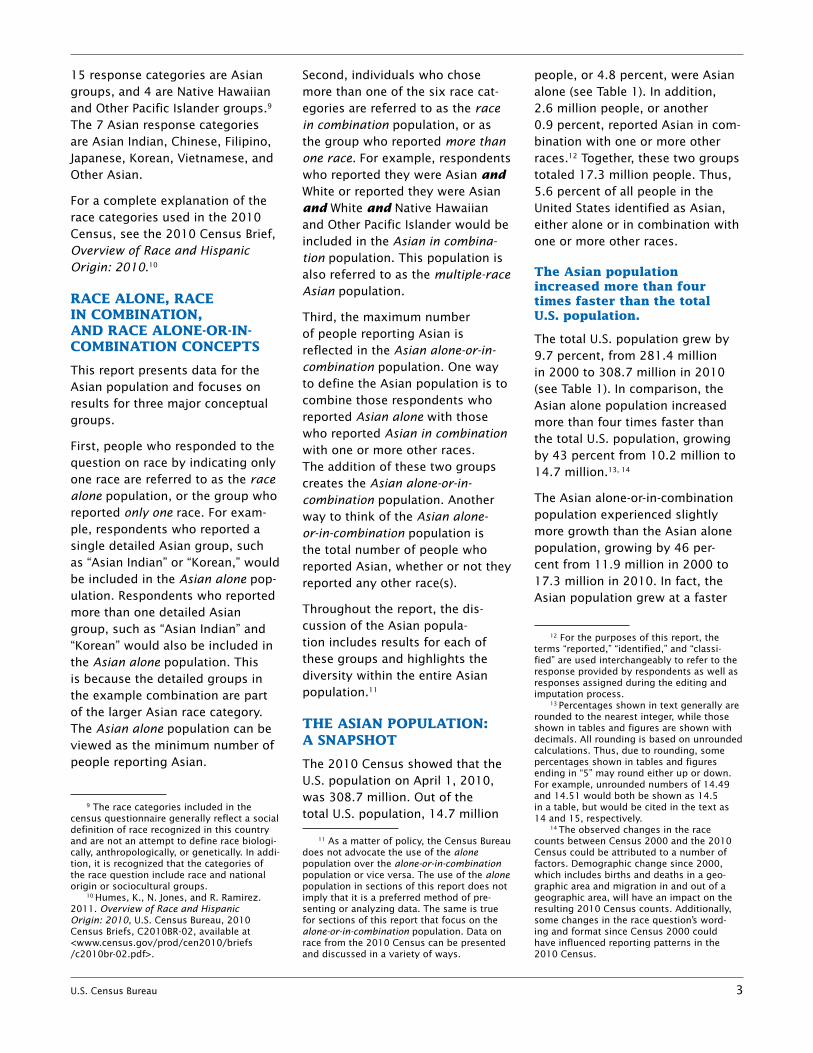
Among the 2.6 million people who reported they were Asian and one or more additional races, the majority (1.6 million or 61 per-cent) identified as Asian and White (see Figure 2). The next largest
16 Humes, K., N. Jones, and R. Ramirez. 2011. Overview of Race and Hispanic Origin: 2010, U.S. Census Bureau, 2010 Census Briefs, C2010BR-02, available at <www.census.gov/prod/cen2010/briefs /c2010br-02.pdf>.
combinations were Asian and Some Other Race (9 percent), Asian and Black (7 percent), Asian and Native Hawaiian and Other Pacific Islander (6 percent), and Asian and White and Native Hawaiian and Other Pacific Islander (5 percent).17 Together, these five combinations accounted for nearly 90 percent of all Asians who reported multiple races.
The Asian and White population contributed to most of the growth among Asians who reported multiple races.
Among people who reported their race as Asian and one or more addi-tional races, those who reported Asian and White grew by 87 per-cent, nearly doubling in size from 868,000 in 2000 to 1.6 million in 2010 (see Table 1). The Asian and White population represented the greatest increase in the multiple-race Asian population. The Asian and White population’s share of all
17 The terms “Black” and “Black or African American” are used interchangeably in this report.
U.S. Census Bureau 5
multiple-race Asians also increased substantially, from 52 percent to 61 percent (see Figure 2).
The Asian and Native Hawaiian and Other Pacific Islander population’s share of the multiple-race Asian population decreased from 8 per-cent in 2000 to 6 percent in 2010. The Asian and Black population’s share of the Asian multiple-race population increased from 6 per-cent to 7 percent. The proportion of the Asian and White and Native Hawaiian and Other Pacific Islander population remained at 5 percent.
The Asian and Some Other Race population decreased from 2000 to 2010. This decrease was likely
due to a data processing error in the Two or More Races population, which largely affected the combi-nations that included Some Other Race, overstating the Asian and Some Other Race population in 2000.18
18 In Census 2000, an error in data processing resulted in an overstatement of the Two or More Races population by about 1 million people (about 15 percent) nationally, which almost entirely affected race combina-tions involving Some Other Race. Therefore, data users should assess observed changes in race combinations involving Some Other Race between Census 2000 and the 2010 Census with caution. Changes in specific race combinations not involving Some Other Race, such as Asian and White, generally are more comparable.
THE GEOGRAPHIC DISTRIBUTION OF THE ASIAN POPULATION
The Asian population was heavily concentrated in the West.
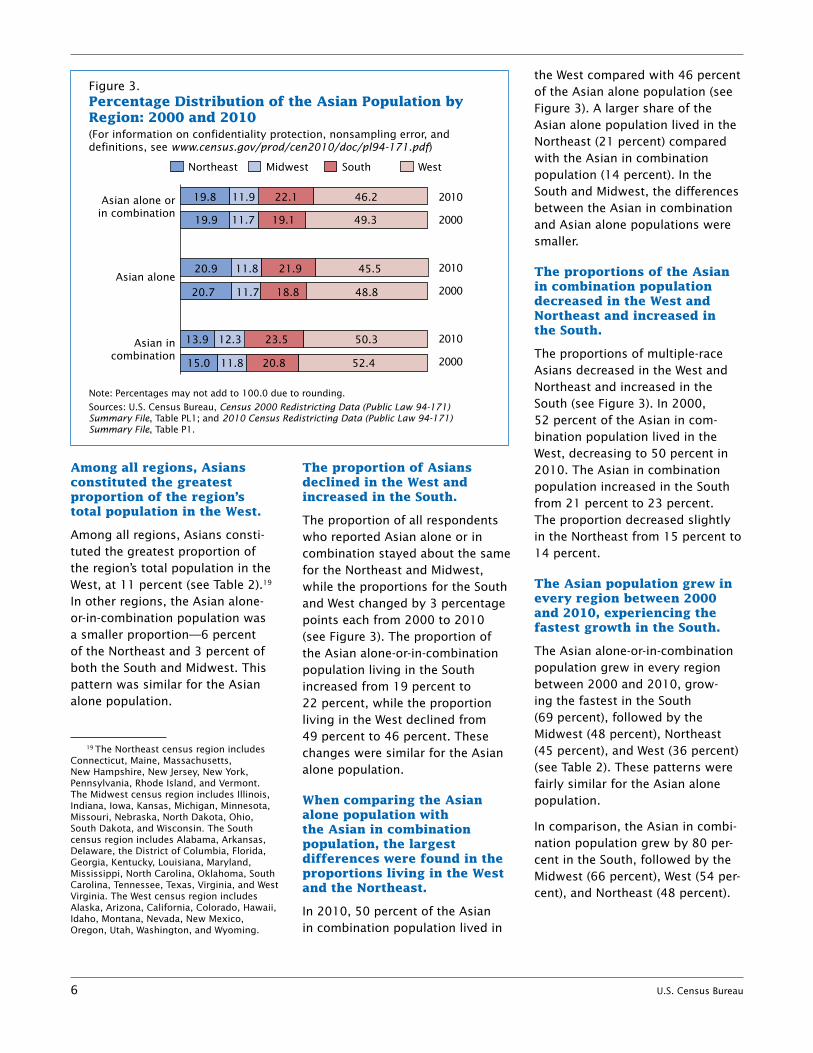
In the 2010 Census, of all respon-dents who reported Asian alone or in combination, 46 percent lived in the West (see Figure 3). An addi-tional 22 percent lived in the South, 20 percent in the Northeast, and 12 percent in the Midwest. This pattern was similar for the Asian alone population.
Figure 2.Percentage Distribution of the Asian in Combination Population: 2000 and 2010
Note: In Census 2000, an error in data processing resulted in an overstatement of the Two or More Races population by about 1 million people (about 15 percent) nationally, which almost entirely affected race combinations involving Some Other Race. Therefore, data users should assess observed changes in the Two or More Races population and race combinations involving Some Other Race between Census 2000 and the 2010 Census with caution. Changes in specific race combinations not involving Some Other Race, such as Asian and White or Asian and Black or African American, generally should be more comparable. Percentages may not add to 100.0 due to rounding.
Sources: U.S. Census Bureau, Census 2000 Redistricting Data (Public Law 94-171) Summary File, Table PL1; and 2010 Census Redistricting Data (Public Law 94-171) Summary File, Table P1.
Asian; White
Asian; Some Other Race
Asian; Native Hawaiian andOther Pacific Islander
Asian; Black or African American
Asian; White; Native Hawaiian and Other Pacific Islander
All other combinations including Asian
(For information on confidentiality protection, nonsampling error, and definitions, see www.census.gov/prod/cen2010/doc/pl94-171.pdf)
2000 2010
61.3
11.1
7.0
6.3
8.9
5.4
52.4
12.3
6.4
8.4
15.0
5.4
6 U.S. Census Bureau
Among all regions, Asians constituted the greatest proportion of the region’s total population in the West.
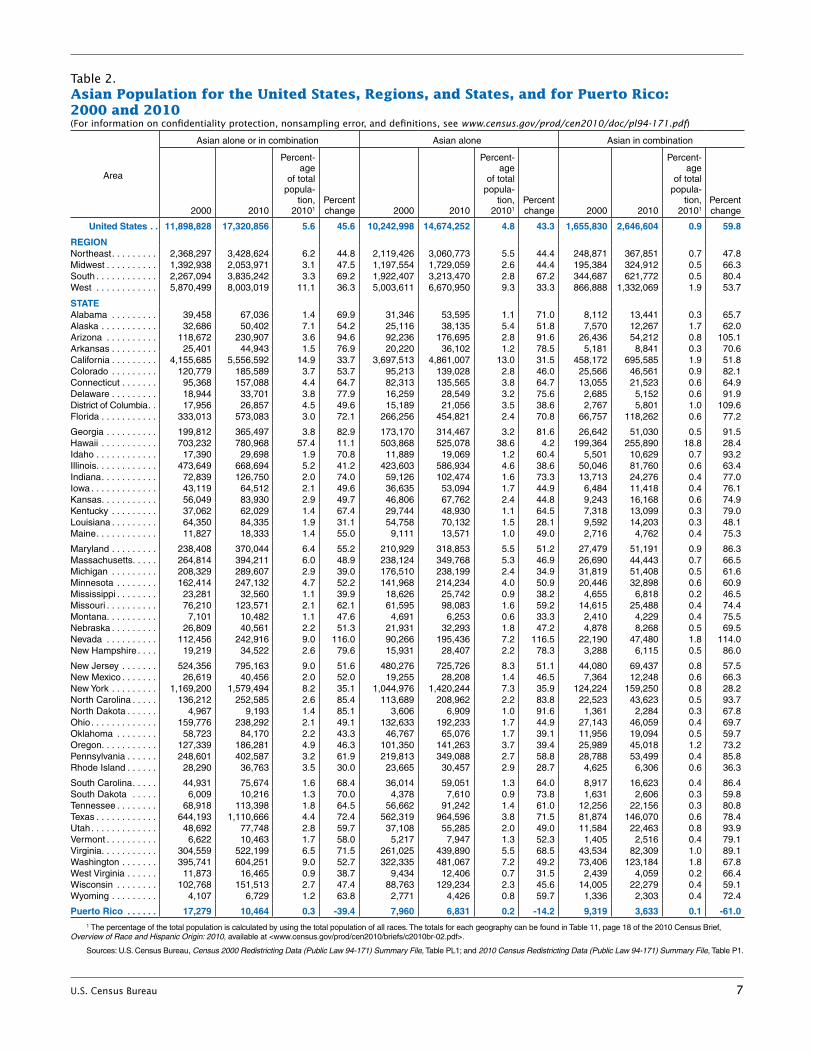
Among all regions, Asians consti-tuted the greatest proportion of the region’s total population in the West, at 11 percent (see Table 2).19 In other regions, the Asian alone-or-in-combination population was a smaller proportion—6 percent of the Northeast and 3 percent of both the South and Midwest. This pattern was similar for the Asian alone population.
19 The Northeast census region includes Connecticut, Maine, Massachusetts, New Hampshire, New Jersey, New York, Pennsylvania, Rhode Island, and Vermont. The Midwest census region includes Illinois, Indiana, Iowa, Kansas, Michigan, Minnesota, Missouri, Nebraska, North Dakota, Ohio, South Dakota, and Wisconsin. The South census region includes Alabama, Arkansas, Delaware, the District of Columbia, Florida, Georgia, Kentucky, Louisiana, Maryland, Mississippi, North Carolina, Oklahoma, South Carolina, Tennessee, Texas, Virginia, and West Virginia. The West census region includes Alaska, Arizona, California, Colorado, Hawaii, Idaho, Montana, Nevada, New Mexico, Oregon, Utah, Washington, and Wyoming.
The proportion of Asians declined in the West and increased in the South.
The proportion of all respondents who reported Asian alone or in combination stayed about the same for the Northeast and Midwest, while the proportions for the South and West changed by 3 percentage points each from 2000 to 2010 (see Figure 3). The proportion of the Asian alone-or-in-combination population living in the South increased from 19 percent to 22 percent, while the proportion living in the West declined from 49 percent to 46 percent. These changes were similar for the Asian alone population.
When comparing the Asian alone population with the Asian in combination population, the largest differences were found in the proportions living in the West and the Northeast.
In 2010, 50 percent of the Asian in combination population lived in
the West compared with 46 percent of the Asian alone population (see Figure 3). A larger share of the Asian alone population lived in the Northeast (21 percent) compared with the Asian in combination population (14 percent). In the South and Midwest, the differences between the Asian in combination and Asian alone populations were smaller.
The proportions of the Asian in combination population decreased in the West and Northeast and increased in the South.
The proportions of multiple-race Asians decreased in the West and Northeast and increased in the South (see Figure 3). In 2000, 52 percent of the Asian in com-bination population lived in the West, decreasing to 50 percent in 2010. The Asian in combination population increased in the South from 21 percent to 23 percent. The proportion decreased slightly in the Northeast from 15 percent to 14 percent.
The Asian population grew in every region between 2000 and 2010, experiencing the fastest growth in the South.
The Asian alone-or-in-combination population grew in every region between 2000 and 2010, grow-ing the fastest in the South (69 percent), followed by the Midwest (48 percent), Northeast (45 percent), and West (36 percent) (see Table 2). These patterns were fairly similar for the Asian alone population.
In comparison, the Asian in combi-nation population grew by 80 per-cent in the South, followed by the Midwest (66 percent), West (54 per-cent), and Northeast (48 percent).
Figure 3.Percentage Distribution of the Asian Population by Region: 2000 and 2010
Note: Percentages may not add to 100.0 due to rounding.
Sources: U.S. Census Bureau, Census 2000 Redistricting Data (Public Law 94-171) Summary File, Table PL1; and 2010 Census Redistricting Data (Public Law 94-171) Summary File, Table P1.
Northeast Midwest South West
(For information on confidentiality protection, nonsampling error, and definitions, see www.census.gov/prod/cen2010/doc/pl94-171.pdf)
Asian incombination
Asian alone
Asian alone orin combination
18.3
20.9
20.7 11.7 48.818.8
11.8 45.521.9
19.8
19.9 11.7 49.319.1
11.9 46.222.1 2010
2000
2010
2000
2010
2000
18.4
13.9 12.3 50.323.5
11.815.0 52.420.8
U.S. Census Bureau 7
Table 2. Asian Population for the United States, Regions, and States, and for Puerto Rico: 2000 and 2010(For information on confidentiality protection, nonsampling error, and definitions, see www.census.gov/prod/cen2010/doc/pl94-171.pdf)
Area
Asian alone or in combination Asian alone Asian in combination
2000 2010
Percent-age
of total popula-
tion, 20101
Percent change 2000 2010
Percent-age
of total popula-
tion, 20101
Percent change 2000 2010
Percent-age
of total popula-
tion, 20101
Percent change
United States . . 11,898,828 17,320,856 5 .6 45 .6 10,242,998 14,674,252 4 .8 43 .3 1,655,830 2,646,604 0 .9 59 .8
REGIONNortheast . . . . . . . . . 2,368,297 3,428,624 6 .2 44 .8 2,119,426 3,060,773 5 .5 44 .4 248,871 367,851 0 .7 47 .8Midwest . . . . . . . . . . 1,392,938 2,053,971 3 .1 47 .5 1,197,554 1,729,059 2 .6 44 .4 195,384 324,912 0 .5 66 .3South . . . . . . . . . . . . 2,267,094 3,835,242 3 .3 69 .2 1,922,407 3,213,470 2 .8 67 .2 344,687 621,772 0 .5 80 .4West . . . . . . . . . . . . 5,870,499 8,003,019 11 .1 36 .3 5,003,611 6,670,950 9 .3 33 .3 866,888 1,332,069 1 .9 53 .7
STATEAlabama . . . . . . . . . 39,458 67,036 1 .4 69 .9 31,346 53,595 1 .1 71 .0 8,112 13,441 0 .3 65 .7Alaska . . . . . . . . . . . 32,686 50,402 7 .1 54 .2 25,116 38,135 5 .4 51 .8 7,570 12,267 1 .7 62 .0Arizona . . . . . . . . . . 118,672 230,907 3 .6 94 .6 92,236 176,695 2 .8 91 .6 26,436 54,212 0 .8 105 .1Arkansas . . . . . . . . . 25,401 44,943 1 .5 76 .9 20,220 36,102 1 .2 78 .5 5,181 8,841 0 .3 70 .6California . . . . . . . . . 4,155,685 5,556,592 14 .9 33 .7 3,697,513 4,861,007 13 .0 31 .5 458,172 695,585 1 .9 51 .8Colorado . . . . . . . . . 120,779 185,589 3 .7 53 .7 95,213 139,028 2 .8 46 .0 25,566 46,561 0 .9 82 .1Connecticut . . . . . . . 95,368 157,088 4 .4 64 .7 82,313 135,565 3 .8 64 .7 13,055 21,523 0 .6 64 .9Delaware . . . . . . . . . 18,944 33,701 3 .8 77 .9 16,259 28,549 3 .2 75 .6 2,685 5,152 0 .6 91 .9District of Columbia . . 17,956 26,857 4 .5 49 .6 15,189 21,056 3 .5 38 .6 2,767 5,801 1 .0 109 .6Florida . . . . . . . . . . . 333,013 573,083 3 .0 72 .1 266,256 454,821 2 .4 70 .8 66,757 118,262 0 .6 77 .2
Georgia . . . . . . . . . . 199,812 365,497 3 .8 82 .9 173,170 314,467 3 .2 81 .6 26,642 51,030 0 .5 91 .5Hawaii . . . . . . . . . . . 703,232 780,968 57 .4 11 .1 503,868 525,078 38 .6 4 .2 199,364 255,890 18 .8 28 .4Idaho . . . . . . . . . . . . 17,390 29,698 1 .9 70 .8 11,889 19,069 1 .2 60 .4 5,501 10,629 0 .7 93 .2Illinois . . . . . . . . . . . . 473,649 668,694 5 .2 41 .2 423,603 586,934 4 .6 38 .6 50,046 81,760 0 .6 63 .4Indiana . . . . . . . . . . . 72,839 126,750 2 .0 74 .0 59,126 102,474 1 .6 73 .3 13,713 24,276 0 .4 77 .0Iowa . . . . . . . . . . . . . 43,119 64,512 2 .1 49 .6 36,635 53,094 1 .7 44 .9 6,484 11,418 0 .4 76 .1Kansas . . . . . . . . . . . 56,049 83,930 2 .9 49 .7 46,806 67,762 2 .4 44 .8 9,243 16,168 0 .6 74 .9Kentucky . . . . . . . . . 37,062 62,029 1 .4 67 .4 29,744 48,930 1 .1 64 .5 7,318 13,099 0 .3 79 .0Louisiana . . . . . . . . . 64,350 84,335 1 .9 31 .1 54,758 70,132 1 .5 28 .1 9,592 14,203 0 .3 48 .1Maine . . . . . . . . . . . . 11,827 18,333 1 .4 55 .0 9,111 13,571 1 .0 49 .0 2,716 4,762 0 .4 75 .3
Maryland . . . . . . . . . 238,408 370,044 6 .4 55 .2 210,929 318,853 5 .5 51 .2 27,479 51,191 0 .9 86 .3Massachusetts . . . . . 264,814 394,211 6 .0 48 .9 238,124 349,768 5 .3 46 .9 26,690 44,443 0 .7 66 .5Michigan . . . . . . . . . 208,329 289,607 2 .9 39 .0 176,510 238,199 2 .4 34 .9 31,819 51,408 0 .5 61 .6Minnesota . . . . . . . . 162,414 247,132 4 .7 52 .2 141,968 214,234 4 .0 50 .9 20,446 32,898 0 .6 60 .9Mississippi . . . . . . . . 23,281 32,560 1 .1 39 .9 18,626 25,742 0 .9 38 .2 4,655 6,818 0 .2 46 .5Missouri . . . . . . . . . . 76,210 123,571 2 .1 62 .1 61,595 98,083 1 .6 59 .2 14,615 25,488 0 .4 74 .4Montana . . . . . . . . . . 7,101 10,482 1 .1 47 .6 4,691 6,253 0 .6 33 .3 2,410 4,229 0 .4 75 .5Nebraska . . . . . . . . . 26,809 40,561 2 .2 51 .3 21,931 32,293 1 .8 47 .2 4,878 8,268 0 .5 69 .5Nevada . . . . . . . . . . 112,456 242,916 9 .0 116 .0 90,266 195,436 7 .2 116 .5 22,190 47,480 1 .8 114 .0New Hampshire . . . . 19,219 34,522 2 .6 79 .6 15,931 28,407 2 .2 78 .3 3,288 6,115 0 .5 86 .0
New Jersey . . . . . . . 524,356 795,163 9 .0 51 .6 480,276 725,726 8 .3 51 .1 44,080 69,437 0 .8 57 .5New Mexico . . . . . . . 26,619 40,456 2 .0 52 .0 19,255 28,208 1 .4 46 .5 7,364 12,248 0 .6 66 .3New York . . . . . . . . . 1,169,200 1,579,494 8 .2 35 .1 1,044,976 1,420,244 7 .3 35 .9 124,224 159,250 0 .8 28 .2North Carolina . . . . . 136,212 252,585 2 .6 85 .4 113,689 208,962 2 .2 83 .8 22,523 43,623 0 .5 93 .7North Dakota . . . . . . 4,967 9,193 1 .4 85 .1 3,606 6,909 1 .0 91 .6 1,361 2,284 0 .3 67 .8Ohio . . . . . . . . . . . . . 159,776 238,292 2 .1 49 .1 132,633 192,233 1 .7 44 .9 27,143 46,059 0 .4 69 .7Oklahoma . . . . . . . . 58,723 84,170 2 .2 43 .3 46,767 65,076 1 .7 39 .1 11,956 19,094 0 .5 59 .7Oregon . . . . . . . . . . . 127,339 186,281 4 .9 46 .3 101,350 141,263 3 .7 39 .4 25,989 45,018 1 .2 73 .2Pennsylvania . . . . . . 248,601 402,587 3 .2 61 .9 219,813 349,088 2 .7 58 .8 28,788 53,499 0 .4 85 .8Rhode Island . . . . . . 28,290 36,763 3 .5 30 .0 23,665 30,457 2 .9 28 .7 4,625 6,306 0 .6 36 .3
South Carolina . . . . . 44,931 75,674 1 .6 68 .4 36,014 59,051 1 .3 64 .0 8,917 16,623 0 .4 86 .4South Dakota . . . . . 6,009 10,216 1 .3 70 .0 4,378 7,610 0 .9 73 .8 1,631 2,606 0 .3 59 .8Tennessee . . . . . . . . 68,918 113,398 1 .8 64 .5 56,662 91,242 1 .4 61 .0 12,256 22,156 0 .3 80 .8Texas . . . . . . . . . . . . 644,193 1,110,666 4 .4 72 .4 562,319 964,596 3 .8 71 .5 81,874 146,070 0 .6 78 .4Utah . . . . . . . . . . . . . 48,692 77,748 2 .8 59 .7 37,108 55,285 2 .0 49 .0 11,584 22,463 0 .8 93 .9Vermont . . . . . . . . . . 6,622 10,463 1 .7 58 .0 5,217 7,947 1 .3 52 .3 1,405 2,516 0 .4 79 .1Virginia . . . . . . . . . . . 304,559 522,199 6 .5 71 .5 261,025 439,890 5 .5 68 .5 43,534 82,309 1 .0 89 .1Washington . . . . . . . 395,741 604,251 9 .0 52 .7 322,335 481,067 7 .2 49 .2 73,406 123,184 1 .8 67 .8West Virginia . . . . . . 11,873 16,465 0 .9 38 .7 9,434 12,406 0 .7 31 .5 2,439 4,059 0 .2 66 .4Wisconsin . . . . . . . . 102,768 151,513 2 .7 47 .4 88,763 129,234 2 .3 45 .6 14,005 22,279 0 .4 59 .1Wyoming . . . . . . . . . 4,107 6,729 1 .2 63 .8 2,771 4,426 0 .8 59 .7 1,336 2,303 0 .4 72 .4
Puerto Rico . . . . . . 17,279 10,464 0 .3 -39 .4 7,960 6,831 0 .2 -14 .2 9,319 3,633 0 .1 -61 .01 The percentage of the total population is calculated by using the total population of all races . The totals for each geography can be found in Table 11, page 18 of the 2010 Census Brief,
Overview of Race and Hispanic Origin: 2010, available at <www .census .gov/prod/cen2010/briefs/c2010br-02 .pdf> .
Sources: U .S . Census Bureau, Census 2000 Redistricting Data (Public Law 94-171) Summary File, Table PL1; and 2010 Census Redistricting Data (Public Law 94-171) Summary File, Table P1 .
8 U.S. Census Bureau
Nearly three-fourths of all Asians lived in ten states.
The ten states with the largest Asian alone-or-in-combination populations in 2010 were California (5.6 million), New York (1.6 million), Texas (1.1 million), New Jersey (0.8 million), Hawaii (0.8 million), Illinois (0.7 million), Washington (0.6 million), Florida (0.6 million), Virginia (0.5 million), and Pennsylvania (0.4 million) (see Table 2). Together, these ten states represented nearly three-fourths of the entire Asian population in the United States.
Among these states, the Asian alone-or-in-combination population experienced substantial growth in six states between 2000 and 2010, growing by 72 percent in Texas and Florida, 71 percent in Virginia, 62 percent in Pennsylvania, 53 percent in Washington, and 52 percent in New Jersey. Out of the ten states, the Asian alone-or-in-combination population grew the least in Hawaii (11 percent).
Out of the ten states above, the first nine also had the largest Asian alone populations. The state with the tenth-largest Asian alone population was Massachusetts (0.3 million). In a similar fashion to the Asian alone-or-in-combination population, the Asian alone popu-lation experienced considerable growth in Texas, Florida, Virginia, Pennsylvania, Washington, and New Jersey and relatively slower growth in Hawaii.
The Asian population represented over 50 percent of the total population in Hawaii and over 8 percent of the total population in five other states.
The states with the highest proportions of the Asian alone-or-in- combination population
were located in the West and the Northeast. The Asian alone-or-in-combination population rep-resented 57 percent of the total population in Hawaii (see Table 2). California had the next highest proportion at 15 percent, followed by New Jersey (9 percent), Nevada (9 percent), Washington (9 percent), and New York (8 percent). These same six states had the highest proportions of the Asian alone population.
The Asian alone-or-in-combination population represented less than 2 percent of the total popula-tion in 15 states. Out of these 15 states, 8 were in the South—West Virginia, Mississippi, Alabama, Kentucky, Arkansas, South Carolina, Tennessee, and Louisiana. Three states were in the West—Montana, Wyoming, and Idaho. Two states were in the Midwest—South Dakota and North Dakota—and two states were in the Northeast—Maine and Vermont.
The Asian alone population rep-resented less than 2 percent of the total population in the same states as the Asian alone-or-in- combination population, plus seven additional states—New Mexico, Indiana, Missouri, Ohio, Oklahoma, Iowa, and Nebraska.
California and Texas had the largest numeric growth of Asians.
The Asian alone-or-in-combination population grew by 5.4 million people over the decade. California had the largest numeric growth of people reporting Asian alone-or-in-combination (1.4 million), increasing from 4.2 million in 2000 to 5.6 million in 2010. Texas had the next largest numeric growth (466,000), increasing from 644,000 in 2000 to 1.1 million in 2010. This was followed by New York, which
grew by 410,000, increasing from 1.2 million to 1.6 million. The Asian alone population showed a similar pattern of numeric growth.
The Asian population grew in every state between 2000 and 2010.
The Asian alone-or-in-combina-tion population grew by at least 30 percent in all states except for Hawaii (11 percent increase) (see Table 2). The top five states that experienced the most growth were Nevada (116 per-cent), Arizona (95 percent), North Carolina (85 percent), North Dakota (85 percent), and Georgia (83 per-cent). These same five states also experienced the most growth in the Asian alone population.
Reflecting percentages similar to the Asian alone-or-in-combination population and the Asian alone population, Nevada (114 per-cent), Arizona (105 percent), and North Carolina (94 percent) were among the top five states that experienced the most growth in the Asian in combination popu-lation. In contrast to the Asian alone-or-in- combination population and the Asian alone population, Utah (94 percent) was among the top five states that experienced the most growth in the Asian in combination population. The Asian in combination population also grew considerably in the District of Columbia (110 percent).20
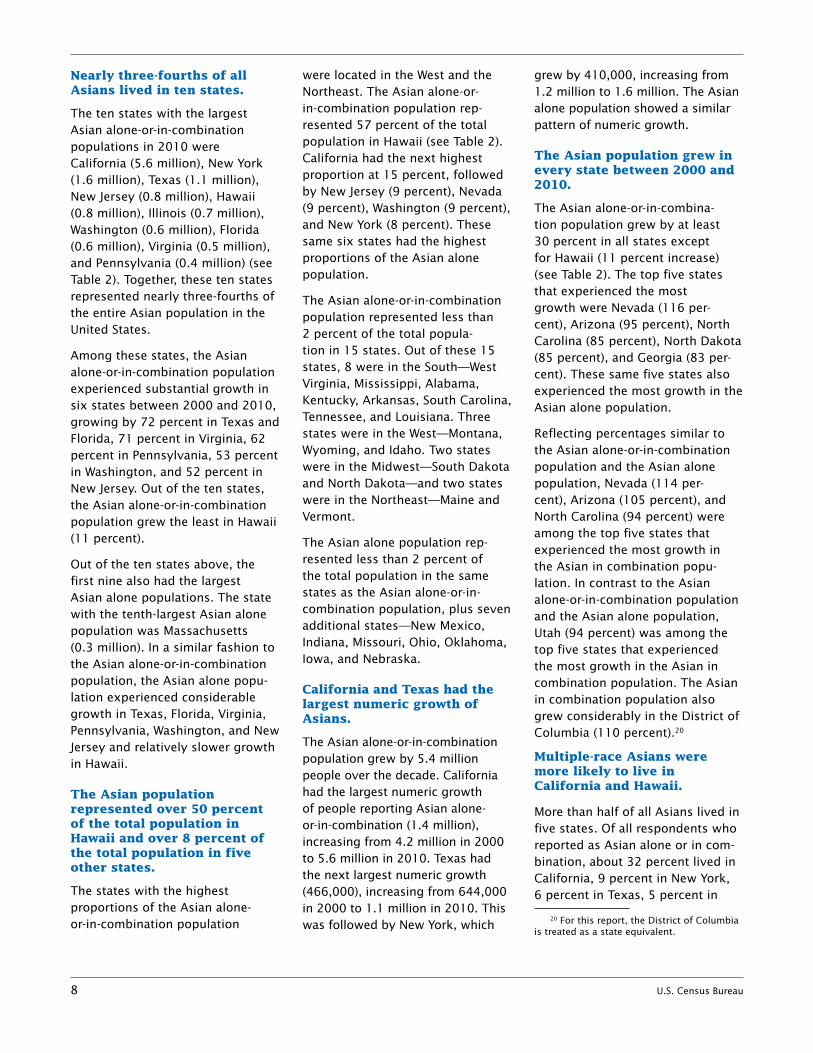
Multiple-race Asians were more likely to live in California and Hawaii.
More than half of all Asians lived in five states. Of all respondents who reported as Asian alone or in com-bination, about 32 percent lived in California, 9 percent in New York, 6 percent in Texas, 5 percent in
20 For this report, the District of Columbia is treated as a state equivalent.
U.S. Census Bureau 9
New Jersey, and 5 percent in Hawaii (see Figure 4).
This pattern was similar for the Asian alone population for California (33 percent), New York (10 percent), Texas (7 percent), and New Jersey (5 percent). However, the state with the next highest pro-portion of the Asian alone popula-tion was Illinois (4 percent).
The pattern was slightly different for respondents who identified as Asian in combination and one or more additional races. Among multiple-race Asians, 26 percent lived in California, 10 percent in Hawaii, 6 percent each lived in New York and Texas, and 5 percent in Washington.
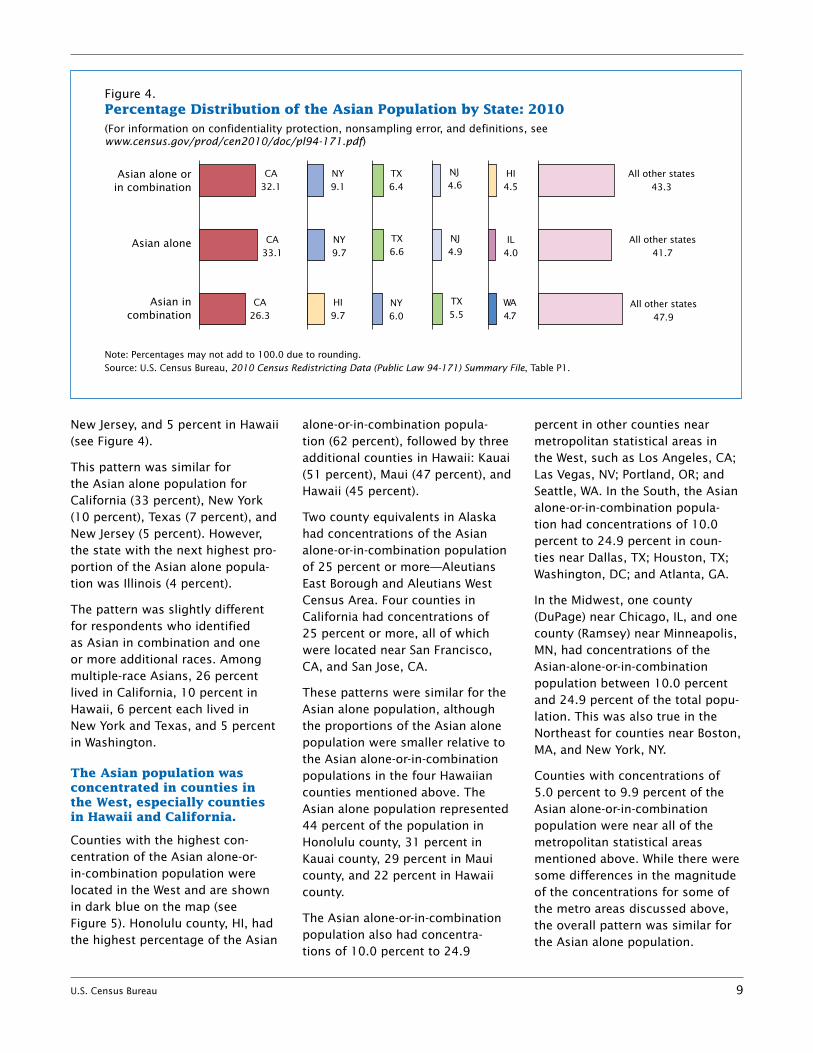
The Asian population was concentrated in counties in the West, especially counties in Hawaii and California.
Counties with the highest con-centration of the Asian alone-or-in-combination population were located in the West and are shown in dark blue on the map (see Figure 5). Honolulu county, HI, had the highest percentage of the Asian
alone-or-in-combination popula-tion (62 percent), followed by three additional counties in Hawaii: Kauai (51 percent), Maui (47 percent), and Hawaii (45 percent).
Two county equivalents in Alaska had concentrations of the Asian alone-or-in-combination population of 25 percent or more—Aleutians East Borough and Aleutians West Census Area. Four counties in California had concentrations of 25 percent or more, all of which were located near San Francisco, CA, and San Jose, CA.
These patterns were similar for the Asian alone population, although the proportions of the Asian alone population were smaller relative to the Asian alone-or-in-combination populations in the four Hawaiian counties mentioned above. The Asian alone population represented 44 percent of the population in Honolulu county, 31 percent in Kauai county, 29 percent in Maui county, and 22 percent in Hawaii county.
The Asian alone-or-in-combination population also had concentra-tions of 10.0 percent to 24.9
percent in other counties near metropolitan statistical areas in the West, such as Los Angeles, CA; Las Vegas, NV; Portland, OR; and Seattle, WA. In the South, the Asian alone-or-in-combination popula-tion had concentrations of 10.0 percent to 24.9 percent in coun-ties near Dallas, TX; Houston, TX; Washington, DC; and Atlanta, GA.
In the Midwest, one county (DuPage) near Chicago, IL, and one county (Ramsey) near Minneapolis, MN, had concentrations of the Asian-alone-or-in-combination population between 10.0 percent and 24.9 percent of the total popu-lation. This was also true in the Northeast for counties near Boston, MA, and New York, NY.
Counties with concentrations of 5.0 percent to 9.9 percent of the Asian alone-or-in-combination population were near all of the metropolitan statistical areas mentioned above. While there were some differences in the magnitude of the concentrations for some of the metro areas discussed above, the overall pattern was similar for the Asian alone population.
Figure 4.Percentage Distribution of the Asian Population by State: 2010
Note: Percentages may not add to 100.0 due to rounding.Source: U.S. Census Bureau, 2010 Census Redistricting Data (Public Law 94-171) Summary File, Table P1.
(For information on confidentiality protection, nonsampling error, and definitions, see www.census.gov/prod/cen2010/doc/pl94-171.pdf)
CA26.3
HI9.7
NY6.0
TX5.5
WA4.7
CA32.1
CA33.1
NY9.7
TX6.6
NJ4.9
IL4.0
NY9.1
TX6.4
HI4.5
NJ4.6
All other states43.3
All other states41.7
All other states47.9
CA13.9
CA12.4
Asian alone or in combination
Asian alone
Asian in combination

10 U.S. Census Bureau
Source: U.S. Census Bureau, 2010 Census Redistricting Data (Public Law 94-171) Summary File, Table P1.
Alone
(For information on confidentiality protection, nonsampling error, and definitions, seewww.census.gov/prod/cen2010/doc/pl94-171.pdf)
Alone or in Combination
Percent 25.0 or more 10.0 to 24.9 5.0 to 9.9 1.0 to 4.9 Less than 1.0
Percent 25.0 or more 10.0 to 24.9 5.0 to 9.9 1.0 to 4.9 Less than 1.0
U.S. percent 4.8
U.S. percent 5.6
Figure 5.Asian as a Percentage of County Population: 2010
U.S. Census Bureau 11
Percent change
200.0 or more100.0 to 199.950.0 to 99.90.0 to 49.9Less than 0.0
Not comparable
Percent change
200.0 or more100.0 to 199.950.0 to 99.90.0 to 49.9Less than 0.0
Not comparable
U.S. change 45.6
U.S. change 43.3
Fewer than 1,000Asian alone
Fewer than 1,000 Asianalone or in combination
Sources: U.S. Census Bureau, Census 2000 Redistricting Data (Public Law 94-171) Summary File, Table PL1; and 2010 Census Redistricting Data (Public Law 94-171) Summary File, Table P1.
Alone
(Counties with an Asian population of at least 1,000 in 2010 are included in the maps.For information on confidentiality protection, nonsampling error, and definitions, seewww.census.gov/prod/cen2010/doc/pl94-171.pdf)
Alone or in Combination
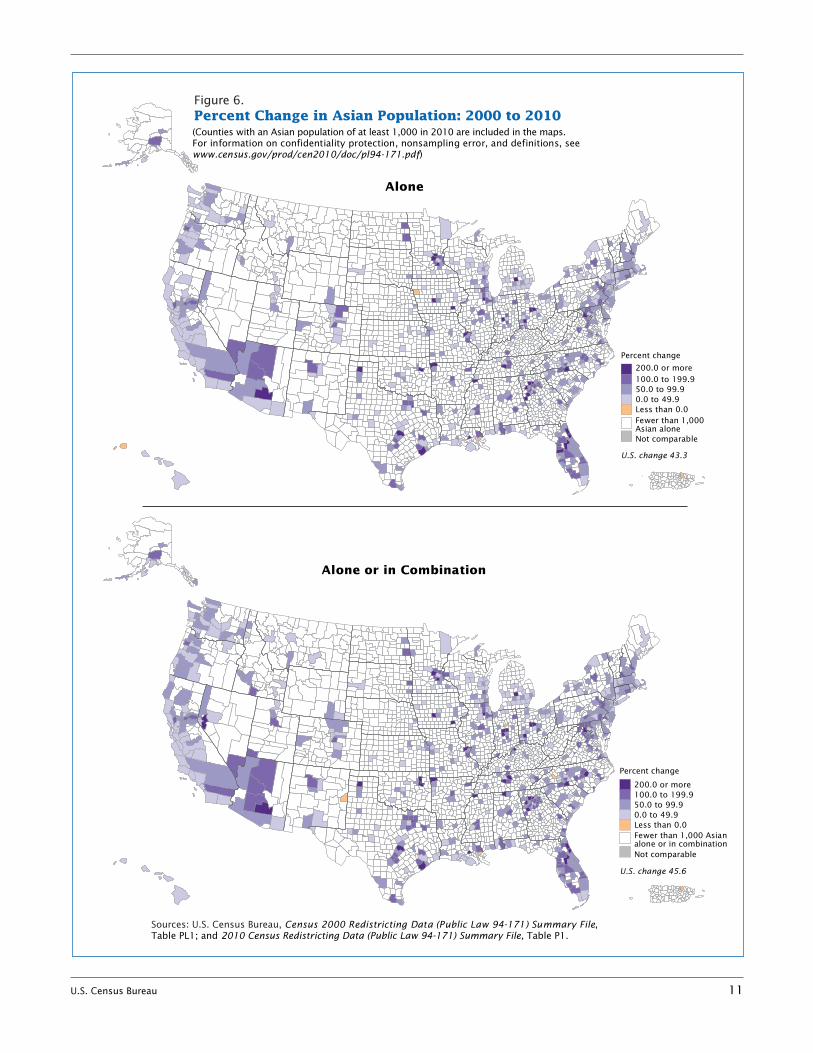
Figure 6.Percent Change in Asian Population: 2000 to 2010
12 U.S. Census Bureau
Many counties in western states, counties in states along the north-eastern seaboard, and counties around several metro areas had Asian alone-or-in-combination populations of at least 1 percent of the total population. This popula-tion made up less than 1 percent in the majority of counties across the United States (66 percent of all counties). This was more pro-nounced for the Asian alone popu-lation, which accounted for less than 1 percent of the total popula-tion in 75 percent of all counties.
Counties that experienced the fastest growth in the Asian population were primarily located in the South and the Midwest.
Of the 733 counties that had an Asian alone-or-in-combi-nation population of 1,000 or more, 38 counties experienced 200.0 percent growth or more, 116 counties experienced 100.0 percent to 199.9 percent growth, 299 counties experienced 50.0 percent to 99.9 percent growth,
275 counties experienced up to a 50 percent increase, and in 4 counties the Asian alone-or-in-combination population declined (see Figure 6).21
Throughout the South and Midwest, there were several counties where the Asian alone-or-in-combination population grew 200 percent or more. For example, this was seen in counties in Texas, Florida, and Georgia in the South and counties in states in the Midwest such as Minnesota, Ohio, Iowa, and Indiana. Two counties in the West, in Arizona and Nevada, experienced growth over 200 percent. There were no counties in the Northeast that experienced 200 percent growth or more in the Asian alone-or-in-combination population. This pattern was similar for the Asian alone population.
The Asian alone-or-in-combination population grew by 100.0 percent to 199.9 percent in a number of counties in western and northeast-ern states. For example, the Asian
21 Of the 733 counties, one county (Broomfield, Colorado) existed in 2010 but not in 2000.
alone-or-in-combination popula-tion grew between 100.0 percent and 199.9 percent in counties in Oregon, California, Nevada, and Arizona. Counties in states along the eastern seaboard experienced considerable growth. In the South, counties in Florida also stand out as having experienced substantial growth in the Asian alone-or-in-combination population. There were also pockets of substantial growth in other southern states, such as counties around Atlanta, GA, and counties near Houston, TX, and Dallas, TX. There were also pockets of growth in counties in midwestern states, such as near Minneapolis, MN, and Chicago, IL. These patterns were similar for the Asian alone population.
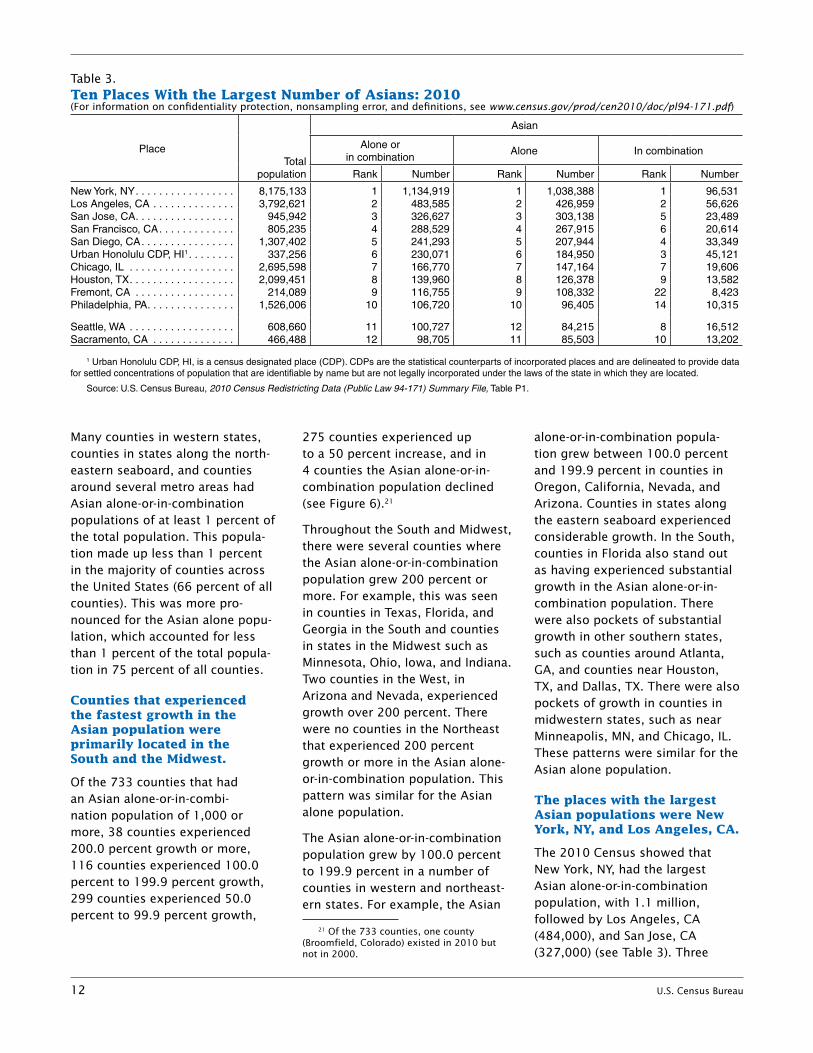
The places with the largest Asian populations were New York, NY, and Los Angeles, CA.
The 2010 Census showed that New York, NY, had the largest Asian alone-or-in-combination population, with 1.1 million, followed by Los Angeles, CA (484,000), and San Jose, CA (327,000) (see Table 3). Three
Table 3. Ten Places With the Largest Number of Asians: 2010(For information on confidentiality protection, nonsampling error, and definitions, see www.census.gov/prod/cen2010/doc/pl94-171.pdf)
PlaceTotal
population
Asian
Alone or in combination
Alone In combination
Rank Number Rank Number Rank Number
New York, NY . . . . . . . . . . . . . . . . . 8,175,133 1 1,134,919 1 1,038,388 1 96,531Los Angeles, CA . . . . . . . . . . . . . . 3,792,621 2 483,585 2 426,959 2 56,626San Jose, CA . . . . . . . . . . . . . . . . . 945,942 3 326,627 3 303,138 5 23,489San Francisco, CA . . . . . . . . . . . . . 805,235 4 288,529 4 267,915 6 20,614San Diego, CA . . . . . . . . . . . . . . . . 1,307,402 5 241,293 5 207,944 4 33,349Urban Honolulu CDP, HI1 . . . . . . . . 337,256 6 230,071 6 184,950 3 45,121Chicago, IL . . . . . . . . . . . . . . . . . . 2,695,598 7 166,770 7 147,164 7 19,606Houston, TX . . . . . . . . . . . . . . . . . . 2,099,451 8 139,960 8 126,378 9 13,582Fremont, CA . . . . . . . . . . . . . . . . . 214,089 9 116,755 9 108,332 22 8,423Philadelphia, PA . . . . . . . . . . . . . . . 1,526,006 10 106,720 10 96,405 14 10,315
Seattle, WA . . . . . . . . . . . . . . . . . . 608,660 11 100,727 12 84,215 8 16,512Sacramento, CA . . . . . . . . . . . . . . 466,488 12 98,705 11 85,503 10 13,202
1 Urban Honolulu CDP, HI, is a census designated place (CDP) CDPs are the statistical counterparts of incorporated places and are delineated to provide data .for settled concentrations of population that are identifiable by name but are not legally incorporated under the laws of the state in which they are located .
Source: U S Census Bureau, . . 2010 Census Redistricting Data (Public Law 94-171) Summary File, Table P1 .
U.S. Census Bureau 13
other places—San Francisco, CA; San Diego, CA; and Urban Honolulu CDP, HI—had Asian alone-or-in-combination populations of over 200,000 people.22
Six of the ten places with the larg-est Asian alone-or-in-combination populations—Los Angeles, CA; San Jose, CA; San Francisco, CA; San Diego, CA; Urban Honolulu CDP, HI; and Fremont, CA were located in the West, and of these six, five were located in California. This ranking was identical for the Asian alone population.
New York, NY (97,000), and Los Angeles, CA (57,000), also had the largest Asian in combination populations, followed by Urban Honolulu CDP, HI (45,000), and San Diego, CA (33,000). Of the ten
22 Census designated places (CDPs) are the statistical counterparts of incorporated places and are delineated to provide data for settled concentrations of population that are identifi-able by name but are not legally incorporated under the laws of the state in which they are located.
places that had the largest Asian alone-or-in-combination and Asian alone populations, eight also had the largest Asian in combination populations. The two places out of the top ten that had the larg-est Asian in combination popula-tions but were not within the top ten ranking for the Asian alone and Asian alone-or-in-combination populations were Seattle, WA, and Sacramento, CA.
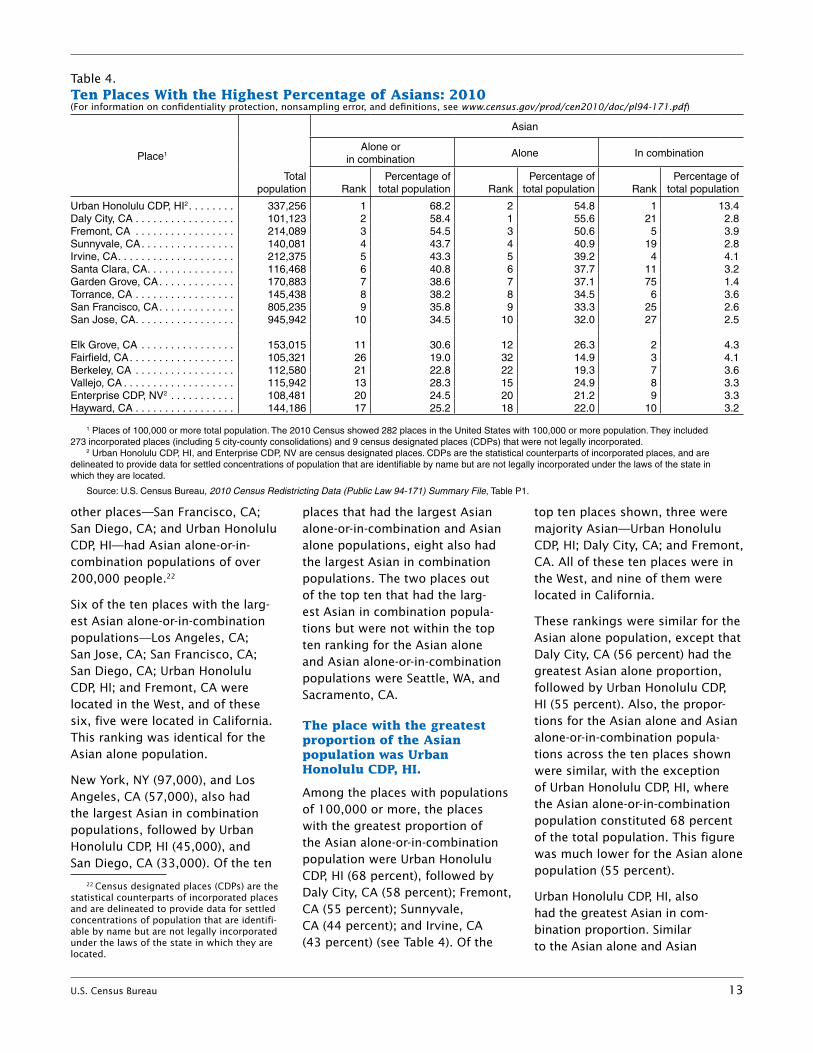
The place with the greatest proportion of the Asian population was Urban Honolulu CDP, HI.
Among the places with populations of 100,000 or more, the places with the greatest proportion of the Asian alone-or-in-combination population were Urban Honolulu CDP, HI (68 percent), followed by Daly City, CA (58 percent); Fremont, CA (55 percent); Sunnyvale, CA (44 percent); and Irvine, CA (43 percent) (see Table 4). Of the
top ten places shown, three were majority Asian—Urban Honolulu CDP, HI; Daly City, CA; and Fremont, CA. All of these ten places were in the West, and nine of them were located in California.
These rankings were similar for the Asian alone population, except that Daly City, CA (56 percent) had the greatest Asian alone proportion, followed by Urban Honolulu CDP, HI (55 percent). Also, the propor-tions for the Asian alone and Asian alone-or-in-combination popula-tions across the ten places shown were similar, with the exception of Urban Honolulu CDP, HI, where the Asian alone-or-in-combination population constituted 68 percent of the total population. This figure was much lower for the Asian alone population (55 percent).
Urban Honolulu CDP, HI, also had the greatest Asian in com-bination proportion. Similar to the Asian alone and Asian
Table 4. Ten Places With the Highest Percentage of Asians: 2010(For information on confidentiality protection, nonsampling error, and definitions, see www.census.gov/prod/cen2010/doc/pl94-171.pdf)
Place1
Total population
Asian
Alone or in combination
Alone In combination
RankPercentage of
total population RankPercentage of
total population RankPercentage of
total population
Urban Honolulu CDP, HI2 . . . . . . . . 337,256 1 68 .2 2 54 .8 1 13 .4Daly City, CA . . . . . . . . . . . . . . . . . 101,123 2 58 .4 1 55 .6 21 2 .8Fremont, CA . . . . . . . . . . . . . . . . . 214,089 3 54 .5 3 50 .6 5 3 .9Sunnyvale, CA . . . . . . . . . . . . . . . . 140,081 4 43 .7 4 40 .9 19 2 .8Irvine, CA . . . . . . . . . . . . . . . . . . . . 212,375 5 43 .3 5 39 .2 4 4 .1Santa Clara, CA . . . . . . . . . . . . . . . 116,468 6 40 .8 6 37 .7 11 3 .2Garden Grove, CA . . . . . . . . . . . . . 170,883 7 38 .6 7 37 .1 75 1 .4Torrance, CA . . . . . . . . . . . . . . . . . 145,438 8 38 .2 8 34 .5 6 3 .6San Francisco, CA . . . . . . . . . . . . . 805,235 9 35 .8 9 33 .3 25 2 .6San Jose, CA . . . . . . . . . . . . . . . . . 945,942 10 34 .5 10 32 .0 27 2 .5
Elk Grove, CA . . . . . . . . . . . . . . . . 153,015 11 30 .6 12 26 .3 2 4 .3Fairfield, CA . . . . . . . . . . . . . . . . . . 105,321 26 19 .0 32 14 .9 3 4 .1Berkeley, CA . . . . . . . . . . . . . . . . . 112,580 21 22 .8 22 19 .3 7 3 .6Vallejo, CA . . . . . . . . . . . . . . . . . . . 115,942 13 28 .3 15 24 .9 8 3 .3Enterprise CDP, NV2 . . . . . . . . . . . 108,481 20 24 .5 20 21 .2 9 3 .3Hayward, CA . . . . . . . . . . . . . . . . . 144,186 17 25 .2 18 22 .0 10 3 .2
1 Places of 100,000 or more total population . The 2010 Census showed 282 places in the United States with 100,000 or more population . They included 273 incorporated places (including 5 city-county consolidations) and 9 census designated places (CDPs) that were not legally incorporated .
2 Urban Honolulu CDP, HI, and Enterprise CDP, NV are census designated places . CDPs are the statistical counterparts of incorporated places, and are delineated to provide data for settled concentrations of population that are identifiable by name but are not legally incorporated under the laws of the state in which they are located .
Source: U .S . Census Bureau, 2010 Census Redistricting Data (Public Law 94-171) Summary File, Table P1 .

14 U.S. Census Bureau
alone-or-in- combination popula-tions, all the places with the highest Asian in combination proportions were located in the West. Of the ten places that had the highest Asian in combination proportions, four places also were among the top ten Asian alone and Asian alone-or-in-combination proportions.
Six places that had the highest percentage of the Asian in combi-nation population were not within the top ten ranking for the Asian
alone population or the Asian alone-or-in- combination popula-tion. These places were Elk Grove, CA; Fairfield, CA; Berkeley, CA; Vallejo, CA; Enterprise CDP, NV; and Hayward, CA.
PATTERNS AMONG THE DETAILED ASIAN GROUPS
Table 5 presents data for a number of detailed groups. Data for people who reported only one detailed Asian group, such as Filipino, are presented in the first data column.
Next, data for people who identified with two or more detailed Asian groups, such as Filipino and Korean, and no other race group are pre-sented in the second data column. The third data column presents data for people who reported only one detailed Asian group and one or more other races, such as Filipino and White. The fourth data col-umn presents data for people who reported two or more detailed Asian groups and one or more other race
Table 5. Asian Population by Number of Detailed Groups: 2010(For information on confidentiality protection, nonsampling error, and definitions, see www.census.gov/prod/cen2010/doc/sf1.pdf)
Detailed group
Asian alone Asian in combination with one or more other races
Detailed Asian group alone or in any combination1
One detailed Asian group reported
Two or more detailed Asian
groups reported1
One detailed Asian group reported
Two or more detailed Asian
groups reported1
Total . . . . . . . . . . . . . . . 2 14,327,580 346,672 2,429,530 217,074 17,320,856Asian Indian . . . . . . . . . . . . . . . . . 2,843,391 75,416 240,547 23,709 3,183,063Bangladeshi . . . . . . . . . . . . . . . . . 128,792 13,288 4,364 856 147,300Bhutanese . . . . . . . . . . . . . . . . . . 15,290 3,524 442 183 19,439Burmese . . . . . . . . . . . . . . . . . . . 91,085 4,451 4,077 587 100,200Cambodian . . . . . . . . . . . . . . . . . 231,616 23,881 18,229 2,941 276,667Chinese3 . . . . . . . . . . . . . . . . . . . 3,347,229 188,153 334,144 140,588 4,010,114 Chinese, except Taiwanese4 . . . 3,137,061 185,289 317,344 140,038 3,779,732 Taiwanese4 . . . . . . . . . . . . . . . . 196,691 2,501 15,781 468 215,441Filipino . . . . . . . . . . . . . . . . . . . . . 2,555,923 94,050 645,970 120,897 3,416,840Hmong . . . . . . . . . . . . . . . . . . . . . 247,595 4,728 7,392 358 260,073Indonesian . . . . . . . . . . . . . . . . . . 63,383 6,713 22,425 2,749 95,270Iwo Jiman . . . . . . . . . . . . . . . . . . 1 1 7 3 12Japanese . . . . . . . . . . . . . . . . . . . 763,325 78,499 368,094 94,368 1,304,286Korean . . . . . . . . . . . . . . . . . . . . . 1,423,784 39,690 216,288 27,060 1,706,822Laotian . . . . . . . . . . . . . . . . . . . . . 191,200 18,446 19,733 2,751 232,130Malaysian . . . . . . . . . . . . . . . . . . 16,138 5,730 3,214 1,097 26,179Maldivian . . . . . . . . . . . . . . . . . . . 98 4 25 – 127Mongolian . . . . . . . . . . . . . . . . . . 14,366 772 2,779 427 18,344Nepalese . . . . . . . . . . . . . . . . . . . 51,907 5,302 1,941 340 59,490Okinawan . . . . . . . . . . . . . . . . . . . 2,753 2,928 3,093 2,552 11,326Pakistani . . . . . . . . . . . . . . . . . . . 363,699 19,295 24,184 1,985 409,163Singaporean . . . . . . . . . . . . . . . . 3,418 1,151 645 133 5,347Sri Lankan . . . . . . . . . . . . . . . . . . 38,596 2,860 3,607 318 45,381Thai . . . . . . . . . . . . . . . . . . . . . . . 166,620 16,252 48,620 6,091 237,583Vietnamese . . . . . . . . . . . . . . . . . 1,548,449 84,268 93,058 11,658 1,737,433Other Asian, not specified5 . . . . . 218,922 19,410 366,652 18,777 623,761
– Represents zero .
Note: This table shows more detailed Asian groups and response types than tables in 2010 Census Summary File 1 . As a result, some numbers do not match those shown in 2010 Census Summary File 1 .
1 The numbers by detailed Asian group do not add to the total Asian population . This is because the detailed Asian groups are tallies of the number of Asian responses rather than the number of Asian respondents . Respondents reporting several Asian groups are counted several times . For example, a respondent reporting “Korean” and “Filipino” would be included in the Korean as well as the Filipino numbers .
2 The total of 14,327,580 respondents categorized as reporting only one detailed Asian group in this table is higher than the total of 14,314,103 shown in Table PCT5 (U .S . Census Bureau, 2010 Census Summary File 1) . This is because the number shown here includes respondents who reported “Chinese” and “Taiwanese” together as a single detailed group, “Chinese”, whereas PCT5 excludes respondents who reported “Chinese” and “Taiwanese ” together .
3 Includes respondents who reported “Chinese” and “Taiwanese” together .4 Excludes respondents who reported “Chinese” and “Taiwanese” together .5 Includes respondents who checked the “Other Asian” response category on the census questionnaire or wrote in a generic term such as “Asian” or “Asiatic .”
Source: U .S . Census Bureau, 2010 Census special tabulation .
U.S. Census Bureau 15
groups, such as Filipino, Korean, and White.
All of these columns are summed and presented in the last data column, detailed Asian group alone or in any combination. Thus, the last column presents the maximum number of people who identified as the detailed Asian group.
The Chinese population was the largest detailed Asian group.
In the 2010 Census, the detailed Asian groups with one million or more responses for the Asian alone-or-in-any-combination
population were Chinese, Filipino, Asian Indian, Vietnamese, Korean, and Japanese (see Table 5).
The Chinese alone-or-in-any- combination population, the largest detailed Asian group, was 4.0 mil-lion. There were 3.3 million people who reported Chinese alone with no additional detailed Asian group or race category.
Filipino and Asian Indian were the second- and third-largest detailed Asian groups.
Filipino and Asian Indian were the next largest detailed Asian groups for the Asian
alone-or-in-any- combination popula-tion. Filipino was the second-largest detailed Asian group of the Asian alone-or-in-any-combination popula-tion (3.4 million), followed by Asian Indian (3.2 million). However, for the Asian alone population where only one detailed Asian group was reported, Asian Indian was the second-largest group (2.8 million), followed by Filipino (2.6 million).
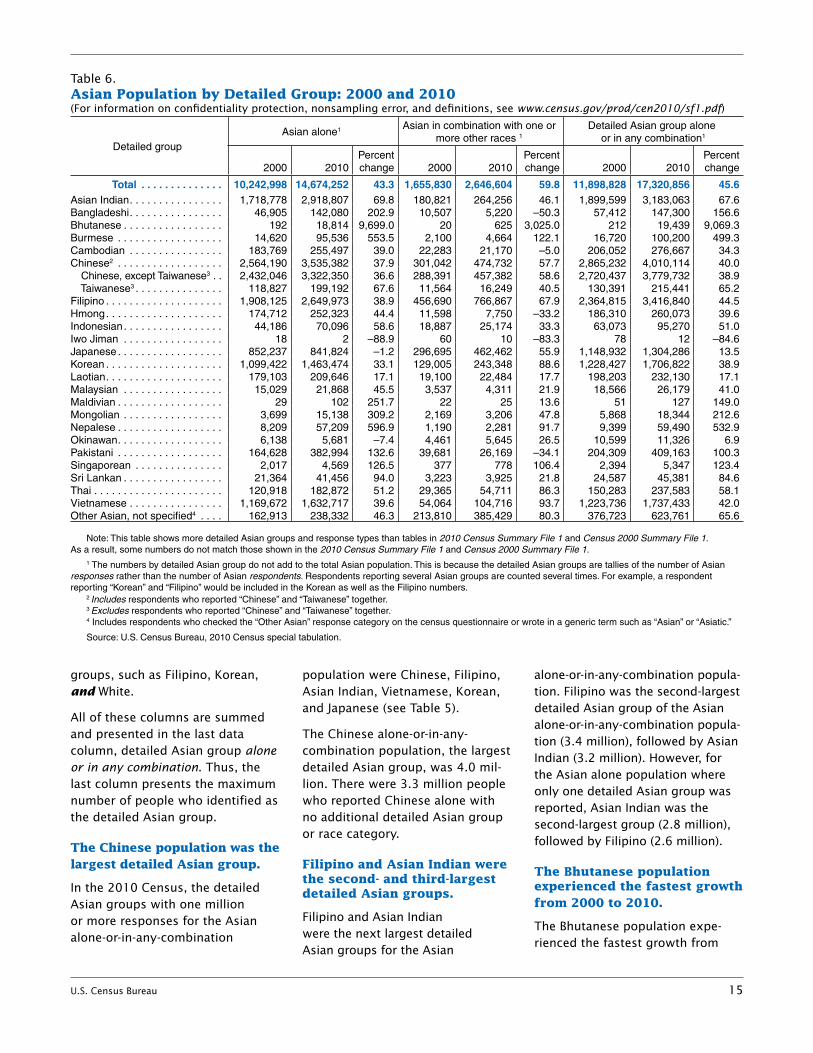
The Bhutanese population experienced the fastest growth from 2000 to 2010.
The Bhutanese population expe-rienced the fastest growth from
Table 6. Asian Population by Detailed Group: 2000 and 2010 (For information on confidentiality protection, nonsampling error, and definitions, see www.census.gov/prod/cen2010/sf1.pdf)
Detailed groupAsian alone1 Asian in combination with one or
more other races 1
Detailed Asian group alone or in any combination1
2000 2010Percent change 2000 2010
Percent change 2000 2010
Percent change
Total . . . . . . . . . . . . . . 10,242,998 14,674,252 43 .3 1,655,830 2,646,604 59 .8 11,898,828 17,320,856 45 .6Asian Indian . . . . . . . . . . . . . . . . 1,718,778 2,918,807 69 .8 180,821 264,256 46 .1 1,899,599 3,183,063 67 .6Bangladeshi . . . . . . . . . . . . . . . . 46,905 142,080 202 .9 10,507 5,220 –50 .3 57,412 147,300 156 .6Bhutanese . . . . . . . . . . . . . . . . . 192 18,814 9,699 .0 20 625 3,025 .0 212 19,439 9,069 .3Burmese . . . . . . . . . . . . . . . . . . 14,620 95,536 553 .5 2,100 4,664 122 .1 16,720 100,200 499 .3Cambodian . . . . . . . . . . . . . . . . 183,769 255,497 39 .0 22,283 21,170 –5 .0 206,052 276,667 34 .3Chinese2 . . . . . . . . . . . . . . . . . . 2,564,190 3,535,382 37 .9 301,042 474,732 57 .7 2,865,232 4,010,114 40 .0 Chinese, except Taiwanese3 . . 2,432,046 3,322,350 36 .6 288,391 457,382 58 .6 2,720,437 3,779,732 38 .9 Taiwanese3 . . . . . . . . . . . . . . . 118,827 199,192 67 .6 11,564 16,249 40 .5 130,391 215,441 65 .2Filipino . . . . . . . . . . . . . . . . . . . . 1,908,125 2,649,973 38 .9 456,690 766,867 67 .9 2,364,815 3,416,840 44 .5Hmong . . . . . . . . . . . . . . . . . . . . 174,712 252,323 44 .4 11,598 7,750 –33 .2 186,310 260,073 39 .6Indonesian . . . . . . . . . . . . . . . . . 44,186 70,096 58 .6 18,887 25,174 33 .3 63,073 95,270 51 .0Iwo Jiman . . . . . . . . . . . . . . . . . 18 2 –88 .9 60 10 –83 .3 78 12 –84 .6Japanese . . . . . . . . . . . . . . . . . . 852,237 841,824 –1 .2 296,695 462,462 55 .9 1,148,932 1,304,286 13 .5Korean . . . . . . . . . . . . . . . . . . . . 1,099,422 1,463,474 33 .1 129,005 243,348 88 .6 1,228,427 1,706,822 38 .9Laotian . . . . . . . . . . . . . . . . . . . . 179,103 209,646 17 .1 19,100 22,484 17 .7 198,203 232,130 17 .1Malaysian . . . . . . . . . . . . . . . . . 15,029 21,868 45 .5 3,537 4,311 21 .9 18,566 26,179 41 .0Maldivian . . . . . . . . . . . . . . . . . . 29 102 251 .7 22 25 13 .6 51 127 149 .0Mongolian . . . . . . . . . . . . . . . . . 3,699 15,138 309 .2 2,169 3,206 47 .8 5,868 18,344 212 .6Nepalese . . . . . . . . . . . . . . . . . . 8,209 57,209 596 .9 1,190 2,281 91 .7 9,399 59,490 532 .9Okinawan . . . . . . . . . . . . . . . . . . 6,138 5,681 –7 .4 4,461 5,645 26 .5 10,599 11,326 6 .9Pakistani . . . . . . . . . . . . . . . . . . 164,628 382,994 132 .6 39,681 26,169 –34 .1 204,309 409,163 100 .3Singaporean . . . . . . . . . . . . . . . 2,017 4,569 126 .5 377 778 106 .4 2,394 5,347 123 .4Sri Lankan . . . . . . . . . . . . . . . . . 21,364 41,456 94 .0 3,223 3,925 21 .8 24,587 45,381 84 .6Thai . . . . . . . . . . . . . . . . . . . . . . 120,918 182,872 51 .2 29,365 54,711 86 .3 150,283 237,583 58 .1Vietnamese . . . . . . . . . . . . . . . . 1,169,672 1,632,717 39 .6 54,064 104,716 93 .7 1,223,736 1,737,433 42 .0Other Asian, not specified4 . . . . 162,913 238,332 46 .3 213,810 385,429 80 .3 376,723 623,761 65 .6
Note: This table shows more detailed Asian groups and response types than tables in 2010 Census Summary File 1 and Census 2000 Summary File 1 . As a result, some numbers do not match those shown in the 2010 Census Summary File 1 and Census 2000 Summary File 1 .
1 The numbers by detailed Asian group do not add to the total Asian population . This is because the detailed Asian groups are tallies of the number of Asian responses rather than the number of Asian respondents . Respondents reporting several Asian groups are counted several times . For example, a respondent reporting “Korean” and “Filipino” would be included in the Korean as well as the Filipino numbers .
2 Includes respondents who reported “Chinese” and “Taiwanese” together .3 Excludes respondents who reported “Chinese” and “Taiwanese” together . .
4 Includes respondents who checked the “Other Asian” response category on the census questionnaire or wrote in a generic term such as “Asian” or “Asiatic .”
Source: U .S . Census Bureau, 2010 Census special tabulation .
16 U.S. Census Bureau
2000 to 2010, growing from about 200 in 2000 to about 19,000 in 2010 (see Table 6). While the Bhutanese population experi-enced high percentage growth, its proportion of the Asian alone-or-in-any-combination population remained small.
Of all the detailed Asian alone-or-in-any combination groups that had a population of one million or more, the Asian Indian population grew the fastest, by 68 percent, followed by the Filipino (44 per-cent), Vietnamese (42 percent), Korean (39 percent), and Chinese (40 percent) populations. The Japanese population experienced the slowest growth among the detailed Asian groups with alone-or-in-any- combination populations of one million or more, growing by 14 percent.
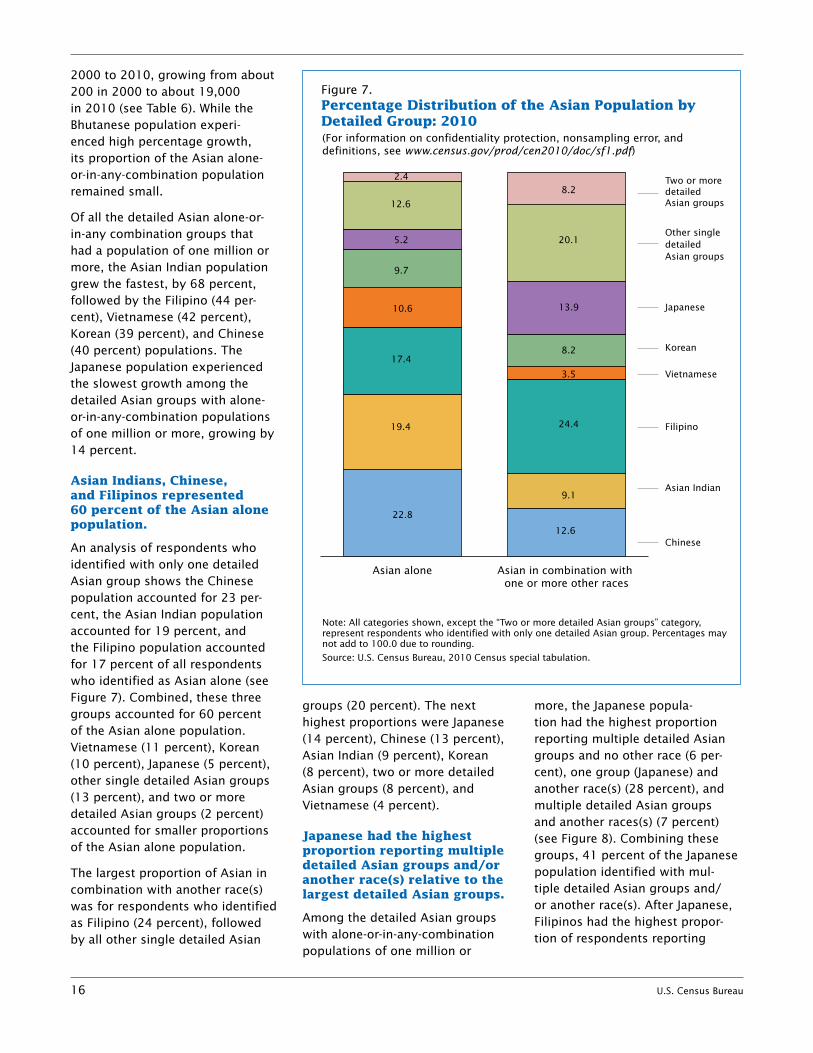
Asian Indians, Chinese, and Filipinos represented 60 percent of the Asian alone population.
An analysis of respondents who identified with only one detailed Asian group shows the Chinese population accounted for 23 per-cent, the Asian Indian population accounted for 19 percent, and the Filipino population accounted for 17 percent of all respondents who identified as Asian alone (see Figure 7). Combined, these three groups accounted for 60 percent of the Asian alone population. Vietnamese (11 percent), Korean (10 percent), Japanese (5 percent), other single detailed Asian groups (13 percent), and two or more detailed Asian groups (2 percent) accounted for smaller proportions of the Asian alone population.
The largest proportion of Asian in combination with another race(s) was for respondents who identified as Filipino (24 percent), followed by all other single detailed Asian
groups (20 percent). The next highest proportions were Japanese (14 percent), Chinese (13 percent), Asian Indian (9 percent), Korean (8 percent), two or more detailed Asian groups (8 percent), and Vietnamese (4 percent).
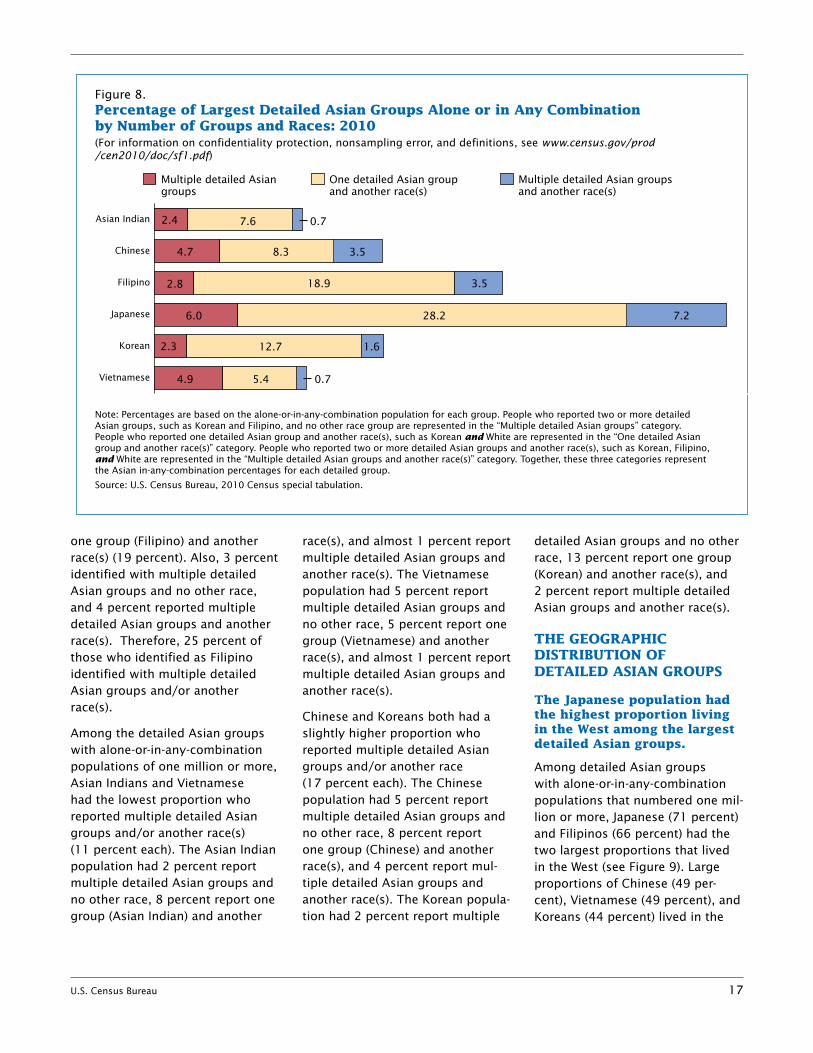
Japanese had the highest proportion reporting multiple detailed Asian groups and/or another race(s) relative to the largest detailed Asian groups.
Among the detailed Asian groups with alone-or-in-any-combination populations of one million or
more, the Japanese popula-tion had the highest proportion reporting multiple detailed Asian groups and no other race (6 per-cent), one group (Japanese) and another race(s) (28 percent), and multiple detailed Asian groups and another races(s) (7 percent) (see Figure 8). Combining these groups, 41 percent of the Japanese population identified with mul-tiple detailed Asian groups and/or another race(s). After Japanese, Filipinos had the highest propor-tion of respondents reporting
Asian in combination with one or more other races
Asian alone
Figure 7.Percentage Distribution of the Asian Population by Detailed Group: 2010
Note: All categories shown, except the “Two or more detailed Asian groups” category, represent respondents who identified with only one detailed Asian group. Percentages may not add to 100.0 due to rounding.
Source: U.S. Census Bureau, 2010 Census special tabulation.
(For information on confidentiality protection, nonsampling error, and definitions, see www.census.gov/prod/cen2010/doc/sf1.pdf)
19.4
22.8
17.4
5.2
9.7
10.6
12.6
2.4
9.1
12.6
24.4
13.9
8.2
3.5
20.1
8.2
Asian Indian
Chinese
Filipino
Japanese
Korean
Vietnamese
Other single detailed Asian groups
Two or more detailed Asian groups
U.S. Census Bureau 17
one group (Filipino) and another race(s) (19 percent). Also, 3 percent identified with multiple detailed Asian groups and no other race, and 4 percent reported multiple detailed Asian groups and another race(s). Therefore, 25 percent of those who identified as Filipino identified with multiple detailed Asian groups and/or another race(s).
Among the detailed Asian groups with alone-or-in-any-combination populations of one million or more, Asian Indians and Vietnamese had the lowest proportion who reported multiple detailed Asian groups and/or another race(s) (11 percent each). The Asian Indian population had 2 percent report multiple detailed Asian groups and no other race, 8 percent report one group (Asian Indian) and another
race(s), and almost 1 percent report multiple detailed Asian groups and another race(s). The Vietnamese population had 5 percent report multiple detailed Asian groups and no other race, 5 percent report one group (Vietnamese) and another race(s), and almost 1 percent report multiple detailed Asian groups and another race(s).
Chinese and Koreans both had a slightly higher proportion who reported multiple detailed Asian groups and/or another race (17 percent each). The Chinese population had 5 percent report multiple detailed Asian groups and no other race, 8 percent report one group (Chinese) and another race(s), and 4 percent report mul-tiple detailed Asian groups and another race(s). The Korean popula-tion had 2 percent report multiple
detailed Asian groups and no other race, 13 percent report one group (Korean) and another race(s), and 2 percent report multiple detailed Asian groups and another race(s).
THE GEOGRAPHIC DISTRIBUTION OF DETAILED ASIAN GROUPS
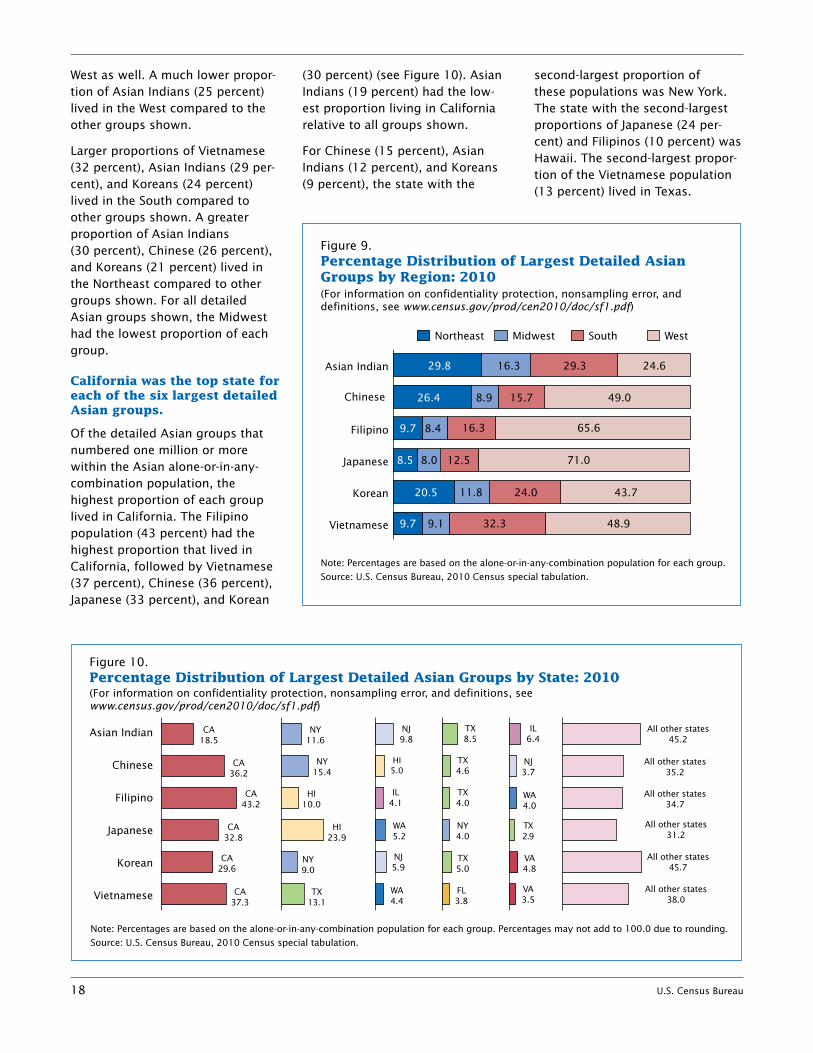
The Japanese population had the highest proportion living in the West among the largest detailed Asian groups.
Among detailed Asian groups with alone-or-in-any-combination populations that numbered one mil-lion or more, Japanese (71 percent) and Filipinos (66 percent) had the two largest proportions that lived in the West (see Figure 9). Large proportions of Chinese (49 per-cent), Vietnamese (49 percent), and Koreans (44 percent) lived in the
Figure 8.Percentage of Largest Detailed Asian Groups Alone or in Any Combination by Number of Groups and Races: 2010
Note: Percentages are based on the alone-or-in-any-combination population for each group. People who reported two or more detailed Asian groups, such as Korean and Filipino, and no other race group are represented in the “Multiple detailed Asian groups” category. People who reported one detailed Asian group and another race(s), such as Korean and White are represented in the “One detailed Asian group and another race(s)” category. People who reported two or more detailed Asian groups and another race(s), such as Korean, Filipino, and White are represented in the “Multiple detailed Asian groups and another race(s)” category. Together, these three categories represent the Asian in-any-combination percentages for each detailed group.
Source: U.S. Census Bureau, 2010 Census special tabulation.
Multiple detailed Asiangroups
One detailed Asian groupand another race(s)
Multiple detailed Asian groupsand another race(s)
(For information on confidentiality protection, nonsampling error, and definitions, see www.census.gov/prod/cen2010/doc/sf1.pdf)
Vietnamese
Korean
Japanese
Filipino
Chinese
Asian Indian 89.3
2.8
6.0
7.6 0.7
8.34.7
2.4
3.5
1.612.72.3 83.4
83.5
18.9 3.5
28.2 7.2
89.14.9 5.4 0.7
18 U.S. Census Bureau
West as well. A much lower propor-tion of Asian Indians (25 percent) lived in the West compared to the other groups shown.
Larger proportions of Vietnamese (32 percent), Asian Indians (29 per-cent), and Koreans (24 percent) lived in the South compared to other groups shown. A greater proportion of Asian Indians (30 percent), Chinese (26 percent), and Koreans (21 percent) lived in the Northeast compared to other groups shown. For all detailed Asian groups shown, the Midwest had the lowest proportion of each group.
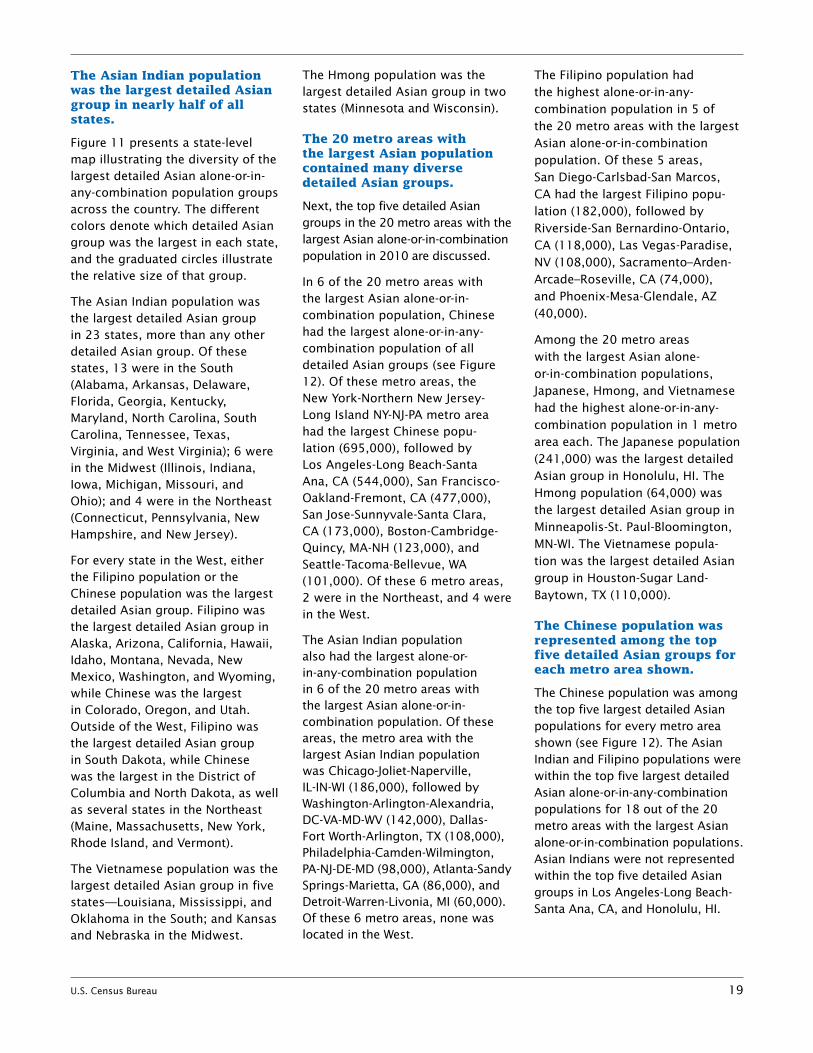
California was the top state for each of the six largest detailed Asian groups.
Of the detailed Asian groups that numbered one million or more within the Asian alone-or-in-any-combination population, the highest proportion of each group lived in California. The Filipino population (43 percent) had the highest proportion that lived in California, followed by Vietnamese (37 percent), Chinese (36 percent), Japanese (33 percent), and Korean
(30 percent) (see Figure 10). Asian Indians (19 percent) had the low-est proportion living in California relative to all groups shown.
For Chinese (15 percent), Asian Indians (12 percent), and Koreans (9 percent), the state with the
second-largest proportion of these populations was New York. The state with the second-largest proportions of Japanese (24 per-cent) and Filipinos (10 percent) was Hawaii. The second-largest propor-tion of the Vietnamese population (13 percent) lived in Texas.
Figure 9.Percentage Distribution of Largest Detailed Asian Groups by Region: 2010
Note: Percentages are based on the alone-or-in-any-combination population for each group.
Source: U.S. Census Bureau, 2010 Census special tabulation.
Northeast Midwest South West
(For information on confidentiality protection, nonsampling error, and definitions, see www.census.gov/prod/cen2010/doc/sf1.pdf)
20 40 60 80 100
Vietnamese
Korean
Japanese
Filipino
Chinese
Asian Indian 29.8
9.7
8.5
29.3 24.6
15.78.9
16.3
49.0
43.724.011.820.5
26.4
8.4 16.3 65.6
8.0 12.5 71.0
9.7 9.1 32.3 48.9
Figure 10.Percentage Distribution of Largest Detailed Asian Groups by State: 2010
Note: Percentages are based on the alone-or-in-any-combination population for each group. Percentages may not add to 100.0 due to rounding.
Source: U.S. Census Bureau, 2010 Census special tabulation.
(For information on confidentiality protection, nonsampling error, and definitions, see www.census.gov/prod/cen2010/doc/sf1.pdf)
CA18.5
CA36.2
NY15.4
HI5.0
TX4.6
NJ3.7
NY11.6
NJ9.8
IL6.4
TX8.5
All other states45.2
All other states35.2
CA43.2
HI10.0
IL4.1
TX4.0
WA4.0
All other states34.7
CA32.8
HI23.9
WA5.2
NY4.0
TX2.9
All other states31.2
CA29.6
NY9.0
NJ5.9
TX5.0
VA3.5
All other states45.7
CA37.3
TX13.1
WA4.4
FL3.8
VA4.8
All other states38.0
Asian Indian
Chinese
Filipino
Japanese
Korean
Vietnamese
U.S. Census Bureau 19
The Asian Indian population was the largest detailed Asian group in nearly half of all states.
Figure 11 presents a state-level map illustrating the diversity of the largest detailed Asian alone-or-in-any-combination population groups across the country. The different colors denote which detailed Asian group was the largest in each state, and the graduated circles illustrate the relative size of that group.
The Asian Indian population was the largest detailed Asian group in 23 states, more than any other detailed Asian group. Of these states, 13 were in the South (Alabama, Arkansas, Delaware, Florida, Georgia, Kentucky, Maryland, North Carolina, South Carolina, Tennessee, Texas, Virginia, and West Virginia); 6 were in the Midwest (Illinois, Indiana, Iowa, Michigan, Missouri, and Ohio); and 4 were in the Northeast (Connecticut, Pennsylvania, New Hampshire, and New Jersey).
For every state in the West, either the Filipino population or the Chinese population was the largest detailed Asian group. Filipino was the largest detailed Asian group in Alaska, Arizona, California, Hawaii, Idaho, Montana, Nevada, New Mexico, Washington, and Wyoming, while Chinese was the largest in Colorado, Oregon, and Utah. Outside of the West, Filipino was the largest detailed Asian group in South Dakota, while Chinese was the largest in the District of Columbia and North Dakota, as well as several states in the Northeast (Maine, Massachusetts, New York, Rhode Island, and Vermont).
The Vietnamese population was the largest detailed Asian group in five states—Louisiana, Mississippi, and Oklahoma in the South; and Kansas and Nebraska in the Midwest.
The Hmong population was the largest detailed Asian group in two states (Minnesota and Wisconsin).
The 20 metro areas with the largest Asian population contained many diverse detailed Asian groups.
Next, the top five detailed Asian groups in the 20 metro areas with the largest Asian alone-or-in- combination population in 2010 are discussed.
In 6 of the 20 metro areas with the largest Asian alone-or-in- combination population, Chinese had the largest alone-or-in-any-combination population of all detailed Asian groups (see Figure 12). Of these metro areas, the New York-Northern New Jersey-Long Island NY-NJ-PA metro area had the largest Chinese popu-lation (695,000), followed by Los Angeles-Long Beach-Santa Ana, CA (544,000), San Francisco-Oakland-Fremont, CA (477,000), San Jose-Sunnyvale-Santa Clara, CA (173,000), Boston-Cambridge-Quincy, MA-NH (123,000), and Seattle-Tacoma-Bellevue, WA (101,000). Of these 6 metro areas, 2 were in the Northeast, and 4 were in the West.
The Asian Indian population also had the largest alone-or-in-any- combination population in 6 of the 20 metro areas with the largest Asian alone-or-in-combination population. Of these areas, the metro area with the largest Asian Indian population was Chicago-Joliet-Naperville, IL-IN-WI (186,000), followed by Washington-Arlington-Alexandria, DC-VA-MD-WV (142,000), Dallas-Fort Worth-Arlington, TX (108,000), Philadelphia-Camden-Wilmington, PA-NJ-DE-MD (98,000), Atlanta-Sandy Springs-Marietta, GA (86,000), and Detroit-Warren-Livonia, MI (60,000). Of these 6 metro areas, none was located in the West.
The Filipino population had the highest alone-or-in-any- combination population in 5 of the 20 metro areas with the largest Asian alone-or-in- combination population. Of these 5 areas, San Diego-Carlsbad-San Marcos, CA had the largest Filipino popu-lation (182,000), followed by Riverside-San Bernardino-Ontario, CA (118,000), Las Vegas-Paradise, NV (108,000), Sacramento –Arden-Arcade–Roseville, CA (74,000), and Phoenix-Mesa-Glendale, AZ (40,000).
Among the 20 metro areas with the largest Asian alone-or-in- combination populations, Japanese, Hmong, and Vietnamese had the highest alone-or-in-any- combination population in 1 metro area each. The Japanese population (241,000) was the largest detailed Asian group in Honolulu, HI. The Hmong population (64,000) was the largest detailed Asian group in Minneapolis-St. Paul-Bloomington, MN-WI. The Vietnamese popula-tion was the largest detailed Asian group in Houston-Sugar Land-Baytown, TX (110,000).
The Chinese population was represented among the top five detailed Asian groups for each metro area shown.
The Chinese population was among the top five largest detailed Asian populations for every metro area shown (see Figure 12). The Asian Indian and Filipino populations were within the top five largest detailed Asian alone-or-in-any- combination populations for 18 out of the 20 metro areas with the largest Asian alone-or-in-combination populations. Asian Indians were not represented within the top five detailed Asian groups in Los Angeles-Long Beach-Santa Ana, CA, and Honolulu, HI.
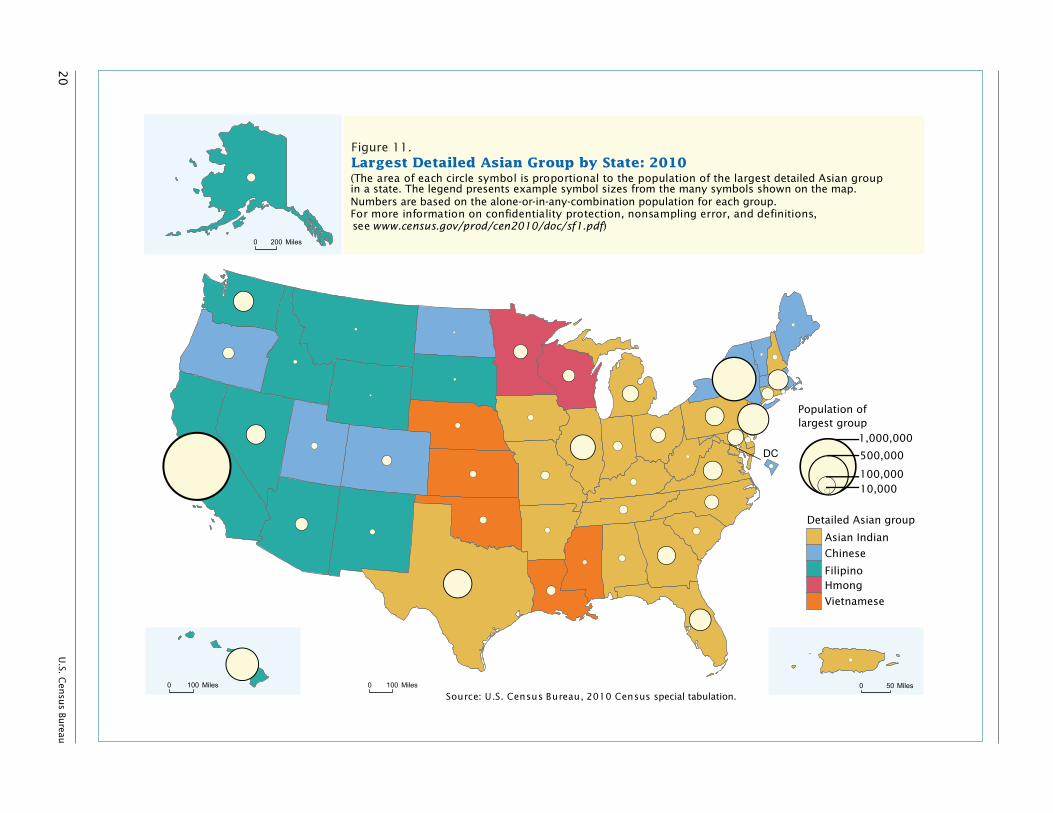
20
U
.S. Cen
sus Bu
reau
Source: U.S. Census Bureau, 2010 Census special tabulation.0 100 Miles
Figure 11. Largest Detailed Asian Group by State: 2010
0 200 Miles
0 100 Miles 0 50 Miles
For more information on confidentiality protection, nonsampling error, and definitions, see www.census.gov/prod/cen2010/doc/sf1.pdf)
Detailed Asian group
Asian Indian
Chinese
FilipinoHmong
Vietnamese
DC
Population oflargest group
10,000100,000
1,000,000
500,000
(The area of each circle symbol is proportional to the population of the largest detailed Asian group in a state. The legend presents example symbol sizes from the many symbols shown on the map. Numbers are based on the alone-or-in-any-combination population for each group.
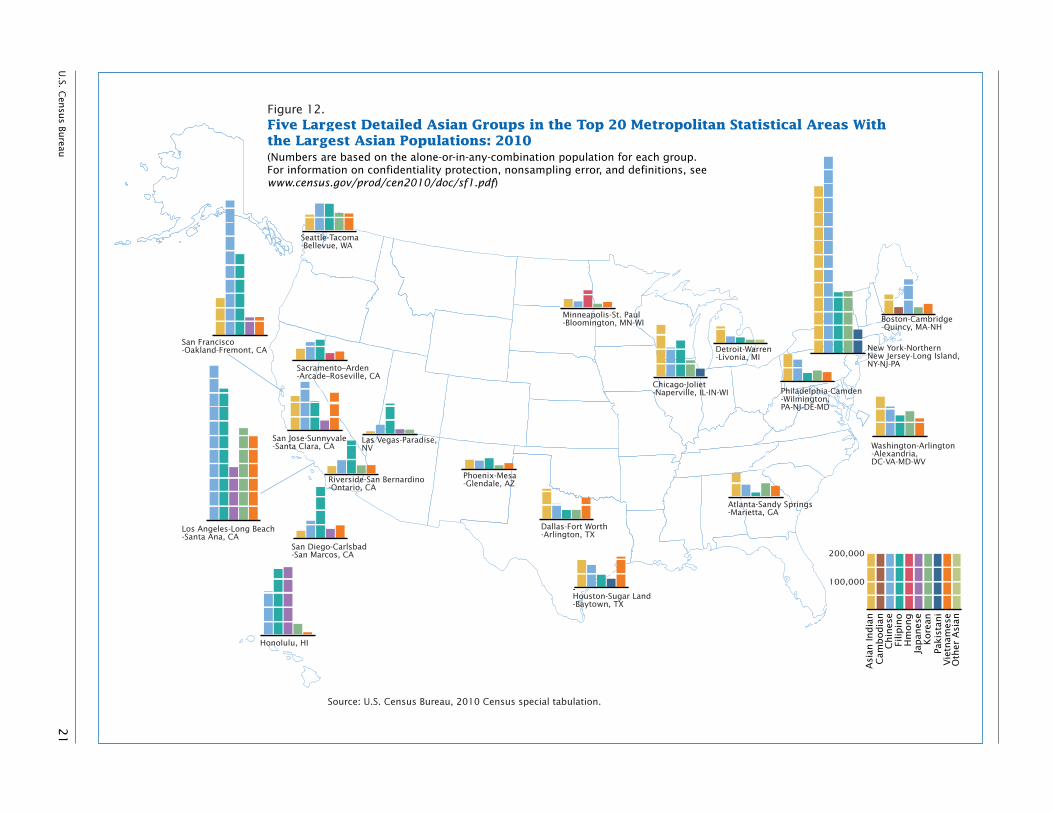
U.S. C
ensu
s Bureau
2
1
Vie
tnam
ese
Paki
stan
i
Oth
er A
sian
Kore
anJa
pan
ese
Hm
ong
Filip
ino
Chin
ese
Cam
bodia
nA
sian
India
n
100,000
200,000
Source: U.S. Census Bureau, 2010 Census special tabulation.
Washington-Arlington-Alexandria, DC-VA-MD-WV
Phoenix-Mesa-Glendale, AZ
Chicago-Joliet-Naperville, IL-IN-WI
Minneapolis-St. Paul-Bloomington, MN-WI
Houston-Sugar Land-Baytown, TX
Dallas-Fort Worth-Arlington, TX
Honolulu, HI
San Diego-Carlsbad-San Marcos, CA
Atlanta-Sandy Springs-Marietta, GA
San Jose-Sunnyvale-Santa Clara, CA
Figure 12.Five Largest Detailed Asian Groups in the Top 20 Metropolitan Statistical Areas With the Largest Asian Populations: 2010
New York-Northern New Jersey-Long Island, NY-NJ-PA
Philadelphia-Camden-Wilmington, PA-NJ-DE-MD
Las Vegas-Paradise, NV
San Francisco-Oakland-Fremont, CA
Los Angeles-Long Beach-Santa Ana, CA
Detroit-Warren-Livonia, MI
Seattle-Tacoma-Bellevue, WA
Sacramento–Arden-Arcade–Roseville, CA
Riverside-San Bernardino-Ontario, CA
Boston-Cambridge-Quincy, MA-NH
(Numbers are based on the alone-or-in-any-combination population for each group.For information on confidentiality protection, nonsampling error, and definitions, see www.census.gov/prod/cen2010/doc/sf1.pdf)
--
22 U.S. Census Bureau
Filipinos were not represented in the top five detailed Asian groups in Boston-Cambridge-Quincy, MA-NH and Minneapolis-St. Paul-Bloomington, MN-WI. The Korean and Vietnamese populations were represented among the top five detailed Asian groups in 15 and 16 out of the 20 metro areas with the largest Asian alone-or-in-combination population,respectively.
The Japanese population was repre-sented in the top five detailed Asian groups in 6 out of the 20 metro areas, all of which were located in the West. Pakistanis were repre-sented in 3 of the 20 metro areas with the largest Asian alone-or-in-combination population, New York-Northern New Jersey-Long Island NY-NJ-PA (86,000), Houston-Sugar Land-Baytown, TX, and Chicago-Joliet-Naperville, IL-IN-WI (32,000 each). Hmong were represented in 2 metro areas, Minneapolis-St. Paul-Bloomington, MN-WI (64,000) and Sacramento–Arden-Arcade–Roseville, CA (27,000). Cambodians were represented in 1 metro area, Boston-Cambridge-Quincy, MA-NH (25,000).
SUMMARY
This report provides a detailed portrait of the Asian population in the United States and contrib-utes to our understanding of the nation’s changing racial and ethnic diversity.
The Asian alone population and the Asian alone-or-in-combination population both grew substan-tially from 2000 to 2010, increas-ing in size by 43 percent and 46 percent, respectively. These populations grew more than any other race group in 2010. The multiple-race Asian population also experienced considerable growth, increasing by 60 percent. Leading this growth was the Asian and
White population, which grew by 87 percent.
Additional notable trends were presented in this report. The Asian population continued to be con-centrated in the West. However, the proportion of all Asians living in the West decreased from 2000 to 2010, while the proportion living in the South increased.
The report also highlighted results for detailed Asian groups, indicat-ing that the Chinese population was the largest detailed Asian group. For the Asian alone-or-in-any-combination population, Filipinos and Asian Indians were the second- and third-largest detailed Asian groups.
The report also discussed geo-graphic patterns for detailed Asian groups. Of the detailed Asian groups with one million or more alone-or-in-any-combination popu-lations, Japanese, Filipino, Chinese, Vietnamese, and Korean popula-tions were concentrated in the West. However, this pattern was not observed for Asian Indians. In addi-tion, for these same six groups, the largest proportion of each group lived in California.
Another interesting finding is that among the detailed Asian groups with alone-or-in-any-combination populations of one million or more, the Japanese population had the highest proportion that identified with multiple detailed Asian groups and/or another race(s) (41 percent). After Japanese, Filipinos had the next-highest proportion of respon-dents who identified with multiple detailed Asian groups and/or another race(s) (25 percent).
Throughout the decade, the Census Bureau will release additional information on the Asian popula-tion, including characteristics such as age, sex, and family type, which will provide greater insights
into the demographic characteris-tics of this population at various geographic levels.
ABOUT THE 2010 CENSUS
Why was the 2010 Census conducted?
The U.S. Constitution mandates that a census be taken in the United States every 10 years. This is required in order to determine the number of seats each state is to receive in the U.S. House of Representatives.
Why did the 2010 Census ask the question on race?
The Census Bureau collects data on race to fulfill a variety of legislative and program requirements. Data on race are used in the legislative redistricting process carried out by the states and in monitoring local jurisdictions’ compliance with the Voting Rights Act. More broadly, data on race are critical for research that underlies many policy deci-sions at all levels of government.
How do data from the question on race benefit me, my family, and my community?
All levels of government need infor-mation on race to implement and evaluate programs, or enforce laws, such as the Civil Rights Act, Voting Rights Act, Fair Housing Act, Equal Employment Opportunity Act, and the 2010 Census Redistricting Data Program.
Both public and private organiza-tions use race information to find areas where groups may need spe-cial services and to plan and imple-ment education, housing, health, and other programs that address these needs. For example, a school system might use this information to design cultural activities that reflect the diversity in their com-munity, or a business could use it to select the mix of merchandise

U.S. Census Bureau 23
it will sell in a new store. Census information also helps identify areas where residents might need services of particular importance to certain racial groups, such as screening for hypertension or diabetes.
FOR MORE INFORMATION
For more information on race in the United States, visit the Census Bureau’s Internet site at <www.census.gov/population /race>.
Information on confidentiality protection, nonsampling error, and definitions is available at <www.census.gov/prod/cen2010 /doc/pl94-171.pdf>.
Data on race from the 2010 Census Redistricting Data (Public Law 94-171) Summary File and the 2010 Census Summary File 1 were released on a state-by-state basis. The 2010 Census redistricting data are available on the Internet at <http://factfinder2.census.gov /main.html>.
For more information on spe-cific race groups in the United States, go to <www.census.gov> and search for “Minority Links.” This Web page includes informa-tion about the 2010 Census and provides links to reports based on past censuses and surveys focus-ing on the social and economic characteristics of the Black or African American, American Indian and Alaska Native, Asian, and
Native Hawaiian and Other Pacific Islander populations.
Information on other population and housing topics is presented in the 2010 Census Briefs series, located on the Census Bureau’s Web site at <www.census.gov/prod/cen2010>. This series presents information about race, Hispanic origin, age, sex, household type, and housing tenure.
For more information about the 2010 Census, including data prod-ucts, call the Customer Services Center at 1-800-923-8282. You can also visit the Census Bureau’s Question and Answer Center at <ask.census.gov> to submit your questions online.