The Application of Starling's Law of Capillary Exchange to ... · monary edema in the intact dog by...
11
Journal of Clinical Investigation Vol. 46, No. 6, 1967 The Application of Starling's Law of Capillary Exchange to the Lungs * 0. ROBERT LEVINE,t ROBERT B. MELLINS, ROBERT M. SENIOR,§ AND ALFRED P. FISHMAN (From the Departments of Pediatrics and Medicine of the College of Physicians & Surgeons, Columbia University, New York, N. Y.) Summary. The forces governing the movement of water across the pulmo- nary capillaries were studied in 39 intact, spontaneously breathing dogs. A situation favoring the net movement of water out of the pulmonary capillaries was created by means of partial pulmonary venous obstruction (left atrial balloon catheter) followed by rapid saline hemodilution. A predetermined difference between pulmonary capillary and plasma colloid osmotic pressures was maintained for periods of 1 to 2 hours. Left atrial (PLA) and plasma colloid osmotic pressures (7rp1) were measured directly. The water content of the lungs was measured serially by an indicator-dilution technique, and at autopsy by drying the lungs. The rate of accumulation of lung water was measured in four groups of animals: in three of the groups, the capillary hydrostatic and colloid osmotic pressures were varied; in the fourth group, the right lymphatic duct was obstructed in addition. The average rate of water accumulation in the lungs varied in a nonlinear way with the level of the capillary hydrostatic-plasma colloid osmotic pres- sure difference and was unaffected by the level of the capillary hydrostatic pressure. At low levels of PLA - 7rpl, water accumulated in the lung at an average rate of 0.09 g per g dry lung per hour per mm Hg pressure difference. At higher levels of PLA - 7rpl the average rate of accumulation was 0.22 g per g per hour per mm Hg AP; in most of the experiments in this group water accumulated in the lungs slowly during the first 30 minutes of the test period and more rapidly as the period was extended. Obstruction of right lymphatic duct outflow did not alter the rate of water accumulation. Based on the con- trol data of the present experiments, the pericapillary pressure in normal lungs is estimated to be of the order of - 9 mm Hg in the normal dog lung. The filtration coefficient for the pulmonary capillaries is estimated to be of the order of one-tenth to one-twentieth of that for canine muscle capillaries. The data of the present study indicate that edema formation in lung tissue cannot be defined solely in terms of intravascular forces, but may be governed to a significant degree by changes in pericapillary forces in the pulmonary interstitium. * Submitted for publication June 20, 1966; accepted t Recipient of a New York City Health Research February 17, 1967. Council Career Scientist Award, contract I-259. Supported by research grants HE-05741 and HE-08015 t Recipient of Career Development Award 1-K3-He- from the National Institutes of Health, U. S. Public 31,667-01 from the National Institutes of Health. Health Service, with additional support from the New § Research fellow of the U. S. Public Health Service. York Heart Association and the Health Research Coun- 11 Address requests for reprints to Dr. Alfred P. Fish- cil of the City of New York, contract U-1613. man, Dept. of Medicine, University of Chicago, Chicago, Presented at the May 1965 meeting of the Society for Ill. 60637. Pediatric Research, Philadelphia, Pa. 934
Transcript of The Application of Starling's Law of Capillary Exchange to ... · monary edema in the intact dog by...

Journal of Clinical InvestigationVol. 46, No. 6, 1967
The Application of Starling's Law of Capillary Exchangeto the Lungs *
0. ROBERTLEVINE,t ROBERTB. MELLINS, ROBERTM. SENIOR,§ ANDALFREDP. FISHMAN
(From the Departments of Pediatrics and Medicine of the College of Physicians & Surgeons,Columbia University, New York, N. Y.)
Summary. The forces governing the movement of water across the pulmo-nary capillaries were studied in 39 intact, spontaneously breathing dogs. Asituation favoring the net movement of water out of the pulmonary capillarieswas created by means of partial pulmonary venous obstruction (left atrialballoon catheter) followed by rapid saline hemodilution. A predetermineddifference between pulmonary capillary and plasma colloid osmotic pressureswas maintained for periods of 1 to 2 hours. Left atrial (PLA) and plasmacolloid osmotic pressures (7rp1) were measured directly. The water contentof the lungs was measured serially by an indicator-dilution technique, andat autopsy by drying the lungs. The rate of accumulation of lung water wasmeasured in four groups of animals: in three of the groups, the capillaryhydrostatic and colloid osmotic pressures were varied; in the fourth group,the right lymphatic duct was obstructed in addition.
The average rate of water accumulation in the lungs varied in a nonlinearway with the level of the capillary hydrostatic-plasma colloid osmotic pres-sure difference and was unaffected by the level of the capillary hydrostaticpressure. At low levels of PLA - 7rpl, water accumulated in the lung at anaverage rate of 0.09 g per g dry lung per hour per mmHg pressure difference.At higher levels of PLA - 7rpl the average rate of accumulation was 0.22 g perg per hour per mmHg AP; in most of the experiments in this group wateraccumulated in the lungs slowly during the first 30 minutes of the test periodand more rapidly as the period was extended. Obstruction of right lymphaticduct outflow did not alter the rate of water accumulation. Based on the con-trol data of the present experiments, the pericapillary pressure in normallungs is estimated to be of the order of - 9 mmHg in the normal dog lung.The filtration coefficient for the pulmonary capillaries is estimated to be ofthe order of one-tenth to one-twentieth of that for canine muscle capillaries.The data of the present study indicate that edema formation in lung tissuecannot be defined solely in terms of intravascular forces, but may be governedto a significant degree by changes in pericapillary forces in the pulmonaryinterstitium.
* Submitted for publication June 20, 1966; accepted t Recipient of a New York City Health ResearchFebruary 17, 1967. Council Career Scientist Award, contract I-259.
Supported by research grants HE-05741 and HE-08015 t Recipient of Career Development Award 1-K3-He-from the National Institutes of Health, U. S. Public 31,667-01 from the National Institutes of Health.Health Service, with additional support from the New § Research fellow of the U. S. Public Health Service.York Heart Association and the Health Research Coun- 11 Address requests for reprints to Dr. Alfred P. Fish-cil of the City of New York, contract U-1613. man, Dept. of Medicine, University of Chicago, Chicago,
Presented at the May 1965 meeting of the Society for Ill. 60637.Pediatric Research, Philadelphia, Pa.
934

PULMONARYEDEMAAND PERICAPILLARY PRESSURE
Introduction
Starling's law of transcapillary exchange de-fines the forces governing the bulk movement ofwater between the vascular and the extravascularcompartments (1). According to this law thetranscapillary movement of fluid is the conse-quence of an imbalance between opposing filtrativeand absorptive forces; the magnitude of the nettransfer is a function of the filtration coefficient,k (2).
Fluid movement = k (Pc + 7rif - Pif - 7rpl),where k = filtration coefficient (milliliters per sec-ond per square centimeter per millimeter Hg AP),Pc = capillary hydrostatic pressure (millimetersHg), 7rif = osmotic pressure of interstitial fluidproteins (millimeters Hg), Pif = pericapillary hy-drostatic pressure (millimeters Hg), and 7rpl =osmotic pressure of plasma proteins (millimetersHg).
Although it is not always possible to demon-strate the operation of Starling's law in singlecapillaries (3), it is generally agreed that thisformulation does account for the forces governingthe transcapillary exchange of water in tissues(2).
The recent studies of Guyton and Lindsey in-dicate that Starling's law of transcapillary ex-change also applies to the lungs (4). In thesestudies, the accumulation of water in lung tissueof dogs was found to be directly related to theintravascular forces (PLA - 7rpl) ; pericapillaryforces exerted a negligible influence. Moreover,by setting the interstitial forces (7rff - P1f) equalto zero, and solving the Starling equation, theyderived a filtration coefficient for the capillariesof the dog lung, viz., 0.22 g per g dry lung perhour per mmHg AP (4).
In the course of studies designed to quantify pul-monary edema in the intact dog by a special ap-plication of the indicator-dilution principle (5),we noted, in contrast to the results of Guyton andLindsey, that the rate of increase in the watercontent of lung tissue was not linearly related tothe intravascular forces (PLA - 7rpl), implyingthat unmeasured forces, which they had consid-ered to be negligible, were actually exerting ap-preciable effects. In keeping with our experi-mental observations were both clinical and theo-retical considerations: -1) The high levels of
PLA -7rp1 are frequently not associated with pul-monary edema in man (6-8); these exceptionshave been attributed either to a decrease in capil-lary permeability (9) or to an expanded lymphaticdrainage. 2) The force exerted by surface tensionat the pulmonary air-fluid interface, which pre-sumably affects pericapillary (and therefore trans-capillary) pressure (10), would be expected tochange progressively during pulmonary edema(11, 12).
To assess the importance of pericapillary forcesin governing the transcapillary filtration of waterin the lungs, we undertook a systematic study ofStarling's law as applied to the pulmonary capil-laries. From these studies, we were able to esti-mate the filtration coefficient of the fluid-exchang-ing vessels of the lungs and to appraise itsmeaning as a measure of pulmonary "capillarypermeability."
Methods
Thirty-nine mongrel dogs weighing 8 to 18 kg wereanesthetized with intravenous pentobarbital, 25 mg perkg of body weight. The trachea was intubated with acuffed endotracheal tube. The animals were placed inthe prone position with the forelimbs and pelvis supportedoff the table, so that breathing would not be mechanicallyrestricted. Breathing was spontaneous, but the lungswere fully inflated every 10 minutes by a Bird respirator.
A standard experimental procedure was used to pro-mote the extravascular accumulation of lung water.This involved the combination of pulmonary venous hy-pertension and hemodilution (5). Partial pulmonary ve-nous obstruction was produced by passing a double-lumen,end-hole balloon catheter retrogradely, under fluoroscopiccontrol, through the aortic and mitral valves, and in-flating the balloon in the left atrium with 3.5 ml of radi-opaque material. Hemodilution and pulmonary venous(and capillary) hypertension were rapidly produced bythe intravenous infusion of isotonic saline. Left atrialpressure was measured through the hole in the end ofthe balloon catheter. Other catheters were also placedunder fluoroscopic control for the measurement of pulmo-nary arterial, aortic arch, and right atrial pressures (5).All vascular pressures were measured with StathamP23Db strain gauges and recorded on a multichannelphotographic recorder (Electronics for Medicine modelDR8). The zero reference level for the pulmonary ar-terial and the left atrial pressures was the tip of therespective catheters as determined fluoroscopically; eachgauge was calibrated during each experiment with amercury manometer. For the purpose of this study, thepulmonary capillary pressure was considered to be iden-tical to the pulmonary venous and left atrial pressures(PA) . The pulmonary transcapillary pressure differ-
935

LEVINE, MELLINS, SENIOR, AND FISHMAN
ence (PLA -7rpI) is therefore defined as the differencebetween the left atrial pressure and the plasma colloidosmotic pressure (Tpi).
The left atrial and pulmonary arterial pressures weremonitored continuously during each experiment. At 15-to 30-minute intervals, systemic arterial blood sampleswere drawn; measurements were made of blood pH andgases, hematocrit, total proteins, and plasma colloid os-motic pressure. Oxygen saturation was measured by themethod of Van Slyke and Neill and the Pcos was mea-sured from the arterial C02 content and pH by the linecharts of Van Slyke and Sendroy. Total serum pro-tein concentration was obtained by means of a Hitachihand refractometer (13). The colloid osmotic pressurewas measured directly with a Hepp-Brown osmometer(2).
Two methods were employed for the determination ofthe amount of water in the lungs. The first was thedouble indicator-dilution technique of Chinard and Enns(14), using T-1824 as the nondiffusible indicator andtritiated water as the diffusible indicator, as previouslydescribed from this laboratory (5). By this approachan extravascular volume of distribution of tritiated wa-ter in the lungs (VTHOL) is calculated as the differencebetween the volume of dilution of tritiated water(VTHo) and of T-1824 (VT-mu4). This technique per-mits serial measurements of lung water during thecourse of an experiment. Previous work in this labora-tory has shown that this single-circulation indicator-di-lution volume consistently measures approximately one-half of the total lung water, both in normal and edema-tous lungs (5).
The recovery of tritiated water from the aorta afterthe injection of 30 ,sc into the main pulmonary arterywas measured 20 times in 10 dogs under control condi-tions of these experiments, and 20 times in 10 dogs thathad various degrees of experimentally induced pulmo-nary edema. The average recovery during control con-ditions was 28.4 /Ac (SE = 1.1) and during pulmonaryedema was 30.7 ,uc (SE=0.8). The difference betweenthese means was not statistically significant.
The recovery of tritiated water relative to T-1824 wasdetermined by plotting the simultaneous T-1824 and triti-ated water concentrations as fractions of the administereddose of each indicator. The resulting single-circulation,time-concentration curves were corrected for recircu-lation by means of a semilogarithmic plot, in the con-ventional manner (14). The areas under the correctedsimultaneous curves were compared 10 times in 5 dogsunder control conditions, and 10 times in 5 dogs withpulmonary edema; they agreed within 10% in allinstances.
The value for VTHOL in normal dogs was found to be3.5 ± 0.9 ml per kg body weight, and increments of 2 mlper kg body weight or more could be detected reliably(5).
The second method involved the direct measurement ofthe total amount of water in the lungs at autopsy.The animal was exsanguinated and the lungs were re-moved and drained of their residual blood by a combina-
tion of gravity and gentle milking, care being taken toconserve any fluid issuing from the airways. The blood-less lungs were then weighed before and after dehydra-tion. The increment in total lung water was calculatedfor each animal as the difference between the water con-tent of the lungs at autopsy, in grams of water per gramof dry lung, and the average value for the water contentof the lungs of 10 normal dogs whose lungs had beenprepared in exactly the same way; in these 10 controldogs, the total lung water averaged 3.6 g of water per gof dry lung (SE= 0.2). The rates of accumulation oflung water were calculated per hour of experimentalperiod, and were expressed in terms of per unit averagepressure difference (PLA - 7r) during each experiment.In practice, the following formulation was used: Rate ofaccumulation= [total lung water (grams per gram drylung) - 3.6 (grams per gram dry lung) ]/ [duration(hours) X average (PLA - 7rpl) (millimeters Hg)].
The sequence of events was as previously described(5). After the catheters had been positioned, the con-
trol blood pressures were recorded, blood samples weredrawn, and the double indicator-dilution study was donein duplicate. The left atrial balloon was then inflated,and a rapid intravenous infusion of warmed isotonic sa-line into the right atrium was begun. The left atrialpressure increased abruptly, whereas the hematocrit, theconcentration of serum proteins, and the colloid osmoticpressure of the plasma decreased. By adjusting thespeed of infusion, we set the level of pulmonary venoushypertension at a predetermined level, always appreciablyhigher than mean alveolar pressure, for the duration ofthe experiment. The indicator-dilution study was re-peated, in duplicate, at the midway point and at the endof the experiment. At the close of the experiment theinfusion was stopped, the dog was rapidly exsanguinated,and the lungs were removed and analyzed for their wa-ter content.
Four variations of this experimental design were used,as shown in Table I.
Group I (low pressure, low gradient). In 9 dogs,the left atrial pressure was maintained at 14 to 22 mmHg, and the colloid osmotic pressure of the plasma at3 to 10 mmHg during a 2-hour saline infusion. Thetranscapillary pressure differences (PLA -rp') rangedfrom 4 to 17 mmHg, with an average of 12 mmHg.
Group II (high pressure, high gradient). In 13 dogs,the left atrial pressure was maintained at 23 to 35 mmHg and the colloid osmotic pressure of the plasma at 2to 8 mmHg during a 1-hour saline infusion. The trans-capillary pressure differences ranged from 18 to 32 mmHg, with an average of 25 mmHg.
Group III (high pressure, low gradient). In 6 ani-mals the left atrial pressure was maintained at 25 to 32mmHg and the colloid osmotic pressure of the plasmaat 12 to 20 mmHg during a 2-hour infusion of 6% dex-tran in isotonic saline. The transcapillary pressure dif-ference ranged from 10 to 19 mmHg, with an averageof 13 mmHg.
Group IV (lymphatic obstruction). In 11 dogs, rightlymphatic duct drainage was obstructed before the test
936

PULMONARYEDEMAAND PERICAPILLARY PRESSURE
a---I - C1U)
e-4
- -4C4Clo
U) 00 00 X 0% +ot-. oX0 0-4 -C m Cm C CS
CE) U) 4 Cl %0 4 _ a- t-- Cl Cl - CE CV 4V V
4 +4 00 ) U) 0 0 ~4 *st1da-r U) to No o o
00 0 00 ' CE) 0 U) CE)
+4 t- U) U) %O U) -z 0 0%d4 Cl 't Cl c'~ 4 cl -1
00%
0o6CU
Ul)Clia--
eq U) 000% 0% a--
CE o U)
I- .41 QE) CE CE)
U) U) 0%0% 0% 00
mE 0 00
d4 CE (N4
\0 00 0%CE Cli Clr- t- r-~
Cl4 C4 -t 'Tr
V4-4 a--It r- t-
C) C)C4V- C4 Cl4 V-
0UD
U)U)
o
CE)
00oamE
0CE
U) ) d4U) >a--
U) 0 a-Ci CD Xo
Xo aO 0
0,% 00 0%
o 0 00
%0 0 '0* . .dl
Nio a XoCl Cl C"!t- r- t
o ~ o -
4 L. 10t_ .
0 0 r. 0 0 0 0 0 r. 0 0 0 0 0
0 .4 = 0 X -4 0 '4 0 _. =j C4 U34 U C4 U C U
3~~~~~00eqrl. 00~~~~'
C4 C4 C4
..~: .40
14o %O to
.4 C~~C-) -d
C > d > au
0
937
>t
t
0604)
I..
04
t m
C'4C1
44
44
oo
*I@'d Vo
-4i
U1)
(5*.
'0
'4
00 00
0% 00
cE 00
m 00Cl *
C U)Cl Cl
Ul) C)01% a--
.4 %O
- 0a-It -.
*t
r.
'-4
4t.
t
d4 C
e
0rl -
CE) Clia-- a--
I-.
0.
0
Cd
Cd
0
40.4
0
U)
4-J0
0
0
*
4-i
U
0
a)
UX
-U)blo
~ndA4
k
4-o
W
~44I
20
.0 co
.~oA
cd tQ
64-C
o
0.>Y
cda)
* N--
4i
4'
oV
0
.4
o co
Iz
03
0%

LEVINE, MELLINS, SENIOR, AND FISHMAN
periods. Through a cervical incision the right externaljugular, the right subclavian, and the innominate veinswere isolated and ligated. All surrounding tissue was
thoroughly cauterized with an electrocautery. Immedi-ately after this procedure, the protocol of group I was
used in 6 animals (group IVA) and of group II in 5additional animals (group IVB).
Results
Group I (low pressure, low gradient). In eachof the 9 dogs in which the left atrial pressure ex-
ceeded the colloid osmotic pressure of the plasmaby 4 to 17 mmHg for a period of 2 hours, thewater content of the lungs determined at autopsywas abnormally high. The difference between theaverage water content at autopsy (5.6 g per g drylung, SE = 0.3) and the average of 10 control de-terminations of total lung water (3.6 g per g drylung, SE = 0.2) is statistically significant (p <0.01). The average rate of accumulation was 0.9g per g dry lung per hour (SE = 0.2), or 0.09 g
per g per hour per mmHg transcapillary pressure
difference (SE = 0.01) (Table II). Comparisonof the measurements of extravascular lung waterby the indicator-dilution technique (VTHOL) dur-ing the control period and at 1 hour and 2 hoursshows no significant differences (p > 0.05) (Ta-ble II).
Group II (high pressure, high gradient). Whenthe left atrial pressure exceeded the colloid os-
motic pressure of the plasma by 18 to 32 mmHg,water accumulated in the lungs at such a ratethat the experiments could not be prolonged be-yond 1 hour. Based on determinations of the wa-
ter content of the lungs at autopsy, the rate of ac-
cumulation of water in these dogs averaged 5.6g per g per hour (SE = 0.8), or 0.22 g per g per
hour per mmHg AP (SE = 0.03). Comparisonof the mean rates of water accumulation in groups
I and II, calculated from the water content of thelungs at autopsy and expressed per hour of ex-
TABLE II
The quantity and rate of accumulation of water in the lungs*
Indicator-dilution studies TotalNo. Time of lung Rate of accumulation
of dogs measurement Q VT-1824 VTHO VTHOL water of lung water
ml/min/kg ml/kg ml/kg ml/kg g/gt g/g/hour g/g/hour/mmHg AP
Group I 9 Control 167 13.3 16.8 3.5(Low pressure, (19) (1.2) (1.4) (0.3)low gradient)
1 hour 311 19.5 23.5 4.0(23) (1.3) (1.4) (0.3)
2 hours 259 19.5 23.9 4.4 5.6 0.9 0.09(30) (1.1) (1.3) (0.4) (0.3) (0.2) (0.01)
Group II 13 Control 160 13.3 16.3 3.0(High pressure, (26) (1.2) (1.3) (0.2)high gradient) j hour 337 22.5 27.1 4.6
(31) (1.5) (1.6) (0.5)1 hour 306 21.6 30.0 8.4 9.3 5.6 0.22
(28) (1.3) (1.5) (0.9) (0.8) (0.8) (0.03)
Group III 6 Control 129 12.8 16.8 4.0(High pressure, (15) (1.5) (1.5) (0.3)low gradient)
1 hour 328 21.5 26.0 4.5(31) (3.0) (3.1) (0.4)
2 hours 322 23.9 30.7 6.8 5.8 1.0 0.09(28) (2.5) (2.4) (0.4) (0.1) (0.2) (0.02)
Group IVA 6 Control 148 11.6 14.9 3.3(Lymphatic (29) (0.9) (1.0) (0.3)obstruction,low gradient) 1 hour 241 16.2 20.8 4.6
(39) (1. 1) (1.4) (0.7)2 hours 231 15.4 21.0 5.6 6.2 1.3 0.10
(29) (1.9) (2.0) (0.7) (0.2) (0.1) (0.01)
Group IVB 5 Control 116 9.7 12.2 2.5(Lymphatic (14) (1.1) (1.4) (0.4)obstruction,high gradient) i hour 246 17.2 20.8 3.6
(12) (1. 1) (1. 1) (0.3)1 hour 212 15.6 22.1 6.5 9.2 5.5 0.21
(21) (0.7) (1.2) (0.7) (1.8) (1.8) (0.07)
* Values are presented as means, with standard errors in parentheses. O = cardiac output; VT-1824 - single-circulation indicator-dilutionvolume of T-1824; VTHO = single-circulation indicator-dilution volume of tritiated water; VTI1OL = extravascular volume of dilution of tritiatedwater in the lungs (VTHO -VT-1824).
t Grams of water per gram dry lung.
938

PULMONARYEDEMAAND PERICAPILLARY PRESSURE
perimental period, shows the difference to bestatistically significant (p < 0.01).
The rate of accumulation of lung water ingroups I and II is related to the mean PLA - 7rplin Figure 1; for the sake of comparison, it is ex-pressed per hour of experimental period and permillimeter Hg difference in transcapillary pressure,based on measurements of the water content ofthe lungs at autopsy (see Methods). In 11 ex-periments in which the mean transcapillary pres-sure (PLA - 7rl) was less than 20 mmHg, therate of accumulation of lung water was 0.16 g perg per hour per mmHg or less. In most of theexperiments in which the transcapillary pressuredifference was greater than 20 mmHg, the ratesof water accumulation exceeded those observed atvalues of mean PLA -rp1 less than 20 mmHg.
The patterns of increase in extravascular lungwater, based on sequential use of the indicator-dilution technique (VTHOL) in group II, areshown in Figure 2. The rate of increase inVTHOL appeared to change with time: many ani-mals showed a relatively small increment inVTHOL during the first half hour and a muchlarger increment during the second half hour.The increments in VTHOL were statistically sig-nificant both at 30 and at 60 minutes (p < 0.01)(Table II).
Group III (high pressure, low gradient). Whenthe left atrial pressure was raised to levels ap-
RATE OF 0.40ACCUMULATION
OF 030
LUNG WATEROmOm/gm dry lung/hr/mm Hg
0.10
0 5 10 15 20 25 30
PLA- 7PmmHg
35
FIG. 1. RATE OF ACCUMULATIONOF WATER IN THE
LUNGS AT DIFFERENT LEVELS OF MEAN TRANSCAPILLARY
PRESSUREDIFFERENCE (PLA-7rpi). The rate of accumu-
lation of water in the lungs is expressed per unit of mean
left atrial and plasma colloid osmotic pressure difference(PLA -Tpri). At mean transcapillary pressure differencesof less than 20 mmHg (group I), the rate of accumula-tion of water does not exceed 0.16 g per g per hour per
mmHg AP; at higher pressure differences (group II),most of the rates of accumulation of water are more rapid.
VTHOL 8ml/kg 7-
6-
5-
4
.3
2
0 30 60
TIMEmin
FIG. 2. SERIAL MEASUREMENTSOF EXTRAVASCULARLUNG WATER(VTHOL) AS MEASUREDBY INDICATOR-DILU-TION TECHNIQUEIN THE 13 DOGSOF GROUPII. The rateof increase in VTHOL during each experiment varied withtime even though the transcapillary pressure differencewas held constant throughout each experiment. Most ofthe dogs showed a more rapid increase in VTHOL duringthe second half hour than during the first half hour.
proximating those of group II, but the transcapil-lary pressure difference (PLA -7rpl) was main-tained at low levels comparable to those of groupI by the infusion of dextran, the average rate ofaccumulation of lung water was 1.0 g per g perhour (SE = 0.2), or 0.09 g per g per hour permm Hg AP (SE = 0.02) (Table II). Thisvalue is identical to that for the mean rate of wateraccumulation in group I. The indicator-dilutionstudies (Table II) show no statistically signifi-cant increment in VTHOL during the first hour,and a significant increase during the second hour(p <0.05).
O-GROUPI*-GROUPI 0 0
- .* 0O zt- QO5~
939

LEVINE, MELLINS, SENIOR, AND FISHMAN
9
7
RATE OFACCUMULATION
OF LUNG WATERgm / gm dry lung / h r
5
4
3
2
o L0
a GROUPJYAA GROUP.28 T
0 5 10 15 20 25 30
O-GROUPIO-GROUPI7T
Ad ~~~~~~~~~~~~~~~~~~~~~~~~~~I
5 10 15 20 25 30
PLA 7rp ImmHg
FIG. 3. THE EFFECT OF OBSTRUCTINGTHE RIGHT LYMPHATICDUCTON THE RATE OF ACCUMULATIONOF WATERIN THE
LUNGS. The values are expressed as the mean 1 SD. Left panel: The rate of accumulation of water in the lungsin group I (low pressure, low gradient) is significantly less than in group II (high pressure, high gradient). Rightpanel: The data from the left panel are shown as shaded backgrounds. Superimposed are the data for the two groups
during right lymphatic duct obstruction. There is no statistically significant effect of obstructing lymphatic drainagein these two groups.
Group IV (lymphatic obstruction). The mean
rate of water accumulation in lung tissue afterobstruction of the right lymphatic duct, at pulmo-nary venous and colloid osmotic pressure levelssimilar to those employed in group I, was 1.3 g
per g per hour (SE = 0.1), or 0.10 g per g per
hour per mmHg AP (SE = 0.01) (Table II).There is no statistically significant difference be-tween this mean and that of group I (Figure 3).The indicator-dilution studies showed no statisti-cally significant increment in VTHOLduring theseexperiments (p > 0.05).
When the protocol of group II was applied toanimals with lymphatic obstruction (group IVB),the mean accumulation rate was 5.5 g per g per
hour (SE = 1.8), or 0.21 g per g per hour per mm
Hg AP (SE = 0.07). There is no statisticallysignificant difference between this mean and that ofgroup II (Figure 3). The indicator-dilution stud-ies showed no significant increment in VTHOLduring the first half hour (p > 0.05) and a sig-
nificant increase during the second half hour(p < 0.01).
Discussion
Starling's law. The present study has shownthat the bulk movement of water out of the fluid-exchanging vessels of the lungs cannot be definedsolely in terms of intravascular forces. Two typesof experiment are the basis for this conclusion: 1)Serial determinations of the extravascular volumeof water, at a constant difference between theintravascular hydrostatic pressure (PLA) and theosmotic pressure of the plasma proteins (7rPj), us-
ing an indicator-dilution technique, showed thatthe rate of accumulation of lung water is nonlinearwith respect to time, and 2) determinations of totalwater content of the lung at the end of experimentsperformed at different levels of PLA -7rpl alsoshowed that the relationship between the rate ofaccumulation of lung water and the PLA - 7rpl isnonlinear (Figure 4). Theoretically, the non-
940

PULMONARYEDEMAAND PERICAPILLARY PRESSURE
-GROUPXGROUP X-
RATE OF -
ACCUMULATIONOF LUNG WATER
~ PRESENT.
STUDY WITH THOSE OF GUYTONAND LINDSEY (2). Left
panel: Rate of accumulation of water in the lungs, in
relation to the average transcapillary pressure difference
(PLA -7rpi) in the 9 dogs of group I and in the 13 dogs
of group II. The best visual fit of these data appears to
be a curve, with more rapid accumulations of lung water
at values of PL& - rpi greater than 20 mmHg. This
conclusion is supported by statistical analysis with the
method of weighted least squares (15), which indicates
that the linear hypothesis may be rejected (p < 0.01).
Right panel: The data of Guyton and Lindsey (reference
2, Figure 7) have been recalculated in terms of grams of
water accumulated per gram dry lung per hour, with the
control data of the -present study (lung water = 3.6 g per
g dry lung; plasma colloid osmotic pressure = 16 mm
Hg). For comparison, the data of the present study are
indicated by the shaded area. The two sets of data cor-
respond closely.
linearity could be due to changes either in the un-
measured pericapillary forces [i.e., the interstitial
hydrostatic pressure (Pif) or osmotic pressure of
interstitial fluid proteins (7rjf)], in the filtration
coefficient (k), or in the lymph drainage from the
lungs. Two types of observations in the present
experiments support the idea that pericapillary
forces (Pit or 7ris), rather than a change in the
filtration coefficient or in lymph drainage, are re-
sponsible for the curvilinear relationship between
PLA- rpi and the rate of fluid accumulation: 1)
For a given PLA - Tpi, higher capillary hydro-
static pressures of the order of 30 mmHg, which
might be expected to stretch "pores" (16) or to
increase capillary surface area, did not increase
the rate of accumulation of water in the lungs
above values observed at the lower capillary hydro-
static pressures, and 2) obstruction of the right
lymphatic duct (17,18) did not alter the rate of
accumulation of water in the lungs, either at the
high or the low differences between PLA and 7Tpl.
Pericapillary forces in the edematous lung. Ofthe two pericapillary forces that could be respon-sible for nonlinearity in the relationship betweenthe rate of water accumulation and the PLA - TIA,the hydrostatic pressure of the interstitial fluidseems more likely than the osmotic pressure ofthe proteins in the pulmonary interstitial spaces.This reasoning is based on the fact that the pro-tein content of the interstitial fluid of lung tissue(19) as well as that of systemic tissues appears tobe very low, i.e., of the order of 0.2 to 2.1 g per100 ml, corresponding to a protein osmotic pres-sure of 0.1 to 5 mmHg (2). Consequently, thedesign of the present experiments, which involvedhemodilution and marked reduction in the con-centration, and therefore in the osmotic pressure,of the plasma proteins made it unlikely that theprotein concentration of the interstitial fluid wouldremain at a high level, or that its osmotic pressurewould constitute an appreciable pericapillaryforce.
Thus, by exclusion, the present experiments sug-gest that the pericapillary hydrostatic pressuremay have an appreciable effect on the exchangeof fluid across the pulmonary capillary membrane.Although the nature of the forces responsible forthis pericapillary pressure is not entirely clear, itseems that surface tension at the alveolar air-fluidinterface may be involved (20). In particular, inthe group II experiments of the present study, theheightened surface tension that occurs as fluid ac-cumulates in alveoli (11, 12) may, in turn, havecontributed to the formation of edema.
A nonlinear rate of accumulation of fluid withrespect to Pc -7rpl has been observed in subcu-taneous tissues by McMaster (21) and by Guyton(22-24). These studies indicate that 1) trans-capillary filtration of water in subcutaneous tissuesis associated with a change in pericapillary hydro-static pressure from a negative to a positive value,2) the accumulation of fluid in the pericapillaryinterstitium may alter the pressure-volume char-acteristics of the tissue in such a way as to permitfluid accumulation to continue without progressiveincrease in tissue pressure, and 3) as interstitialfluid pressure rises above atmospheric, the re-sistance to the movement of fluid through the tis-sue spaces decreases markedly.
Similar changes in the interstitial tissue of thelung would be required to explain the observationsof the present study. This is demonstrated by
941
LEVINE, MELLINS, SENIOR, AND FISHMAN
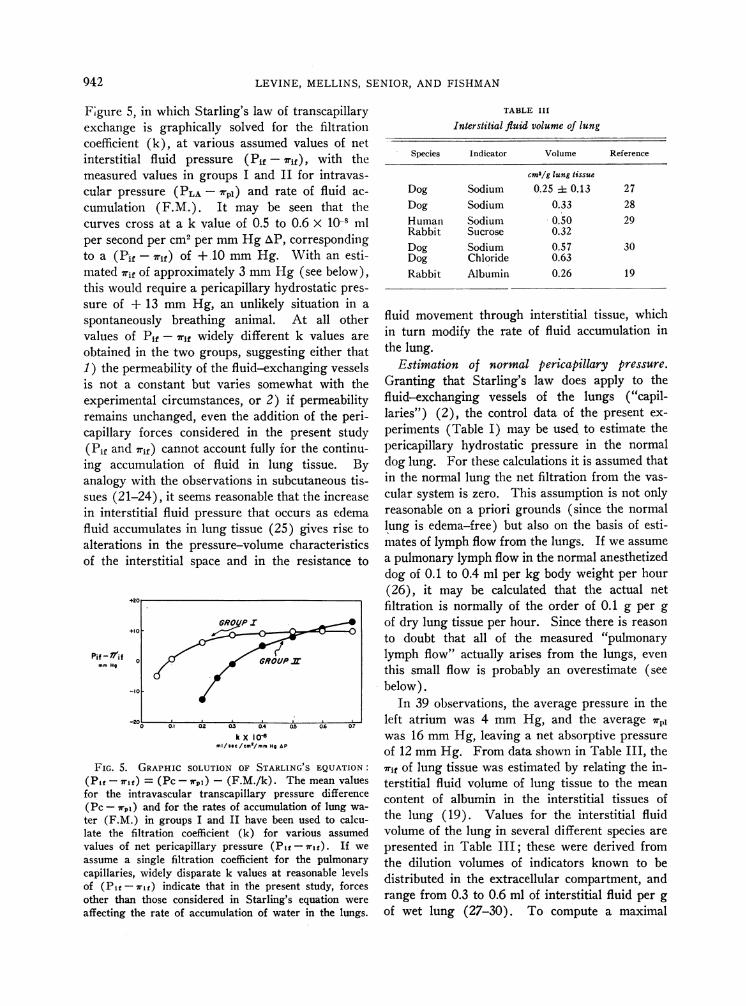
Fgure 5, in which Starling's law ofexchange is graphically solved forcoefficient (k), at various assumedinterstitial fluid pressure (Pif -
measured values in groups I and Icular pressure (PLA -7rpi) and ra
cumulation (F.M.). It may becurves cross at a k value of 0.5 toper second per cm2 per mmHg AP,to a (Pif -7rif) of + 10 mmHg.mated rif of approximately 3 mmHthis would require a pericapillary hysure of + 13 mmHg, an unlikelyspontaneously breathing animal.values of Pif -7rif widely differentobtained in the two groups, suggest1) the permeability of the fluid-exciis not a constant but varies some
experimental circumstances, or 2)remains unchanged, even the additicapillary forces considered in the(Pif and 7rif) cannot account fully fRing accumulation of fluid in lun
analogy with the observations in sulsues (21-24), it seems reasonable thin interstitial fluid pressure that oc
fluid accumulates in lung tissue (25alterations in the pressure-volumeof the interstitial space and in th(
Pif - HifmmHo
+20
GROUPI+10 -
0 GROUW
-10
-21' -10 0.l 0§2 0.3 0.4
k X IOCMI/SeC/CIH'/Im Ho aF
FIG. 5. GRAPHIC SOLUTION OF STARL(Pi -7rf) = (Pc-7rpi) - (F.M./k).for the intravascular transcapillary pro(Pc -7rg,) and for the rates of accumulater (F.M.) in groups I and II have beelate the filtration coefficient (k) forvalues of net pericapillary pressure (Piassume a single filtration coefficient foicapillaries, widely disparate k values atof (P1f- rif) indicate that in the pressother than those considered in Starling'affecting the rate of accumulation of wa
f transcapillaryr the filtration
values of net7rif), with the'I for intravas-Lte of fluid ac-
seen that the0.6 x 10-8 mlcorrespondingWith an esti-
.g (see below),rdrostatic pres-
situation in a
At all othert k values are
Linz either that
TABLE III
Interstitial fluid volume of lung
Species Indicator Volume Reference
cm3/g lung tissue
Dog Sodium 0.25 :1 0.13 27Dog Sodium 0.33 28Human Sodium 0.50 29Rabbit Sucrose 0.32Dog Sodium 0.57 30Dog Chloride 0.63Rabbit Albumin 0.26 19
fluid movement throughin turn modify the ratethe lung.
interstitial tissue, whichof fluid accumulation in
langing vessels Estimation of normal pericapillary pressure.what with the Granting that Starling's law does apply to theif permeability fluid-exchanging vessels of the lungs ("capil-on of the peri- laries") (2), the control data of the present ex-present study periments (Table I) may be used to estimate the
or the continu- pericapillary hydrostatic pressure in the normalvg tissue. By dog lung. For these calculations it is assumed that
bcutaneous tis- in the normal lung the net filtration from the vas-iat the increase cular system is zero. This assumption is not onlycurs as edema reasonable on a priori grounds (since the normal) gives rise to lung is edema-free) but also on the basis of esti-characteristics mates of lymph flow from the lungs. If we assume
e resistance to a pulmonary lymph flow in the normal anesthetizeddog of 0.1 to 0.4 ml per kg body weight per hour(26), it may be calculated that the actual netfiltration is normally of the order of 0.1 g per g
of dry lung tissue per hour. Since there is reason
to doubt that all of the measured "pulmonary
lymph flow" actually arises from the lungs, even
this small flow is probably an overestimate (seebelow).
In 39 observations, the average pressure in the
S0.6 027 left atrium was 4 mmHg, and the average 7rpIwas 16 mmHg, leaving a net absorptive pressure
of 12 mmHg. From data shown in Table III, theING S EQUATION: 7rif of lung tissue was estimated by relating the in-The mean values terstitial fluid volume of lung tissue to the meanessure difference content of albumin in the interstitial tissues ofLtiOn of lung wa-
n used to calcu- the lung (19). Values for the interstitial fluidvarious assumed volume of the lung in several different species areif- 71f). If we presented in Table III; these were derived fromr the pulmonary the dilution volumes of indicators known to bereasonable levels distributed in the extracellular compartment,
and
ent study, forces's equation were range from 0.3 to 0.6 ml of interstitial fluid per gLter in the lungs. of wet lung (27-30). To compute a maximal
942

PULMONARYEDEMAAND PERICAPILLARY PRESSURE
value for Uri in the present study, we made the fol-lowing assumptions: 1) The minimal value for theinterstitial fluid volume of the lung in the normaldog is 0.3 ml per g wet lung; 2) the mean con-tent of albumin in normal lung tissue of the dogis the same as that in the rabbit, viz., 3.36 mg perg wet lung (19); 3) albumin and globulin arepresent in lung tissue of the dog in equal concen-trations. The osmotic pressures correspondingto albumin and globulin concentrations of 3.36mg per 0.3 ml, calculated from the empiric equa-tions of Landis and Pappenheimer (2), are 3.0mmHg and 1.8 mmHg, respectively, or a totalof 4.8 mmHg. A similar computation based ona maximal value for interstitial fluid volume, i.e.,0.6 ml per g wet lung, provides a minimal esti-mate of 7Tif, viz., 2.4 mmHg. If we assume anaverage of 3 mmHg for 7rif, the net pericapillaryhydrostatic pressure is calculated to be approxi-mately - 9 mmHg. Values for osmotic pres-sure of interstitial fluid proteins in other tissuesrange from 0.1 to 5.0 mmHg (2). If these val-ues for 7rf of 0.1 to 5 mmHg are substituted inthe Starling equation, the pericapillary pressure(Pif) of lung tissue at which there would be nonet movement of fluid is again of the order of - 9mmHg, i.e., - 7 to - 12 mmHg. All of thesevalues for pericapillary pressure in the lungs arealso of the same order of magnitude as the - 7mmHg obtained by Guyton from capsules insubcutaneous tissues (22).
Two aspects of the present study warrant furtherconsideration with respect to the estimation ofpericapillary pressure: 1) Both the control leftatrial pressures and the control colloid osmoticpressures of the plasma were somewhat lower thanthose reported by others (31, 32); the reasonsfor these discrepancies are not clear. However,the difference between the more conventionalvalues for left atrial pressure (7 to 10 mmHg)and for plasma colloid osmotic pressure (17 to 22mmHg) is still the same as in the present study,and the pericapillary pressure is again calculatedto be - 9 mmHg. 2) The left atrial pressurewas used as a measure of pulmonary "capillary"pressure. In the present experiments the differ-ences between mean pulmonary arterial and meanleft atrial pressures averaged 7 mmHg. If pul-monary capillary pressure is assumed to exceedleft atrial pressure by one-half of this difference,the pericapillary hydrostatic pressure would not
be markedly changed, i.e., from - 9 to - 6 mmHg.
The flow of pulmonary lymph. The presenceof a negative interstitial pressure in normal lungsraises a question as to the driving force for theflow of lymph from the lungs (subatmosphericpressure) to the systemic veins (above atmosphericpressure). One possible explanation for this re-lationship is that the flow of pulmonary lymph oc-curs only during periods of increased intrathoracicpressure such as coughing, i.e., when intrapleural(and pulmonary interstitial pressure) exceeds sys-temic venous pressure. These pressure relation-ships also suggest that experiments which providea continuous flow of lymph from the right lym-phatic duct have either upset the normal pressuregradients from pulmonary lymphatics to systemicveins, e.g., by thoracotomy, or are collecting lymphthat does not derive entirely from the pulmonarylymphatics, e.g., from the pleura, pericardium,and peritoneum (26).
Filtration coefficients. Since the bulk flow ofwater in tissues does follow Starling's law, filtra-tion coefficients have been found to be useful forcomparing the permeability characteristics of dif-ferent tissues (2). Filtration coefficients for thedog lung can be calculated from the data of groupsI and II by substitution in Starling's law, as-suming that the interstitial fluid pressure (Pif)approaches and exceeds zero as interstitial edemaaccumulates (23, 25). The filtration coefficient,k, is expressed per square centimeter of capillarysurface area; the alveolar surface area of the dog,approximately 50 m2 (33), is taken as an estimateof the pulmonary capillary surface area for thedogs of groups I and II, having an average bodyweight of 14 kg and an average dry lung weightof 23 g. For a (Pif - lrif) of zero, the filtrationcoefficient calculated from the mean data of groupI is 0.12 x 10⁻⁸, and from the mean data of groupII, 0.26 X 10- ml per second per cm2 per mmHgAP. These values, used only as an indication ofthe order of magnitude of the true filtration coeffi-cient for lung tissue, are approximately one-tenthto one-twentieth that of canine muscle capillaries(2).
AcknowledgmentsWeare grateful to Professor Richard Skalak for many
animated discussions, to Dr. Lyon Hyams for statisticaladvice, and to Mr. Robert J. Molz and Miss MildredDaise for technical assistance.
943

LEVINE, MELLINS, SENIOR, AND FISHMAN
References
1. Starling, E. H. On the absorption of fluids fromthe connective tissue spaces. J. Physiol. (Lond.)1896, 19, 312.
2. Landis, E. M., and J. R. Pappenheimer. Exchangeof substances through the capillary walls in Hand-book of Physiology, sect. 2, vol. 2, Circulation,W. F. Hamilton and P. Dow, Eds. Washington,D. C., American Physiological Society, 1963.
3. Wiederhielm, C. A. Analysis of small vessel func-tion (abstract) in Physical Bases of CirculatoryTransport: Regulation and Exchange. Aspen,Colo., September 1966.
4. Guyton, A. C., and A. W. Lindsey. Effect of ele-vated left atrial pressure and decreased plasmaprotein concentration on the development of pul-monary edema. Circulat. Res. 1959, 7, 649.
5. Levine, 0. R., R. B. Mellins, and A. P. Fishman.Quantitative assessment of pulmonary edema. Cir-culat. Res. 1965, 17, 414.
6. Hayward, G. W. Pulmonary oedema. Brit. med. J.1955, 1, 1361.
7. Gorlin, R., B. M. Lewis, F. W. Haynes, R. J. Spiegl,and L. Dexter. Factors regulating pulmonary"capillary" pressure in mitral stenosis. Amer.Heart J. 1951, 41, 834.
8. Dexter, L., J. W. Dow, F. W. Haynes, J. L. Whit-tenberger, B. G. Ferris, W. T. Goodale, and H. K.Hellems. Studies of the pulmonary circulation inman at rest. Normal variations and the interrela-tions between increased pulmonary blood flow, ele-vated pulmonary arterial pressure, and high pul-monary "capillary" pressures. J. clin. Invest. 1950,29, 602.
9. Araujo, J., and D. S. Lukas. Interrelationshipsamong pulmonary "capillary" pressure, blood flowand valve size in mitral stenosis. The limitedregulatory effects of the pulmonary vascular re-sistance. J. clin. Invest. 1952, 31, 1082.
10. Bruderman, I., K. Somers, W. K. Hamilton, W. H.Tooley, and J. Butler. Effect of surface tensionon circulation in the excised lungs of dogs. J. appl.Physiol. 1964, 19, 707.
11. Johnson, J. W. C., S. Permutt, J. H. Sipple, andE. S. Salem. Effect of intra-alveolar fluid on pul-monary surface tension properties. J. appl.Physiol. 1964, 19, 769.
12. Said, S. I., M. E. Avery, R. K. Davis, C. M. Baner-jee, and M. El-Gohary. Pulmonary surface ac-tivity in induced pulmonary edema. J. clin. Invest.1965, 44, 458.
13. Neuhausen, B. S., and D. M. Rioch. The refracto-metric determination of serum proteins. J. biol.Chem. 1923, 55, 353.
14. Chinard, F. P., and T. Enns. Transcapillary pul-monary exchange of water in the dog. Amer. J.Physiol. 1954, 178, 197.
15. Williams, E. J. Regression Analysis. New York,John Wiley, 1959.
16. Shirley, H. H., Jr., C. G. Wolfram, K. Wasserman,
and H. S. Mayerson. Capillary permeability tomacromolecules: stretched pore phenomenon.Amer. J. Physiol. 1957, 190, 189.
17. Uhley, H., S. E. Leeds, J. J. Sampson, and M.Friedman. Some observations on the role of thelymphatics in experimental acute pulmonary edema.Circulat. Res. 1961, 9, 688.
18. Rabin, E. R., and E. C. Meyer. Cardiopulmonary ef-fects of pulmonary venous hypertension with spe-cial reference to pulmonary lymphatic flow. Cir-culat. Res. 1960; 8, 324.
19. Rothschild, M. A., M. Oratz, C. D. Evans, andS. S. Schreiber. Role of hepatic interstitial albu-min in regulating albumin synthesis. Amer. J.Physiol. 1966, 210, 57.
20. Clements, J. A. Pulmonary edema and permeabilityof alveolar membranes. Arch. environm. Hlth1961, 2, 280.
21. McMaster, P. D. Factors influencing the intermit-tent passage of Locke's solution into living skin.J. exp. Med. 1941, 73, 85.
22. Guyton, A. C. A concept of negative interstitialpressure based on pressures in implanted per-forated capsules. Circulat. Res. 1963, 12, 399.
23. Guyton, A. C. Interstitial fluid pressure: II. Pres-sure-volume curves of interstitial space. Circulat.Res. 1965, 16, 452.
24. Guyton, A. C., and K. Scheel. Interstitial fluid pres-sure. III. Its effect on resistance to tissue fluidmobility. Circulat. Res. 1966, 19, 412.
25. West, J. B., C. T. Dollery, and B. E. Heard. In-creased pulmonary vascular resistance in the de-pendent zone of the isolated dog lung caused byperivascular edema. Circulat. Res. 1965, 17, 191.
26. Courtice, F. C. Lymph flow in the lungs. Brit.med. Bull. 1963, 19, 76.
27. Taylor, A. E., A. C. Guyton, and V. S. Bishop.Permeability of the alveolar membrane to solutes.Circulat. Res. 1965, 16, 353.
28. Chinard, F. P., T. Enns, and M. F. Nolan. Pulmo-nary extravascular water volumes from transittime and slope data. J. appl. Physiol. 1962, 17,179.
29. Bauman, A., M. A. Rothschild, R. S. Yalow, andS. A. Berson. Pulmonary circulation and trans-capillary exchange of electrolytes. J. appl. Physiol.1957, 11, 353.
30. Fishman, A. P., E. L. Becker, H. W. Fritts, Jr., andH. 0. Heinemann. Apparent volumes of distribu-tion of water, electrolytes and hemoglobin withinthe lung. Amer. J. Physiol. 1957, 188, 95.
31. Hellems, H. K., F. W. Haynes, L. Dexter, and T. D.Kinney. Pulmonary capillary pressure in ani-mals estimated by venous and arterial catheteri-zation. Amer. J. Physiol. 1948, 155, 98.
32. Kerkhof, A. C. Plasma colloid osmotic pressure asa factor in edema formation and edema absorption.Ann. intern. Med. 1937, 11, 867.
33. Tenney, S. M., and J. E. Remmers. Comparativequantitative morphology of the mammalian lung:diffusing area. Nature (Lond.) 1963, 197, 54.
944