Chronic Respiratory Diseases Respiratory Diseases ... This study evaluated three chronic respiratory...
49
Chronic Respiratory Diseases A Comparison of Prevalence, Utilization, and Payments in New Hampshire Medicaid and Commercially Insured Populations A report prepared for the New Hampshire Department of Health and Human Services By the Maine Health Information Center June 2008
-
Upload
nguyenhanh -
Category
Documents
-
view
224 -
download
4
Transcript of Chronic Respiratory Diseases Respiratory Diseases ... This study evaluated three chronic respiratory...

Chronic Respiratory Diseases A Comparison of Prevalence, Utilization, and Payments in New
Hampshire Medicaid and Commercially Insured Populations
A report prepared for the New Hampshire Department of Health and Human Services
By the Maine Health Information Center
June 2008
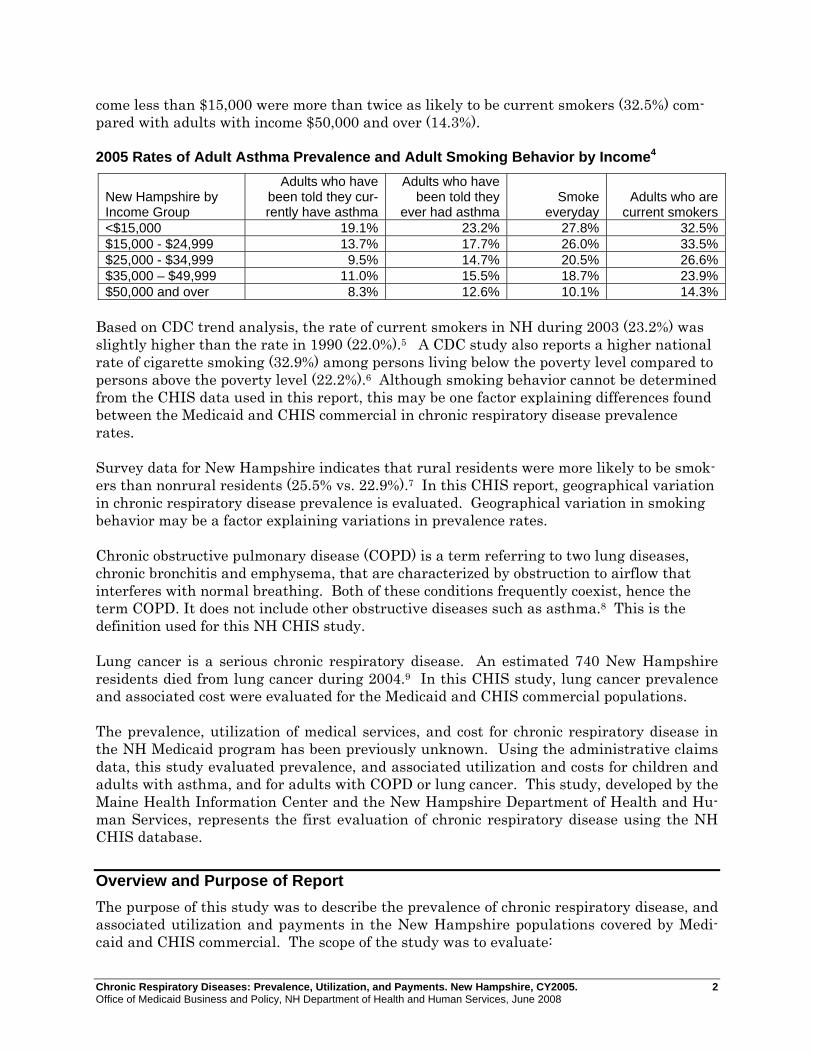
About the New Hampshire Comprehensive Health Care Information System The New Hampshire Comprehensive Health Care Information System (NH CHIS) is a joint project between the New Hampshire Department of Health and Human Services and the New Hampshire Insurance Department. The NH CHIS was created by state statute (RSA 420-G:11-a) to make health care data “available as a resource for insurers, employers, pro-viders, purchasers of health care, and state agencies to continuously review health care utilization, expenditures, and performance in New Hampshire and to enhance the ability of New Hampshire consumers and employers to make informed and cost-effective health care choices.” For more information about the NH CHIS, please visit http://www.nh.gov/nhchis or www.nhchis.org.
About the Study This study was conducted by the Maine Health Information Center (MHIC) under a con-tract with the State of New Hampshire Department of Health and Human Services, Office of Medicaid Business and Policy, titled New Hampshire Comprehensive Health Care In-formation System. The views expressed are those of the authors and do not necessarily represent the views of the MHIC, or the New Hampshire DHHS. For more information contact Karl Finison, Director of Research, Maine Health Information Center, 207-430-0632, [email protected]. Primary Author
• Karl Finison, Director of Research, Maine Health Information Center Contributors Office of Medicaid Business and Policy, New Hampshire Department of Health and Human Services
• Andrew Chalsma, Chief, Bureau of Data and Systems Management • Doris Lotz, MD, MPH, Medicaid Medical Director • Christine Shannon, Chief, Bureau of Health Care Research • Diane Vieira, Bureau of Data and Systems Management • Janet Horne, Bureau of Data and Systems Management
Maine Health Information Center
• Natasha Ranger, Senior Programmer Analyst Division of Public Health Services, New Hampshire Department of Health and Human Services
• Elizabeth Traore, Asthma Epidemiologist

Chronic Respiratory Diseases: Prevalence, Utilization, and Payments. New Hampshire, CY2005. ii Office of Medicaid Business and Policy, NH Department of Health and Human Services, June 2008
TABLE OF CONTENTS
Executive Summary..................................................................................................................................................... iii
Introduction ...................................................................................................................................................................1 Overview and Purpose of Report...............................................................................................................................2 Data Sources and Methods ........................................................................................................................................3 Population Studied in the Report ...............................................................................................................................3 Interpretation of Results and Limitations ..................................................................................................................4
Results ...........................................................................................................................................................................6 Asthma – Prevalence, Utilization, and Payments ......................................................................................................6 Chronic Obstructive Pulmonary Disease – Prevalence, Utilization, and Payments.................................................15 Lung Cancer – Prevalence, Utilization, and Payments ............................................................................................23
Discussion and Next Steps...........................................................................................................................................27 Next Steps................................................................................................................................................................29
Appendices ..................................................................................................................................................................31 Appendix 1: Chronic Respiratory Disease in New Hampshire – Study Methods....................................................32 Appendix 2: NH Medicaid Eligibility Collapsed Groupings...................................................................................36 Appendix 3: Health Analysis Area Definitions .......................................................................................................37
References ...................................................................................................................................................................41

Chronic Respiratory Diseases: Prevalence, Utilization, and Payments. New Hampshire, CY2005. iii Office of Medicaid Business and Policy, NH Department of Health and Human Services, June 2008
EXECUTIVE SUMMARY This study evaluated three chronic respiratory diseases: asthma, chronic obstructive pul-monary disease (COPD), and lung cancer. New Hampshire (NH) Medicaid and NH CHIS commercial administrative eligibility and claims data for services rendered during calendar (CY) year 2005 were used to study disease prevalence and associated utilization and pay-ments.‡ Key Findings:
• During CY2005, 11,004 members with asthma, 4,758 adults with COPD, and 272 adults with lung cancer covered by Medicaid and 18,240 members with asthma, 3,962 members with COPD, and 329 members with lung cancer covered by CHIS commercial were studied.
Asthma
• For Medicaid-only (no Medicare coverage) members, 8,328 (9.6%) had an asthma di-agnosis during the year and for Dual Eligible members with both Medicaid and Medicare coverage, 2,676 (14.4%) had an asthma diagnosis during the year.
• Among CHIS commercial members, 18,240 (5.3%) were identified as having any
asthma diagnosis during CY2005.
• For members with asthma, the age-standardized* outpatient hospital ED rate for Medicaid-only (397 per 1,000 members) was 2.4 times higher than the CHIS com-mercial rate (169 per 1,000 members).
• The inpatient hospitalization rate for Medicaid-only (64 per 1,000 members) was 2.1
times higher than the CHIS commercial rate (30 per 1,000 members).
• The office-clinic rate for Medicaid-only (2,136 per 1,000 members) was 5 percent lower than the CHIS commercial rate (2,252 per 1,000 members).
• Although Medicaid typically pays less per service than CHIS commercial, the age-
standardized payment PMPM rate for claims with a respiratory diagnosis and respi-
‡ This study was based on standard CHIS reports for chronic respiratory disease developed June 11, 2007 for Medicaid and July 31, 2007 for CHIS Commercial. Utilization and payment reports were revised and updated January 31, 2008. Due to data base changes, numbers reported here may not match numbers in new versions of reports created after these dates. Members were identified as having asthma, COPD, or lung cancer based on finding a single diagnosis on any administrative claim during the year. Payment and utilization were based on the member’s payments and use of services during the entire year for claims with a respiratory disease diagnosis or respiratory medications only. * Indirect standardization of rates for age differences in the Medicaid-only and CHIS commercial populations was used in this report to provide more accurate comparisons of the two populations which have different age distributions. See Appendix for more information.

Chronic Respiratory Diseases: Prevalence, Utilization, and Payments. New Hampshire, CY2005. iv Office of Medicaid Business and Policy, NH Department of Health and Human Services, June 2008
ratory medications for members with asthma was four percent higher in Medicaid-only ($104) compared to CHIS commercial ($100).
Chronic Obstructive Pulmonary Disease (COPD)
• Of the 4,758 members covered by Medicaid with COPD, 3,494 were Dual Eligible and 1,264 were Medicaid-only.
• Excluding Dual Eligible members, the COPD prevalence rate for Medicaid-only
members (6.1%) was 3.8 times the prevalence rate for CHIS commercial (1.6%).
• For members with COPD, the age-standardized outpatient hospital ED visit rate for Medicaid-only (451 per 1,000 members) was 2.5 times higher than the CHIS com-mercial rate (181 per 1,000 members).
• The inpatient hospitalization rate for Medicaid-only (266 per 1,000 members) was
1.8 times higher than the CHIS commercial rate (147 per 1,000 members).
• The office-clinic rate for Medicaid-only (2,561 per 1,000 members) was 17 percent higher than the CHIS commercial rate (2,182 per 1,000 members).
• The age-standardized payment PMPM rate for claims with a respiratory diagnosis
and respiratory medications for members with COPD was 16 percent higher in Medicaid-only ($332) compared to CHIS commercial ($284).
Lung Cancer
• Of the 272 members covered by Medicaid with lung cancer, 177 were Dual Eligible and 95 were Medicaid-only.
• The prevalence rate of lung cancer in Medicaid-only (0.5%) was five times the rate in
CHIS commercial (0.1%).
• For members with lung cancer, the age-standardized outpatient hospital ED rate for Medicaid-only (493 per 1,000 members) was 2 times higher the CHIS commercial rate (248 per 1,000 members).
• The inpatient hospitalization rate for Medicaid-only (1,084 per 1,000 members) was
2.2 times higher than the CHIS commercial rate (504 per 1,000 members).
• The office-clinic rate for Medicaid-only (8,333 per 1,000 members) was 26 percent higher than the CHIS commercial rate (6,600 per 1,000 members).
• Medicaid typically pays less per service than CHIS commercial. The age-
standardized payment PMPM rate for claims with a respiratory or lung cancer diag-nosis and respiratory medications for members with lung cancer was 13 percent lower in Medicaid-only ($1,776) compared to CHIS commercial ($2,033).

Chronic Respiratory Diseases: Prevalence, Utilization, and Payments. New Hampshire, CY2005. v Office of Medicaid Business and Policy, NH Department of Health and Human Services, June 2008
Geographical Variations Disease prevalence rates and service utilization rates were evaluated by the geographical Health Analysis Area of the member’s residence.
• Standardized for population age differences, Medicaid prevalence rates of asthma and COPD were higher in northern and more rural New Hampshire HAAs compared to southern HAAs.
• For members with asthma or members with COPD, a pattern of high outpatient ED
use was found in the northern and more rural New Hampshire HAAs compared to southern border HAAs. The pattern was found in both the Medicaid and CHIS commercial populations.
Payments and Coexisting Conditions
• The respiratory-disease specific payment rates for Medicaid-only members with asthma were $1,044 per year ($87 PMPM), with COPD were $3,876 per year ($323 PMPM), and with lung cancer were $19,128 ($1,594 PMPM). This indicates the sig-nificant financial burden per year to treat these chronic respiratory diseases.
• Selected coexisting conditions were evaluated for persons with chronic respiratory
diseases in this study. For example, Medicaid members with COPD incurred $102.0 million in payments during CY2005 of which only $16.4 million was specific to COPD, other respiratory diagnoses or respiratory medications.
• Medicaid members with COPD had high prevalence rates of coexisting conditions
(e.g. heart disease, diabetes, mental disorders) and a significant number resided in nursing facilities during the year. A similar pattern was found for lung cancer and asthma. Coexisting conditions were less prevalent in the CHIS commercial popula-tion with these chronic respiratory diseases.
Limitations: NH CHIS commercial population contains information only on New Hamp-shire residents whose claims are included in the NH Comprehensive Health Care Informa-tion System database, which generally only includes members whose policies were pur-chased in New Hampshire. Areas close to the borders of New Hampshire may be less well represented in this study than interior areas of the state. This study is based primarily on administrative claims data. Administrative claims data is collected primarily for the purpose of making financial payments. Specific provider, diag-nosis, and procedure coding are typically required as part of the financial payment process. The use of claims data is an efficient and less costly method to report on health care utiliza-tion and payments than other methods such as surveys or patient chart audits. Ad-ministrative claims data may under-report some diagnostic conditions or services; however, some studies indicate that administrative claims data may provide a more accurate rate than medical chart review.

Chronic Respiratory Diseases: Prevalence, Utilization, and Payments. New Hampshire, CY2005. vi Office of Medicaid Business and Policy, NH Department of Health and Human Services, June 2008
Differences in utilization and payment measures between Medicaid and NH CHIS commer-cial may be influenced by differences in the health status of the members covered or differ-ences in the insurance plan delivery model and benefit structure. Medicaid is a fee-for-service program that covers services without co-payments and that covers a wide variety of services that have limited or no benefit coverage in commercial plans. The possibility also exists that the differences in the sources of data and methods of payment may account for some of the variation. Conclusion and Next Steps: This study demonstrated that chronic respiratory disease was prevalent in the NH Medicaid program and members with chronic respiratory disease con-tribute significantly to utilization and program costs. Medicaid hospital outpatient ED and inpatient admissions were at higher rates than CHIS commercial. Finally, members with chronic respiratory disease in Medicaid had complex medical problems as indicated by high rates of coexisting chronic respiratory diseases, other serious medical conditions, and mental health disorders. This suggests the potential value of disease management and care coordination for members enrolled in Medicaid to help address these issues. A CHIS pro-ject evaluation of the NH Medicaid Disease Management program using administrative claims data is currently underway. A high proportion of Medicaid members with COPD and lung cancer were Dual Eligible and for these members claims data payments are incomplete. It is recommended that the CHIS investigate opportunities to incorporate Medicare claims into CHIS in order to provide a complete analysis of the experience for Dual Eligibles.

Chronic Respiratory Diseases: Prevalence, Utilization, and Payments. New Hampshire, CY2005. 1 Office of Medicaid Business and Policy, NH Department of Health and Human Services, June 2008
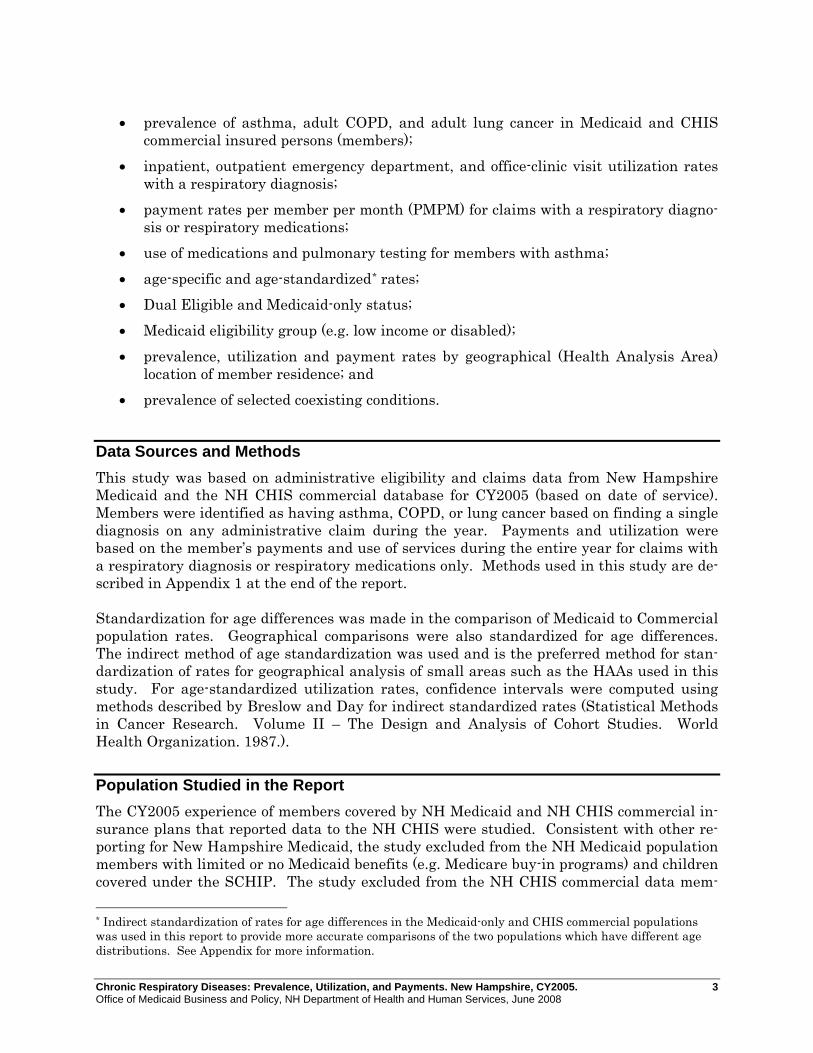
INTRODUCTION This report was developed to provide a detailed evaluation of the prevalence, utilization, and payments associated with chronic respiratory diseases. The study used New Hamp-shire (NH) Medicaid and CHIS commercial administrative eligibility and claims data to evaluate rates of prevalence, utilization, and payments for three chronic respiratory dis-eases: asthma, chronic obstructive pulmonary disease (COPD), and lung cancer. Chronic respiratory diseases are major contributors to mortality, disability, and medical cost. Nationally, while death rates for other major diseases (heart, cancer, and stroke) have declined, chronic lower respiratory disease death rates increased by 53 percent between 1980 and 2003, and was the fourth leading cause of death during 2003.1 One of the first studies of prevalence of chronic respiratory diseases in the U.S. was con-ducted in Berlin, New Hampshire (NH) and published in 1962. Depending on location within the town, the prevalence of chronic non-specific respiratory disease ranged from 15 to 39 percent for men and 15 to 21 percent for women.2 National estimates for 2005 indicate that among adults age 18 and older, 10.7 percent have ever had asthma and 7.2 percent continue to have asthma. The prevalence of chronic bron-chitis was 4.1 percent and emphysema was 1.7 percent. Among adults under age 65, those insured by Medicaid had higher prevalence rates of emphysema (3.8% vs. 0.6%), chronic bronchitis (10.6% vs. 3.1%), and asthma (15.3% vs. 6.4%) compared to adults with private insurance. Among adults age 65 and older, those insured by Medicaid and Medicare had higher prevalence rates of emphysema (8.0% vs. 5.3%), chronic bronchitis (9.6% vs. 5.1%), and asthma (14.3% vs. 8.0%) compared to those with Medicare alone.3 During 2005, the rate of adults who have been told they currently have asthma was higher in New Hampshire (10.3%) compared to the national rate (8.0%).4 The rate of asthma prevalence in New Hampshire decreased with increasing income level. Adults with income less than $15,000 (were more than twice as likely to have been told they have asthma com-pared to adults with income $50,000 and over (19.1%) vs. 8.3%). 2005 Rates of Adult Asthma Prevalence and Adult Smoking Behavior by State4
Adults who have been told they cur-rently have asthma
Adults who have been told they
ever had asthmaSmoke
everyday Adults who are
current smokersNational 8.0% 12.6% 15.3% 20.5% New Hampshire 10.3% 14.2% 15.4% 20.4% Maine 10.2% 14.7% 15.9% 20.8% Vermont 9.8% 15.0% 14.4% 19.3% Massachusetts 9.6% 14.9% 13.5% 18.1%
Source: Centers for Disease Control, Behavioral Risk Factor Surveillance System, 2005. Smoking behavior has been linked to chronic respiratory disease. The prevalence of current smokers in New Hampshire (20.4%) during 2005 was similar to the national rate (20.5%).4 The rate of smoking in New Hampshire is higher with lower income levels. Adults with in-
Chronic Respiratory Diseases: Prevalence, Utilization, and Payments. New Hampshire, CY2005. 2 Office of Medicaid Business and Policy, NH Department of Health and Human Services, June 2008
come less than $15,000 were more than twice as likely to be current smokers (32.5%) com-pared with adults with income $50,000 and over (14.3%). 2005 Rates of Adult Asthma Prevalence and Adult Smoking Behavior by Income4
New Hampshire by Income Group
Adults who have been told they cur-rently have asthma
Adults who have been told they
ever had asthmaSmoke
everyday Adults who are
current smokers<$15,000 19.1% 23.2% 27.8% 32.5%$15,000 - $24,999 13.7% 17.7% 26.0% 33.5%$25,000 - $34,999 9.5% 14.7% 20.5% 26.6%$35,000 – $49,999 11.0% 15.5% 18.7% 23.9%$50,000 and over 8.3% 12.6% 10.1% 14.3%
Based on CDC trend analysis, the rate of current smokers in NH during 2003 (23.2%) was slightly higher than the rate in 1990 (22.0%).5 A CDC study also reports a higher national rate of cigarette smoking (32.9%) among persons living below the poverty level compared to persons above the poverty level (22.2%).6 Although smoking behavior cannot be determined from the CHIS data used in this report, this may be one factor explaining differences found between the Medicaid and CHIS commercial in chronic respiratory disease prevalence rates. Survey data for New Hampshire indicates that rural residents were more likely to be smok-ers than nonrural residents (25.5% vs. 22.9%).7 In this CHIS report, geographical variation in chronic respiratory disease prevalence is evaluated. Geographical variation in smoking behavior may be a factor explaining variations in prevalence rates. Chronic obstructive pulmonary disease (COPD) is a term referring to two lung diseases, chronic bronchitis and emphysema, that are characterized by obstruction to airflow that interferes with normal breathing. Both of these conditions frequently coexist, hence the term COPD. It does not include other obstructive diseases such as asthma.8 This is the definition used for this NH CHIS study. Lung cancer is a serious chronic respiratory disease. An estimated 740 New Hampshire residents died from lung cancer during 2004.9 In this CHIS study, lung cancer prevalence and associated cost were evaluated for the Medicaid and CHIS commercial populations. The prevalence, utilization of medical services, and cost for chronic respiratory disease in the NH Medicaid program has been previously unknown. Using the administrative claims data, this study evaluated prevalence, and associated utilization and costs for children and adults with asthma, and for adults with COPD or lung cancer. This study, developed by the Maine Health Information Center and the New Hampshire Department of Health and Hu-man Services, represents the first evaluation of chronic respiratory disease using the NH CHIS database.
Overview and Purpose of Report The purpose of this study was to describe the prevalence of chronic respiratory disease, and associated utilization and payments in the New Hampshire populations covered by Medi-caid and CHIS commercial. The scope of the study was to evaluate:
Chronic Respiratory Diseases: Prevalence, Utilization, and Payments. New Hampshire, CY2005. 3 Office of Medicaid Business and Policy, NH Department of Health and Human Services, June 2008
• prevalence of asthma, adult COPD, and adult lung cancer in Medicaid and CHIS
commercial insured persons (members); • inpatient, outpatient emergency department, and office-clinic visit utilization rates
with a respiratory diagnosis; • payment rates per member per month (PMPM) for claims with a respiratory diagno-
sis or respiratory medications; • use of medications and pulmonary testing for members with asthma; • age-specific and age-standardized* rates; • Dual Eligible and Medicaid-only status; • Medicaid eligibility group (e.g. low income or disabled); • prevalence, utilization and payment rates by geographical (Health Analysis Area)
location of member residence; and • prevalence of selected coexisting conditions.
Data Sources and Methods This study was based on administrative eligibility and claims data from New Hampshire Medicaid and the NH CHIS commercial database for CY2005 (based on date of service). Members were identified as having asthma, COPD, or lung cancer based on finding a single diagnosis on any administrative claim during the year. Payments and utilization were based on the member’s payments and use of services during the entire year for claims with a respiratory diagnosis or respiratory medications only. Methods used in this study are de-scribed in Appendix 1 at the end of the report. Standardization for age differences was made in the comparison of Medicaid to Commercial population rates. Geographical comparisons were also standardized for age differences. The indirect method of age standardization was used and is the preferred method for stan-dardization of rates for geographical analysis of small areas such as the HAAs used in this study. For age-standardized utilization rates, confidence intervals were computed using methods described by Breslow and Day for indirect standardized rates (Statistical Methods in Cancer Research. Volume II – The Design and Analysis of Cohort Studies. World Health Organization. 1987.).
Population Studied in the Report The CY2005 experience of members covered by NH Medicaid and NH CHIS commercial in-surance plans that reported data to the NH CHIS were studied. Consistent with other re-porting for New Hampshire Medicaid, the study excluded from the NH Medicaid population members with limited or no Medicaid benefits (e.g. Medicare buy-in programs) and children covered under the SCHIP. The study excluded from the NH CHIS commercial data mem- * Indirect standardization of rates for age differences in the Medicaid-only and CHIS commercial populations was used in this report to provide more accurate comparisons of the two populations which have different age distributions. See Appendix for more information.

Chronic Respiratory Diseases: Prevalence, Utilization, and Payments. New Hampshire, CY2005. 4 Office of Medicaid Business and Policy, NH Department of Health and Human Services, June 2008
bers age 65 or older and members who resided outside of NH. The study included only NH CHIS commercial members who had both medical and pharmacy coverage linked. Both children and adult covered members were included in the study of asthma because this disease is prevalent in both children and adults. The studies of COPD and lung cancer were restricted to adults age 19 and older because COPD and lung cancer are relatively rare in children. If a member had more than one respiratory disease during the year (i.e. asthma and COPD, COPD and lung cancer) the member was included in the analysis for both diseases. Members were identified as having asthma, COPD, or lung cancer based on finding a single diagnosis on any administrative claim during the year.
Interpretation of Results and Limitations This is the first detailed study of chronic respiratory disease prevalence and use comparing NH Medicaid and NH CHIS commercial. The large number of covered members studied in this one-year sample lends credibility to the findings. However, a number of cautions about the data used and results of this study are provided. This study was based on administrative eligibility and claims data. Variances in provider or insurer claims coding, data processing, or reimbursement arrangements may contribute to the variances shown in this report. Variances in benefits and coding by commercial in-surer products (EPO, HMO, Point-of-Service, Indemnity or Third Party Administrator) and plans, may contribute to variances shown in this report. The New Hampshire CHIS commercial population contains information on those residents whose claims are included in the NH CHIS database, which generally only includes mem-bers whose policies were purchased in New Hampshire. Areas close to the borders of New Hampshire may be less well represented than areas in the interior. Additionally, compa-nies that self-fund their health care and do not use a TPA to pay claims are not captured in the data set. Only CHIS commercial members with medical and pharmacy coverage linked were included in the study. Because of these factors, this report underestimates the num-ber of members covered by commercial insurance in New Hampshire.¶ This study compared two very different populations: NH Medicaid and NH CHIS commer-cial. Differences in these two populations could influence the magnitude of differences in rates reported in this study. Medicaid programs typically cover a large population of per-sons with chronic disease and disability. Persons institutionalized for long periods of time in nursing and other facilities are common in Medicaid but less common in the CHIS com-mercial population. Children are a higher proportion of the total Medicaid population while children are a lower proportion of the total CHIS commercial population. The Medicaid population covers elders age 65 and over who were not included in the CHIS commercial population studied. Methods used to control for these differences included:
• separate reporting of Dual Eligible and Medicaid-only members; • separate reporting of disabled and other Medicaid eligibility groups; • use of age-specific prevalence rates; • use of age-standardized utilization and payment rates; and
¶ The statute requiring submission of data is limited to areas regulated by the NH Department of Insurance.

Chronic Respiratory Diseases: Prevalence, Utilization, and Payments. New Hampshire, CY2005. 5 Office of Medicaid Business and Policy, NH Department of Health and Human Services, June 2008
• comparison of Medicaid-only members with CHIS commercial. Because the CHIS data does not include claims paid by Medicare, payments for Dual Eligi-ble Medicaid members are incomplete and were suppressed in the rates reported. Additional details about the study methods and limitations are provided in Appendix 1.

Chronic Respiratory Diseases: Prevalence, Utilization, and Payments. New Hampshire, CY2005. 6 Office of Medicaid Business and Policy, NH Department of Health and Human Services, June 2008
RESULTS
Asthma – Prevalence, Utilization, and Payments Asthma Prevalence For this NH CHIS study, determination of asthma was based on a diagnosis of asthma on any administrative medical claim during the year. The CY2005 NH Medicaid and NH CHIS commercial asthma prevalence rates are summarized in Figure 1 and Table 1. Among 105,053 NH Medicaid members, 11,004 (10.5%) were identified through the admin-istrative claims data as having any diagnosis of asthma during CY2005. For 86,514 aver-age Medicaid-only members, 8,328 (9.6%) had an asthma diagnosis during the year and for 18,538 average Dual Eligible members, 2,676 (14.4%) had an asthma diagnosis during the year. Among 342,852 CHIS commercial average covered members, 18,240 (5.3%) were identified as having any asthma diagnosis during CY2005. Figure 1. Prevalence of Asthma by Age of Member. NH Medicaid-only and NH CHIS Commercial Members, CY2005.
10% 10%
9%
7%8%
9%
11%
13%
15%
17% 17%
16%
17%
5%
7% 7%6%
6%
4% 4%
5% 5% 5% 5% 5% 5%
0%
2%
4%
6%
8%
10%
12%
14%
16%
18%
All Ages 0-4 5-9 10-14 15-18 19-20 21-24 25-34 35-44 45-49 50-54 55-59 60-64
Medicaid-only CHIS Commercial About half of the NH Medicaid members with asthma were children (5,589) and half were adults (5,415). In contrast, for CHIS commercial population one-third (6,054) of members with asthma were children and two-thirds (12,186) were adults. This reflects in part the

Chronic Respiratory Diseases: Prevalence, Utilization, and Payments. New Hampshire, CY2005. 7 Office of Medicaid Business and Policy, NH Department of Health and Human Services, June 2008
different age distribution of two populations. Within NH Medicaid the highest rate of asthma prevalence was found in the Physically Disabled eligibility group (18.2%). Medicaid-only members had an asthma prevalence rate (9.6%) that was 1.8 times the CHIS commercial member rate (5.3%). For children age 0-18 the Medicaid-only prevalence rate (8.5%) was 34% higher than the CHIS commercial rate (6.3%). Among adults age 19-64 the Medicaid-only prevalence rate (13.4%) was 2.7 times the CHIS commercial rate (4.9%). For every age group the Medicaid-only prevalence rate was higher than the CHIS commercial prevalence rate. Table 1. Prevalence Rate (Number of Members) with Asthma by Age, Gender, and Medi-caid Eligibility Group. NH Medicaid and NH CHIS Commercial Members, CY2005.
Age Group / Gender / Medicaid Eligibility Group Medicaid Total Dual Eligible
Medicaid- only
CHIS Commercial
Total 10.5% (11,004) 14.4% (2,676) 9.6% (8,328) 5.3% (18,240)Member’s Age 0-4 9.5% (1,797) ** 9.5% (1,796) 6.8% (1,265) 5-9 8.7% (1,570) ** 8.7% (1,570) 7.0% (1,660) 10-14 7.4% (1,250) ** 7.4% (1,250) 6.3% (1,732) 15-18 7.9% (972) ** 7.9% (972) 5.6% (1,397) 19-20 9.4% (141) 11.2% (5) 9.4% (136) 4.3% (364) 21-24 10.9% (397) 13.2% (45) 10.7% (352) 4.4% (715) 25-34 13.0% (1,003) 14.5% (214) 12.7% (789) 5.2% (2,256) 35-44 14.9% (1,071) 15.8% (403) 14.5% (668) 4.9% (3,236) 45-49 17.2% (548) 17.6% (274) 16.8% (274) 4.9% (1,770) 50-54 15.6% (398) 14.5% (203) 16.9% (195) 5.0% (1,630) 55-59 16.5% (334) 17.0% (196) 15.8% (138) 4.9% (1,292) 60-64 18.0% (307) 19.1% (187) 16.6% (120) 5.0% (922) 65-74 15.7% (458) 16.2% (417) 11.8% (41) NA 75-84 13.3% (434) 13.4% (411) 10.9% (23) NA 85+ 9.4% (324) 9.5% (320) 6.1% (4) NAGender Female 11.0% (6,644) 16.2% (1,988) 9.7% (4,656) 6.1% (10,627) Male 9.7% (4,360) 11.0% (688) 9.5% (3,672) 4.5% (7,612)Medicaid Eligibility Group Low Income Child 8.5% (5,515) ** 8.5% (5,514) NA Low Income Adult 12.5% (1,737) 21.6% (188) 11.9% (1,549) NA Severely Disabled Child 5.2% (61) 0% (0) 5.2% (61) NA Disabled Physical 18.2% (1,348) 19.5% (736) 17.0% (612) NA Disabled Mental 13.4% (1,127) 12.4% (608) 14.7% (519) NA Elderly 12.6% (1,216) 12.7% (1,143) 11.0% (73) NA
* One child in NH CHIS Commercial with unknown age. **One Low Income Child was reported as Dual Medi-care; prevalence rate not reported due to small number. Respiratory Disease Utilization and Payments for Members with Asthma The intent of this section is to summarize utilization and payments specific to respiratory disease for members with asthma. Members with asthma may have multiple coexisting conditions that contribute to utilization and payments. Table 2 summarizes utilization and payments for claims with a respiratory diagnoses or respiratory medications only.

Chronic Respiratory Diseases: Prevalence, Utilization, and Payments. New Hampshire, CY2005. 8 Office of Medicaid Business and Policy, NH Department of Health and Human Services, June 2008
Table 2. Members with Asthma. Respiratory Disease Utilization and Payment Rates. NH Medicaid and NH Commercial Members, CY2005.
Measure* Medicaid
TotalDual
EligibleMedicaid-
only CHIS
CommercialMembers with Condition 11,004 2,676 8,328 8,240Member Months for Members with Condition 118,814 28,959 89,855 192,195Total Payments for Members with Condition (millions) $13.4** $5.6** $7.8 $20.4Outpatient Emergency Department Visits 4,314 928 3,386 2,521Office/Clinic Visits 20,397 3,394 17,003 34,881Inpatient Discharges 786 328 458 475Statistical Rates Payments Per Member Per Month (PMPM) ** ** $87 $106Outpatient Emergency Department Visits per 1,000 Members 435.7 384.5 452.2 157.4Office/Clinic Visits per 1,000 Members 2,060.1 1,406.4 2,270.7 2,177.9Inpatient Discharges per 1,000 Members 79.4 135.9 61.2 29.7
*All utilization metrics measure the utilization and payments for the members with asthma during the year for a respiratory diagnosis or respiratory medications only. **Payment information for Dual Eligible members is incomplete because Medicare administrative claims are not part of the NH CHIS database. Medicaid members with asthma used 19,252 outpatient ED visits, 83,959 office-clinic visits, and 3,557 inpatient hospitalizations in total during CY2005. Of these visits, 4,314 outpa-tient ED visits, 20,397 office-clinic visits, and 786 inpatient hospitalizations were for a res-piratory diagnosis. Respiratory disease utilization and payment rates were compared be-tween Medicaid-only and CHIS commercial members with asthma. Rates were standard-ized for age differences in the two populations and are shown in Table 3 and Figure 2. Table 3. Members with Asthma. Age-Standardized Respiratory Disease Utilization and Payment Rates. NH Medicaid-Only and NH Commercial Members, CY2005. Note: 95% confidence intervals (CI) in parentheses.
Measure* Medicaid-only CHIS CommercialPayments Per Member Per Month (PMPM)** $104 $100Outpatient Emergency Department Visits per 1,000 Members 397 (384-411) 169 (163-176)Office/Clinic Visits per 1,000 Members 2,136 (2,104-2,168) 2,252 (2,228-2,276)Inpatient Discharges per 1,000 Members 64 (58-70) 30 (27-33)
*All utilization metrics measure the utilization and payments for the members with asthma during the year for a respiratory diagnosis or respiratory medications. **95% CI were not computed for payment PMPM rates be-cause CHIS reports do not provide variance estimates and payments may be skewed by outlier cases. For members with asthma, the age-standardized outpatient hospital ED rate for Medicaid-only (397 per 1,000 members) was 2.4 times higher than the CHIS commercial rate (169 per 1,000 members). The inpatient hospitalization rate for Medicaid-only (64 per 1,000 mem-bers) was 2.1 times higher than the CHIS commercial rate (30 per 1,000 members). The

Chronic Respiratory Diseases: Prevalence, Utilization, and Payments. New Hampshire, CY2005. 9 Office of Medicaid Business and Policy, NH Department of Health and Human Services, June 2008
office-clinic rate for Medicaid-only (2,136 per 1,000 members) was 5 percent lower than the CHIS commercial rate (2,252 per 1,000 members). Standardized for age, the hospital use rates were more than two times higher in Medicaid-only compared to CHIS commercial, while the office-clinic use rates were slightly lower. For each of these standardized rates the confidence intervals indicate that the differences between Medicaid-only and CHIS com-mercial were statistically significant. Although Medicaid typically pays less per service than CHIS commercial, the age-standardized payment PMPM rate for claims with a respiratory diagnosis and respiratory medications for members with asthma was four percent higher in Medicaid-only ($104) compared to CHIS commercial ($100). Figure 2. Respiratory Disease Utilization and Payment Rates for Members with Asthma. Age-standardized Rates of Utilization per 1,000 Members and Payments per Member per Month (PMPM). NH Medicaid-only and NH CHIS Commercial Members, 2005.
397
2,136
64169
2,252
30$104 $100
0
500
1,000
1,500
2,000
2,500
Outpatient ED Visits Office-Clinic Visits Inpatient Hospitalizations Payments PMPM
Medicaid-only CHIS Commercial
Use of Pulmonary Testing and Respiratory Medication by Members with Asthma Table 4 provides summary rates of pulmonary testing and the use of asthma medications for members with asthma. Among Medicaid-only members with asthma 16.3 percent had a pulmonary test identified in the administrative claims data compared with 35.4 percent in the CHIS commercial population. While the rate of any asthma medication use was similar in Medicaid-only (89.8%) and CHIS commercial (88.2%), the rate of asthma controller medi-

Chronic Respiratory Diseases: Prevalence, Utilization, and Payments. New Hampshire, CY2005. 10 Office of Medicaid Business and Policy, NH Department of Health and Human Services, June 2008
cation use was slightly lower in Medicaid-only (53.5%) compared to CHIS Commercial (59.2%). Table 4. Prevalence Rate for Medication Use or Pulmonary Testing. NH Medicaid and NH Commercial Members, CY2005. Note: 95% confidence intervals (CI) in parentheses.
Measure* Medicaid
Total Dual Eligible Medicaid- only CHIS
Commercial
Any Pulmonary Testing 17.0%
(16.3-17.8) 19.4%
(17.8-21.0) 16.3%
(15.4-17.1) 35.4%
(34.7-36.2)
Any Respiratory Medication Use 85.4%
(84.7-86.1)71.8%
(70.0-73.6)89.8%
(89.1-90.5) 88.2%
(87.7-88.7)
Controller Medications 51.9%
(50.9-52.9) 47.1%
(45.1-49.1) 53.5%
(52.3-54.6) 59.2%
(58.5-60.0)
Rescue Medications 79.3%
(78.5-80.1)65.0%
(63.1-66.9)83.9%
(83.1-84.8) 74.8%
(74.1-75.4)*Measures in this table cannot be compared with NCQA HEDIS reported measures which use a more restrictive definition to identify members with “persistent” asthma and a two-year study period. Asthma controller medi-cations include inhaled corticosteroids, nedocromil, cromolyn sodium, leukotriene modifiers or methylxanthines. Geographical Variation in Prevalence and Utilization for Members with Asthma Evaluation of geographical variation in prevalence and use rates was based on the Health Analysis Area (HAA) of the member’s residence. Prevalence and utilization rates for mem-bers with asthma are reported in Table 5 for NH Medicaid and Table 6 for CHIS commer-cial. Manchester (2,031), Nashua (1,289), and Concord (1,014), had the highest volume of Medi-caid members with asthma. Standardized for age differences, the highest prevalence rates for asthma in the NH Medicaid population were Littleton (13.2%), Berlin (12.4%), Clare-mont (12.4%), and Colebrook (12.0%); the lowest rate area was Peterborough (7.7%). The southern border HAAs (Keene, Peterborough, Nashua, Derry, Exeter, and Portsmouth) all had prevalence rates of asthma lower than the NH Medicaid state average. Rates of utilization varied by HAA for the Medicaid members with asthma. Laconia (824 per 1,000 members), Colebrook (815), Lancaster (708), and Berlin (561) had the highest rates of outpatient ED visits while Peterborough (304) and Manchester (314) had the lowest rates. The highest rates of respiratory diagnosis office-clinic visits for members with asthma were in Portsmouth (2,668 per 1,000 members), North Conway (2,515), and Keene (2,379) while the lowest rates were in Lancaster (1,718 per 1,000 members), Claremont (1,732), and Concord (1,833).

Chronic Respiratory Diseases: Prevalence, Utilization, and Payments. New Hampshire, CY2005. 11 Office of Medicaid Business and Policy, NH Department of Health and Human Services, June 2008
Asthma Prevalence
9.5%
9.5%
11.4%
8.9%
8.9%
11.7%
7.7%
11.2%
10.1%
11.3%
12.0%
13.2%
10.5%
12.4%11.6%
10.1%
11.4%
11.5%
10.0%
12.4%
11.8%
10.0%
Medicaid Members7.0% - 8.9%
9.0% - 10.9%
11.0% - 12.9%
13.0% - 13.9%
5.4%
4.8%
5.8%
3.3%
4.6%
5.3%
5.1%
5.7%
5.4%
5.0%
5.8%
3.8%
5.5%
4.2%
5.4%
5.9%
5.9%
5.7%
5.4%
5.1%
5.2%
5.4%
CHIS Commercial3.0% - 3.9%
4.0% - 4.9%
5.0% - 5.5%
5.6% - 5.9%

Chronic Respiratory Diseases: Prevalence, Utilization, and Payments. New Hampshire, CY2005. 12 Office of Medicaid Business and Policy, NH Department of Health and Human Services, June 2008
Table 5. Prevalence, Respiratory Disease Utilization, and Controller Medication Use for Members with Asthma by Health Analysis Area. NH Medicaid Members, CY2005.
Health Analysis Area
Asthma Prevalence (Number of
Members)
Asthma Prevalence
Standardized for Age*
Outpatient Emergency Department
Visit Rate per 1,000
Members*
Office-Clinic Visit
Rate per 1,000
Members*
Percent of Members
Using Controller
Asthma Medications*
Total 10.5% (11,004) 10.5% 436 2.060 52%Berlin 12.7% (304) 12.4% 561 1,855 61%Claremont 12.8% (362) 12.4% 492 1,732 46%Colebrook 12.2% (92) 12.0% 815 2,041 43%Concord 9.6% (1,014) 9.5% 425 1,833 55%Derry 10.0% (440) 10.0% 425 2,257 46%Dover 11.8% (588) 11.5% 529 2,074 54%Exeter 9.9% (585) 10.1% 336 2,015 52%Franklin 11.7% (275) 11.8% 451 1,979 54%Keene 9.0% (479) 8.9% 356 2,379 54%Laconia 11.6% (573) 11.7% 824 1,966 47%Lancaster 11.5% (139) 11.6% 708 1,718 39%Lebanon 9.5% (376) 9.5% 388 1,978 52%Littleton 13.3% (289) 13.2% 481 2,268 52%Manchester 10.6% (2,031) 10.5% 314 1,990 48%Nashua 10.1% (1,289) 10.1% 357 2,030 53%North Conway 8.8% (187) 8.9% 382 2,515 63%Peterborough 7.2% (168) 7.7% 304 2,246 50%Plymouth 10.8% (291) 11.4% 491 2,090 51%Portsmouth 10.7% (227) 10.0% 515 2,668 60%Rochester 11.3% (673) 11.3% 539 2,288 55%Wolfeboro 10.6% (269) 11.2% 464 2,242 59%Woodsville 11.3% (81) 11.4% 333 1,883 51%
* Rates are standardized for age differences in the population using CY2005 Medicaid statewide rates as the basis. Asthma controller medication use in this table cannot be compared with NCQA HEDIS measures which use a more restrictive definition to identify members with “persistent” asthma and a two-year study period. Asthma controller medications include inhaled corticosteroids, nedocromil, cromolyn sodium, leukotriene modi-fiers or methylxanthines. The highest rate of asthma controller medication use for Medicaid members with asthma was in North Conway (63%) while the lowest rate was in Lancaster (39%). Comparing the three areas (Manchester, Nashua, and Concord) with the highest number of members with asthma covered by Medicaid, members in Manchester were less likely to have used a con-troller medication than members in Nashua or Concord. Prevalence and utilization rates for CHIS commercial members with asthma are reported in Table 6. Manchester (3,396), Nashua (2,986), and Concord (2,393) had the highest vol-ume of members with asthma in the study. Standardized for age differences, the highest prevalence rates for asthma in the NH CHIS commercial population were in Rochester (5.9%), Woodsville (5.9%), Plymouth (5.8%), and Wolfeboro (5.8%) and the lowest rate area was Colebrook (3.3%).

Chronic Respiratory Diseases: Prevalence, Utilization, and Payments. New Hampshire, CY2005. 13 Office of Medicaid Business and Policy, NH Department of Health and Human Services, June 2008
Table 6. Prevalence, Respiratory Disease Utilization, and Controller Medication Use for Members with Asthma by Health Analysis Area. NH CHIS Commercial, CY2005.
Health Analysis Area
Asthma Prevalence (Number of
Members)
Asthma Prevalence
Standardized for Age*
Outpatient Emergency Department
Visit Rate per 1,000
Members*
Office-Clinic Visit
Rate per 1,000
Members*
Members Using
Controller Asthma
Medications per 1,000
Members*Total 5.3% (18,240) 5.3% 157 2,178 59%Berlin 5.0% (149) 5.0% 158 1,950 74%Claremont 5.1% (229) 5.1% 235 1,925 48%Colebrook 3.3% (32) 3.3% 235 1,584 51%Concord 5.4% (2,393) 5.4% 143 2,196 61%Derry 5.4% (932) 5.4% 163 2,423 57%Dover 5.7% (930) 5.7% 149 2,440 56%Exeter 5.4% (1,307) 5.4% 179 2,097 58%Franklin 5.2% (294) 5.2% 231 2,018 53%Keene 4.6% (622) 4.6% 165 2,172 63%Laconia 5.1% (793) 5.1% 335 2,005 59%Lancaster 4.2% (103) 4.2% 305 1,753 64%Lebanon 4.8% (1,123) 4.8% 152 2,031 55%Littleton 5.7% (234) 5.7% 265 2,099 57%Manchester 5.4% (3,396) 5.4% 117 2,087 61%Nashua 5.5% (2,986) 5.5% 124 2,180 60%North Conway 5.2% (255) 5.3% 206 2,815 57%Peterborough 3.9% (369) 3.8% 156 2,264 59%Plymouth 5.8% (428) 5.8% 179 1,987 59%Portsmouth 5.3% (523) 5.4% 148 2,455 60%Rochester 5.9% (664) 5.9% 161 2,420 57%Wolfeboro 5.8% (394) 5.8% 216 2,274 62%Woodsville 5.8% (84) 5.9% 102 1,839 66%
* Rates are standardized for age differences in the population using CY2005 CHIS commercial statewide rates as the basis. Rates are standardized for age differences in the population using CY2005 Medicaid statewide rates as the basis. Asthma controller medication use in this table cannot be compared with NCQA HEDIS meas-ures which use a more restrictive definition to identify members with “persistent” asthma and a two-year study period. Asthma controller medications include inhaled corticosteroids, nedocromil, cromolyn sodium, leukotriene modifiers or methylxanthines. Standardized for age, rates of utilization varied by HAA for the CHIS commercial members with asthma. Laconia (335 per 1,000 members), Lancaster (305 per 1,000), Littleton (265 per 1,000), Claremont (235 per 1,000) and Colebrook (235 per 1,000) had the highest rates of outpatient ED visits with a respiratory diagnosis. These same areas also ranked well above average in outpatient ED use for Medicaid members with asthma. The lowest rates of office-clinic visit use for respiratory diagnosis were Colebrook (1,584 per 1,000 members), Lancaster (1,753 per 1,000), Woodsville (1,839 per 1,000), Claremont (1,925 per 1,000) and Berlin (1,950 per 1,000). Lancaster, Woodsville, Claremont, and Ber-lin also had low rates in the Medicaid members with asthma. The highest rate areas were North Conway (2,815 per 1,000 members), Portsmouth (2,455 per 1,000), Dover (2,440 per 1,000), and Derry (2,423 per 1,000).

Chronic Respiratory Diseases: Prevalence, Utilization, and Payments. New Hampshire, CY2005. 14 Office of Medicaid Business and Policy, NH Department of Health and Human Services, June 2008
The highest rate of asthma controller medication use for CHIS commercial members with asthma was in Berlin (74%) while the lowest rate was in Claremont (48%). Comparing the three areas (Manchester, Nashua, and Concord) with the highest number of members with asthma covered by CHIS commercial, there was virtually no difference in the rates of con-troller medication use. Asthma and Coexisting Conditions This study evaluated three chronic respiratory disease conditions: asthma, COPD, and lung cancer. Some of the members with asthma also had administrative claims indicating that they had COPD or lung cancer. Among the 11,004 members covered by Medicaid with asthma, 1,452 (13%) also had COPD and 56 (<1%) also had lung cancer. Among the 18,240 CHIS commercial members with asthma, 936 (5%) also had COPD and 45 (<1%) also had lung cancer. During CY2005, NH Medicaid members incurred $850.1 million in claims payment ex-penses. Of this $110.0 million (13%) was incurred by 11,004 members who had asthma. For the members with asthma only $13.4 million was directly attributable to claims with a respiratory diagnosis or respiratory medication. The large difference may be explained by other coexisting conditions these members had. Because asthma is prevalent in adults and older persons, members with asthma may have other coexisting conditions. Among the 8,328 Medicaid-only members with asthma, 636 (8%) had heart disease, 501 (6%) had diabetes, and 3,115 (37%) had a mental disorder diag-nosis. Among the 2,676 Dual Eligible members with asthma, 1,307 (49%) had heart dis-ease, 929 (35%) had diabetes, and 1,609 (60%) had a mental disorder diagnosis. Among the 18,240 CHIS commercial members with asthma, 8 percent had coexisting heart disease, 6 percent had coexisting diabetes, and 25 percent had a coexisting mental health disorder di-agnosis. Because many Medicaid members reside in nursing facilities (skilled or intermediate level) and nursing facility care is a large proportion of the Medicaid payments, this study evalu-ated the number of members with asthma who also resided in a nursing facility during CY2005. Among the 2,676 Dual Eligible members with asthma, 405 resided in a nursing facility at some time during CY2005. Only 62 of the 8,328 Medicaid-only members with asthma resided in a nursing facility during CY2005, a prevalence rate that was similar to the CHIS commercial rate.

Chronic Respiratory Diseases: Prevalence, Utilization, and Payments. New Hampshire, CY2005. 15 Office of Medicaid Business and Policy, NH Department of Health and Human Services, June 2008
Chronic Obstructive Pulmonary Disease – Prevalence, Utilization, and Payments COPD Prevalence For this study of COPD, adults age 19 and older were evaluated because COPD is common in older adults and rare in children. The CY2005 NH Medicaid and NH CHIS commercial adult population COPD prevalence rates are summarized in Table 7 and Figure 3. COPD for this study was defined as chronic bronchitis or emphysema; asthma was not included. Among 39,115 NH Medicaid members age 19 and older, 4,758 (12.2%) were identified through the administrative claims data as having a diagnosis of COPD. Of the 4,758 mem-bers covered by Medicaid with COPD, 3,494 were Dual Eligible and 1,264 were Medicaid-only. The highest prevalence rates of COPD were among the Elderly (24.6%) and Disabled Physical (18.6%) eligibility groups. Among 247,715 NH CHIS commercial members age 19 and older, 3,962 (1.6%) were identified as having a diagnosis of COPD. Table 7. Prevalence Rate (Number of Members) with Chronic Obstructive Pulmonary Disease (COPD) by Age, Gender, and Medicaid Eligibility Group. NH Medicaid and NH CHIS Commercial Members, CY2005.
Age Group / Gender / Medicaid Eligibility Group Medicaid Total Dual Eligible
Medicaid- only
CHIS Commercial
Total Adults Age 19 and Older 12.2% (4,758) 18.9% (3,494) 6.1% (1,264) 1.6% (3,962)Member’s Age 19-20 0.5% (7) 2.2% (1) 0.4% (6) 0.1% (11) 21-24 0.3% (12) 0.3% (1) 0.3% (11) 0.2% (29) 25-34 1.3% (98) 2.8% (41) 0.9% (57) 0.4% (180) 35-44 5.5% (391) 6.4% (162) 5.0% (229) 0.8% (528) 45-49 12.1% (387) 12.1% (189) 12.2% (198) 1.5% (533) 50-54 17.5% (448) 15.7% (220) 19.7% (228) 2.2% (703) 55-59 24.1% (489) 24.9% (288) 23.0% (201) 3.5% (919) 60-64 32.9% (561) 33.5% (328) 32.2% (233) 5.8% (1,059) 65-74 31.4% (918) 33.3% (858) 17.2% (60) NA 75-84 26.2% (858) 26.9% (823) 16.7% (35) NA 85+ 17.1% (589) 17.2% (583) 9.1% (6) NAGender Female 11.3% (3,178) 19.0% (2,331) 5.3% (847) 1.5% (1,983) Male 14.5% (1,580) 18.6% (1,163) 9.0% (417) 1.7% (1,979)Medicaid Eligibility Group Low Income Adult 2.1% (297) 8.0% (70) 1.7% (227) NA Disabled Physical 18.6% (1,342) 18.7% (707) 18.5% (635) NA Disabled Mental 8.9% (749) 9.4% (459) 8.3% (290) NA Elderly 24.6% (2,370) 25.1% (2,258) 16.9% (112) NA
* COPD for this study was defined as chronic bronchitis or emphysema; asthma was not included in the identifi-cation of members with COPD. Comparison of prevalence rates between Medicaid and CHIS commercial are influenced by the difference in populations covered. Excluding Dual Eligible members, the COPD preva-lence rate for Medicaid-only members (6.1%) was 3.8 times the prevalence rate for CHIS commercial (1.6%). Medicaid-only Disabled Physical and Disabled Mental eligibility groups

Chronic Respiratory Diseases: Prevalence, Utilization, and Payments. New Hampshire, CY2005. 16 Office of Medicaid Business and Policy, NH Department of Health and Human Services, June 2008
influence the higher Medicaid-only rate. However, even within the Low Income Adult eligi-bility group, the age-specific prevalence rates were higher in Medicaid-only compared to CHIS commercial. Figure 3. Prevalence of Chronic Obstructive Pulmonary Disease by Age of Member. NH Medicaid-only and NH CHIS Commercial Members, CY2005.
6%
0% 0%1%
5%
12%
20%
23%
32%
2%
0% 0% 0% 1%2%
2%4%
6%
0%
5%
10%
15%
20%
25%
30%
35%
All Ages 19-20 21-24 25-34 35-44 45-49 50-54 55-59 60-64
Medicaid-only CHIS Commercial Respiratory Disease Utilization and Payments for Members with COPD Members with COPD may have multiple coexisting conditions that contribute to utilization and payments. The intent of this section is to summarize utilization and payments specific to respiratory disease for members with COPD. Table 8 summarizes CY2005 utilization and payments for respiratory diagnoses and respiratory medications for Medicaid and CHIS commercial members with COPD. Medicaid members with COPD used 8,065 outpatient ED visits, 36,711 office-clinic visits, and 3,060 inpatient hospitalizations in total. Of these visits, 1,548 outpatient ED visits, 7,062 office-clinic visits, and 970 inpatient hospitalizations were for a respiratory diagnosis.

Chronic Respiratory Diseases: Prevalence, Utilization, and Payments. New Hampshire, CY2005. 17 Office of Medicaid Business and Policy, NH Department of Health and Human Services, June 2008
Table 8. Members with COPD. Respiratory Disease Utilization and Payment Rates. NH Medicaid and NH Commercial Members, CY2005.
Measure* Medicaid
TotalDual
EligibleMedicaid-
only CHIS
CommercialMembers with Condition 4,758 3,494 1,264 3,962Member Months for Members with Condition 49,988 36,460 13,528 41,727Total Payments for Members with Condition (millions) $16.4** $12.1** $4.4 $12.0Outpatient Emergency Department Visits 1,548 1,030 518 621Office/Clinic Visits 7,062 4,234 2,828 7,586Inpatient Discharges 970 671 299 514Statistical Rates Payments Per Member Per Month (PMPM) ** ** $323 $288Outpatient Emergency Department Visits per 1,000 Members 371.6 339.0 459.5 178.6Office/Clinic Visits per 1,000 Members 1,695.3 1,393.5 2,508.6 2,181.6Inpatient Discharges per 1,000 Members 232.9 220.8 265.2 147.8
*All utilization metrics measure the utilization and payments for the members with COPD during the year for a respiratory diagnosis or respiratory medications only. **Payment information for Dual Eligible members is in-complete because Medicare administrative claims are not part of the NH CHIS database. Respiratory disease utilization and payment rates were compared between Medicaid-only and CHIS commercial members with COPD. Rates were standardized for age differences in the two populations and are shown in Table 9 and Figure 4. For these rates, 95% confi-dence intervals (CI) were computed. Table 9. Members with COPD. Age-Standardized Respiratory Disease Utilization and Payment Rates. NH Medicaid-Only and NH Commercial Members, CY2005. Note: 95% confidence intervals (CI) in parentheses.
Measure* Medicaid-only CHIS CommercialPayments Per Member Per Month (PMPM)** $332 $284Outpatient Emergency Department Visits per 1,000 Members 451 (411-492) 181 (167-196)Office/Clinic Visits per 1,000 Members 2,561 (2,465-2660) 2,182 (2,133-2,231)Inpatient Discharges per 1,000 Members 266 (235-300) 147 (135-160)
*All utilization metrics measure the utilization and payments for the members with COPD during the year for a respiratory diagnosis or respiratory medications. **95% CI were not computed for payment PMPM rates be-cause CHIS reports do not provide variance estimates and the payments may be skewed by outlier cases. For members with COPD, the age-standardized outpatient hospital ED visit rate for Medi-caid-only (450 per 1,000 members) was 2.5 times higher than the CHIS commercial rate (181 per 1,000 members). The inpatient hospitalization rate for Medicaid-only (266 per 1,000 members) was 1.8 times higher than the CHIS commercial rate (147 per 1,000 mem-bers). The office-clinic rate for Medicaid-only (2,561 per 1,000 members) was 17 percent
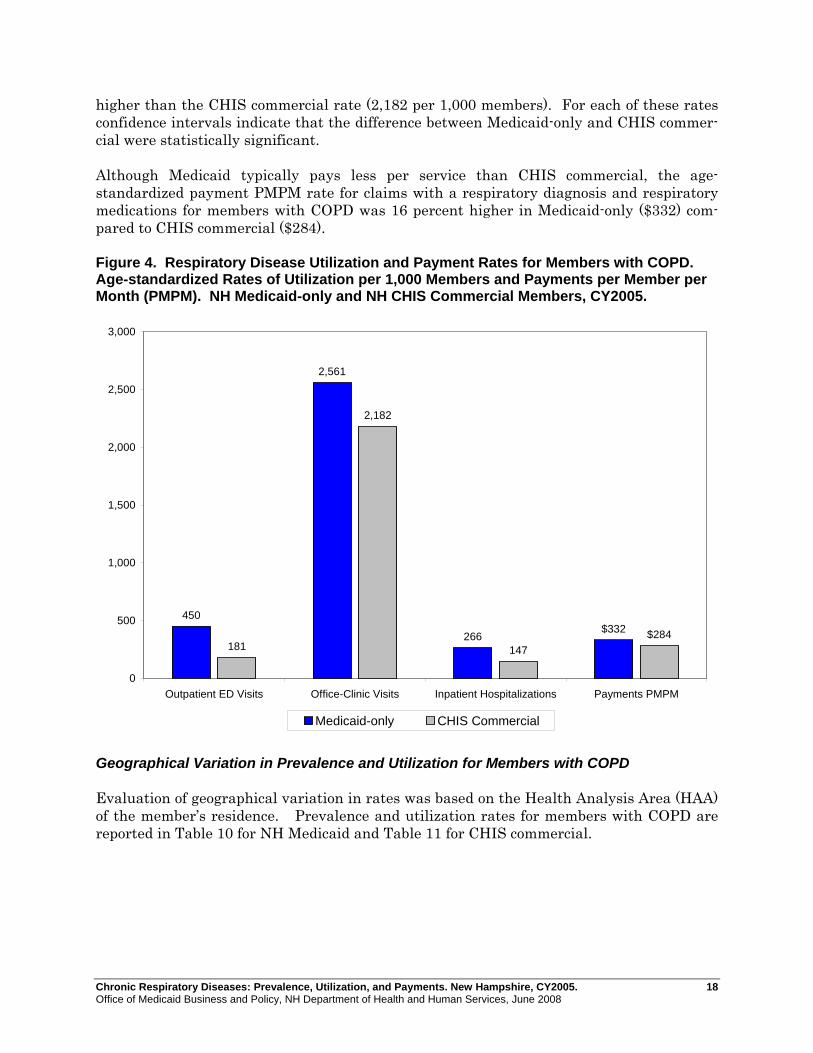
Chronic Respiratory Diseases: Prevalence, Utilization, and Payments. New Hampshire, CY2005. 18 Office of Medicaid Business and Policy, NH Department of Health and Human Services, June 2008
higher than the CHIS commercial rate (2,182 per 1,000 members). For each of these rates confidence intervals indicate that the difference between Medicaid-only and CHIS commer-cial were statistically significant. Although Medicaid typically pays less per service than CHIS commercial, the age-standardized payment PMPM rate for claims with a respiratory diagnosis and respiratory medications for members with COPD was 16 percent higher in Medicaid-only ($332) com-pared to CHIS commercial ($284). Figure 4. Respiratory Disease Utilization and Payment Rates for Members with COPD. Age-standardized Rates of Utilization per 1,000 Members and Payments per Member per Month (PMPM). NH Medicaid-only and NH CHIS Commercial Members, CY2005.
450
2,561
266181
2,182
147
$332 $284
0
500
1,000
1,500
2,000
2,500
3,000
Outpatient ED Visits Office-Clinic Visits Inpatient Hospitalizations Payments PMPM
Medicaid-only CHIS Commercial
Geographical Variation in Prevalence and Utilization for Members with COPD Evaluation of geographical variation in rates was based on the Health Analysis Area (HAA) of the member’s residence. Prevalence and utilization rates for members with COPD are reported in Table 10 for NH Medicaid and Table 11 for CHIS commercial.

Chronic Respiratory Diseases: Prevalence, Utilization, and Payments. New Hampshire, CY2005. 19 Office of Medicaid Business and Policy, NH Department of Health and Human Services, June 2008
COPD PrevalenceRates Standardized for Age
10.3%
12.3%
11.3%
12.1%
12.3%
11.5%10.4%
12.0%
11.0%
12.2%
13.0%
14.3%
14.7%
15.7%
15.4%
16.3%
14.5%
15.3%
12.5%
16.4%
11.8%
10.3%
Medicaid Members10.0% - 12.9%
13.0% - 14.9%
15.0% - 15.9%
16.0% - 16.4%
0.02%
0.01%
0.01%
0.02%
0.01%0.02%
0.02%
0.02%
0.01%
0.02%
0.01%
0.02%
0.01%
0.02%
0.02%
0.02%
0.02%
0.02%
0.02%
0.02%
0.03%
0.01%
CHIS Commercial0.01%
0.02%
0.03%

Chronic Respiratory Diseases: Prevalence, Utilization, and Payments. New Hampshire, CY2005. 20 Office of Medicaid Business and Policy, NH Department of Health and Human Services, June 2008
Manchester (894), Nashua (455), and Concord (441), had the highest volume of Medicaid members with COPD. Standardized for age differences, the highest prevalence rates for COPD in the NH Medicaid population were Claremont (16.4%), Lancaster (16.3%), and Ber-lin (15.7%); the lowest rate area was Concord (10.3%). The southern border HAAs (Keene, Peterborough, Nashua, Derry, Exeter, and Portsmouth) all had prevalence rates of COPD lower than the state average for NH Medicaid. Standardized for age differences, rates of utilization with a respiratory diagnosis varied by HAA for the Medicaid members with COPD. Colebrook (715 per 1,000 members) had the highest age-standardized outpatient ED use rate while Exeter (232 per 1,000 members) had the lowest. The rate of office-clinic visits with a respiratory diagnosis for members with COPD was highest in Littleton (2,180 per 1,000 members) and lowest in Nashua (1,356 per 1,000 members). The rate of inpatient hospitalizations with a respiratory diagnosis for members with COPD was highest in Berlin (370 per 1,000 members) and lowest in Clare-mont (142 per 1,000 members). Table 10. Prevalence and Respiratory Disease Utilization for Members with COPD by Health Analysis Area. NH Medicaid Members, CY2005.
Health Analysis Area
COPD Prevalence (Number of
Members)
COPD Prevalence
Standardized for Age*
Outpatient Emergency Department
Visit Rate per 1,000
Members*
Office-Clinic Visit
Rate per 1,000
Members*
Inpatient Rate per
1,000 Members*
Total 12.2% (4,758) 12.2% 372 1,695 233Berlin 15.6% (161) 15.7% 568 1,893 370Claremont 16.5% (197) 16.4% 320 1,529 142Colebrook 14.9% (46) 13.0% 715 2,145 313Concord 10.8% (441) 10.3% 365 1,509 249Derry 11.4% (187) 11.0% 386 1,554 250Dover 12.3% (244) 12.5% 422 1,909 202Exeter 12.0% (240) 12.0% 223 1,412 241Franklin 10.9% (90) 11.8% 710 1,902 358Keene 11.3% (230) 11.3% 336 2,177 292Laconia 13.8% (245) 14.3% 488 1,478 240Lancaster 17.8% (75) 16.3% 432 2,019 291Lebanon 13.0% (187) 12.2% 391 1,855 185Littleton 17.4% (143) 14.7% 392 2,180 189Manchester 12.0% (894) 12.3% 286 1,732 226Nashua 9.9% (455) 10.4% 230 1,356 196North Conway 11.5% (80) 12.1% 293 1,738 222Peterborough 10.7% (68) 11.5% 460 1,535 166Plymouth 10.9% (82) 12.3% 663 2,054 277Portsmouth 11.3% (116) 10.3% 343 1,641 212Rochester 12.9% (280) 14.5% 564 1,742 253Wolfeboro 15.4% (108) 15.4% 449 1,682 260Woodsville 21.0% (54) 15.3% 489 1,910 198
* Rates are standardized for age differences in the population using CY2005 Medicaid statewide rates as the basis.
Chronic Respiratory Diseases: Prevalence, Utilization, and Payments. New Hampshire, CY2005. 21 Office of Medicaid Business and Policy, NH Department of Health and Human Services, June 2008
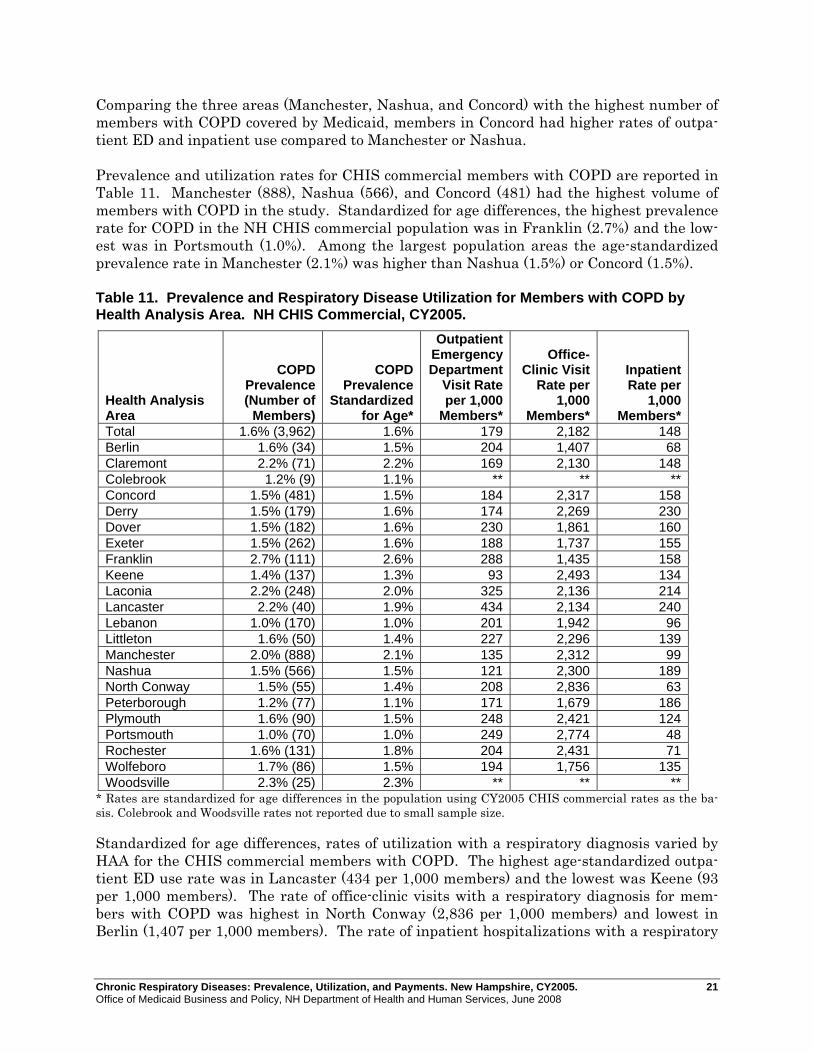
Comparing the three areas (Manchester, Nashua, and Concord) with the highest number of members with COPD covered by Medicaid, members in Concord had higher rates of outpa-tient ED and inpatient use compared to Manchester or Nashua. Prevalence and utilization rates for CHIS commercial members with COPD are reported in Table 11. Manchester (888), Nashua (566), and Concord (481) had the highest volume of members with COPD in the study. Standardized for age differences, the highest prevalence rate for COPD in the NH CHIS commercial population was in Franklin (2.7%) and the low-est was in Portsmouth (1.0%). Among the largest population areas the age-standardized prevalence rate in Manchester (2.1%) was higher than Nashua (1.5%) or Concord (1.5%). Table 11. Prevalence and Respiratory Disease Utilization for Members with COPD by Health Analysis Area. NH CHIS Commercial, CY2005.
Health Analysis Area
COPD Prevalence (Number of
Members)
COPD Prevalence
Standardized for Age*
Outpatient Emergency Department
Visit Rate per 1,000
Members*
Office-Clinic Visit
Rate per 1,000
Members*
Inpatient Rate per
1,000 Members*
Total 1.6% (3,962) 1.6% 179 2,182 148Berlin 1.6% (34) 1.5% 204 1,407 68Claremont 2.2% (71) 2.2% 169 2,130 148Colebrook 1.2% (9) 1.1% ** ** **Concord 1.5% (481) 1.5% 184 2,317 158Derry 1.5% (179) 1.6% 174 2,269 230Dover 1.5% (182) 1.6% 230 1,861 160Exeter 1.5% (262) 1.6% 188 1,737 155Franklin 2.7% (111) 2.6% 288 1,435 158Keene 1.4% (137) 1.3% 93 2,493 134Laconia 2.2% (248) 2.0% 325 2,136 214Lancaster 2.2% (40) 1.9% 434 2,134 240Lebanon 1.0% (170) 1.0% 201 1,942 96Littleton 1.6% (50) 1.4% 227 2,296 139Manchester 2.0% (888) 2.1% 135 2,312 99Nashua 1.5% (566) 1.5% 121 2,300 189North Conway 1.5% (55) 1.4% 208 2,836 63Peterborough 1.2% (77) 1.1% 171 1,679 186Plymouth 1.6% (90) 1.5% 248 2,421 124Portsmouth 1.0% (70) 1.0% 249 2,774 48Rochester 1.6% (131) 1.8% 204 2,431 71Wolfeboro 1.7% (86) 1.5% 194 1,756 135Woodsville 2.3% (25) 2.3% ** ** **
* Rates are standardized for age differences in the population using CY2005 CHIS commercial rates as the ba-sis. Colebrook and Woodsville rates not reported due to small sample size. Standardized for age differences, rates of utilization with a respiratory diagnosis varied by HAA for the CHIS commercial members with COPD. The highest age-standardized outpa-tient ED use rate was in Lancaster (434 per 1,000 members) and the lowest was Keene (93 per 1,000 members). The rate of office-clinic visits with a respiratory diagnosis for mem-bers with COPD was highest in North Conway (2,836 per 1,000 members) and lowest in Berlin (1,407 per 1,000 members). The rate of inpatient hospitalizations with a respiratory

Chronic Respiratory Diseases: Prevalence, Utilization, and Payments. New Hampshire, CY2005. 22 Office of Medicaid Business and Policy, NH Department of Health and Human Services, June 2008
diagnosis for members with COPD was highest in Lancaster (240 per 1,000 members) and lowest in Portsmouth (48 per 1,000 members). Comparing the three areas (Manchester, Nashua, and Concord) with the highest number of members with COPD covered by CHIS commercial, members in Concord had higher rates of outpatient ED use compared to Manchester or Nashua. Office-clinic visit use rates were virtually identical between the three areas. COPD and Coexisting Conditions This study evaluated three chronic respiratory disease conditions: asthma, COPD, and lung cancer. Some of the members with COPD also had administrative claims indicating that they had lung cancer or asthma. Among the 4,758 members covered by Medicaid with COPD, 1,452 (31%) also had asthma and 154 (3%) also had lung cancer. Among the 3,962 CHIS commercial members with COPD, 936 (24%) also had asthma and 99 (2%) also had lung cancer. During CY2005, NH Medicaid members incurred $850.1 million in claims payment ex-penses. Of this $102.0 million (12%) was incurred by members who had COPD. For the members with COPD only $16.4 million was directly attributable to claims with a respira-tory diagnosis or medication. This large difference may be explained by other coexisting conditions these members had. Because COPD is prevalent among older persons, members with COPD may have other co-existing conditions. Among the 1,264 Medicaid-only members with COPD, 592 (47%) had heart disease, 395 (31%) had diabetes, and 753 (60%) had a mental disorder diagnosis. Among the 3,494 Dual Eligible members with COPD, 2,310 (66%) had heart disease, 1,296 (37%) had diabetes, and 1,988 (57%) had a mental disorder diagnosis. Among the 3,962 CHIS commercial members with COPD, 31 percent had coexisting heart disease, 16 percent had coexisting diabetes, and 29 percent had a coexisting mental disorder diagnosis. Because many Medicaid members reside in nursing facilities (skilled or intermediate level) and nursing facility care is a large proportion of Medicaid payments, this study evaluated the number of members with COPD who also resided in a nursing facility. Among the 3,494 Dual Eligible members with COPD, 1,211 resided in a nursing facility at some time during CY2005. Only 100 of the 1,264 Medicaid-only members with COPD resided in a nursing facility during CY2005, a prevalence rate that was similar to the CHIS commercial rate.
Chronic Respiratory Diseases: Prevalence, Utilization, and Payments. New Hampshire, CY2005. 23 Office of Medicaid Business and Policy, NH Department of Health and Human Services, June 2008
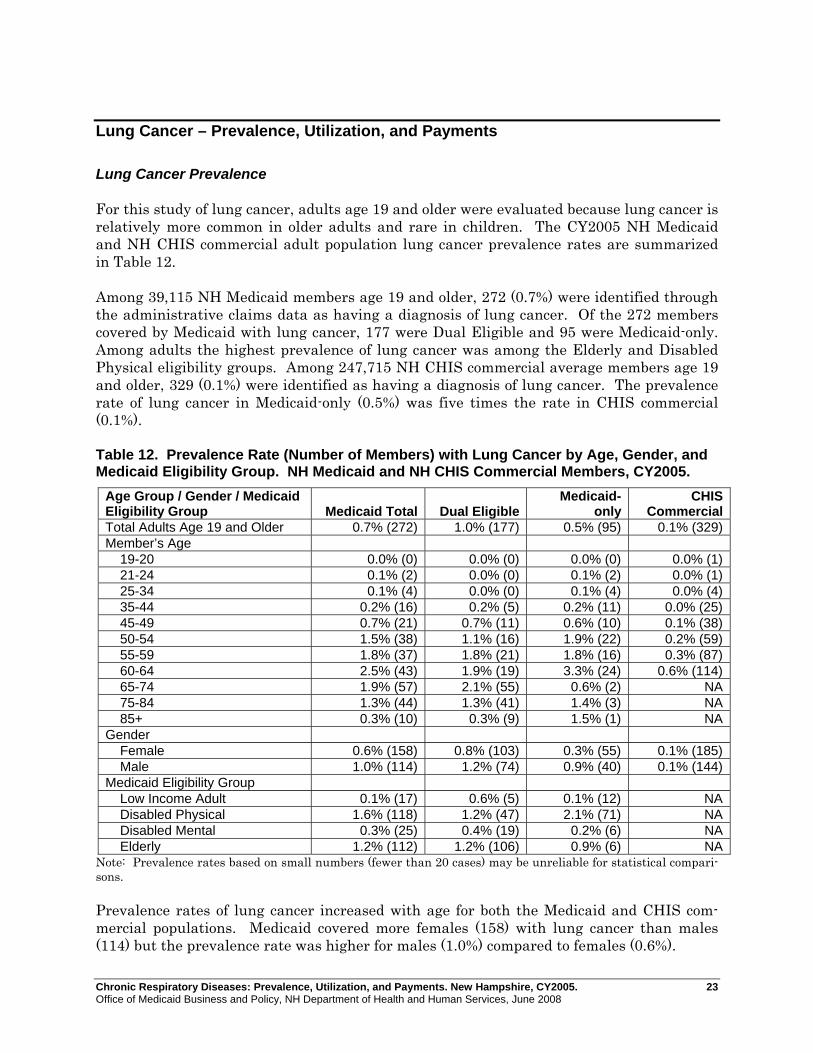
Lung Cancer – Prevalence, Utilization, and Payments Lung Cancer Prevalence For this study of lung cancer, adults age 19 and older were evaluated because lung cancer is relatively more common in older adults and rare in children. The CY2005 NH Medicaid and NH CHIS commercial adult population lung cancer prevalence rates are summarized in Table 12. Among 39,115 NH Medicaid members age 19 and older, 272 (0.7%) were identified through the administrative claims data as having a diagnosis of lung cancer. Of the 272 members covered by Medicaid with lung cancer, 177 were Dual Eligible and 95 were Medicaid-only. Among adults the highest prevalence of lung cancer was among the Elderly and Disabled Physical eligibility groups. Among 247,715 NH CHIS commercial average members age 19 and older, 329 (0.1%) were identified as having a diagnosis of lung cancer. The prevalence rate of lung cancer in Medicaid-only (0.5%) was five times the rate in CHIS commercial (0.1%). Table 12. Prevalence Rate (Number of Members) with Lung Cancer by Age, Gender, and Medicaid Eligibility Group. NH Medicaid and NH CHIS Commercial Members, CY2005.
Age Group / Gender / Medicaid Eligibility Group Medicaid Total Dual Eligible
Medicaid- only
CHIS Commercial
Total Adults Age 19 and Older 0.7% (272) 1.0% (177) 0.5% (95) 0.1% (329)Member’s Age 19-20 0.0% (0) 0.0% (0) 0.0% (0) 0.0% (1) 21-24 0.1% (2) 0.0% (0) 0.1% (2) 0.0% (1) 25-34 0.1% (4) 0.0% (0) 0.1% (4) 0.0% (4) 35-44 0.2% (16) 0.2% (5) 0.2% (11) 0.0% (25) 45-49 0.7% (21) 0.7% (11) 0.6% (10) 0.1% (38) 50-54 1.5% (38) 1.1% (16) 1.9% (22) 0.2% (59) 55-59 1.8% (37) 1.8% (21) 1.8% (16) 0.3% (87) 60-64 2.5% (43) 1.9% (19) 3.3% (24) 0.6% (114) 65-74 1.9% (57) 2.1% (55) 0.6% (2) NA 75-84 1.3% (44) 1.3% (41) 1.4% (3) NA 85+ 0.3% (10) 0.3% (9) 1.5% (1) NAGender Female 0.6% (158) 0.8% (103) 0.3% (55) 0.1% (185) Male 1.0% (114) 1.2% (74) 0.9% (40) 0.1% (144)Medicaid Eligibility Group Low Income Adult 0.1% (17) 0.6% (5) 0.1% (12) NA Disabled Physical 1.6% (118) 1.2% (47) 2.1% (71) NA Disabled Mental 0.3% (25) 0.4% (19) 0.2% (6) NA Elderly 1.2% (112) 1.2% (106) 0.9% (6) NA
Note: Prevalence rates based on small numbers (fewer than 20 cases) may be unreliable for statistical compari-sons. Prevalence rates of lung cancer increased with age for both the Medicaid and CHIS com-mercial populations. Medicaid covered more females (158) with lung cancer than males (114) but the prevalence rate was higher for males (1.0%) compared to females (0.6%).

Chronic Respiratory Diseases: Prevalence, Utilization, and Payments. New Hampshire, CY2005. 24 Office of Medicaid Business and Policy, NH Department of Health and Human Services, June 2008
Respiratory Disease Utilization and Payments for Members with Lung Cancer Members with lung cancer may have multiple coexisting conditions that contribute to utili-zation and payments. The intent of this section is to summarize utilization and payments specific to respiratory disease for members with lung cancer. Table 13 summarizes CY2005 utilization and payments for respiratory diagnoses or respiratory medications for Medicaid and CHIS commercial members with lung cancer. Table 13. Members with Lung Cancer. Respiratory Disease Utilization and Payment Rates. NH Medicaid and NH Commercial Members, CY2005.
Measure* Medicaid
TotalDual
EligibleMedicaid-
only CHIS
CommercialMembers with Condition 272 177 95 329Member Months for Members with Condition 2,378 1,612 766 3,139Total Payments for Members with Condition (millions) $1.7** $0.5** $1.2 $6.5Outpatient Emergency Department Visits 75 46 29 66Office/Clinic Visits 1,062 590 472 1,773Inpatient Discharges 114 52 62 130Statistical Rates Payments Per Member Per Month (PMPM) ** ** $1,594 $2,070Outpatient Emergency Department Visits per 1,000 Members 378 342 454 252Office/Clinic Visits per 1,000 Members 5,359 4,392 7,394 6,778Inpatient Discharges per 1,000 Members 575 387 971 497
*All utilization metrics measure the utilization and payments for the members with lung cancer during the year for a respiratory diagnosis or respiratory medications only. **Payment information for Dual Eligible members is incomplete because Medicare administrative claims are not part of the NH CHIS database. Medicaid members with lung cancer used 404 outpatient ED visits, 2,699 office-clinic visits, and 263 inpatient hospitalizations in total. Of these visits, 75 outpatient ED visits, 1,062 office-clinic visits, and 114 inpatient hospitalizations were for a respiratory diagnosis. Res-piratory disease utilization and payment rates were compared between Medicaid-only and CHIS commercial members with lung cancer. Rates were standardized for age differences in the two populations and are shown in Table 14 and Figure 5. For these rates 95% confi-dence intervals (CI) were computed. For members with lung cancer, the age-standardized outpatient hospital ED rate for Medi-caid-only (493 per 1,000 members) was 2 times higher than the CHIS commercial rate (248 per 1,000 members). The inpatient hospitalization rate for Medicaid-only (1,084 per 1,000 members) was 2.2 times higher than the CHIS commercial rate (504 per 1,000 members). The office-clinic rate for Medicaid-only (8,333 per 1,000 members) was 26 percent higher than the CHIS commercial rate (6,600 per 1,000 members). Despite the wide 95% confi-dence intervals due to small numbers, the differences between Medicaid-only and CHIS commercial were statistically significant. Medicaid-only members with lung cancer used

Chronic Respiratory Diseases: Prevalence, Utilization, and Payments. New Hampshire, CY2005. 25 Office of Medicaid Business and Policy, NH Department of Health and Human Services, June 2008
hospital outpatient ED and hospital inpatient services at a greater rate than CHIS com-mercial members with lung cancer. Table 14. Members with Lung Cancer. Age-Standardized Respiratory Disease Utilization and Payment Rates. NH Medicaid-Only and NH Commercial Members, CY2005. Note: 95% confidence intervals (CI) in parentheses.
Measure* Medicaid-only CHIS CommercialPayments Per Member Per Month (PMPM)** $1,776 $2,033Outpatient Emergency Department Visits per 1,000 Members 493 (330-708) 248 (191-315)Office/Clinic Visits per 1,000 Members 8,333 (7,598-9,120) 6,600 (6,297-6,915)Inpatient Discharges per 1,000 Members 1,084 (831-1,389) 504 (421-598)
*All utilization metrics measure the utilization and payments for the members with asthma during the year for a respiratory diagnosis or respiratory medications. **95% CI were not computed for payment PMPM rates be-cause CHIS reports do not provide variance estimates and the payments may be skewed by outlier cases. The age-standardized payment PMPM rate for claims with a respiratory or lung cancer di-agnosis and respiratory medications for members with lung cancer was 13 percent lower in Medicaid-only ($1,776) compared to CHIS commercial ($2,033). Figure 5. Respiratory Disease Utilization and Payment Rates for Members with Lung Cancer. Age-standardized Rates of Utilization per 1,000 Members and Payments per Member per Month (PMPM). NH Medicaid-only and NH CHIS Commercial Members, CY2005.
493
8,333
1,084
248
6,600
504
$1,776$2,033
0
1,000
2,000
3,000
4,000
5,000
6,000
7,000
8,000
9,000
Outpatient ED Visits Office-Clinic Visits Inpatient Hospitalizations Payments PMPM
Medicaid-only CHIS Commercial
Chronic Respiratory Diseases: Prevalence, Utilization, and Payments. New Hampshire, CY2005. 26 Office of Medicaid Business and Policy, NH Department of Health and Human Services, June 2008
Geographical Variation in Prevalence and Utilization for Members with Lung Cancer The number of members with lung cancer in Medicaid (272) or CHIS commercial (329) was relatively small. Reporting prevalence and utilization rates by HAA using small numbers would not be statistically reliable. Lung Cancer and Coexisting Conditions This study evaluated three chronic respiratory disease conditions: asthma, COPD, and lung cancer. Some of the members with lung cancer also had administrative claims indicating that they had COPD or asthma. Among the 272 members covered by Medicaid with lung cancer, 154 (57%) also had COPD and 56 (21%) also had asthma. Among the 329 CHIS commercial members with lung cancer, 99 (30%) also had COPD and 45 (14%) also had asthma. During 2005, NH Medicaid members incurred $850.1 million in claims payment expense. Of this $6.6 million (1%) was incurred by the 272 members who had lung cancer. For the members with lung cancer $1.7 million was directly attributable to lung cancer or respira-tory diagnosis. This large difference may be explained by other coexisting conditions these members may have had. Because lung cancer is most often a condition of older persons, members with lung cancer often had other coexisting conditions. Among the 95 Medicaid-only members with lung cancer, 43 (45%) had heart disease, 17 (18%) had diabetes, and 39 (41%) had a mental dis-order diagnosis. Among the 177 Dual Eligible members with lung cancer, 114 (64%) had heart disease, 55 (31%) had diabetes, and 73 (41%) had a mental disorder diagnosis. Among the 329 CHIS commercial members with lung cancer, 42 percent had coexisting heart disease, 13 percent had coexisting diabetes, and 29 percent had coexisting mental disorder diagnosis. Because many Medicaid members reside in nursing facilities (skilled or intermediate level) and nursing facility care is a large proportion of Medicaid payments, this study evaluated the number of members with lung cancer who also resided in a nursing facility. Among the 177 Dual Eligible members with lung cancer, 41 resided in a nursing facility at some time during CY2005. Among the 95 Medicaid-only members with lung cancer, 14 resided in a nursing facility during CY2005. Among the 329 CHIS commercial members with lung can-cer, 11 resided in a nursing facility during CY2005 based on the administrative claims data.

Chronic Respiratory Diseases: Prevalence, Utilization, and Payments. New Hampshire, CY2005. 27 Office of Medicaid Business and Policy, NH Department of Health and Human Services, June 2008
DISCUSSION AND NEXT STEPS This study evaluated three chronic respiratory diseases: asthma, chronic obstructive pul-monary disease (COPD), and lung cancer. Using NH Medicaid and NH CHIS commercial administrative eligibility and claims data for services rendered during CY2005, disease prevalence and associated utilization and payment rates were measured for the first time in these two populations. Results of this study indicate that chronic respiratory disease was prevalent in the Medi-caid and CHIS commercial populations. During CY2005, 11,004 members with asthma, 4,758 adults with COPD, and 272 adults with lung cancer covered by Medicaid, and 18,240 members with asthma, 3,962 members with COPD, and 329 members with lung cancer cov-ered by CHIS commercial were identified using the claims data.† Age-specific prevalence rates for Medicaid-only members compared to CHIS commercial in-dicated that asthma, COPD, and lung cancer all had higher prevalence rates in Medicaid compared to CHIS commercial. For COPD the prevalence rate (6.1%) in Medicaid-only members was almost four times the rate in CHIS commercial, and for lung cancer the prevalence rate in Medicaid-only was five times the rate in CHIS commercial. These find-ings are consistent with national survey data indicating that adults insured by Medicaid have higher rates of emphysema, chronic bronchitis, and asthma compared to adults en-rolled in private insurance.3 CDC BRFSS survey data indicate that during 2005, the rate of adults who have been told they currently have asthma was higher in New Hampshire (10.3%) compared to the na-tional rate (8.0%) and higher rates are reported for lower income groups.4 Smoking behav-ior has been linked to chronic respiratory disease and smoking behavior has been found at higher rates among persons living below poverty level. The finding of higher rates of chronic respiratory disease in the NH Medicaid population compared with CHIS commer-cial is consistent with associations between poverty, smoking, and chronic respiratory dis-ease in other studies.3,6 These results demonstrate a significant disease burden in the NH Medicaid population from chronic respiratory disease. Disease prevalence rates were evaluated by the geographical Health Analysis Area of the member’s residence. Standardized for population age differences, Medicaid prevalence rates of asthma and COPD were higher in northern and more rural New Hampshire HAAs compared to southern HAAs. Although causality cannot be determined, survey data for New Hampshire indicates higher rates of smoking among rural compared to non-rural resi-dents.7
† This study identified members with asthma, COPD, or lung cancer by a diagnosis on any medical claim during the year (CY2005). A wide variety of different algorithms have been used to identify members with asthma from administrative claims data.15 The National Committee for Quality Assurance (NCQA) uses a more com-plex algorithm to identify members with “persistent” asthma.16 A recent study of children by the NH CHIS pro-ject using the NCQA HEDIS methodology yielded a prevalence rate for children covered by Medicaid (9.0%) similar to the rate for children in this report (8.5%).17

Chronic Respiratory Diseases: Prevalence, Utilization, and Payments. New Hampshire, CY2005. 28 Office of Medicaid Business and Policy, NH Department of Health and Human Services, June 2008
This study identified utilization specific to respiratory diagnoses and medication for the members with asthma, COPD, and lung cancer. For each disease, adjusting for population age differences, the Medicaid-only outpatient ED and inpatient use rates were double the CHIS commercial rates. Utilization rates were evaluated by geographical Health Analysis Area in this study. For members with asthma or members with COPD, a pattern of high outpatient ED use was found in the northern and more rural New Hampshire HAAs compared to southern border HAAs. The pattern was found in both the Medicaid and CHIS commercial populations. This pattern is consistent with an earlier NH CHIS study for CY2005 outpatient ED use.11 Despite relatively lower payments per service in Medicaid compared to CHIS commercial, the age-standardized payment rates PMPM for Medicaid-only were higher for members with asthma or COPD compared to CHIS commercial. Higher hospital use rates for ED and inpatient service among Medicaid members is a factor in these differences. The respiratory-disease specific payment rates for Medicaid-only members with asthma were $87 PMPM, with COPD were $323 PMPM, and with lung cancer were $1,594 PMPM. This indicates the significant financial burden per year to treat these chronic respiratory diseases. These rates were restricted to respiratory diagnoses and medications only. Asthma, COPD, or lung cancer may contribute to other diseases that are not specific to res-piratory diagnosis. For example, if lung cancer spreads to other body areas, those claim payments would not have been included in this study if a different diagnostic code were as-signed. Therefore, the rates reported here may underestimate the total burden of these diseases. Selected coexisting conditions were evaluated for persons with chronic respiratory disease in this study. For example, Medicaid members with COPD incurred $102.0 million in pay-ments during CY2005 of which only $16.4 million was specific to COPD, other respiratory diagnoses or respiratory medications. Medicaid members with COPD had high prevalence rates of coexisting conditions (e.g. heart disease, diabetes, mental disorders) and a signifi-cant number resided in nursing facilities during the year. A similar pattern was found for lung cancer and asthma. Coexisting conditions were less prevalent in the CHIS commercial population with these chronic respiratory diseases. The study demonstrated that chronic respiratory disease was prevalent in the NH Medicaid program and members with chronic respiratory disease contribute significantly to utiliza-tion and medical payments of the program. Medicaid hospital outpatient ED and inpatient admissions were at higher rates than CHIS commercial. Finally, members with chronic respiratory disease in Medicaid had complex medical problems as indicated by high rates of coexisting chronic respiratory diseases and other serious medical conditions, and mental disorders. This suggests the potential value of disease management and care coordination for members enrolled in Medicaid to help address these issues. Starting in March 2005 the NH Medicaid Health Management program initiated a Disease Management program for Medicaid recipients with high-cost, chronic diseases. Two of the diseases (asthma and COPD) evaluated in this study of CY2005 Medicaid and CHIS com-mercial were targeted by the program.

Chronic Respiratory Diseases: Prevalence, Utilization, and Payments. New Hampshire, CY2005. 29 Office of Medicaid Business and Policy, NH Department of Health and Human Services, June 2008
Next Steps The current study provided a baseline CY2005 evaluation of prevalence, utilization, and payments associated with three chronic respiratory diseases: asthma, COPD, and lung can-cer. For the first time NH Medicaid members with chronic respiratory disease were com-pared with those with commercial insurance. Several possible areas for future work and evaluation are suggested. This study determined that Medicaid members, and to a lesser degree CHIS commercial members, with chronic respiratory diseases had complex coexisting medical and mental conditions. This includes both coexisting chronic respiratory diseases (e.g. COPD and asthma), coexisting medical (e.g. COPD and heart disease), and coexisting mental condi-tions. This study focused on evaluating the utilization and payments specifically associated with respiratory disease and respiratory medications only, but noted that these payments and utilization only represented a small proportion of the total use and payments for these members with chronic respiratory diseases. A more detailed evaluation of the impact of co-existing conditions on utilization and payments could provide further insight for disease management efforts. Use of a risk grouper might be used to quantify the overall disease burden of these two populations when comparing utilization and payment rates. This would be particularly useful in making comparisons between the Medicaid-only and CHIS commercial populations. For members with chronic respiratory disease, outpatient ED use was significantly higher in the Medicaid population compared to the CHIS commercial population. A new study of chronic outpatient ED users is currently underway by the CHIS project which will help identify the role respiratory diseases play in Medicaid members who use the hospital outpa-tient ED repetitively during the year. National Committee for Quality Assurance, Health Effectiveness Data Information Set (HEDIS) includes a number of quality measures related to respiratory diseases.16 These measures include spirometry testing for new cases of COPD, asthma medication manage-ment for members with “persistent” asthma, and the percent of children with an upper res-piratory infection who were not dispensed an antibiotic. Rates of appropriate medication management for asthma using HEDIS have recently been evaluated and published for chil-dren in the NH Medicaid program.17 The NH CHIS baseline CY2005 study of chronic respi-ratory diseases did not evaluate in detail preventive and quality of care measures. A fol-low-up study comparing utilization and cost for members with asthma using controller medication to members with asthma not using controller medications could help quantify the benefits of programs working to increase controller medication use in New Hampshire. Asthma and COPD are addressed by the Medicaid Disease Management program that was initiated during the CY2005 study year. A more detailed evaluation of the Disease Man-agement program is currently underway by NH CHIS in a separate project. This study identified a high prevalence of chronic respiratory diseases in the Medicaid Dual Eligible population. In fact, more Medicaid Dual Eligible members had COPD and lung cancer than Medicaid-only members. Currently the NH CHIS project does not have access

Chronic Respiratory Diseases: Prevalence, Utilization, and Payments. New Hampshire, CY2005. 30 Office of Medicaid Business and Policy, NH Department of Health and Human Services, June 2008
to Medicare claims data. Therefore, the complete claims payments experience for chronic respiratory disease is unknown, some preventive measures cannot be evaluated, and evaluations using pharmacy will not be possible due to Medicare Part-D for CY2006 and after. It is recommended that efforts be made to acquire and include Medicare claims data into the CHIS data source.

Chronic Respiratory Diseases: Prevalence, Utilization, and Payments. New Hampshire, CY2005. 31 Office of Medicaid Business and Policy, NH Department of Health and Human Services, June 2008
APPENDICES

Chronic Respiratory Diseases: Prevalence, Utilization, and Payments. New Hampshire, CY2005. 32 Office of Medicaid Business and Policy, NH Department of Health and Human Services, June 2008
Appendix 1: Chronic Respiratory Disease in New Hampshire – Study Methods This study was based on administrative eligibility and claims data from New Hampshire Medicaid and the NH CHIS commercial databases for CY2005 (based on date of service). CHIS commercial includes only those members under age 65, residing in NH with both medical and pharmacy coverage linked. 1. NH Medicaid AID groupings. Aggregated enrollment groupings based on the Medicaid program they were eligible for (Appendix 2 provides crosswalk to NH Medicaid detailed eli-gibility categories).
• Elderly • Disabled due to physical condition • Disabled due to mental condition • Severely disabled children • Low income adult • Low income children
Members who had limited or no Medicaid benefits, referred to as the Medicare Buy-In Pro-gram (e.g., Qualified Medicare Beneficiary (QMB), or Specified Low-Income Medicare Bene-ficiary (SLMBY)) were excluded. The Healthy Kids Silver (SCHIP) is not a Medicaid pro-gram and members in this category were also excluded. 2. NH Medicaid was further stratified by Dual Eligible (Medicaid members who were also enrolled in Medicare) and Medicaid-only (Medicaid members who were not also enrolled in Medicare). 3. NH Medicaid Health Analysis Areas. Aggregation of zip codes based on New Hampshire Medicaid Health Analysis Area (HAA) for NH Medicaid enrollees was utilized (Appendix D). Health Analysis Areas are more relevant to how health care is delivered in NH than counties. HAAs are based on the plurality of hospital preference in a given zipcode. 4. Definition of children. Children are defined as age 0-18. A member age 18 is considered a child as requested by New Hampshire DHHS and corresponds to the definition of child for Medicaid eligibility purposes. Age 19 and older defines adults in this report. 5. Member Assignment. Because members may change age, location of residence, or eligi-bility grouping during the year, each member was assigned to one and only one category for reporting. Their eligibility group and Health Analysis Area on the last day of the last month enrolled and their age on the first day of the last month enrolled were used. This methodology is consistent with other NH CHIS reporting. 6. Health Analysis Areas are defined in Appendix 3.

Chronic Respiratory Diseases: Prevalence, Utilization, and Payments. New Hampshire, CY2005. 33 Office of Medicaid Business and Policy, NH Department of Health and Human Services, June 2008
7. Chronic Respiratory Disease (CRD) cohort definitions. Three distinct cohorts were used to define CRD. A member with any of the diagnosis codes listed below on any claim during the year was assigned to a CRD cohort. Asthma was not included in the COPD definition in this report; the American Lung Asso-ciation excludes asthma from the definition of COPD.8
“Chronic obstructive pulmonary disease (COPD) is a term referring to two lung diseases, chronic bronchitis and emphysema, that are characterized by obstruction to airflow that interferes with normal breathing. Both of these conditions frequently coexist, hence physi-cians prefer the term COPD. It does not include other obstructive diseases such as asthma.” Reporting was not mutually exclusive and the same member could be reported in Asthma and also in COPD if they had claims meeting both diagnostic criteria. Disease ICD-9 Codes NH CHIS Study Cohort Malignant neoplasms of trachea, bronchus, and lung
162 Lung Cancer
Chronic Bronchitis 491 COPD Emphysema 492 COPD Chronic airway obstruction, not elsewhere classified
496 COPD
Asthma 493 Asthma 8. Coexisting Conditions. Three coexisting conditions (diabetes, heart disease or stroke, and mental illness) were evaluated for members with CRD. a) Diabetes. This broad definition identified any member with any diagnosis code of diabe-tes (ICD-9 250, 357.2, 362.0, 366.41, 648.0) or dispensed insulin or oral hypoglyce-mics/antihyperglycemics, MHICDRUG 3410,3420,3430. b) Heart, cerebrovascular (stroke), or arterial diseases. This definition identified any member with any ICD-9 diagnosis of 402, 404, 410-414, 415-417, 420-438, 440-447. c) Mental Illness. This definition identified any member with any diagnosis code of mental disorder ICD-9 295, 296.2 -296.3, 296-296.1, 296.4-296.7, 296.8, 296.9, 293, 294, 297, 298, 299, 300, 301, 302, 306, 307, 308, 309, 310, 311, 312, 313, 314, 316. 9. Outpatient Emergency Department Visit Definition. This study focused on outpatient hospital emergency department visits. Emergency department visits were selected based on UB revenue codes 0450-0459 or CPT codes 99281-99285. Visits resulting in inpatient hospitalization were excluded by using Medicaid category of service codes 1,3,103. This definition includes revenue code 0456 hospital urgent care visits which are sometimes ex-cluded from other studies. Visits were further stratified to identify those visits associated with a respiratory disease primary ICD-9 diagnosis code (460-519,162).

Chronic Respiratory Diseases: Prevalence, Utilization, and Payments. New Hampshire, CY2005. 34 Office of Medicaid Business and Policy, NH Department of Health and Human Services, June 2008
10. Office/Clinic Visit Definition. Office or Clinic visits were identified based on CPT codes: 99201, 99202, 99203, 99204, 99205, 99211, 99212, 99213, 99214, 99215, 99354, 99355, 99381, 9938299383, 99384, 99385, 99386, 99387, 99391, 99392, 99393, 99394, 99395, 99396, 99397, 99401, 99402, 99403, 99404, 99411, 99412, 99420, 99429, 99432, T1015, 99241, 99242, 99243, 99244, 99245 or UB revenue codes 510-519, 520-529, or 983. This definition was based on codes found in NCQA HEDIS specifications plus additional codes for NH ru-ral health centers and federally qualified health centers. Visits were further stratified to identify those visits associated with a respiratory disease primary ICD-9 diagnosis code (460-519,162). 11. Inpatient Discharges. NH_CTG_SVC= 1 (corresponds to NH Medicaid category of ser-vice codes 1, 3, and 103). Inpatient discharges were further stratified to identify those vis-its associated with a respiratory disease primary ICD-9 diagnosis code (460-519,162). 12. Members with Community or Home Care. NH_CTG_SVC=9 (corresponds with NH Medicaid category of service codes 26, 49, 50, 57, 60, 63, 64, 65, 66, 73, and 76). 13. Members with Nursing Home Care. NH_CTG_SVC=10 (corresponds to NH Medicaid category of service codes 11, 12, 13, 14, 15, 16, 101, 880). 14. Payments. For Medicaid and CHIS commercial, payments are determined as the claim payments to the provider from the administrative claim files. NH Medicaid or commercial payers may make retroactive payment settlements with hospitals. This study is based only on the payments reflected in the administrative claim files and could not adjust for any ret-roactive payment settlements. 15. Pulmonary Testing. Includes HEDIS CPT codes to identify spirometry (94010, 94014, 94015, 94016, 94060, 94070, 94620) and other pulmonary testing CPT codes (94150, 94160, 94200, 94240, 94250, 94260, 94350, 94360, 94370, 94375, 94400, 94450, 94620, 94621, 94680, 94681, 94690, 94720, 94725, 94750, 94760, 94761, 94762, 94770, 94772, 94799). 16. Oxygen Use. Includes HCPC Level II codes E0424 - E0484, E0550 - E0590, E1353 - E1406 17. Medication Use. For this report use of asthma controller and rescue medications were evaluated. Controller medications included: inhaled corticosteroids (e.g. Advair Diskus™), leukotriene modifiers (e.g. Singulair™), nedocromil, cromolyn sodium, or methylxanthines (e.g. theophylline); MHICDRUG class 0210. Rescue medications include quick acting bron-chodilators (e.g. albuterol); MHICDRUG class 0220. Use of tiotropium (Spiriva™), a new generation of inhaled therapy for treatment of COPD, was not evaluated in this study. 18. Denominator for Population-Based Rates. This study was based on rates of use per member population covered. Not all members are covered for a full year. This is particu-larly true for the Medicaid population where a significant proportion of persons are not cov-ered under Medicaid for the entire year. Therefore, a person covered for a full 12 months would be twice as likely to have an ED visit during the year compared with a person cov-ered for only 6 months. We used standard methods to adjust our denominators for these

Chronic Respiratory Diseases: Prevalence, Utilization, and Payments. New Hampshire, CY2005. 35 Office of Medicaid Business and Policy, NH Department of Health and Human Services, June 2008
differences in exposure time. Thus, average members (cumulative member months divided by 12) was utilized as denominator for rates in this study. 19. Limitations of Medicaid and CHIS Commercial Comparisons. There are some limita-tions in the rate comparisons made in this report. Detailed examination of the NH CHIS commercial data revealed that 4 percent of the members were covered by Indemnity plans (fee-for-service, TPAs). Of the 18,240 CHIS commercial members identified with asthma, 358 (2%) were enrolled in Indemnity plans. Differences in rates could be due to the benefit structures of these plans; claims may not be submitted or paid due to deductibles. Age was limited to age 0-64 in the NH Commercial data; however, the NH Medicaid data included 9 percent of members age 65 or older. These older members were included as part of standard reporting rules for NH Medicaid. 20. Standardization of rates for age differences in the Medicaid-only and CHIS commercial populations was used in this report. The indirect method of age standardization was used and is the preferred method for standardization of rates for geographical analysis of small areas such as the HAAs used in this study. Confidence intervals were computed using methods described by Breslow and Day for indirect standardized rates.18
21. Claims paid by Medicare were not available to the CHIS project and the completeness of data for NH Medicaid members who were Dual Eligible cannot be evaluated. Payment amounts for Dual Eligibles are provided but payment rates PMPM for Dual Eligible mem-bers were suppressed.

Chronic Respiratory Diseases: Prevalence, Utilization, and Payments. New Hampshire, CY2005. 36 Office of Medicaid Business and Policy, NH Department of Health and Human Services, June 2008
Appendix 2: NH Medicaid Eligibility Collapsed Groupings Source: New Hampshire Comprehensive Health Information System Special Project: Defin-ing Medicaid Eligibility Groups. Institute for Health Policy, Muskie School of Public Ser-vice, University of Southern Maine.
Aid Category w Code Medicaid Benefits Collapsed Groupings 10 OAA/CATEGORICALLY NEEDY Yes Elderly 11 OAA/MONEY PAYMENT/CATEGORICALLY NEEDY Yes Elderly 12 OAA/MEDICALLY NEEDY Yes Elderly 20 AFDC/CATEGORICALLY NEEDY Yes Low Income Adult/Child2 21 AFDC/MONEY PAYMENT/CATEGORICALLY NEEDY Yes Low Income Adult/Child 22 AFDC/MEDICALLY NEEDY Yes Low Income Adult/Child 24 AFDC/REG POV LVL/CAT NEEDY 185%FPL Yes Low Income Adult/Child 27 HEALTHY KIDS GOLD - EXPANDED ELIGIBILITY Yes Low Income Child 28 AFDC/POVLEV PREG WOMAN/CHILD/CAT/NEEDY170% FPL Yes Low Income Adult/Child 2B AFDC/HOME CARE-CHILD/SEVERE DISA/MEDI NEEDY Yes Severely Disabled Child 2C AFDC/CHILD WITH SEVERE DISABILITIES/CAT NEEDY Yes Severely Disabled Child 2D AFDC/CHILD WITH SEVERE DISABILITIES/MEDI NEEDY Yes Severely Disabled Child 2E AFDC/EXTENDED MA/FIRST 6 MONTH PERIOD/CAT NEEDY Yes Low Income Adult/Child 2F AFDC/EXT MA/SCND 6 MNTH PER/CAT NEEDY Yes Low Income Adult/Child 2H AFDC/POV LVL PREG WMN/CHILD/CAT NDY/REF170% FPL Yes Low Income Adult/Child 2K AFDC/HOME CARE-CHILD SEV DIS/CAT. NDY FOR INSTI Yes Severely Disabled Child 2U AFDC/AFDC-UP/MONEY PAYMENT/CATEGORICALLY NDY Yes Low Income Adult/Child 2V AFDC/AFDC-UP/CATEGORICALLY NEEDY/MA Yes Low Income Adult/Child 2W AFDC/AFDC-UP/MEDICALLY NEEDY Yes Low Income Adult/Child 2X ADFC/POV LVL PREG WOMEN/POV LVL CHLD CAT NEEDY Yes Low Income Adult/Child 30 ANB/CATEGORICALLY NEEDY Yes Disabled Physical 31 ANB/MONEY PAYMENT/CATEGORICALLY NEEDY Yes Disabled Physical 32 ANB/MEDICALLY NEEDY Yes Disabled Physical 40 IV-E-OR-MA /ADOPT SUB-CAT NEEDY Yes Low Income Child 41 AFDC/FC OR MONEY PAYMENT/CATEGORICALLY NDY Yes Low Income Child 42 AFDC/FC OR MEDICALLY NEEDY Yes Low Income Child 50 APTD/MENTAL/CATEGORICALLY NEEDY Yes Disabled Mental 51 APTD/MENTAL/MONEY PAYMENT/CATEGORICALLY NEEDY Yes Disabled Mental 52 APTD/MENTAL/MEDICALLY NEEDY Yes Disabled Mental 61 HEALTHY KIDS SILVER No Omitted 66 QUALIFIED MEDICARE BENEFICIARY - SLMB120 No Omitted 67 QUALIFIED MEDICARE BENEFICIARY - SLMB135 No Omitted 68 QUALIFIED MEDICARE BENEFICIARY - QDWI No Omitted 69 QMB No Omitted 70 APTD/PHYSICAL/CATEGORICALLY NEEDY Yes Disabled Physical 71 APTD/PHYSICAL/MONEY PAYMENT Yes Disabled Physical 72 APTD-PHYSICAL/MEDICALLY NEEDY Yes Disabled Physical 80 MEAD WITH ANB/APTD APPROVAL - BLIND Yes Disabled Physical 81 MEAD WITH ANB/APTD APPROVAL - PHYSICAL Yes Disabled Physical 82 MEAD WITH ANB/APTD APPROVAL - MENTAL Yes Disabled Mental 83 MEAD ONLY APPROVAL - BLIND Yes Disabled Physical 84 MEAD ONLY APPROVAL - PHYSICAL Yes Disabled Physical 85 MEAD ONLY APPROVAL - MENTAL Yes Disabled Mental
2 Age at beginning of the month is used to designate member as Child <=18 or Adult >18.
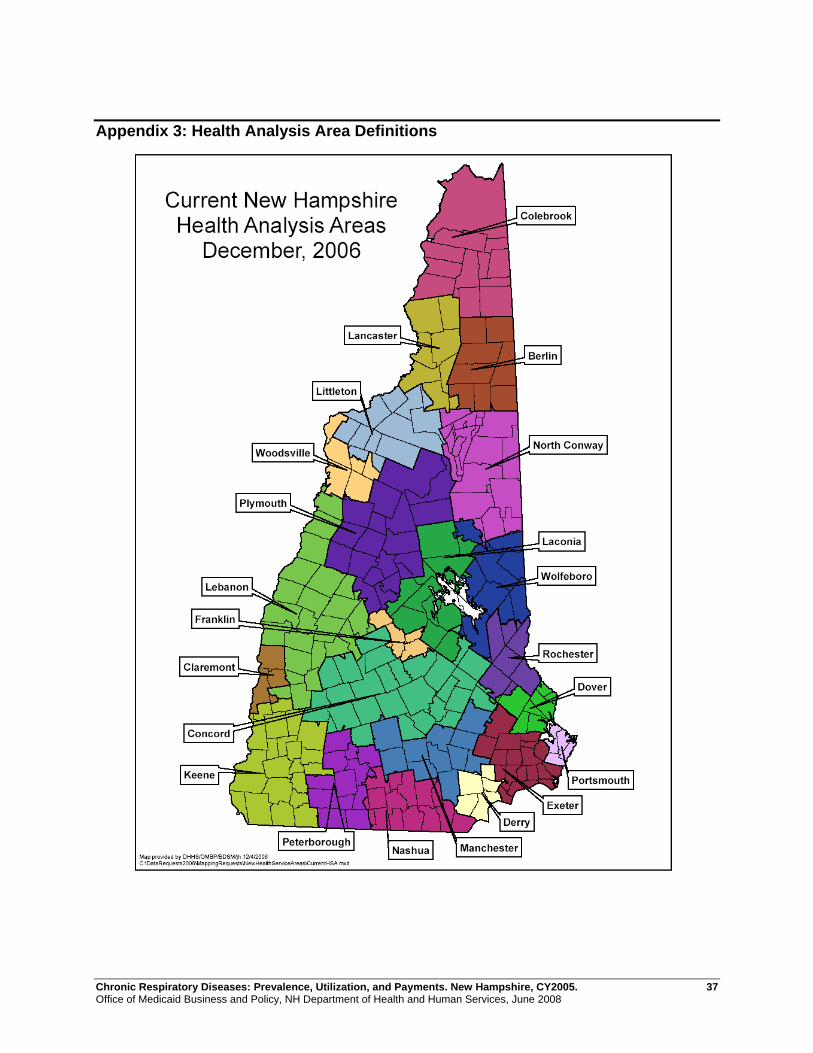
Chronic Respiratory Diseases: Prevalence, Utilization, and Payments. New Hampshire, CY2005. 37 Office of Medicaid Business and Policy, NH Department of Health and Human Services, June 2008
Appendix 3: Health Analysis Area Definitions
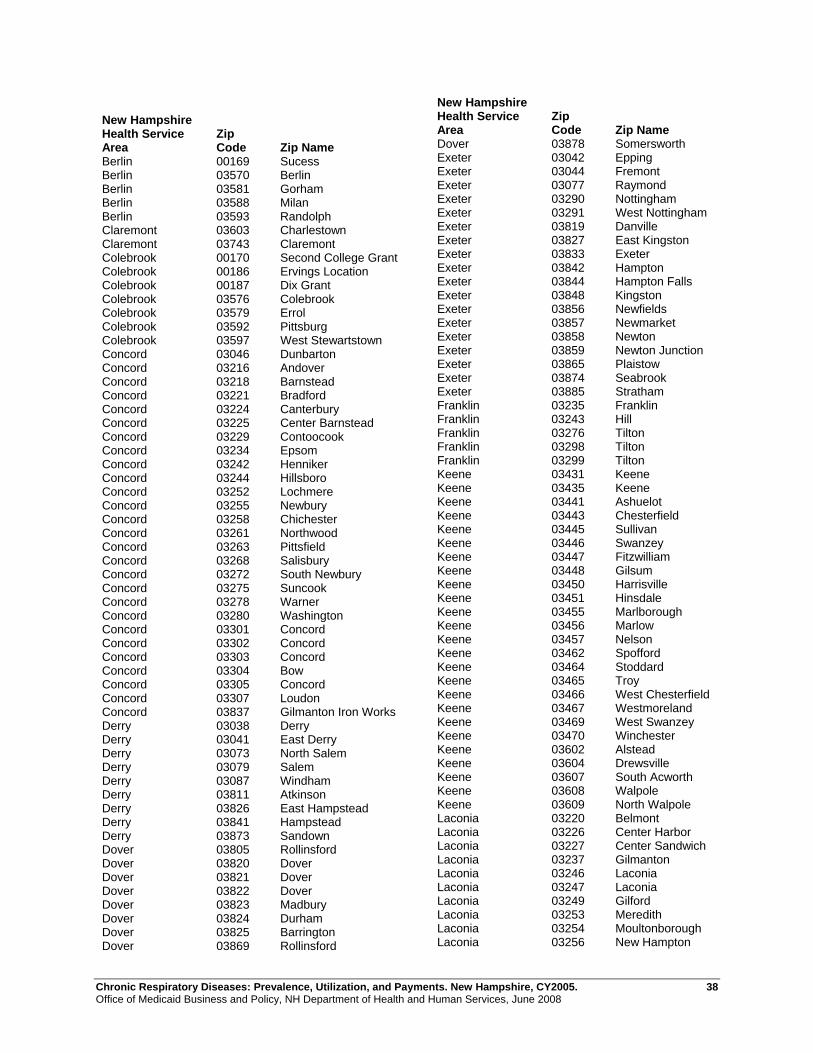
Chronic Respiratory Diseases: Prevalence, Utilization, and Payments. New Hampshire, CY2005. 38 Office of Medicaid Business and Policy, NH Department of Health and Human Services, June 2008
New Hampshire Health Service Area
Zip Code Zip Name
Berlin 00169 Sucess Berlin 03570 Berlin Berlin 03581 Gorham Berlin 03588 Milan Berlin 03593 Randolph Claremont 03603 Charlestown Claremont 03743 Claremont Colebrook 00170 Second College Grant Colebrook 00186 Ervings Location Colebrook 00187 Dix Grant Colebrook 03576 Colebrook Colebrook 03579 Errol Colebrook 03592 Pittsburg Colebrook 03597 West Stewartstown Concord 03046 Dunbarton Concord 03216 Andover Concord 03218 Barnstead Concord 03221 Bradford Concord 03224 Canterbury Concord 03225 Center Barnstead Concord 03229 Contoocook Concord 03234 Epsom Concord 03242 Henniker Concord 03244 Hillsboro Concord 03252 Lochmere Concord 03255 Newbury Concord 03258 Chichester Concord 03261 Northwood Concord 03263 Pittsfield Concord 03268 Salisbury Concord 03272 South Newbury Concord 03275 Suncook Concord 03278 Warner Concord 03280 Washington Concord 03301 Concord Concord 03302 Concord Concord 03303 Concord Concord 03304 Bow Concord 03305 Concord Concord 03307 Loudon Concord 03837 Gilmanton Iron Works Derry 03038 Derry Derry 03041 East Derry Derry 03073 North Salem Derry 03079 Salem Derry 03087 Windham Derry 03811 Atkinson Derry 03826 East Hampstead Derry 03841 Hampstead Derry 03873 Sandown Dover 03805 Rollinsford Dover 03820 Dover Dover 03821 Dover Dover 03822 Dover Dover 03823 Madbury Dover 03824 Durham Dover 03825 Barrington Dover 03869 Rollinsford
New Hampshire Health Service Area
Zip Code Zip Name
Dover 03878 Somersworth Exeter 03042 Epping Exeter 03044 Fremont Exeter 03077 Raymond Exeter 03290 Nottingham Exeter 03291 West Nottingham Exeter 03819 Danville Exeter 03827 East Kingston Exeter 03833 Exeter Exeter 03842 Hampton Exeter 03844 Hampton Falls Exeter 03848 Kingston Exeter 03856 Newfields Exeter 03857 Newmarket Exeter 03858 Newton Exeter 03859 Newton Junction Exeter 03865 Plaistow Exeter 03874 Seabrook Exeter 03885 Stratham Franklin 03235 Franklin Franklin 03243 Hill Franklin 03276 Tilton Franklin 03298 Tilton Franklin 03299 Tilton Keene 03431 Keene Keene 03435 Keene Keene 03441 Ashuelot Keene 03443 Chesterfield Keene 03445 Sullivan Keene 03446 Swanzey Keene 03447 Fitzwilliam Keene 03448 Gilsum Keene 03450 Harrisville Keene 03451 Hinsdale Keene 03455 Marlborough Keene 03456 Marlow Keene 03457 Nelson Keene 03462 Spofford Keene 03464 Stoddard Keene 03465 Troy Keene 03466 West Chesterfield Keene 03467 Westmoreland Keene 03469 West Swanzey Keene 03470 Winchester Keene 03602 Alstead Keene 03604 Drewsville Keene 03607 South Acworth Keene 03608 Walpole Keene 03609 North Walpole Laconia 03220 Belmont Laconia 03226 Center Harbor Laconia 03227 Center Sandwich Laconia 03237 Gilmanton Laconia 03246 Laconia Laconia 03247 Laconia Laconia 03249 Gilford Laconia 03253 Meredith Laconia 03254 Moultonborough Laconia 03256 New Hampton

Chronic Respiratory Diseases: Prevalence, Utilization, and Payments. New Hampshire, CY2005. 39 Office of Medicaid Business and Policy, NH Department of Health and Human Services, June 2008
New Hampshire Health Service Area
Zip Code Zip Name
Laconia 03259 North Sandwich Laconia 03269 Sanbornton Laconia 03289 Winnisquam Laconia 03883 South Tamworth Lancaster 00185 Kilkenny Lancaster 03582 Groveton Lancaster 03583 Jefferson Lancaster 03584 Lancaster Lancaster 03587 Meadows Lancaster 03590 North Stratford Lebanon 03230 Danbury Lebanon 03231 East Andover Lebanon 03233 Elkins Lebanon 03240 Grafton Lebanon 03257 New London Lebanon 03260 North Sutton Lebanon 03273 South Sutton Lebanon 03284 Springfield Lebanon 03287 Wilmot Lebanon 03601 Acworth Lebanon 03605 Lempster Lebanon 03741 Canaan Lebanon 03745 Cornish Lebanon 03746 Cornish Flat Lebanon 03748 Enfield Lebanon 03749 Enfield Center Lebanon 03750 Etna Lebanon 03751 Georges Mills Lebanon 03752 Goshen Lebanon 03753 Grantham Lebanon 03754 Guild Lebanon 03755 Hanover Lebanon 03756 Lebanon Lebanon 03765 Haverhill Lebanon 03766 Lebanon Lebanon 03768 Lyme Lebanon 03769 Lyme Center Lebanon 03770 Meriden Lebanon 03773 Newport Lebanon 03777 Orford Lebanon 03779 Piermont Lebanon 03781 Plainfield Lebanon 03782 Sunapee Lebanon 03784 West Lebanon Littleton 03561 Littleton Littleton 03574 Bethlehem Littleton 03580 Franconia Littleton 03585 Lisbon Littleton 03586 Sugar Hill Littleton 03595 Twin Mountain Littleton 03598 Whitefield Manchester 03032 Auburn Manchester 03034 Candia Manchester 03036 Chester Manchester 03037 Deerfield Manchester 03040 East Candia Manchester 03045 Goffstown Manchester 03053 Londonderry Manchester 03070 New Boston
New Hampshire Health Service Area
Zip Code Zip Name
Manchester 03101 Manchester Manchester 03102 Manchester Manchester 03103 Manchester Manchester 03104 Manchester Manchester 03105 Manchester Manchester 03106 Hooksett Manchester 03107 Manchester Manchester 03108 Manchester Manchester 03109 Manchester Manchester 03110 Bedford Manchester 03111 Manchester Manchester 03281 Weare Nashua 03031 Amherst Nashua 03033 Brookline Nashua 03048 Greenville Nashua 03049 Hollis Nashua 03051 Hudson Nashua 03052 Litchfield Nashua 03054 Merrimack Nashua 03055 Milford Nashua 03057 Mont Vernon Nashua 03060 Nashua Nashua 03061 Nashua Nashua 03062 Nashua Nashua 03063 Nashua Nashua 03064 Nashua Nashua 03076 Pelham Nashua 03082 Lyndeborough Nashua 03086 Wilton North Conway 00168 Beans Purchase North Conway 00172 Hadleys Purchase North Conway 00173 Cutts Grant North Conway 00174 Beans Grant North Conway 00176 Sargents Purchase North Conway 00177 Pinkham Grant North Conway 00179 Chandlers Purchase
North Conway 00180 Thompson/Meserves Purch
North Conway 00181 Low and Burbanks Grant North Conway 00182 Crawfords Purchase North Conway 00183 Greens Grant North Conway 00184 Martins Location North Conway 03575 Bretton Woods North Conway 03589 Mount Washington North Conway 03812 Bartlett North Conway 03813 Center Conway North Conway 03817 Chocorua North Conway 03818 Conway North Conway 03832 Eaton Center North Conway 03838 Glen North Conway 03845 Intervale North Conway 03846 Jackson North Conway 03847 Kearsarge North Conway 03849 Madison North Conway 03860 North Conway North Conway 03875 Silver Lake North Conway 03890 West Ossipee Peterborough 03043 Francestown Peterborough 03047 Greenfield

Chronic Respiratory Diseases: Prevalence, Utilization, and Payments. New Hampshire, CY2005. 40 Office of Medicaid Business and Policy, NH Department of Health and Human Services, June 2008
New Hampshire Health Service Area
Zip Code Zip Name
Peterborough 03071 New Ipswich Peterborough 03084 Temple Peterborough 03440 Antrim Peterborough 03442 Bennington Peterborough 03444 Dublin Peterborough 03449 Hancock Peterborough 03452 Jaffrey Peterborough 03458 Peterborough Peterborough 03461 Rindge Peterborough 03468 West Peterborough Plymouth 03215 Waterville Valley Plymouth 03217 Ashland Plymouth 03222 Bristol Plymouth 03223 Campton Plymouth 03232 East Hebron Plymouth 03241 Hebron Plymouth 03245 Holderness Plymouth 03251 Lincoln Plymouth 03262 North Woodstock Plymouth 03264 Plymouth Plymouth 03266 Rumney Plymouth 03274 Stinson Lake Plymouth 03279 Warren Plymouth 03282 Wentworth Plymouth 03293 Woodstock Portsmouth 03801 Portsmouth Portsmouth 03802 Portsmouth Portsmouth 03803 Portsmouth Portsmouth 03804 Portsmouth Portsmouth 03840 Greenland Portsmouth 03843 Hampton Portsmouth 03854 New Castle Portsmouth 03862 North Hampton Portsmouth 03870 Rye Portsmouth 03871 Rye Beach Rochester 03815 Center Strafford Rochester 03835 Farmington Rochester 03839 Rochester Rochester 03851 Milton Rochester 03852 Milton Mills Rochester 03855 New Durham Rochester 03866 Rochester Rochester 03867 Rochester Rochester 03868 Rochester Rochester 03884 Strafford Rochester 03887 Union Wolfeboro 03809 Alton Wolfeboro 03810 Alton Bay Wolfeboro 03814 Center Ossipee Wolfeboro 03816 Center Tuftonboro Wolfeboro 03830 East Wakefield Wolfeboro 03836 Freedom Wolfeboro 03850 Melvin Village Wolfeboro 03853 Mirror Lake Wolfeboro 03864 Ossipee Wolfeboro 03872 Sanbornville Wolfeboro 03882 Effingham Wolfeboro 03886 Tamworth Wolfeboro 03894 Wolfeboro
New Hampshire Health Service Area
Zip Code Zip Name
Wolfeboro 03896 Wolfeboro Falls Wolfeboro 03897 Wonalancet Woodsville 03238 Glencliff Woodsville 03740 Bath Woodsville 03771 Monroe Woodsville 03774 North Haverhill Woodsville 03780 Pike Woodsville 03785 Woodsville

Chronic Respiratory Diseases: Prevalence, Utilization, and Payments. New Hampshire, CY2005. 41 Office of Medicaid Business and Policy, NH Department of Health and Human Services, June 2008
REFERENCES 1 Health, United States, 2006. With Chartbook on Trends in the Health of Americans. National Center for Health Statistics. 2007http://www.cdc.gov/nchs/hus.htm Accessed April 1, 2007. 2 TL Petty. Scope of the COPD Problem in North American: Early Studies of Prevalence and NHANES III Data: Basis for Early Identification and Intervention. Chest. 2000:117:326-331. http://www.chestjournal.org/cgi/reprint/117/5_suppl_2/326S.pdf. Accessed April 1, 2007. 3 Summary Health Statistics for U.S. Adults: National Health Interview Survey, 2005. National Center for Health Statistics. Vital Health Stat 10(232). 2006. http://www.cdc.gov/nchs/data/series/sr_10/sr10_232.pdf. Accessed April 15, 2007 4 2005 Prevalence Data. Behavioral Risk Factor Surveillance System. National Center for Chronic Disease Prevention and Health Promotion. http://www.cdc.gov/brfss Accessed September 15, 2007. 5 Centers for Disease Control and Prevention (CDC). Behavioral Risk Factor Surveillance System Survey Data. http://apps.nccd.cdc.gov/brfss/Trends/TrendData.asp. Accessed April 1, 2007. 6 Cigarette Smoking Among Adults – United States, 2002. MMWR 2004:53(20):427-431. http://no-smoking.org/may04/05-27-04-4.html. Accessed April 15, 2007. 7 Chronic Diseases: The Leading Causes of Death. New Hampshire. National Center for Chronic Disease Pre-vention and Health Promotion. http://www.cdc.gov/nccdphp/publications/factsheets/ChronicDisease/new_hampshire.htm. Accessed May 1, 2007. 8 Chronic Diseases: The Leading Causes of Death. New Hampshire. National Center for Chronic Disease Pre-vention and Health Promotion. http://www.cdc.gov/nccdphp/publications/factsheets/ChronicDisease/new_hampshire.htm. Accessed April 15, 2007. 9 Chronic Obstructive Pulmonary Disease (COPD) Fact Sheet. Amercian Lung Association. August, 2006. http://www.lungusa.org/site/pp.asp?c=dvLUK9O0E&b=35020. Accessed May 1, 2007. 10 Medicaid HEDIS 2006 Means, Percentiles and Ratios. Commercial HEDIS 2006 Means, Percentiles and Ra-tios. National Committee for Quality Assurance. Updated April 23, 2007. http://web.ncqa.org/Default.aspx?tabid=334. Accessed May 1, 2007. 11 2005 Emergency Department Use in New Hampshire: A Comparison of the Medicaid and Commercially In-sured Populations. 2007 NH CHIS Project. http://www.dhhs.state.nh.us/DHHS/OMBP/LIBRARY/Data-Statistical+Report/emergency-use.htm. Accessed June 15, 2007. 12 McLaughlin T, Leibman C, Patel P, Camargo CA. Risk of recurrent emergency department visits or hospitalizations in children with asthma receiving nebulized budesonide inhalation suspension compared with other asthma medications. Curr Med Res Opin. 2007 Apr 27. http://www.ncbi.nlm.nih.gov/sites/entrez?. Accessed August 1, 2007. 13 New Hampshire DHHS Health Management Program. http://www.dhhs.state.nh.us/DHHS/OCOM/GraniteCare/Medicaid-disease-managment.htm. Accessed August 1, 2007. 14 New Hampshire DHHS Enhanced Care Coordination Pilot Program. http://www.dhhs.state.nh.us/DHHS/OCOM/GraniteCare/enhancedcare.htm

Chronic Respiratory Diseases: Prevalence, Utilization, and Payments. New Hampshire, CY2005. 42 Office of Medicaid Business and Policy, NH Department of Health and Human Services, June 2008
15 Lix L, Yogendran M, Burchill C, et.al. Defining and Validating Chronic Diseases: An Administrative Data Approach. Manitoba Centre for Health Policy. July 2006. http://www.umanitoba.ca/centres/mchp/reports/pdfs/2005-2008/chronic.disease.pdf Accessed July, 2007. 16 HEDIS 2007, Technical Specifications, Volume 2. National Committee for Quality Assurance. 2006. www.ncqa.org. 17 Children’s Health Insurance Programs in New Hampshire. Access, Preventive, Care Management, Utiliza-tion, and Payments, State Fiscal Year 2006. January, 2006. http://www.dhhs.state.nh.us/DHHS/OMBP/LIBRARY/Data-Statistical+Report/chip.htm. Accessed January, 2008. 18 Breslow NE and Day NE. Statistical Methods in Cancer Research. Volume II – The Design and Analysis of Cohort Studies. World Health Organization. 1987.