The AMIGA muon counters of the Pierre Auger Observatory ...
4
32ND I NTERNATIONAL COSMIC RAY CONFERENCE,BEIJING 2011 The AMIGA muon counters of the Pierre Auger Observatory: performance and first data BRIAN WUNDHEILER 1 FOR THE PIERRE AUGER COLLABORATION 2 1 Instituto de Tecnolog´ ıas en Detecci´ on y Astropart´ ıculas (CNEA-CONICET-UNSAM), Av. Gral Paz 1499 (1650) Buenos Aires, Argentina. 2 Observatorio Pierre Auger, Av. San Mart´ ın Norte 304 (5613) Malarg¨ ue, Argentina. (Full author list: http://www.auger.org/archive/authors_2011_05.html) auger_[email protected] Abstract: In this paper we introduce a full simulation of the AMIGA muon counters including, the modeling of its scintillators, wavelength shifter fibers, multi-anode photomultipliers, and front-end electronics. A novel technique for muon counting for such underground detectors based on their signal-time structure is presented. The proposed counting technique is evaluated with real and simulated muon pulses. Simulations of extensive air showers and particle propagation through matter were included in an end-to-end simulation chain. Preliminary results of the first muon counter modules installed at the Pierre Auger Observatory are presented. Keywords: Muon Counter, AMIGA, Pierre Auger Observatory. 1 Introduction The transition from galactic to extragalactic cosmic rays is still a poorly known phenomena, and composition stud- ies are fundamental to thoroughly understand it. The Pierre Auger Collaboration is building an upgrade named AMIGA (Auger Muons and Infill for the Ground Array) to both extend the energy threshold of the ground array down to 0.1 EeV, and determine the muon component of extensive air showers aiding primary particle identification. AMIGA consists of an infilled area having 85 pairs of water Cherenkov surface detectors and scintillator muon counters buried underground to avoid the electromagnetic compo- nent of the shower to be detected [1, 2]. In this work we describe a full simulation for the AMIGA muon detectors, and introduce a novel technique for muon counting. Finally, we present some preliminary outcomes of the first counter modules installed at the Pierre Auger Observatory. 2 The muon counters The AMIGA muon detector (MD) consists of 30 m 2 scin- tillator counters buried 2.3 m underground. The MD counts muons of air showers observed by the Pierre Auger Obser- vatory, which are reconstructed by its Surface and Fluo- rescence Detector systems. Each counter has three 10 m 2 modules with 4.1 cm wide × 1.0 cm high × 400 cm long strips. Each module consists of 64 strips made of extruded polystyrene doped with fluor and co-extruded with a TiO 2 reflecting coating. The strips have a groove where a wave- length shifter optical fiber (WLS) is glued and covered with a reflective foil. The manifold of fibers ends in an opti- cal connector matched to a 64 multi-anode PMT from the Hamamatsu H8804 series (2 mm × 2 mm pixel size). Scin- tillators are grouped in two sets of 32 strips on each side of the PMT. The bandwidth of the front-end electronics is set to 180 MHz to limit the pulse width. Signal sampling is per- formed by an FPGA at 320 MHz with an external mem- ory to store up to 6 ms of data, equivalent to 1024 showers [3, 4]. Stored samples of each strip are collections of log- ical 1 or 0 depending on whether the signal surpasses a given adjustable threshold, which is foreseen to be around 30% of the mean height of a single photoelectron (SPE). This method is very robust since it neither relies on decon- voluting the number of muons from an integrated signal, nor on the PMT gain or its fluctuations, nor on the muon hitting position on the scintillator strip and the correspond- ing light attenuation along the fiber. It also does not re- quire a thick scintillator to control poissonian fluctuations in the number of SPEs per impinging muon. This one-bit electronics design relies on a fine counter segmentation in strips to prevent undercounting due to simultaneous muon arrivals [5]. One unwanted feature of multi-anode PMTs is the crosstalk (XT) between neighboring pixels. In systems in which the discrimination is set below the SPE height, this effect can lead to a considerable overcounting. An ef- ficient technique is then needed to avoid this effect while
-
Upload
trinhxuyen -
Category
Documents
-
view
214 -
download
1
Transcript of The AMIGA muon counters of the Pierre Auger Observatory ...
32ND INTERNATIONAL COSMIC RAY CONFERENCE, BEIJING 2011
The AMIGA muon counters of the Pierre Auger Observatory: performance and first data
BRIAN WUNDHEILER1 FOR THEPIERRE AUGER COLLABORATION2
1Instituto de Tecnologıas en Deteccion y Astropartıculas (CNEA-CONICET-UNSAM), Av. Gral Paz 1499 (1650) BuenosAires, Argentina.2Observatorio Pierre Auger, Av. San Martın Norte 304 (5613) Malargue, Argentina.(Full author list: http://www.auger.org/archive/authors_2011_05.html)[email protected]
Abstract: In this paper we introduce a full simulation of the AMIGA muoncounters including, the modeling of itsscintillators, wavelength shifter fibers, multi-anode photomultipliers, and front-end electronics. A novel technique formuon counting for such underground detectors based on theirsignal-time structure is presented. The proposed countingtechnique is evaluated with real and simulated muon pulses.Simulations of extensive air showers and particle propagationthrough matter were included in an end-to-end simulation chain. Preliminary results of the first muon counter modulesinstalled at the Pierre Auger Observatory are presented.
Keywords: Muon Counter, AMIGA, Pierre Auger Observatory.
1 Introduction
The transition from galactic to extragalactic cosmic raysis still a poorly known phenomena, and composition stud-ies are fundamental to thoroughly understand it. ThePierre Auger Collaboration is building an upgrade namedAMIGA ( AugerMuons andInfill for the GroundArray)to both extend the energy threshold of the ground arraydown to 0.1 EeV, and determine the muon component ofextensive air showers aiding primary particle identification.AMIGA consists of an infilled area having 85 pairs of waterCherenkov surface detectors and scintillator muon countersburied underground to avoid the electromagnetic compo-nent of the shower to be detected [1, 2].
In this work we describe a full simulation for the AMIGAmuon detectors, and introduce a novel technique for muoncounting. Finally, we present some preliminary outcomesof the first counter modules installed at the Pierre AugerObservatory.
2 The muon counters
The AMIGA muon detector (MD) consists of 30 m2 scin-tillator counters buried 2.3 m underground. The MD countsmuons of air showers observed by the Pierre Auger Obser-vatory, which are reconstructed by its Surface and Fluo-rescence Detector systems. Each counter has three 10 m2
modules with 4.1 cm wide×1.0 cm high×400 cm longstrips. Each module consists of 64 strips made of extruded
polystyrene doped with fluor and co-extruded with a TiO2
reflecting coating. The strips have a groove where a wave-length shifter optical fiber (WLS) is glued and covered witha reflective foil. The manifold of fibers ends in an opti-cal connector matched to a 64 multi-anode PMT from theHamamatsu H8804 series (2 mm×2 mm pixel size). Scin-tillators are grouped in two sets of 32 strips on each side ofthe PMT.
The bandwidth of the front-end electronics is set to 180MHz to limit the pulse width. Signal sampling is per-formed by an FPGA at 320 MHz with an external mem-ory to store up to 6 ms of data, equivalent to 1024 showers[3, 4]. Stored samples of each strip are collections of log-ical 1 or 0 depending on whether the signal surpasses agiven adjustable threshold, which is foreseen to be around30% of the mean height of a single photoelectron (SPE).This method is very robust since it neither relies on decon-voluting the number of muons from an integrated signal,nor on the PMT gain or its fluctuations, nor on the muonhitting position on the scintillator strip and the correspond-ing light attenuation along the fiber. It also does not re-quire a thick scintillator to control poissonian fluctuationsin the number of SPEs per impinging muon. Thisone-bitelectronics design relies on a fine counter segmentation instrips to prevent undercounting due to simultaneous muonarrivals [5]. One unwanted feature of multi-anode PMTs isthe crosstalk (XT) between neighboring pixels. In systemsin which the discrimination is set below the SPE height,this effect can lead to a considerable overcounting. An ef-ficient technique is then needed to avoid this effect while

B. WUNDHEILER et al. THE AMIGA MUON COUNTERS OF THEPIERRE AUGER OBSERVATORY
not missing real signals in the process. This subject is ad-dressed in section 3.2.
3 Simulations and counting strategies
The MD simulation chain implements phenomenologicalmodels which include several experimental parameters. Inthis way most of first principle processes are parametrisedimproving considerably the computational performance.Before considering the counting techniques, two mainblocks of the simulation are described in the following sec-tion: injection of particle traces and front-end electronicssignal processing.
3.1 Injection methods and front-end electronics
While the front-end simulation is common for every parti-cle injection method, there are three alternatives for inject-ing traces: injection of real particle traces (real injectionmethod), traces from simulated particle tracks (simulatedinjection method), and traces derived from simulated en-ergy deposition (energy deposition method).
Real injection method
This method allows laboratory measured muon pulses to beincorporated as an input to the front-end electronics simu-lation. These pulses are measured using the same type ofscintillators, fibers and PMTs employed in the constructionof the MDs. In Fig. 1 a real muon pulse is shown. Eachmeasured signal is interpolated with a spline function tofeed the analog electronics stage of the simulation.
Time (ns)0 10 20 30 40 50 60 70 80
PM
T o
utpu
t cur
rent
(m
A)
-2.5
-2
-1.5
-1
-0.5
0
Real Muon Pulse
Figure 1: A laboratory measurement of a muon pulse isincorporated as coming out of the PMT in the real injec-tion method. A spline interpolation is used as an input ofthe front-end electronics in the next link of the simulationchain.
Simulated injection method
In this method both the muon impinging position on theMD and its momentum direction can be selected. The
muon signal is modeled as a superposition of SPE pulses
Iµ(t) =
Nspe∑
i=0
Ispei (t − ti). (1)
EachIspe is taken to be of gaussian shape, whose ampli-tude and time width are fluctuated around their mean mea-sured values. Its reference timeti has two contributions:the decay time of both scintillator and fiber, and the de-lay due to propagation through the WLS. While the latteris geometrically calculated, the mean value of the formeris measured and then used to randomly generate exponen-tially distributed times. The number of SPEs (Nspe) is apoissonian random integer whose mean value depends onthe impinging point according to the〈Nspe〉 obtained fromthe measured fiber attenuation curve. This mean valueis rescaled with the particle zenith angle of incidence (as1/ cos θ). The XT effect is incorporated in the simulationby tossing the destination of each SPE produced: it can endup in the pixel corresponding to the impinged scintillator,or in any of its neighbors. The probability is determinedaccording to the XT ratio which is measured for each ofthe 64 pixels.
Energy deposition method
Finally, in the third method of injection, energy deposition(Edep) on a given point of the MD is indicated. This in-put can be generated with dedicated packages that simulateparticle propagation through matter [6], as described in sec-tion 4. The deposited energy is normalised with the〈Edep〉of vertical simulated muons in 1 cm thick scintillator [7]and correlated with〈Nspe〉 extracted from the same atten-uation curve used in the previous method.
Front-end electronics
The analog front-end behavior is mimicked as being anideal inverter amplifier with a 3 dB point at 180 MHz. Eachreal or simulated muon pulse is convoluted with the am-plifier transference function to obtain the analog voltageresponse. A voltage threshold is set to discriminate the am-plified signal resulting in a digital pulse. The fall and risetimes of the discriminator are taken to be finite at a constant2.2 V/ns.
The simulated FPGA sampling, which is performed on thedigital pulse of the previous stage, has two levels of thresh-olds. If the signal is higher than a givenVhigh the sampleis set to 1, if the signal is lower thanVlow it is set to 0. Ifthe signal falls in between these voltages of reference, thesample remains in the same state as the previous one.
In Fig. 2 the processing of the real muon pulse of Fig. 1by the simulated front-end electronics is shown. Since thebandwidth is set to 180 MHz, higher frequency details ofthe muon pulse are weakened. The discriminated signal ata threshold of 30%〈Vspe〉 is also shown. The displayed

32ND INTERNATIONAL COSMIC RAY CONFERENCE, BEIJING 2011
FPGA samples of this signal constitute the digital trace tobe analysed in the counting process.
20 30 40 50 60 70 80 90
0
200
400
600
800
1000
Time (ns)di
scrim
inat
or o
utpu
t vol
tage
(m
V)
0
500
1000
1500
2000
2500
3000
discriminationlevel
outcomingpulse
discriminatoroutput
FPGAdigital
samples
fron
t-en
d ou
tput
vol
tage
(m
V)
Figure 2: Simulated electronics response to a real muonpulse. The signal is inverted, amplified and the higher fre-quencies are filtered (thick dash line), the discriminationlevel is at 30%〈Vspe〉 and FPGA sampling produces thedigitised signal.
3.2 Analyses and counting techniques
The digital traces obtained by any of the previous meth-ods, must be analysed to determine the number of muons.The counting strategies are based on a pattern recognitionwithin a given time windoww. Three strategies are consid-ered:nQw, nCw, andnGw. They are defined as follows: amuon is counted withnQw if n onesare found in any po-sition in the time window, withnCw theonesmust be alsoconsecutive, and withnGw if n consecutiveonesare foundwith one sample (0 or 1) among them. Thew parameter de-pends mainly on the fiber type and on the PMT model andoperation. It can be selected from measurements of muonpulse widths at the discrimination level, or from simulatedsignals if they can reproduce the real time width distribu-tions. As an example, in Fig. 3 a comparison between realmuon pulses with simulated ones is made.
Simulated muon pulses were analysed with each technique,the2G30ns strategy was found to have the best counted-to-impinging muons ratio when sampling at 320 MHz. Us-ing the real injection method a counting ratio of 99% wasfound at 110 cm from the PMT, 99% at 297 cm, and 88%at 482 cm. The last point corresponds to the longest lengthof fiber present in the MDs, where light attenuation makespulses more likely to be one SPE than in any other posi-tion, setting a lower limit to the counting ratio. In Fig. 4the counting ratio of each strategy is evaluated at differentthresholds for simulated muons at 2 m from the PMT. The2G30ns is the best suited method for counting muons asit eliminates the overcounting due to XT regardless of thethreshold, and it has the best counting ratio for the mainpixel at 30%〈Vspe〉. The measured mean width of an SPEpulse after discrimination is (3.75± 0.36) ns. The FPGAworking at 320 MHz can sample one SPE pulse at mosttwice consecutively. The2G30ns precludes it to be counted
demanding an extra sample between twoones, irrespectiveof whether it is 0 or 1.
experiment
muon pulse width (ns)10 20 30 40 50 60 70 800.00
0.05
0.10
0.15
0.20
0.25
experiment
simulationsimulation
experiment
simulation
Figure 3: Normalised histograms for the width of real andsimulated muon pulses at an impinging distance of 1.5 mfrom the PMT at 30%〈Vspe〉 level.
discrimination threshold (mV)60 80 100 120 140 160 180 200 220
coun
ted
/ im
ping
ing
muo
ns
-0.2
0
0.2
0.4
0.6
0.8
1
1.2
1.4Main Pixel
2G30ns
2C30ns
2Q30ns
Neighbor Pixels2G30ns2C30ns2Q30ns
> le
vel
spe
~30%
<V
Figure 4: Counting techniques at 2 m from the PMT withsimulated muons. The2G30ns strategy has a counting ratioof 1 at 30%〈Vspe〉 whereas the sum of the contributions ofthe neighboring pixels is negligible.
4 First data from the Observatory
The Pierre Auger Collaboration has installed four MDmodules at the Observatory site since Nov 2009. The MDis meant to be triggered externally by its associated SDstation [2]. Nevertheless an internal trigger mode is usedfor debugging the system and for monitoring and calibra-tion purposes. This internal trigger is activated whenevernor more channels coincidently show discriminated signals.The software development for the 320 MHz FPGA sam-pling is in its final stage, the preliminary measurements onsite were taken at 80 MHz. A clustering structure, whichshows activated strips grouped together, is very commonto be found among internally triggered events withn = 8(IT8). Since multiple scintillator strips triggered by one
B. WUNDHEILER et al. THE AMIGA MUON COUNTERS OF THEPIERRE AUGER OBSERVATORY
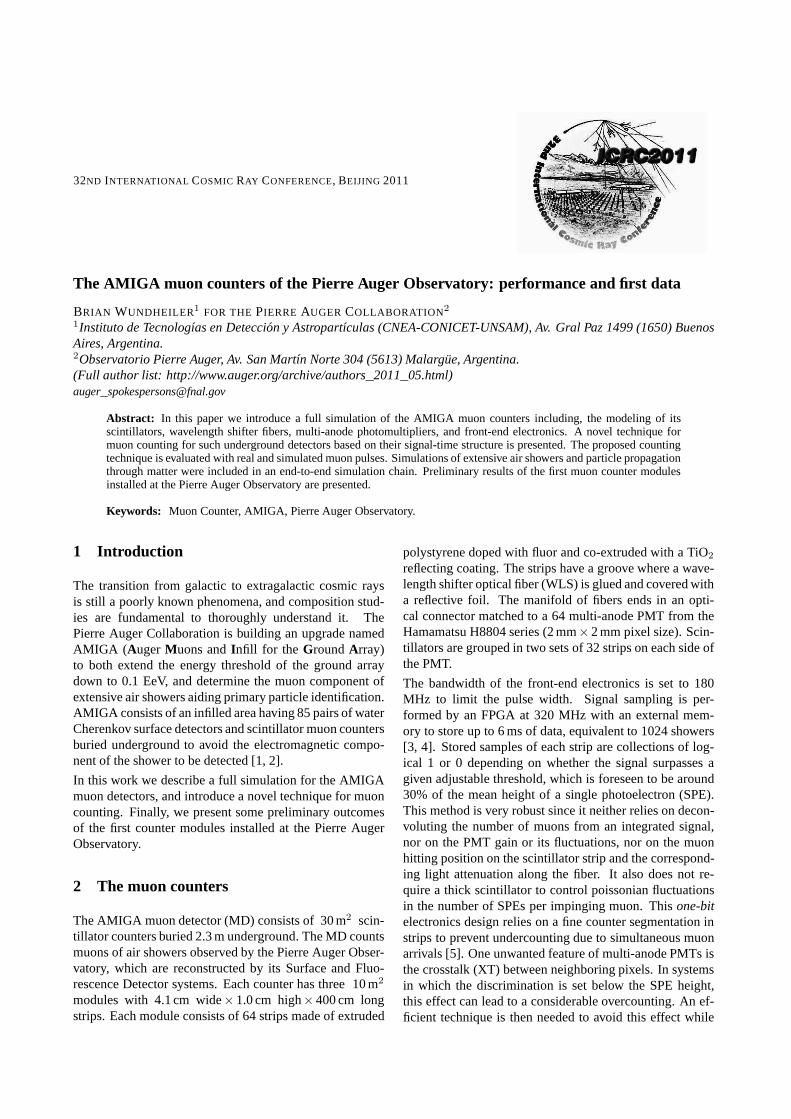
muon are very unlikely, IT8s are thought to be generated bysmall showers, and the low rate of these events (∼0.1 Hz) isconsistent with this idea. The clustering effect is still understudy.
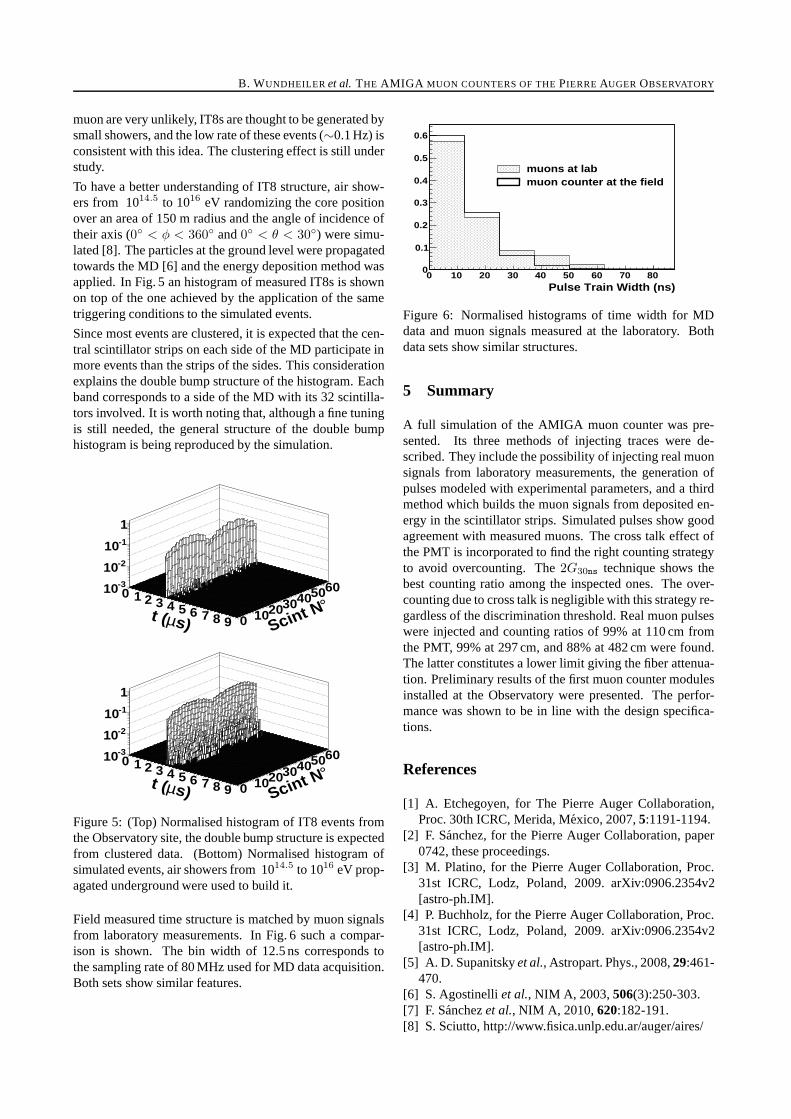
To have a better understanding of IT8 structure, air show-ers from 1014.5 to 1016 eV randomizing the core positionover an area of 150 m radius and the angle of incidence oftheir axis (0◦ < φ < 360◦ and0◦ < θ < 30◦) were simu-lated [8]. The particles at the ground level were propagatedtowards the MD [6] and the energy deposition method wasapplied. In Fig. 5 an histogram of measured IT8s is shownon top of the one achieved by the application of the sametriggering conditions to the simulated events.
Since most events are clustered, it is expected that the cen-tral scintillator strips on each side of the MD participate inmore events than the strips of the sides. This considerationexplains the double bump structure of the histogram. Eachband corresponds to a side of the MD with its 32 scintilla-tors involved. It is worth noting that, although a fine tuningis still needed, the general structure of the double bumphistogram is being reproduced by the simulation.
s)µt (
0 1 2 3 4 5 6 7 8 9°
Scint N0 102030405060-310
-210
-110
1
s)µt (
0 1 2 3 4 5 6 7 8 9°
Scint N0 102030405060-310
-210
-110
1
Figure 5: (Top) Normalised histogram of IT8 events fromthe Observatory site, the double bump structure is expectedfrom clustered data. (Bottom) Normalised histogram ofsimulated events, air showers from 1014.5 to 1016 eV prop-agated underground were used to build it.
Field measured time structure is matched by muon signalsfrom laboratory measurements. In Fig. 6 such a compar-ison is shown. The bin width of 12.5 ns corresponds tothe sampling rate of 80 MHz used for MD data acquisition.Both sets show similar features.
Pulse Train Width (ns)0 10 20 30 40 50 60 70 80
0
0.1
0.2
0.3
0.4
0.5
0.6
muons at labmuon counter at the field
Figure 6: Normalised histograms of time width for MDdata and muon signals measured at the laboratory. Bothdata sets show similar structures.
5 Summary
A full simulation of the AMIGA muon counter was pre-sented. Its three methods of injecting traces were de-scribed. They include the possibility of injecting real muonsignals from laboratory measurements, the generation ofpulses modeled with experimental parameters, and a thirdmethod which builds the muon signals from deposited en-ergy in the scintillator strips. Simulated pulses show goodagreement with measured muons. The cross talk effect ofthe PMT is incorporated to find the right counting strategyto avoid overcounting. The2G30ns technique shows thebest counting ratio among the inspected ones. The over-counting due to cross talk is negligible with this strategy re-gardless of the discrimination threshold. Real muon pulseswere injected and counting ratios of 99% at 110 cm fromthe PMT, 99% at 297 cm, and 88% at 482 cm were found.The latter constitutes a lower limit giving the fiber attenua-tion. Preliminary results of the first muon counter modulesinstalled at the Observatory were presented. The perfor-mance was shown to be in line with the design specifica-tions.
References
[1] A. Etchegoyen, for The Pierre Auger Collaboration,Proc. 30th ICRC, Merida, Mexico, 2007,5:1191-1194.
[2] F. Sanchez, for the Pierre Auger Collaboration, paper0742, these proceedings.
[3] M. Platino, for the Pierre Auger Collaboration, Proc.31st ICRC, Lodz, Poland, 2009. arXiv:0906.2354v2[astro-ph.IM].
[4] P. Buchholz, for the Pierre Auger Collaboration, Proc.31st ICRC, Lodz, Poland, 2009. arXiv:0906.2354v2[astro-ph.IM].
[5] A. D. Supanitskyet al., Astropart. Phys., 2008,29:461-470.
[6] S. Agostinelliet al., NIM A, 2003,506(3):250-303.[7] F. Sanchezet al., NIM A, 2010,620:182-191.[8] S. Sciutto, http://www.fisica.unlp.edu.ar/auger/aires/