INSTINCT Owner’s Manual TACTICAL · INSTINCT Owner’s Manual TACTICAL ... 8

The Alternative Vote A Briefing Paper
By Dr Alan Renwick, University of Reading
Acknowledgements
The author would like to thank all those who advised on the content and drafting of this
paper:
Dr Sarah Birch, University of Essex
Dr Adrian Blau, University of Manchester
Professor Shaun Bowler, University of California Riverside
Professor Philip Cowley, University of Nottingham
Professor John Curtice, University of Strathclyde
Professor Patrick Dunleavy, London School of Economics
Professor David Farrell, University College Dublin
Professor Justin Fisher, Brunel University
Antony Green, Australian Broadcasting Corporation
Professor Simon Hix, London School of Economics
Dr Sara Binzer Hobolt, University of Oxford
Professor Ron Johnston, University of Bristol
Professor Lawrence LeDuc, University of Toronto
Professor Iain McLean, University of Oxford
Professor Pippa Norris, Harvard University and the University of Sydney
Professor Benjamin Reilly, Australian National University
Professor Marian Sawer, Australian National University
Professor Paul Whiteley, University of Essex
For Media Enquiries, please contact the PSA Press Office on 0203 463 0805 or email
For General PSA Enquiries, please contact Helena Djurkovic on 020 7330 9289 or email
Website: www.psa.ac.uk
Copyright@ Political Studies Association. All rights reserved.
Registered charity no. 1071825
Company limited by guarantee in England and Wales no. 3628986

1
Contents
Executive Summary 2
Introduction 3
The basics of AV 4
AV and the voter 6
AV and the election result at constituency level 9
AV and the election result at national level 13
AV and the character of politics 18
The cost of AV 20
AV and the future of electoral system change 21
Further resources 22
Notes 23
2
Executive Summary We face a very important choice in the referendum on our electoral system on 5th May. But many of
the claims being made by both sides are either false or exaggerated. We need a debate that is
grounded in solid evidence. This paper provides that grounding.
The basics of AV
A move to the Alternative Vote (AV) would not be a radical change from the current system
of First Past the Post (FPTP). AV is not a proportional system.
Rather, AV is majoritarian: candidates win by securing a majority of the votes in their
constituency. Under FPTP, only a relative majority is required; under AV, the goal is that
winning candidates should secure an absolute majority.
AV allows voters to rank candidates in order of preference. If no one wins more than 50 per
cent of first preferences, second and sometimes lower preferences are taken into account.
AV’s known effects
AV would increase voter choice – between but not within political parties.
AV would reduce but not end tactical voting.
AV would uphold the principle of “one person, one vote”. Every voter would still be treated
equally; each vote would count only once in deciding who is elected in each constituency.
AV would give weight to second and lower preferences as well as first preferences. The
merits of this move can be debated.
AV is not a proportional system.
AV would not eliminate safe seats, though it will probably reduce their number.
AV would not cost much to implement.
AV’s likely effects
AV would probably not change turnout at elections. Nor is it likely to change significantly
the number of spoilt ballots.
AV is unlikely to change the structure of the party system fundamentally. But it is likely to
increase the Lib Dems’ seat share somewhat, at the expense of the other main parties.
AV would probably make coalition governments slightly more frequent (but changes in how
people vote mean coalitions are already becoming more likely under FPTP).
AV would probably sometimes exaggerate landslides.
Minor parties under AV would probably win more votes, but not more seats. AV would be
likely to increase the bargaining power of some minor parties, but not of extremists such as
the BNP. It did not help Australia’s One Nation party.
AV would be unlikely to increase the number of women or ethnic minority MPs.
AV would be unlikely significantly to change the standards of MPs’ behaviour or the
relationship between MPs and voters. It might make some MPs focus more on constituency
work – which might or might not be desirable.
AV would probably reduce the tribalism of political battle only at the margins.
A “yes” vote would probably make further electoral system change later on more likely.
3
Introduction
UK voters will have the right to choose the electoral system for Westminster elections in the
referendum on 5th May. This is a fundamental choice: the electoral system is a cornerstone of
democracy. So far, however, the debate is not going well. The campaigns on both sides are making
claims that are either false or exaggerated. Many voters are mystified: the latest data from the
British Election Study suggest that around a third of voters still do not know what they think of the
proposed Alternative Vote (AV) system.1
This briefing paper does not take sides in the referendum debate: there are good arguments both
for and against the adoption of AV. Our purpose, rather, is to lay out the basic evidence upon which
a well informed debate can be conducted.
This paper begins by setting out the basics of AV: how the system works and where it is already used
today. It then outlines the evidence on the various effects that the introduction of AV in the UK
might or might not have.
Criteria for judging AV
Electoral systems can be judged against many criteria. This paper takes as its cue the arguments
that have been proffered by each side in the debate in the UK so far: we need to know which of
these arguments make sense and which don’t. The paper organizes these arguments into the
following categories:
1. AV and the voter: does AV help voters to express themselves at the ballot box?
2. AV and the result of the election at constituency level: does AV guarantee majority support
for the MP elected and does it produce fair constituency results?
3. AV and the result of the election at national level: how would AV change the balance
between the parties and what impact would this have on the quality of government in the
UK?
4. AV and the character of politics: would AV change the nature of political discourse or the
behaviour of MPs?
5. the cost of AV: how much independent evidence is there on how much AV would actually
cost to operate?
6. AV and the future of the electoral system: would the adoption of AV make further changes
to the electoral system thereafter more or less likely?
The main sections of this paper discuss each of these categories in turn. They draw on evidence
from the UK and elsewhere – particularly from Australia, the country with by far the most
experience of AV. They assess without prejudice what claims about the effects of AV are justified,
what claims are clearly wrong, and what claims remain open to debate.
4
The basics of AV How AV works
AV is similar to the current First Past the Post (FPTP) system in that it is used in constituencies that
elect one member each. This means that AV is not a proportional system.
Under AV, voters can rank the candidates according to preference, placing a “1” by their favourite
candidate, a “2” by their next most favoured candidate, and so on. In the version of AV proposed for
the UK, voters can express as many or as few preferences as they wish. In most Australian elections,
by contrast, a vote is valid only if all candidates are ranked.
In the first stage of the vote count, only first preferences are counted. If a candidate has more than
50 per cent of first preferences, that candidate is elected and the counting process is over.
If no candidate wins more than 50 per cent of first preferences, the candidate with fewest first
preferences is knocked out of the race. The ballot papers in their pile are looked at again and added
to the piles for the remaining candidates according to the second preferences that these voters have
indicated. If a candidate has now passed 50 per cent of all votes, that candidate is elected.
This process continues until a candidate passes the 50 per cent mark. Because voters are not
required to rank all the candidates, however, some votes are likely to be “exhausted” (meaning that
all the preferred candidates have been eliminated) before the end of the counting process. This
means that some candidates will be elected on fewer than 50 per cent of all the votes cast.
Where AV is used
AV is used for national parliamentary elections in three countries: Australia, Fiji, and Papua New
Guinea. It is also used for presidential elections and for parliamentary by-elections in Ireland.
Within the UK, it is currently used for local government by-elections in Scotland and Northern
Ireland. Some local elections in the United States also use AV, where it is known as “instant runoff”.
AV is used in the UK in a variety of non-public elections, including Labour and Liberal Democrat
leadership elections, elections of student union officers, and elections in the Church of England. AV
is used to elect the chairs of House of Commons select committees.
AV’s cousins
AV has a number of close cousins. Mayors in London and elsewhere are elected using the
Supplementary Vote system: voters can give their first and second preferences, and all but the top
two candidates are eliminated after the first count.
The Conservative Party leader is elected using a multi-round system: if no candidate wins an
absolute majority in the first round, the bottom candidate is eliminated and a second round of
voting occurs; this is repeated until there is a clear winner. A very similar system is used to elect the
House of Commons Speaker.
France and some other countries use a truncated multi-round system: there are two rounds; only
the better performing candidates in the first round can run again in the second.

5
Box 1. The use of AV for by-elections in Scottish local government
Since 2007, elections to Scottish local authorities have used the Single Transferable Vote (STV)
electoral system. STV is similar to AV in that it allows voters to rank candidates in order of
preference. Unlike AV, it is proportional, electing multiple councillors in each ward according to the
votes cast.
For by-elections where only one councillor is to be elected, however, STV becomes identical to AV.
AV has thus been used in the 31 by-elections held in Scottish local authorities since 2007. By way of
example, we can look at the by-election in the Ballochmyle ward of East Ayrshire held on 11
December 2008. The following table shows how the count proceeded.
First count Second count: Exclusion of Fraser
Third count: Exclusion of Masterton
Candidate Party First preferences
Transfers Total votes
Transfers Total votes
FRASER, Ian Lib Dem 93 -93 0 MASTERTON, Danny Solidarity 243 5 248 -248 0 McALPINE, Janette Conservative 273 17 290 18 308 SAVAGE, Roseanne SNP 1129 31 1160 101 1261 SHAW, David Labour 1598 19 1617 58 1675 Non-transferable 21 21 71 92 Total 3336 3336 3336
To secure election, a candidate had to secure 1669 votes (one more than 50 per cent). No candidate
reached this threshold on first preferences, so the candidate placed last – Ian Fraser – was excluded.
Of the 93 ballot papers in his pile, 21 had no further preference marked and therefore played no
further part in the count. The remaining ballot papers were added to the piles of the remaining
candidates according to the second preferences marked.
The leading candidate, David Shaw, was still slightly short of an absolute majority, so the next
bottom candidate – Danny Masterton – was excluded and the votes in his pile transferred to the
remaining candidates according to the next preference marked.
This transfer pushed David Shaw above 1669 votes, so he was declared the new councillor for
Ballochmyle. He had secured at least some backing from a clear majority of the voters in the ward.
East Ayrshire council is unusual in that it publishes information on all the preferences expressed, not
just those counted. We know, for example, that 43 per cent of voters expressed only their first
preference, while 57 per cent expressed a second. And we know that 340 voters gave Ian Fraser
their second preference, even though these preferences were never counted.2
The Ballochmyle election was decided at the third round of counting. Of the 31 by-elections so far,
eight have been decided at the first count, meaning that one candidate secured more than half of all
the first preferences. None have been decided at the second count, but there have been three
decisions at the third count, five at the fourth count, and so on. One by-election needed nine counts
before the winner was established.3
6
AV and the Voter AV increases the voter’s ability to express her or his preferences
Under FPTP, voters can express just one preference. Under the version of AV proposed for elections
to Westminster, voters can still express just one preference if they wish, but they can also choose to
express multiple preferences – as many as there are candidates. As under FPTP, however, they
cannot choose between multiple candidates from the same party, as some other systems allow.
The question to be asked is whether voters are interested in exercising this ability. We know that
voters in the UK (as elsewhere) are now less likely to be attached to a single party than they used to
be.4 This might suggest that the structure of voters’ preferences favours an ability to express more
nuance than is possible under the current system.
Evidence from the British Election Study supports this. The BES conducted a mock AV election in
May 2010. It found that, of those respondents willing to express a first preference, well over 90 per
cent were happy to express a second preference, over 80 per cent a third, and over 70 per cent a
fourth.5
Actual by-elections held using AV in Scotland yield lower numbers. Two councils provide the data
required to calculate the number of voters who fill in each preference. In the six by-elections held so
far in these areas, between 49 and 63 per cent of voters have expressed a second preference and
between 33 and 49 per cent a third.6 This suggests that a sizeable but not overwhelming proportion
of voters are interested in the extra opportunities that AV provides.
AV and voters’ satisfaction with democracy
We can also get at the question of whether voters value the extra opportunities that AV provides
them by asking whether voters are more satisfied with their democracy under AV than other
systems. The fact that only one country has any substantial history of using AV means there is
insufficient direct evidence on this to draw firm conclusions. But a broader study by David Farrell
and Ian McAllister finds that voters are more satisfied with democracy in countries where the
electoral system allows them to express more choice among candidates (such as AV) rather than less
(such as FPTP). The effect is, however, small.7
AV reduces but does not eliminate incentives for tactical voting
It is often thought undesirable that the electoral system should force voters to vote tactically rather
than expressing their true preferences. Estimates using data from the British Election Study suggest
that around 14 per cent of voters voted tactically in the general election of 2001,8 11 per cent in
2005,9 and 16 per cent in 2010.10
AV removes the reasons for tactical voting that exist under FPTP. Under FPTP, a minor party
supporter may choose to back a major party candidate in order not to waste his or her vote. Under
AV, that voter can give their first preference to their favourite candidate and then transfer it to the
major candidate with their second preference.
7
But AV also creates the potential for new types of tactical voting. If, for example, you are confident
that your favourite candidate, A, will be one of the top two candidates and you think that she would
defeat candidate B in a runoff but not candidate C, you might vote tactically for B in order to keep C
out. Alternatively, you might be confident that a candidate you don’t like, D, will reach the runoff
stage and expect that D would defeat E, your favourite candidate, in that runoff but would be
defeated by F, your second favourite. You might then vote for F rather than E in order to increase
F’s chances of reaching the runoff.11
So tactical voting can exist under AV. But the information about the local race that voters need in
order to exercise a tactical vote is considerable.12 In fact, there is evidence that fewer than half as
many voters vote tactically in Australia (under AV) as in the UK (under FPTP).13
AV has no clear effects on turnout
There are some reasons for thinking AV should increase turnout. It allows voters to express
themselves more fully and reduces pressure for tactical votes that some voters may be
uncomfortable with. Voters who dislike the idea of minority winners may find the whole electoral
process more legitimate under AV. And if AV reduces the number of safe seats, voters may consider
it more worthwhile to cast a vote than under FPTP.
There are other reasons for thinking AV should reduce turnout. It is slightly more complex for the
voter that FPTP. For those voters attracted to the notion that only first preferences should count,
AV may delegitimize the electoral process.
Evidence on turnout from contemporary Australia is not relevant, as Australia has compulsory
voting. But we can look at earlier evidence from before compulsory voting was introduced. At the
federal level, two elections were held between the adoption of AV in 1918 and the adoption of
compulsory voting in 1924. Both of these elections saw turnout fall, though from a peak in 1917
that was unusual. Australia’s states introduced a variety of preferential voting systems at different
times between 1909 and 1929. Turnout subsequently rose in some states and fell in others. Overall,
these preferential systems (including AV) had no clear effect on turnout.14
Further evidence comes from several Canadian provinces that used AV between the 1920s and the
1950s. Again, studies find no evidence that either the introduction of AV or its abolition had any
effect on turnout.15
AV has no clear effect on the number of spoilt ballots
Spoilt ballots are a concern if they arise because voters are confused about how to express their
preferences.
Australia sees many more spoilt ballot papers than does the UK: 5.6 per cent of the total in the 2010
election, compared to 1.0 per cent here.16 But there are several reasons for this. First, compulsory
voting in Australia leads some voters to spoil their ballot paper in order to express general
disapproval. Second, Australian voters are generally required to number all the candidates before
their vote is valid. Where this is not the case – in state-level elections in New South Wales and
Queensland – the proportion of invalid votes is lower.17 Third, large numbers of non-English-
speaking migrants also make a difference.18 Thus, the Australian evidence does not tell us whether

8
the introduction of AV without compulsory ranking of all candidates in the UK would affect the
number of spoilt ballots.
Evidence from the Canadian provinces that formerly used AV suggests that AV in the form proposed
for the UK might increase the number of spoilt ballots. So long as ballots where an “X” was placed
against one candidate were counted as valid, however, the difference was very small – certainly
insufficient to draw any general conclusions.19
Will voters understand how to use their preferences?
Even if they cast a valid ballot, voters might fail to express themselves effectively if they do not
understand how AV works. For example, some voters might think that expressing a second
preference will harm their favourite candidate’s chances of election. This is wrong: lower
preferences are not even counted so long as the first-preference candidate remains in the race. But
if voters think this they might deny themselves the opportunity to affect the overall result.
In Australia, many voters in fact do not work out their own preference distribution. Rather, they
follow a “how to vote card” issued by their favoured party. In recent elections, slightly over half of
voters have reported using such cards. On the other hand, almost half of all voters did claim to think
through their own preference ordering.20
Evidence from the use of the Supplementary Vote system for electing the mayors of London and a
range of other cities suggests that some voters indeed do not understand this system and, in effect,
“waste” their second vote on a candidate who cannot win: around 20 per cent of the voters in the
London mayoral elections of both 2000 and 2004 cast such wasted votes. 21 Of course, some may
have done so deliberately in order honestly to express what they feel. But others presumably did
not understand the system’s logic.
It should also be pointed out, however, that, even after decades of experience, many voters do not
understand FPTP. Focus group research conducted by David Farrell and Michael Gallagher in 1998
found that many participants could not explain how FPTP worked. For example, “many seemed
unaware that MPs could be elected with only a minority of the vote”.22
In any case, there will be a need for intensive public education about the nature of AV if the
referendum is passed.

9
AV and the election result at constituency level AV and majority winners
FPTP’s opponents complain that it allows many MPs to be elected on a minority of the votes: in
2010, only 210 out of the 650 MPs secured 50 per cent of the vote or more in their constituency. As
Figure 1 shows, the number of minority winners has risen enormously since 1955, when 94 per cent
of all MPs secured an absolute majority.23 The change has occurred because votes are much more
spread out across parties today than they were in the early post-war decades.24 AV supporters claim
that more citizens would feel a connection to their MP if more had voted for them. They also
suggest that this would improve legitimacy.
Figure 1. The 1955 and 2010 elections compared
AV would indeed increase the number of MPs elected on a majority vote. But three provisos are
needed. First, some minority winners would remain. Because the proposed version of AV does not
require voters to rank all candidates, some will express preferences only for candidates who are
eliminated in the early stages of the count. It will therefore sometimes be the case that neither of
the last two candidates in the race secures an absolute majority. In state-level elections in New
South Wales and Queensland – where voters are allowed to rank as many candidates as they wish –
the proportion of constituencies with minority winners has ranged from just 1 per cent to 31 per
cent in elections since the early 1980s.25 In the 31 Scottish local authority by-elections held using AV
since 1997, twelve – just under 40 per cent – have produced minority winners.26
Second, some of the votes in the majority block might be quite low preferences. Whether such
votes are seen as enhancing an MP’s legitimacy will depend on how widely it is accepted that they
should matter. This issue is discussed further below.
Third, there is little evidence that minority winners are widely seen as illegitimate. Few voters know
the details of their constituency election result: fewer than half can even correctly name their MP.27
As noted above, focus groups suggest that many voters do not even realize that minority victories
are possible.28 This suggests that whether their MP secured an absolute majority or not is unlikely to
make much difference to many voters.
96.1
65.1
5.9
67.7
0
10
20
30
40
50
60
70
80
90
100
1955 2010
Combined Conservative and Labour share of the vote (%)
% of MPs elected on a minority of the vote

10
The claim that AV gives some voters extra votes is a fallacy
Many supporters of FPTP have argued that AV gives some voters extra votes. This is wrong. Under
AV, each voter’s vote has exactly the same value.
In the first round of counting, everyone’s first preference is counted as one vote. In the second
round, if your favourite candidate is still in the race, your first preference still counts for one vote. If
your favourite candidate was eliminated, your first preference now counts for zero but your second
preference counts for one vote. From each ballot paper, only one vote is being counted. This
remains true at each stage of the counting process. Box 2 on the following page gives an example of
how this works in practice.
The weighting of higher and lower preferences
A second concern (often muddled with the first, but actually quite different) is that AV gives higher
and lower preferences equal weight: it treats a sixth preference as one vote just as it does a first
preference.
This is true in a sense: when a sixth preference is counted, it is given the same weight as a first
preference. In the example on the following page, the second preferences of voters who originally
favoured Taylor are given the same weight as the first preferences of the supporters of Jones and
McDonald. In another sense, however, it is not true: AV gives extra weight to higher preferences by
counting them first. A candidate may be the second choice of most voters, but if he does not
capture a decent share of first preferences, he will be eliminated from the race before this broad
support can be tapped.
So how should preferences be weighted? One view is that our first preference captures something
special – our core belief – and should therefore carry special weight. Another view is that we cannot
make such presumptions about the structure of people’s preferences. Some voters might want
someone from the right instead of someone from the left, but not be so concerned about which
right-wing candidate they get. Some voters find it very difficult to decide their first preference but
are very clear about some of the candidates they don’t want.
There is therefore no clear basis for discounting lower preferences completely. But there is
legitimate debate over whether AV (or any electoral system) gets the balance right.
AV, in an important sense, is more likely than FPTP to elect the candidate with broadest support
Under FPTP, how well a candidate does depends partly on how popular he or she is and partly on
how many other similar candidates are running in the constituency. In a constituency with one left-
wing candidate and three right-wing candidates, the left-wing candidate could win even if right-wing
voters are in the majority because the right-wing vote splits.
AV is designed to prevent such outcomes. It allows the right-wing voters to coalesce around the
most popular right-wing candidate and secure the seat. Thus, in such scenarios, provided we are
happy to treat lower preferences as meaningful, AV is more likely than FPTP to elect the candidate
with broadest support.

11
Box 2. How votes count under AV
Imagine an election with four candidates. 1000 valid votes are cast, so a candidate needs 501 votes
to win. The first preferences for each candidate are as follows:
No one has passed the 50 per cent mark, so the bottom candidate (Taylor) is eliminated. The first-
preference votes for Jones, McDonald, and Smith all still count as one vote each. The votes cast for
Taylor also still count as one vote each, but now they count for the candidate that these voters
ranked second, not for Taylor.
Still no one has gained an absolute majority. Now Smith is eliminated. Again, everyone’s vote
counts as one vote, for whichever of the remaining two candidates is ranked higher by the voter.
Jones is preferred by more voters than McDonald and is therefore elected by 540 votes to 460.
400360
15090
0
100
200
300
400
500
Jones McDonald Smith Taylor
First preferences
400360
150
0
4030
20
0
100
200
300
400
500
Jones McDonald Smith Taylor
Transfers from Taylor
First preferences
400360
0
4030
10070
0
100
200
300
400
500
600
Jones McDonald Smith Taylor
Transfers from Smith
Transfers from Taylor
First preferences
12
The number of occasions on which AV produces a different result at constituency level from FPTP is,
however, likely to be low. The British Election Study team estimate that AV would have produced a
different result in the 2010 election in 43 seats – fewer than 7 per cent of the total.29 Similarly, in
Australia, the number of seats in which the ultimate winner has not led on first preferences has been
between 5 and 7 per cent in each of the last three elections.30
Non-monotonicity is devilish but not very important
An electoral system is non-monotonic if a candidate’s chances of election can be harmed by their
winning more votes. FPTP does not have this feature, but AV can. Say that candidate A could win a
runoff against B but not against C. A transfer of votes from B to A could eliminate B from the race,
allowing C to win.
Non-monotonic outcomes are undesirable, but research employing mathematical models suggests
they should occur very rarely. One estimate is that such an outcome would occur in a UK
constituency less than once a century.31 They are not therefore a major concern.

13
AV and the election result at national level Simulations of election results under AV
Surveys that ask respondents to indicate second and sometimes lower preferences can be used to
simulate what the result of an election would have been had AV been used. Such simulations have
limitations, as discussed below. But they do give a useful rough guide.
The table below compares actual election results since 1983 with the simulated results under AV
produced by Prof. John Curtice (1983–2005) and the British Election Study (2010).32
Table 1. Simulated AV election results compared to actual results, 1983–2010
1983 1987 1992 Actual
seats won
Seats under
AV
Change Actual seats won
Seats under
AV
Change Actual seats won
Seats under
AV
Change
Con 397 391 -6 375 381 +6 336 328 -8 Lab 209 190 -19 229 202 -27 271 268 -3 Lib Dem 23 48 +25 22 44 +22 20 31 +11 Others 21 21 0 24 24 0 24 24 0 Majority 144 132 -12 100 112 +12 21 5 -16
1997 2001 2005 Actual
seats won
Seats under
AV
Change Actual seats won
Seats under
AV
Change Actual seats won
Seats under
AV
Change
Con 165 70 -95 166 140 -26 198 171 -27 Lab 418 445 +27 412 423 +11 355 377 +22 Lib Dem 46 115 +69 52 68 +16 62 68 +6 Others 30 30 0 29 29 0 31 31 0 Majority 177 231 +54 165 187 +22 64 108 +44
2010 Actual
seats won
Seats under
AV
Change
Con 306 284 -22 Lab 258 248 -10 Lib Dem 57 89 +32 Others 29 29 0 Majority - - -
These simulations imply the following:
AV always boosts the Liberal Democrats: as a centrist party, they pick up many second
preferences. It sometimes also boosts a landslide winner (a party winning many first
preferences is likely to gain lower preferences too).
14
Overall, however, AV does not increase proportionality compared to FPTP. It does not
generally help small parties win seats. It can exaggerate the over-representation of the
largest party. Like FPTP, it can produce biased election results, where two parties with the
same vote shares secure very different numbers of seats.33
It is thus possible, under AV as under FPTP, for one party to win most votes while another
wins most seats. This happened under FPTP in the UK in 1951 and February 1974. It has
happened under AV in the Australian federal elections of 1954, 1961, and 1969, as well as in
a number of state elections.34
Contrary to some claims, AV would not lead to permanent hung parliaments and coalition
governments. Of the last seven elections, only the most recent would have delivered a hung
parliament – just as under FPTP. By boosting the Liberal Democrats, however, AV does
increase the likelihood of hung parliaments a little. Some simulations suggest a hung
parliament in the close election of 1992.35
AV tends to exaggerate landslides. This is because of the boost it can give to a party with a
large national lead. The clearest case of this is the large projected increase in Labour’s
majority in 1997. But AV would not, according to these simulations, have boosted the
Conservatives’ majority in 1983.
Would AV induce more fundamental change in the party system?
Simulations such as those above need to assume that the party system will remain basically the
same. But it is possible that, under AV, voters would think about the parties differently and that the
overall menu of parties would change. There is a logic, long recognized among political scientists,
according to which an electoral system such as AV should be expected to produce two-bloc politics,
or “bipolar multipartism”: a system with many parties in which those parties line up into two fairly
stable blocs.36 Multiple parties on the right or on the left would be able to compete among
themselves without letting their opponents in on a minority vote, so they would face little pressure
to coalesce.
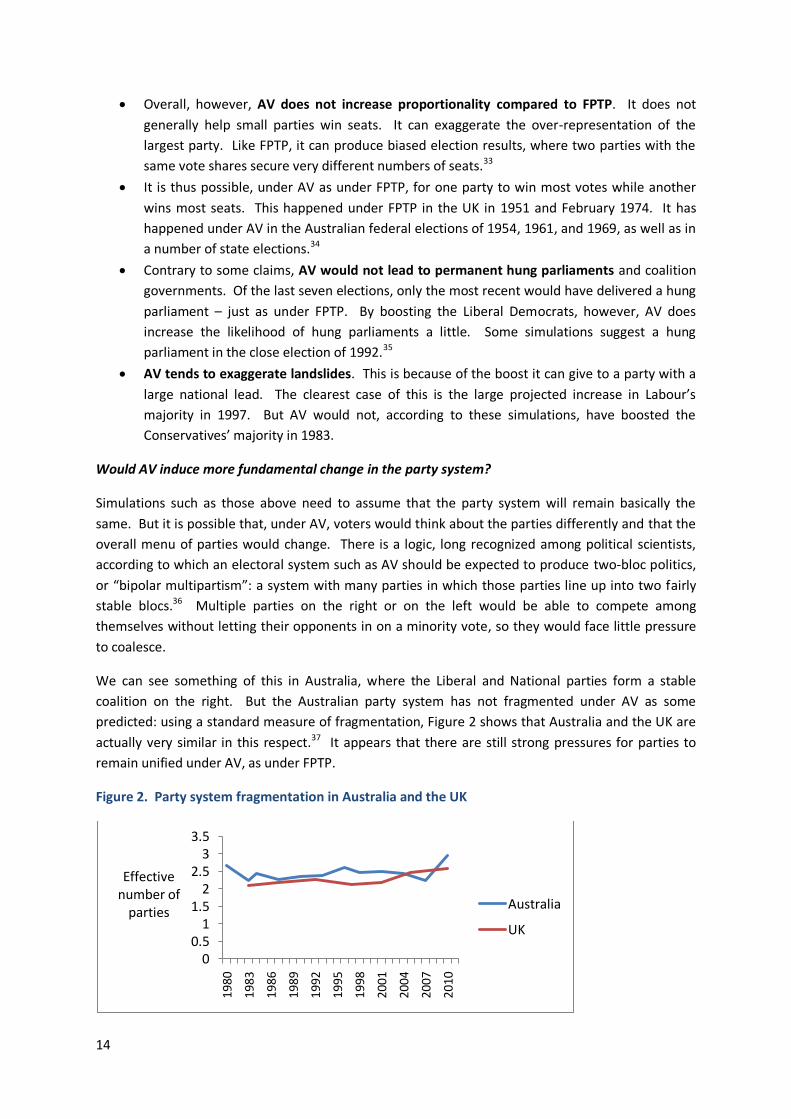
We can see something of this in Australia, where the Liberal and National parties form a stable
coalition on the right. But the Australian party system has not fragmented under AV as some
predicted: using a standard measure of fragmentation, Figure 2 shows that Australia and the UK are
actually very similar in this respect.37 It appears that there are still strong pressures for parties to
remain unified under AV, as under FPTP.
Figure 2. Party system fragmentation in Australia and the UK
00.5
11.5
22.5
33.5
1980
1983
1986
1989
1992
1995
1998
2001
2004
2007
2010
Effective number of
partiesAustralia
UK

15
Still, there is a question over the future of the Liberal Democrats in the UK. The simulations assume
they will stick together and benefit from AV. But AV would put pressure on the Liberal Democrats as
a party to state to whom they would like their supporters to give their second preferences:
Australian experience suggests that parties generally gain from issuing such guidance.38 In current
circumstances, that might increase the likelihood of a split in the party between left and right. On
the other hand, the Australian Democrats achieved success for some years without issuing guidance,
hoping thereby to attract support from both left as well as right.39 The Liberal Democrats in the UK
might be able to maintain the same strategy.
AV’s effects on small and fringe parties
AV has three effects on the significance of fringe parties. First, it makes it easier for them to win
votes: a vote cast for a small party need no longer be “wasted”, as the voter can support one of the
main parties with their second preference.
Second, AV makes it harder for fringe parties to win seats: parties adopting positions far from the
centre ground are unlikely to pick up many second preferences. The fate of Australia’s Pauline
Hanson is instructive here: she would have won a seat in the 1998 election under FPTP, but AV
thwarted her, as she picked up very few lower preferences from mainstream voters.
Third, AV gives small parties bargaining power over large parties. In many seats, the leading
candidates will need the second preferences of small-party supporters if they are to secure victory.
The small parties are likely to seek policy concessions before agreeing to ask their supporters to
transfer their votes to a particular party or candidate. In Australia, this mechanism has given such
parties as the Democratic Labor Party, the Australian Democrats, and the Green Party significant
influence, even when they have failed to win any seats.40
On the other hand, Australia’s experience also suggests that such bargaining is of little benefit to
extreme parties, because the mainstream parties refuse to deal with them. This helps explain the
failure of Pauline Hanson’s One Nation party in 1998, as the example in Box 3 on the following page
shows.41 When some politicians gave in to the temptation in the Queensland state election of 2001,
they appear to have been punished by voters for doing so.42
Overall, Professor Ben Reilly concludes that AV in Australia “has pushed the political system away
from extremes and towards the ‘moderate middle’”.43
The effects of hung parliaments and coalition or minority governments
We have seen that AV would tend slightly to increase the likelihood of hung parliaments. This is not
a radical change: fragmentation of the vote means that hung parliaments have become increasingly
likely under FPTP too in recent years.44 Nevertheless, it is important to consider what the effects of
more hung parliaments would be.
In fact, hung parliaments can be praised or criticized on many grounds: there is no consensus. There
is strong evidence for the following points:
coalition or minority governments are less stable than single-party majority governments;45
16
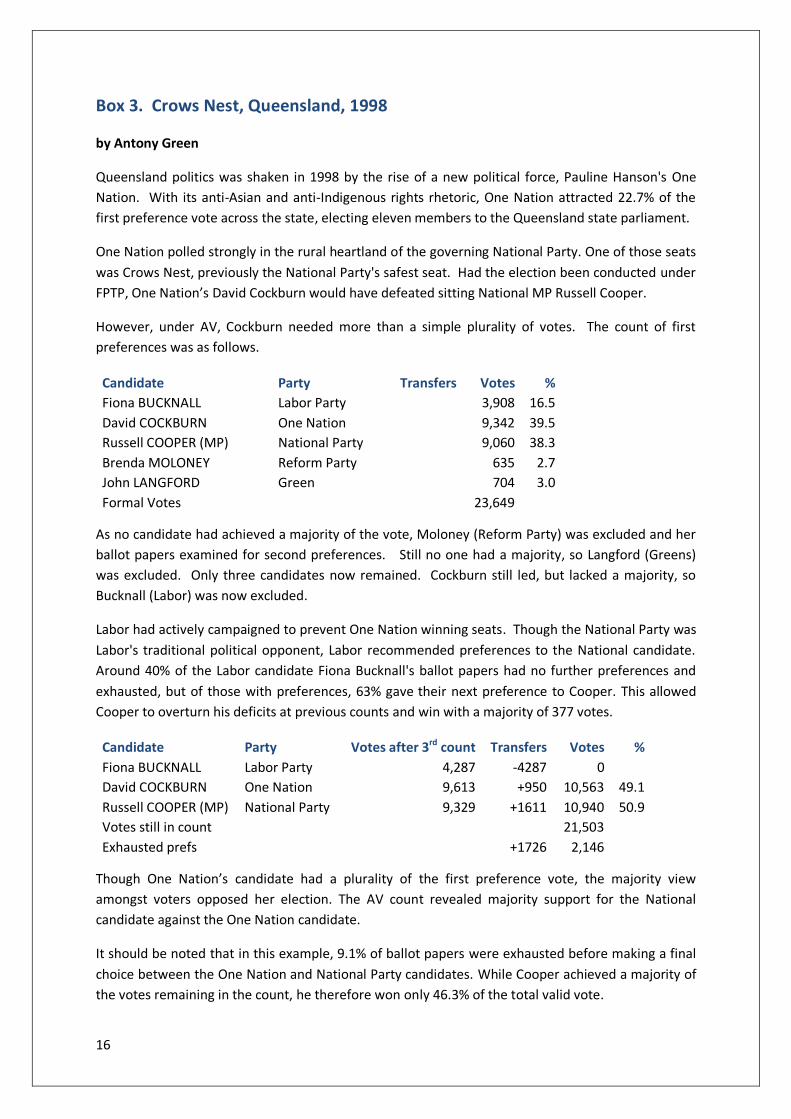
Box 3. Crows Nest, Queensland, 1998
by Antony Green
Queensland politics was shaken in 1998 by the rise of a new political force, Pauline Hanson's One
Nation. With its anti-Asian and anti-Indigenous rights rhetoric, One Nation attracted 22.7% of the
first preference vote across the state, electing eleven members to the Queensland state parliament.
One Nation polled strongly in the rural heartland of the governing National Party. One of those seats
was Crows Nest, previously the National Party's safest seat. Had the election been conducted under
FPTP, One Nation’s David Cockburn would have defeated sitting National MP Russell Cooper.
However, under AV, Cockburn needed more than a simple plurality of votes. The count of first
preferences was as follows.
Candidate Party Transfers Votes %
Fiona BUCKNALL Labor Party
3,908 16.5
David COCKBURN One Nation
9,342 39.5
Russell COOPER (MP) National Party
9,060 38.3
Brenda MOLONEY Reform Party
635 2.7
John LANGFORD Green
704 3.0
Formal Votes
23,649
As no candidate had achieved a majority of the vote, Moloney (Reform Party) was excluded and her
ballot papers examined for second preferences. Still no one had a majority, so Langford (Greens)
was excluded. Only three candidates now remained. Cockburn still led, but lacked a majority, so
Bucknall (Labor) was now excluded.
Labor had actively campaigned to prevent One Nation winning seats. Though the National Party was
Labor's traditional political opponent, Labor recommended preferences to the National candidate.
Around 40% of the Labor candidate Fiona Bucknall's ballot papers had no further preferences and
exhausted, but of those with preferences, 63% gave their next preference to Cooper. This allowed
Cooper to overturn his deficits at previous counts and win with a majority of 377 votes.
Candidate Party Votes after 3rd count Transfers Votes %
Fiona BUCKNALL Labor Party 4,287 -4287 0 David COCKBURN One Nation 9,613 +950 10,563 49.1
Russell COOPER (MP) National Party 9,329 +1611 10,940 50.9
Votes still in count
21,503
Exhausted prefs
+1726 2,146
Though One Nation’s candidate had a plurality of the first preference vote, the majority view
amongst voters opposed her election. The AV count revealed majority support for the National
candidate against the One Nation candidate.
It should be noted that in this example, 9.1% of ballot papers were exhausted before making a final
choice between the One Nation and National Party candidates. While Cooper achieved a majority of
the votes remaining in the count, he therefore won only 46.3% of the total valid vote.
17
government spending tends to be higher with coalition than with single-party governments;
budget deficits tend also to be higher with coalitions;46
there are rich countries that routinely have coalition governments as well as rich countries
that generally have single-party-majority governments: doom-mongering is not justified;47
coalition governments encourage more consensual decision-making;48
the connection between the votes cast and the composition of government is generally
clearer when one party has a majority;49
hung parliaments rarely give excessive power to small parties: the oft-cited example of the
German FDP is unusual.50
The effects of exaggerated landslides
While there are good reasons for thinking comfortable single-party majorities desirable, it is
generally thought that large landslides can weaken the opposition and allow the government to
ignore broader opinion. We are not, however, aware of any studies that have tried to assess this
belief against solid evidence.
The effects of bipolar multipartism
If a two-bloc system of bipolar multipartism emerged in the UK, it might involve a left-wing bloc
consisting mainly of Labour and some Liberal Democrats and a right-wing bloc comprising the
Conservatives, the remaining Liberal Democrats, and perhaps UKIP. Such a system would generally
lead to coalition governments. But the coalition options and their agreed programmes would be
clear before each election and such coalitions would be almost as stable as single-party
governments. The clearest example of such a coalition – the Liberal–National coalition in Australia –
has broken down only rarely and briefly since the 1920s.
Special note should be made of the possible effects of AV in Northern Ireland. Under FPTP, both
unionists and nationalists face the danger that, by competing among themselves, they may lose
seats to the other side, even in areas where they are in the majority. AV would largely remove that
danger.
AV and the representation of women and minorities
FPTP leads to underrepresentation of women and of minorities that are not geographically
concentrated. It is still the case today that only 22 per cent of Westminster MPs are women while 4
per cent are from minorities.51 The crucial factor determining representation for women and
dispersed minorities is the number of MPs elected in each constituency. Where only one MP is
elected, selection committees and voters will seek out the candidate they think strongest. So long as
there remain even subconscious biases about who makes the best MP, white men will be
overrepresented. Where several people are elected per constituency, by contrast, parties and
voters are likely to seek more balance.52
AV retains the single-member constituencies of FPTP. It should not therefore be expected to
alleviate underrepresentation of women and minorities. We can see this from the Australian House
of Representatives, where the proportion of members who are women is 25 per cent – little
different from the figure in the UK.53
18
AV and the character of politics AV would not eliminate safe seats but would somewhat reduce their number
A safe seat is one that a party is very unlikely to lose over successive elections. The claim made by
some AV supporters that AV would eliminate safe seats is wrong. Seats where one party regularly
scores over 50 per cent of the vote will probably remain safe, given current patterns of party
support. Even some seats where the winning candidate does not always secure more than half the
votes under FPTP will be safe because there is a clear majority for the left or the right.
AV would make some seats that are currently fairly safe less safe. In recent elections, this would
have been most likely in Conservative-held seats where both Labour and the Liberal Democrats won
substantial votes.
But AV would also make some seats safer. This is clearest for many Lib Dem seats: the Lib Dems’
hold would likely be strengthened by lower preferences. In recent elections it would also have
applied to some Labour-held seats where the Conservatives came second and the Liberal Democrats
were a strong third.54
AV’s tendency to exaggerate landslides means that, overall, it would somewhat reduce the number
of safe seats: for example, Labour would have picked up even more Conservative seats in 1997. But
the change should not be exaggerated: the structure of competition in most constituencies is
unlikely to change radically.
Are MPs in safe seats more likely to misbehave?
Evidence from international comparisons suggests that one form of corruption – exploiting public
office for private gain – becomes more common when MPs feel safer in their seats. But another
form of corruption – buying votes – is more likely where MPs have to fight hard to keep their jobs.55
This implies that action designed to tackle the first form of corruption (into which the worst excesses
of the expenses scandal fell) might just encourage the second form.
Furthermore, there is very little evidence that MPs were more likely to be implicated in the 2009
scandal over expenses if they occupied safer seats. Early analysis conducted by a Lib Dem blogger
did find a correlation and received much media attention.56 But later analyses based on the sums
that MPs were actually required to repay by Sir Thomas Legg have found no clear correlation with
the safety of the MPs’ seats.57 Figure 3 shows the average repayment required for MPs with
majorities in the 2005 election of different sizes. While MPs with the safest seats did have higher
repayments than those with the most marginal seats, there is no clear pattern across the categories.
Would MPs have to “work harder for us” under AV?
The pro-AV campaign claims that it would make MPs “work harder for us” because it would require
them to seek support from at least 50 per cent of voters in their constituency. Evidence from the UK
and elsewhere suggests that MPs in marginal seats do focus on servicing their constituency more
than those in safe seats.58 Insofar as AV reduces the number of safe seats, it could therefore be
expected to increase MPs’ constituency focus.

19
Figure 3. Average expenses repayment per MP, by size of majority
It can be asked, however, whether this is a good thing. Westminster MPs already devote a great
deal of their time to constituency activities.59 This reduces the time they can spend scrutinizing
government at the national level. A recurring theme in current reform debates in Ireland is that
politicians there have been too focused on local matters and failed to notice the policy mistakes that
led to the banking crisis. Whether we should want MPs to “work harder for us” at the constituency
level is therefore a matter for debate.
AV would reduce the tribalism of party political battle only at the margins
In debates about electoral systems around the world, AV has been backed by some political
scientists as the best system for overcoming ethnic or other tensions: they argue that AV can force
politicians to broaden their appeal to voters outside their own group.60 That is why it was
introduced in Fiji and Papua New Guinea.
In the UK, AV will increase some MPs’ incentive to appeal to supporters of some other parties. But
there is no reason to expect a sudden move towards civility in relations between the two main
parties. This expectation fits the pattern observed in Australia. On the one hand, as Ben Reilly
observes, “Allowing voters to indicate a range and gradation of preferences between parties and
candidates, rather than a single ‘one-shot’ choice, creates incentives for political actors to reach out
for secondary preference votes and thus to bargain, cooperate and compromise in search of
electoral victory.”61 On the other hand, each of the two main parties generally urges its supporters
to rank the candidate of the other main party last: there is no love lost between them.62
Thus, the main political battle remains just as intense and hostile as under FPTP: political discourse
in Australia is at least as combative as it is here. A recent exchange in the Australian parliament over
climate change policy between opposition leader Tony Abbott and prime minister Julia Gillard will
serve as an example. Gillard, said Abbott, “has almost no familiarity with the truth”. He likened her
to Richard Nixon, who was said to have lied whenever he opened his mouth. He called her
“delusional” and “in full Napoleon mode”. Gillard responded that Abbott was a “bitter, hollow man”
displaying “puffed-up arrogance” with whom Australians were increasingly “disgusted” and
“revolted”.63
£1,071.60
£1,786.95
£1,312.27 £1,259.53
£1,745.66
£0
£200
£400
£600
£800
£1,000
£1,200
£1,400
£1,600
£1,800
£2,000
Up to 5% 5.1 to 10% 10.1 to 15% 15.1 to 20% More than 20%

20
The cost of AV AV would not require the use of expensive voting machines
There is no truth in the claim that AV would require the introduction of electronic voting machines.
Elections held under AV (and, indeed, under the more demanding STV system) in Australia, Ireland,
and Scotland are all in general conducted using traditional paper ballots.
Electronic counting of votes was introduced in Scotland in 2007 for local elections, which use the
more complex STV electoral system. There is no reason to think electronic counting would be
necessary for elections held under AV.
The cost of AV
The No2AV campaign estimates the cost of AV as “up to £247 million”. This includes the cost of the
referendum itself, which, of course, is incurred whether there is a “yes” vote or not. Removing this
reduces the claimed figure to £156 million. The remainder comprises up to £130 million for the
purchase of electronic voting machines (which would not be necessary) and £26 million for voter
education.
It is reasonable to expect two principal costs from the introduction of AV. First, at least for a
transitional period, a campaign to educate voters in how to vote under AV would be highly desirable.
Second, counting votes under AV would take longer than under FPTP. We are not aware of any
independent estimates of what these costs would be.
However, even if we suppose (unrealistically) that the current cost of running an election (up to £90
million) would be doubled by the introduction of AV, that implies an annual cost across a five-year
electoral cycle of only around 30 pence per person. Clearly, this is a very small sum.
21
AV and the future of electoral system change Most campaigners for electoral reform think AV is, in Nick Clegg’s famous words, a “miserable little
compromise”. They support it because they believe it will ease the path towards further reform
later on. Many of those campaigning against change agree that AV would not represent a radical
change, but worry that it would be a step towards a proportional system in the future.
There is no definite research on how a “yes” or a “no” vote in this referendum would affect the
future politics of electoral reform. But the following points can inform debate on the subject.
Referendum dynamics
A “no” vote in a referendum is always followed by what Professor Lawrence LeDuc calls a “battle for
interpretation”. Those who support the status quo argue that the people have spoken and that the
issue should be left alone. Supporters of change, by contrast, argue that the referendum has not
decided the issue: they might say, for example, that voters were offered the wrong reform option or
that a better information campaign should have been launched.64
This will happen in the event of a “no” vote in the UK too. Supporters of FPTP will say that the
people have decided in favour of the status quo. Supporters of change will argue that AV was the
wrong reform and that a more substantial change should be offered.65
The question is, who will win this battle? Given that the issue of electoral reform has not caught the
public imagination and that few voters understand the intricacies of electoral systems, it is likely to
be difficult for reform supporters to convince many that another reform should now be considered.
Such was the experience of reform supporters after recent referendums in three Canadian
provinces: the battle of interpretation was decisively won by the supporters of the status quo.
Electoral reform dynamics
It is clear that changing the electoral system is easier where change has already recently happened:
the idea of reform is no longer so radical; more people are familiar with the reform options; there
are fewer interests vested in the status quo. Four established democracies – France, Italy, Japan,
and New Zealand – have introduced major reforms to their national electoral systems in the last
thirty years. Two of these – France and Italy have subsequently instituted further major reforms,
while Japan passed a further smaller reform, and New Zealand will hold a referendum creating the
possibility of another major reform later this year.66
The impact of AV
As we have seen, AV in the UK might well boost the Liberal Democrats’ seat share and therefore
their chances of holding the balance of power in the future. This would give them the bargaining
position from which to push for further reform. On the other hand, if AV leads to bipolar
multipartism, it could strengthen two-bloc politics and thereby reduce pressure for greater
proportionality.

22
Further resources Introductions to electoral systems:
FARRELL, David M., Electoral Systems: A Comparative Introduction, 2nd edition. Basingstoke:
Palgrave Macmillan, 2011.
HIX, Simon, Ron JOHNSTON, and Iain McLEAN, Choosing an Electoral System. British
Academy, 2010. Available at http://www.britac.ac.uk/policy/policy-centre-reports.cfm.
NORRIS, Pippa, Electoral Engineering: Voting Rules and Political Behavior. Cambridge:
Cambridge University Press, 2004.
RENWICK, Alan, A Citizen’s Guide to Electoral Reform. London: Biteback, 2011.
Valuable sources of discussion and evidence relating to the debates in the UK:
The LSE’s British Politics and Policy blog (http://blogs.lse.ac.uk/politicsandpolicy/) has many
relevant entries by a wide range of political scientists.
BLAU, Adrian, “Majoritarianism under Pressure: The Electoral and Party Systems”, in Robert
HAZELL (ed.), Constitutional Futures Revisited: Britain’s Constitution to 2020. Palgrave
Macmillan, 2008, pp. 233–48.
CURTICE, John, “So What Went Wrong with the Electoral System? The 2010 Election Result
and the Debate about Electoral Reform”, Parliamentary Affairs, 63, no. 4 (October 2010), pp.
623–38.
JOHNSTON, Ron, Charles PATTIE, Danny DORLING, and David ROSSITER, From Votes to Seats.
The Operation of the UK Electoral System since 1945. Manchester University Press, 2001.
SANDERS, David, Harold D. CLARKE, Marianne C. STEWART, and Paul WHITELEY, “Simulating
the Effects of the Alternative Vote in the 2010 UK General Election”, Parliamentary Affairs
64, no. 1 (January 2011), 5–23.
On the operation of AV in Australia:
Antony GREEN’s blog on the ABC website contains a wealth of useful information and
analysis: http://blogs.abc.net.au/antonygreen/.
A useful account of Australia’s experience of AV is given on the website of the ACE Electoral
Knowledge Network (http://aceproject.org/ace-en/topics/es/esy/esy_au).
For full information on recent Australian election results, see the website of the Australian
Electoral Commission: http://www.aec.gov.au.
FARRELL, David M., and Ian McALLISTER, The Australian Electoral System: Origins, Variations,
and Consequences. Sydney: University of New South Wales Press, 2006.
REILLY, Ben, “Preferential Voting and Its Political Consequences”. In Marian Sawer (ed.),
Elections: Full, Free and Fair. Leichhardt, NSW: Federation Press, 2001, 78–95.
SAWER, Marian, “Australia: Replacing Plurality Rule with Majority-Preferential Voting”. In
Josep M. Colomer (ed.), Handbook of Electoral System Choice. Basingstoke: Palgrave
Macmillan, 2004, pp. 475–86.
23
Notes
1 British Election Study, Continuous Monitoring Survey, February 2011, q551rev. See http://www.bes2009-
10.org/. 2 All information on the Ballochmyle election is taken from the East Ayrshire council website (www.east-ayrshire.gov.uk). 3 Figures supplied by Prof. John Curtice, University of Strathclyde. 4 Paul Webb, “Conclusion: Political Parties and Democratic Control in Advanced Industrial Societies”, in Paul
Webb, David Farrell, and Ian Holliday (eds.), Political Parties in Advanced Democracies (Oxford: Oxford University Press, 2002), pp. 438–60. 5 David Sanders, Harold D. Clarke, Marianne C. Stewart, and Paul Whiteley, “Simulating the Effects of the Alternative Vote in the 2010 UK General Election”, Parliamentary Affairs 64, no. 1 (January 2011), 5–23. 6 The two councils are East Ayrshire and Glasgow. The relevant information is available on their websites
(www.east-ayrshire.gov.uk and www.glasgow.gov.uk). 7 David M. Farrell and Ian McAllister, The Australian Electoral System: Origins, Variations, and Consequences
(Sydney: University of New South Wales Press, 2006), pp. 147–65. 8 Harold D. Clarke, David Sanders, Marianne C. Stewart, and Paul F. Whiteley, Political Choice in Britain (Oxford: Oxford University Press, 2004), p. 83. 9 Harold D. Clarke, David Sanders, Marianne C. Stewart, and Paul F. Whiteley, Performance Politics and the British Voter (Cambridge: Cambridge University Press, 2009), p.163. 10 Ron Johnston and Charles Pattie, “Tactical Voting in the 2010 British General Election: Rational Behaviour in Local Contexts?”, Environment and Planning A, forthcoming. 11 Gary W. Cox, Making Votes Count: Strategic Coordination in the World’s Electoral Systems (Cambridge: Cambridge University Press, 1997), 93–4; Michael Dummett, Voting Procedures (Oxford: Clarendon Press, 1984). 12 John J. Bartholdi and James B. Orlin, “Single Transferable Vote Resists Strategic Voting”, Social Choice and Welfare 8, no. 4 (1991), 341–54. 13
Thomas Gschwend, “Comparative Politics of Strategic Voting: A Hierarchy of Electoral Systems”, paper presented at the annual meeting of the Midwest Political Science Association, Chicago, 20–23 April 2006. 14 Colin Hughes, “Compulsory Voting”, Politics (Australian Journal of Political Science) 1, no. 2 (1966), 81–95, at pp. 87–8; unpublished research by Antony Green. 15 Harold J. Jansen, “The Political Consequences of the Alternative Vote: Lessons from Western Canada”, Canadian Journal of Political Science 37, no. 3 (September 2004), 647–69. 16 Australian Electoral Commission, “Informal Votes by State”, Official 2010 Federal Election Results, House of Representatives, available at www.aec.gov.au; Electoral Commission, “UK General Election 2010: Turnout and Administrative Data”, available at www.electoralcommission.org.uk. 17 Antony Green, “Informal Voting by Jurisdiction”, unpublished paper. 18 Ian McAllister and Toni Makkai, “Institutions, Society or Protest? Explaining Invalid Votes in Australian Elections”, Electoral Studies 12, no. 1 (1993), 23–40. 19 Jansen (note 15), pp. 657–60 20
Farrell and McAllister (note 7), pp. 135–6. 21 Henk van der Kolk, Colin Rallings, and Michael Thrasher, “The Effective Use of the Supplementary Vote in Mayoral Elections: London 2000 and 2004”, Representation 42, no. 2 (2006), 91–102, at p. 99. 22 David Farrell and Michael Gallagher, “British Voters and Their Criteria for Evaluating Electoral Systems”, British Journal of Politics and International Relations 1, no. 3 (October 1999), 293–316, at pp. 299–300. 23
R. M. Punnett, “The Alternative Vote Re-Visited”, Electoral Studies 10, no. 4 (1991), 281–98, at p. 284. 24
John Curtice, “So What Went Wrong with the Electoral System? The 2010 Election Result and the Debate about Electoral Reform”, Parliamentary Affairs 63, no. 4 (October 2010), 623–38; Patrick Dunleavy, written evidence submitted to the Political and Constitutional Reform Committee’s inquiry on the Parliamentary Voting System and Constituencies Bill, HC 437, Ev 126–34. 25
Analysis supplied by Antony Green, Australian Broadcasting Corporation. 26
Figures supplied by Professor John Curtice, University of Strathclyde. 27 Hansard Society, Audit of Political Engagement 7: The 2010 Report (London: Hansard Society, 2010), p.122. 28
Farrell and Gallagher (note 22), pp. 299–300.

24
29
Sanders et al. (note 5), p. 20. 30
Antony Green, “Preferential Voting in Australia”, Antony Green’s Election Blog, 12 May 2010, at abc.net.au. 31 Crispin Allard, “Lack of Monotonicity – Revisited”, Representation 33, no. 2 (1995), 48–50. 32
John Curtice, “Recent History of Second Preferences”, available on the BBC News website; Sanders et al. (note 5). 33
Bias in recent Australian elections in analysed in Ron Johnston and James Forrest, “Electoral Disproportionality and Bias under the Alternative Vote: Elections to Australia’s House of Representatives”, Australian Journal of Political Science 44, no. 3 (September 2009), 521–8; Ron Johnston and James Forrest, “Geography and Election Results: Disproportionality and Bias in the 1993–2004 Elections to the Australian House of Representatives”, Geographical Research 47, no. 2 (June 2009), 95–108. 34 Alan Siaroff, “Spurious Majorities, Electoral Systems, and Electoral System Change”, Commonwealth and Comparative Politics 41, no. 2 (2003), 143–60, at pp. 146–7. 35 Patrick Dunleavy, Helen Margetts, and Stuart Weir, “How Britain Would Have Voted under Alternative Electoral Systems in 1992”, Parliamentary Affairs 45, no. 4 (October 1992), 640–55, at p. 644. 36
This argument is most famously expressed in Maurice Duverger, Political Parties: Their Organization and Activity in the Modern State (London: Methuen, 1954), pp. 239–45 and 325–6. See also Cox (note 11), pp. 92–5. 37
Figure 2 uses a measure of the number of parties in a party system called the “effective number of parties”. This counts parties weighted by size, calculated in terms the parties’ shares of the seats in the legislature. (For details of the formula and figures, see Professor Michael Gallagher’s website at www.tcd.ie.) 38 C. Sharman, A. M. Sayers, and N. Miragliotta, “Trading Party Preferences: The Australian Experience of Preferential Voting”, Electoral Studies 21 (2002), 543–60; Dean Jaensch and David Mathieson, A Plague on Both Your Houses: Minor Parties in Australia (St Leonards, NSW: Allen & Unwin, 1998), pp. 186–7. 39 Jaensch and Mathieson (note 38), p. 187. 40 Dean Jaensch, The Australian Party System (Sydney: Allen & Unwin, 1983), pp. 21–22; Cox (note 11), p. 93; Marian Sawer, “Australia: Replacing Plurality Rule with Majority-Preferential Voting”, in Josep M. Colomer (ed.), Handbook of Electoral System Choice (Basingstoke: Palgrave Macmillan, 2004), pp. 475–86, at pp. 483–4. 41 Sharman, Sayers, and Miragliotta (note 38), at p. 549; Ben Reilly, “Preferential Voting and Its Political Consequences”, in Marian Sawer (ed.), Elections: Full, Free and Fair (Leichhardt, NSW: Federation Press, 2001), 78–95, at pp. 89–90; Ben Reilly, Democracy in Divided Societies (Cambridge: Cambridge University Press, 2001), pp. 53–4. 42 Paul D. Williams, “The Queensland Election of 17 February 2001: Reforging the Electoral Landscape?”, Australian Journal of Political Science 36, no. 2 (2001), 363–71; personal communication with Antony Green, Australian Broadcasting Corporation. 43 Ben Reilly, “Preferential Voting and Its Political Consequences”, in Marian Sawer (ed.), Elections: Full, Free and Fair (Leichhardt, NSW: Federation Press, 2001), 78–95, at pp. 78–9. 44 Curtice (note 24). 45
Arend Lijphart, Patterns of Democracy: Government Forms and Performance in Thirty-Six Countries (New Haven: Yale University Press, 1999), p. 137. 46
Torben Iversen and David Soskice, “Electoral Institutions and the Politics of Coalitions: Why Some Democracies Redistribute More than Others”, American Political Science Review, 100, no. 2 (May 2006), pp. 165–81. 47
Alan Renwick, A Citizen’s Guide to Electoral Reform (London: Biteback, 2011), pp. 37–41. 48
Lijphart (note 45). 49
G. Bingham Powell, Jr., Elections as Instruments of Democracy: Majoritarian and Proportional Visions (Yale University Press, 2000). 50 Renwick (note 47), pp. 90–92. See also P. J. Taylor, “The Case for Proportional Tenure: A Defense of the British Electoral System”, in Arend Lijphart and Bernard Grofman (eds.), Choosing an Electoral System: Issues and Alternatives (Praeger, 1984), pp. 53–8; Jack Vowles, “Electoral Systems and Proportional Tenure of Government: Renewing the Debate”, British Journal of Political Science, 34, no. 1 (January 2004), pp. 166–79; Adrian Blau, “The Effective Number of Parties at Four Scales: Votes, Seats, Legislative Power and Cabinet Power”, Party Politics, 14, no. 2 (March 2008), pp. 167–87. 51
House of Commons Library, General Election 2010: Detailed Analysis (Research Paper 10/36, 8 July 2010), at p. 45. 52 Pippa Norris, Electoral Engineering: Voting Rules and Political Behavior (Cambridge: Cambridge University Press, 2004), pp. 187–90.

25
53
“Women in National Parliaments”, Inter-Parliamentary Union, www.ipu.org, 31 January 2011. 54
See Sanders et al. (note 5), p. 12 for estimates of how votes would have transferred between parties in the 2010 general election. 55
Benjamin Nyblade and Steven Reed, “Who Cheats? Who Loots? Political Competition and Corruption in Japan, 1947-1993”, American Journal of Political Science 52, no. 4, (2008), 926–41. 56
“MPs expenses and safe seats correlation”, Mark Thompson’s Blog, 17 May 2009, at markreckons.blogspot.com. See also, for example, Polly Toynbee, “Seize this moment to bring in real constitutional change”, guardian.co.uk, 18 May 2009. 57 Renwick (note 47), p. 46. 58
Valerie Heitshusen, Garry Young, and David M. Wood, “Electoral Context and MP Constituency Focus in Australia, Canada, Ireland, New Zealand and the United Kingdom”, American Journal of Political Science 49, no. 1 (January 2005), 32–45. 59 See, e.g., Gemma Rosenblatt, A Year in the Life: From Member of Public to Member of Parliament (London: Hansard Society, 2006). 60
See, e.g., Donald L. Horowitz, A Democratic South Africa? Constitutional Engineering in a Divided Society (Berkeley: University of California Press, 1991); Ben Reilly, “Electoral Systems for Divided Societies”, Journal of Democracy 13, no. 2 (April 2002), 156–70. 61
Reilly (note 43), at p. 94. 62
Ben Reilly, Democracy in Divided Societies (Cambridge: Cambridge University Press, 2001), pp. 53–4. 63 Jeremy Thompson, “Abbott and Gillard up insult stakes”, ABC News online (www.abc.net.au), 24 March 2011. 64 For example, supporters of republicanism in Australia argued after their 1999 referendum defeat that voters had rejected the particular alternative to the monarchy that was offered (a president elected by parliament), not the principle of republicanism in itself. 65 See Laurence LeDuc, “Tough Sell: The Referendum on Electoral Reform”, paper presented at the EPOP Conference, University of Essex, 10–12 September 2010, p. 11. 66 Alan Renwick, The Politics of Electoral Reform: Changing the Rules of Democracy (Cambridge: Cambridge University Press, 2010).