The Agricultural Revolution and the Industrial Revolution: England ...
46
The Agricultural Revolution and the Industrial Revolution: England, 1500-1912 Gregory Clark, University of California, Davis, CA 95616 ([email protected] ) June, 2002 Historians have long believed that the modern world commenced in Britain in the 1770s with simultaneous industrial and agricultural revolutions. I estimate agricultural productivity, output per acre and output per worker in England all the way from 1500 to 1912. These estimates show that the growing population of Industrial Revolution England was fed mainly through food imports and through switching agricultural output towards food, not through an agricultural revolution. This in turn implies output growth overall in the Industrial Revolution was lower than has been estimated. Contrary to expectation, productivity growth before 1869 was overwhelmingly from growing yields as opposed to growing labor productivity.
Transcript of The Agricultural Revolution and the Industrial Revolution: England ...
The Agricultural Revolution and the Industrial Revolution: England, 1500-1912
Gregory Clark, University of California, Davis, CA 95616 ([email protected])
June, 2002
Historians have long believed that the modern world commenced in Britain in the
1770s with simultaneous industrial and agricultural revolutions. I estimate
agricultural productivity, output per acre and output per worker in England all the
way from 1500 to 1912. These estimates show that the growing population of
Industrial Revolution England was fed mainly through food imports and through
switching agricultural output towards food, not through an agricultural revolution.
This in turn implies output growth overall in the Industrial Revolution was lower
than has been estimated. Contrary to expectation, productivity growth before
1869 was overwhelmingly from growing yields as opposed to growing labor
productivity.
2
Introduction
Agricultural yields in medieval England were low compared to England by 1850.
Indeed it seems that net output per acre in southern England by 1850 was about 3.2 times
output per acre in 1300. If the conventional assumption that about 75 percent of the
population in pre-industrial society was employed in agriculture is adopted for medieval
England then output per worker grew by even more (see, for example, Allen (2000), p.
11). If there were 6 million people in England in 1300 output per farm worker in 1850
would be 4.4 times output in 1300. This implies, even assuming no change in output per
unit of capital, that total factor productivity in English agriculture tripled between 1300
and 1850.1 An agricultural revolution accompanied or preceded the Industrial
Revolution.
Historians dispute, however, when and how the agricultural revolution was
accomplished. Consideration of food consumption demands convinced most that the
agricultural revolution exactly coincided with the Industrial Revolution (see, for example,
Crafts (1985)). Such a coincidence would suggest that the Industrial Revolution was just
part of very broad productivity advance in the British economy in the years 1760 to 1860.
Such a broad adavnce makes it likely that the Industrial Revolution had a systematic
cause rather than being just an accident.
Here I use estimates of land rental values, wages, the return on capital and output prices
to estimate net farm, output per acre, and output per worker, from 1500 to 1912, as well as total
factor productivity in agriculture. The new series suggest that measured agricultural productivity
increased by only about 50 percent between 1500 and 1860. The majority of this growth did,
1 See Clark (1991b).
3
however, occur after 1800. But even from1760 to the 1860 there was much less productivity
growth than standard accounts of the Industrial Revolution, such as Crafts (1985), assume. Thus
current estimates of output growth in England in the Industrial Revolution era need substantial
downward revision. Further the rate of productivity growth in England in the years 1500-1789
is no greater than the growth rates Philip Hoffman finds for the Paris Basin. Finally, contrary to
expectation, the source of productivity growth before 1869 is overwhelmingly growing yields as
opposed to growth of labor productivity. Pre-industrial England stands out as having
exceptionally high agricultural labor productivity as early as 1500.
Agricultural Productivity
Total factor productivity in agriculture can be approximated using the formula
Ap
j
ii j
j
i= ∏
ω θ
α,
where A is an index of productivity, pi is the price of output i, and α is the share of output i in the
value of output, ωj is the wage paid to input j, and θj is the share of input j in the total payments
to inputs. This formula just says that productivity can be measured as the geometric average of
the each input cost relative to an index of output prices. Productivity is thus a weighted average
of the “real” costs of the inputs. If the shares of the inputs in costs change over time then
productivity movements can be measured by chaining productivity indices that use different cost
weights for shorter periods.
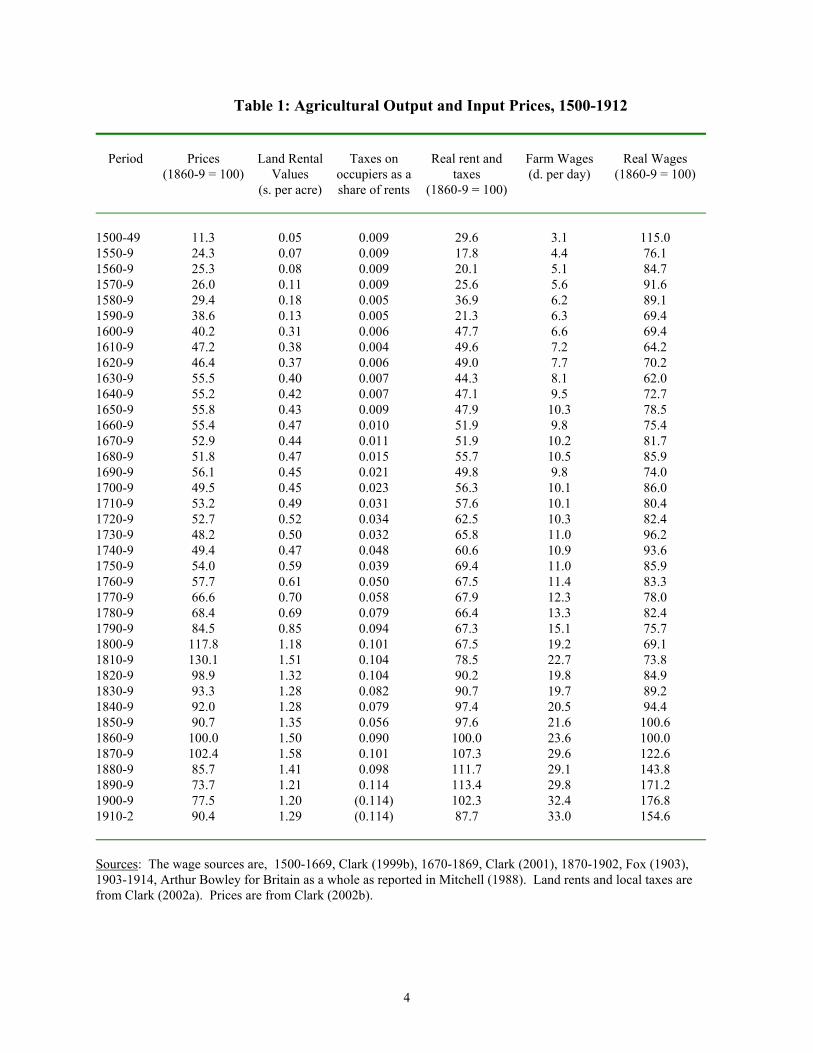
Tables 1 and 2 shows the output and input price series by decade required for this
4
Table 1: Agricultural Output and Input Prices, 1500-1912
Period
Prices
(1860-9 = 100)
Land Rental
Values (s. per acre)
Taxes on
occupiers as a share of rents
Real rent and
taxes (1860-9 = 100)
Farm Wages (d. per day)
Real Wages
(1860-9 = 100)
1500-49 11.3 0.05 0.009 29.6 3.1 115.0 1550-9 24.3 0.07 0.009 17.8 4.4 76.1 1560-9 25.3 0.08 0.009 20.1 5.1 84.7 1570-9 26.0 0.11 0.009 25.6 5.6 91.6 1580-9 29.4 0.18 0.005 36.9 6.2 89.1 1590-9 38.6 0.13 0.005 21.3 6.3 69.4 1600-9 40.2 0.31 0.006 47.7 6.6 69.4 1610-9 47.2 0.38 0.004 49.6 7.2 64.2 1620-9 46.4 0.37 0.006 49.0 7.7 70.2 1630-9 55.5 0.40 0.007 44.3 8.1 62.0 1640-9 55.2 0.42 0.007 47.1 9.5 72.7 1650-9 55.8 0.43 0.009 47.9 10.3 78.5 1660-9 55.4 0.47 0.010 51.9 9.8 75.4 1670-9 52.9 0.44 0.011 51.9 10.2 81.7 1680-9 51.8 0.47 0.015 55.7 10.5 85.9 1690-9 56.1 0.45 0.021 49.8 9.8 74.0 1700-9 49.5 0.45 0.023 56.3 10.1 86.0 1710-9 53.2 0.49 0.031 57.6 10.1 80.4 1720-9 52.7 0.52 0.034 62.5 10.3 82.4 1730-9 48.2 0.50 0.032 65.8 11.0 96.2 1740-9 49.4 0.47 0.048 60.6 10.9 93.6 1750-9 54.0 0.59 0.039 69.4 11.0 85.9 1760-9 57.7 0.61 0.050 67.5 11.4 83.3 1770-9 66.6 0.70 0.058 67.9 12.3 78.0 1780-9 68.4 0.69 0.079 66.4 13.3 82.4 1790-9 84.5 0.85 0.094 67.3 15.1 75.7 1800-9 117.8 1.18 0.101 67.5 19.2 69.1 1810-9 130.1 1.51 0.104 78.5 22.7 73.8 1820-9 98.9 1.32 0.104 90.2 19.8 84.9 1830-9 93.3 1.28 0.082 90.7 19.7 89.2 1840-9 92.0 1.28 0.079 97.4 20.5 94.4 1850-9 90.7 1.35 0.056 97.6 21.6 100.6 1860-9 100.0 1.50 0.090 100.0 23.6 100.0 1870-9 102.4 1.58 0.101 107.3 29.6 122.6 1880-9 85.7 1.41 0.098 111.7 29.1 143.8 1890-9 73.7 1.21 0.114 113.4 29.8 171.2 1900-9 77.5 1.20 (0.114) 102.3 32.4 176.8 1910-2 90.4 1.29 (0.114) 87.7 33.0 154.6
Sources: The wage sources are, 1500-1669, Clark (1999b), 1670-1869, Clark (2001), 1870-1902, Fox (1903), 1903-1914, Arthur Bowley for Britain as a whole as reported in Mitchell (1988). Land rents and local taxes are from Clark (2002a). Prices are from Clark (2002b).

5
calculation. I describe the sources of these series only briefly, since except for taxes on farmland
occupiers they are described in detail in other sources detailed in the notes to the table. The
output price series uses 23 component series for all or parts of these years: wheat, barley, oats,
rye, peas, beans, potatoes, hops, straw, hay, beef, mutton, pork, bacon, tallow, milk, cheese,
butter, wool, eggs, faggots (firewood), and timber (Clark (2002b)). The land rents are the market
rental values including tithe of plots of unchanging area (Clark (2002a)). The rent series thus
incorporates and values in earlier years communal “waste” land only later brought into private
cultivation. To these rents have been added the local rates paid by property occupiers. The level
of these rates was estimated in the ways detailed in the appendix. Wages are the average day
wages of adult male farm workers outside harvest using the methods described in Clark (2001).
Columns 2 and 3 of table 2 give the percentage return on rent charges and bonds and mortgages
using the methods described in Clark (1998c). Rent charges and bonds and mortgages had
similar rates of return, except in the early seventeenth century when mortgage rates were
significantly higher (probably as a result of legal disabilities suffered by the mortgage in these
earlier years of its development as a financial instrument) so I use the rent charge series since it
extends back to the sixteenth century. To get from the percentage return on capital to the rental
price of capital, which is what is needed to calculate productivity, I make two assumptions. The
first is that the price of capital goods can be approximated by an index composed of 60% the
price of pastoral products, 20% the general farm output price, 17% wages, and 3% rents. The
reason for this assumption is the observed composition of farmers’ capital in the eighteenth and
nineteenth centuries. A detailed estimate for 1861, for example, shows that it composed as
follows:
6
Live Stock 60%
Implements 11%
Seed, Labor, Horse and Cattle Food 21%
Rent, tithe and taxes in advance 3%
Maintenance of farmer 5%
The majority of the farmers’ capital was livestock or fodder, with implements even in 1861
comprising a small share. Arthur Young gives some breakdowns of the expected composition of
farmers capital in 1770, where live stock is still the most significant category at 45%, and
implements are a very similar 12% (Young (1770), Volume 4, pp. 417-22). I assume that
implement prices were dictated by the labor required to construct them. The implied price index
for farmers’ capital is close to the price index for all agricultural output. The second assumption
is that the interest cost of the capital employed by farmers was the rent charge rate plus 4%. If
we allow 10% depreciation on the workhorses of the farm and on the implements, and nothing
on the other items of capital, then the overall depreciation rate will be roughly 2.5%. Allowing
the farmer the return on capital from rent charges on land, plus 1.5% for the risk of the
investment, implies that the interest cost of capital will be the return on rent charges plus 4%.
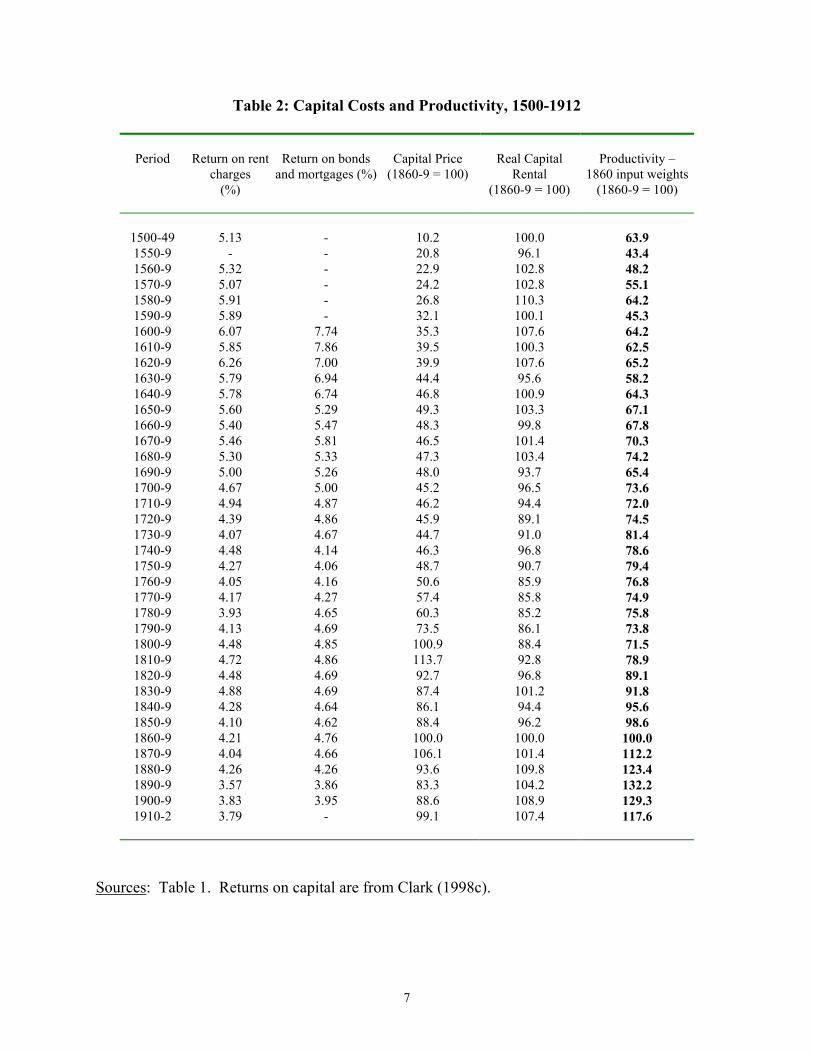
The third column of table 2 shows the resulting capital rental index relative to agricultural output
prices.
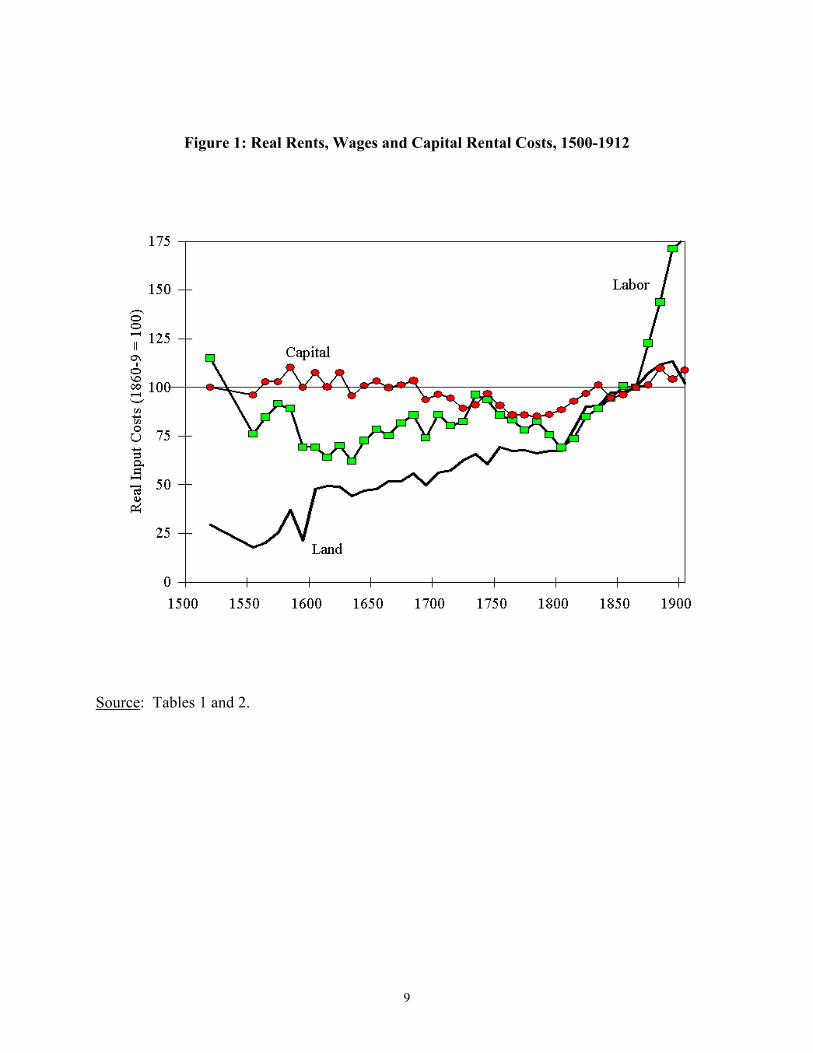
Figure 1 shows these three key series, rents, wages and the rental costs of capital in terms
of output prices. Real capital costs are fairly constant over the years 1500 to 1912, deviating by
no more than 20% from their mean level. Real wages fall from 1500 to 1600, then rise gradually
towards 1860, before rising rapidly in tha late nineteenth century. Land rents in contrast show a
steady upward trend from 1500 to 1912. Overall productivity will be the weighted average of
7
Table 2: Capital Costs and Productivity, 1500-1912
Period
Return on rent
charges (%)
Return on bonds
and mortgages (%)
Capital Price
(1860-9 = 100)
Real Capital
Rental (1860-9 = 100)
Productivity –
1860 input weights (1860-9 = 100)
1500-49 5.13 - 10.2 100.0 63.9 1550-9 - - 20.8 96.1 43.4 1560-9 5.32 - 22.9 102.8 48.2 1570-9 5.07 - 24.2 102.8 55.1 1580-9 5.91 - 26.8 110.3 64.2 1590-9 5.89 - 32.1 100.1 45.3 1600-9 6.07 7.74 35.3 107.6 64.2 1610-9 5.85 7.86 39.5 100.3 62.5 1620-9 6.26 7.00 39.9 107.6 65.2 1630-9 5.79 6.94 44.4 95.6 58.2 1640-9 5.78 6.74 46.8 100.9 64.3 1650-9 5.60 5.29 49.3 103.3 67.1 1660-9 5.40 5.47 48.3 99.8 67.8 1670-9 5.46 5.81 46.5 101.4 70.3 1680-9 5.30 5.33 47.3 103.4 74.2 1690-9 5.00 5.26 48.0 93.7 65.4 1700-9 4.67 5.00 45.2 96.5 73.6 1710-9 4.94 4.87 46.2 94.4 72.0 1720-9 4.39 4.86 45.9 89.1 74.5 1730-9 4.07 4.67 44.7 91.0 81.4 1740-9 4.48 4.14 46.3 96.8 78.6 1750-9 4.27 4.06 48.7 90.7 79.4 1760-9 4.05 4.16 50.6 85.9 76.8 1770-9 4.17 4.27 57.4 85.8 74.9 1780-9 3.93 4.65 60.3 85.2 75.8 1790-9 4.13 4.69 73.5 86.1 73.8 1800-9 4.48 4.85 100.9 88.4 71.5 1810-9 4.72 4.86 113.7 92.8 78.9 1820-9 4.48 4.69 92.7 96.8 89.1 1830-9 4.88 4.69 87.4 101.2 91.8 1840-9 4.28 4.64 86.1 94.4 95.6 1850-9 4.10 4.62 88.4 96.2 98.6 1860-9 4.21 4.76 100.0 100.0 100.0 1870-9 4.04 4.66 106.1 101.4 112.2 1880-9 4.26 4.26 93.6 109.8 123.4 1890-9 3.57 3.86 83.3 104.2 132.2 1900-9 3.83 3.95 88.6 108.9 129.3 1910-2 3.79 - 99.1 107.4 117.6
Sources: Table 1. Returns on capital are from Clark (1998c).
8
these series with the weights being given by the shares of each input in total costs. We shall
discuss below what the appropriate weights are, but it should be immediately evident from figure
1 that whatever the plausible range of weights, English agriculture must have experienced only
modest productivity gains in the years 1500 to 1869.
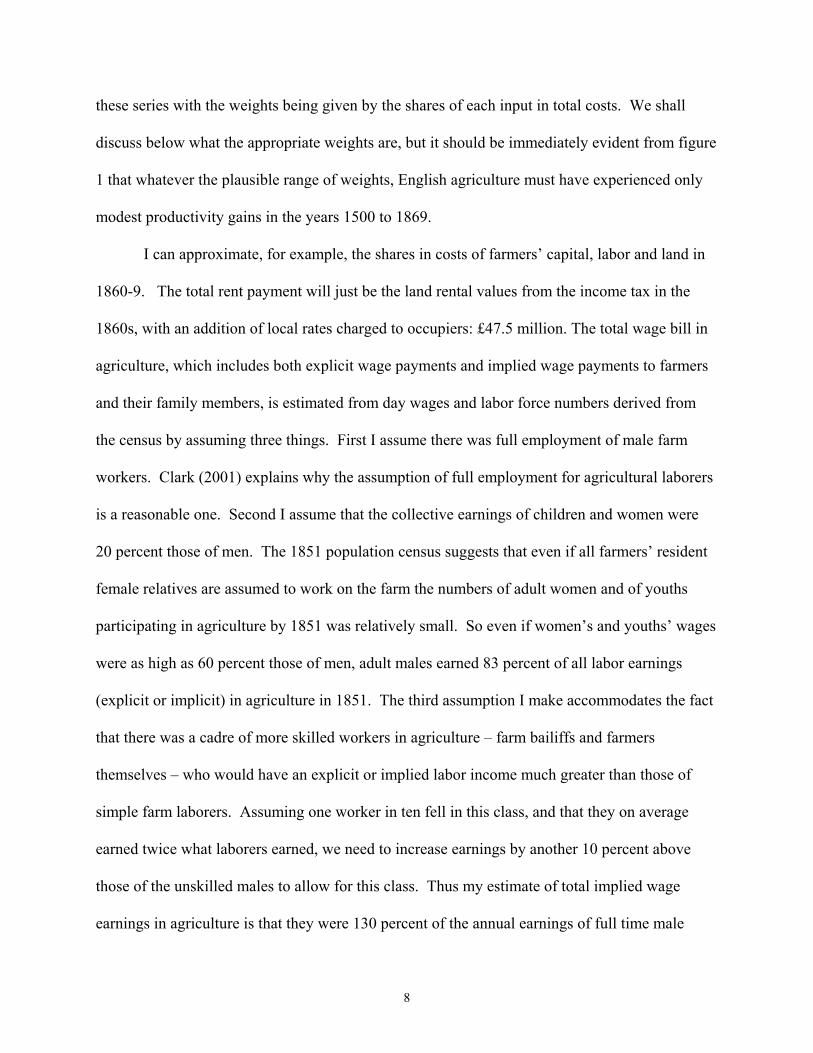
I can approximate, for example, the shares in costs of farmers’ capital, labor and land in
1860-9. The total rent payment will just be the land rental values from the income tax in the
1860s, with an addition of local rates charged to occupiers: £47.5 million. The total wage bill in
agriculture, which includes both explicit wage payments and implied wage payments to farmers
and their family members, is estimated from day wages and labor force numbers derived from
the census by assuming three things. First I assume there was full employment of male farm
workers. Clark (2001) explains why the assumption of full employment for agricultural laborers
is a reasonable one. Second I assume that the collective earnings of children and women were
20 percent those of men. The 1851 population census suggests that even if all farmers’ resident
female relatives are assumed to work on the farm the numbers of adult women and of youths
participating in agriculture by 1851 was relatively small. So even if women’s and youths’ wages
were as high as 60 percent those of men, adult males earned 83 percent of all labor earnings
(explicit or implicit) in agriculture in 1851. The third assumption I make accommodates the fact
that there was a cadre of more skilled workers in agriculture – farm bailiffs and farmers
themselves – who would have an explicit or implied labor income much greater than those of
simple farm laborers. Assuming one worker in ten fell in this class, and that they on average
earned twice what laborers earned, we need to increase earnings by another 10 percent above
those of the unskilled males to allow for this class. Thus my estimate of total implied wage
earnings in agriculture is that they were 130 percent of the annual earnings of full time male
9
Figure 1: Real Rents, Wages and Capital Rental Costs, 1500-1912
Source: Tables 1 and 2.
10
workers: £46.6 million.
Charles Wratislaw gives a detailed estimate of the farmers’ capital stock 1861 which
suggests that the tenant needed to supply on average £8.68 in capital per acre. Other estimates
from 1838 and 1878 suggest respectively £10 and £12 per acre.2 Wratislaw omits any allowance
for the cost of the maintenance of the farmer over the course of the year. Assuming the average
farmer expends £100 on himself in 1861, Wratislaw’s capital per acre, adjusted to the prices of
the 1860s, would be £9.3. This makes a total capital stock for the 26.524 acres of land in crops,
garden and wood in England and Wales in the 1860s of £247 million, and annual implied capital
rentals of £20.2 million. Thus in the 1860s wages were 40.8% of costs, rent, tithe and taxes
41.5% and the payments for rental of the farmers’ capital 17.7%.
The last column of table 2 shows implied agricultural productivity over time if I assume
input cost shares were constant at the level of the 1860s. Total agricultural productivity rises by
only about 56% in the 340 years between the 1520s and the 1860s. And in the period of the
famous agricultural revolution from the 1760s to the 1860s the rise is a modest 31%.
Labor and Capital Inputs
If I can infer the numbers of workers and the amount of capital before 1860, then I get
two things. First a better estimate of productivity movements since I can then estimate by period
the share of different inputs in costs. Second estimates of total agricultural output, output per
acre and output per farm worker.
This way of measuring net output will have both advantages and weaknesses compared to
traditional attempts to estimate output by estimating crop yields. Such methods include the
2 Wratislaw (1861), Tomson (1847), Squarey (1878).
11
probate inventory studies of Mark Overton and others, the recent farm account based estimates
of Michael Turner, John Beckett, and Bethany Afton, and the labor input method used by Clark
(1991a). These crop yield methods are limited by our lack of knowledge of how much of the
potential agricultural land was devoted to crop production, and how much to each crop. Also
these methods look just at the arable sector, which was only half of the output of English
agriculture. Input cost measures avoid such problems. But they are limited by the need to
estimate the quantities of labor and capital inputs.
I estimate the number of farm workers from the population censuses from 1801 on. The
share of males employed in agriculture declined from about 37 percent circa 1801 to 10 percent
circa 1911. This gives the figures shown in table 3 for males in agriculture from 1800-9 on.
There is little direct evidence on the size of the agricultural labor force before 1801. Peter
Lindert’s work on English occupations suggests that the farm labor force was no more than 53
percent of the male population in the 1750s (Lindert (1980), Lindert and Williamson (1982)). I
assume the figure for this decade and that the share of male laborers in agriculture fell linearly
until 1800-9. Before 1760 England was largely self sufficient in agricultural produce. Thus I
estimate the share of labor in agriculture based on the share estimated for 1750-9, but make an
adjustment for estimated income levels relative to 1750-9, since the share of consumption
devoted to agricultural products is higher when income is lower. I assume an income elasticity
of 0.6 for agricultural products, and that labor productivity was the same in agriculture as in the
rest of the economy. This implies that the share of labor employed in agriculture was never
higher than 60 percent after 1500. Robert Allen assumes a higher share of labor was employed
in

12
Table 3: Labor Inputs in Agriculture, England, 1500-1912
Period
Population
(m.)
Share of males in
Agriculture Preferred Estimate
Males in
Agriculture Preferred Estimate
(000)
Farm
Wages (£. m.)
Share of males in
Agriculture Alternative
Estimate
Males in
Agriculture Alternative
estimate (000)
Farm Wages
(£. m.)
Alternative Estimate
1500-49 2.78 0.55 367 2.3 0.75 502 3.0
1550-9 3.24 0.58 455 3.9 0.75 586 5.0 1560-9 3.21 0.60 464 4.6 0.75 580 5.7 1570-9 3.50 0.59 496 5.4 0.75 633 6.9 1580-9 3.55 0.60 513 6.2 0.75 643 7.7 1590-9 4.16 0.59 594 7.3 0.75 753 9.3 1600-9 4.12 0.59 591 7.6 0.75 745 9.6 1610-9 4.43 0.58 621 8.7 0.75 802 11.2 1620-9 4.70 0.59 671 10.1 0.75 850 12.7 1630-9 4.88 0.59 697 11.0 0.75 882 14.0 1640-9 5.08 0.59 722 13.3 0.75 919 17.0 1650-9 5.26 0.57 729 14.7 0.75 951 19.2 1660-9 5.23 0.56 712 13.7 0.75 946 18.2 1670-9 5.11 0.56 685 13.6 0.75 924 18.4 1680-9 5.06 0.56 679 13.9 0.75 915 18.7 1690-9 5.05 0.55 672 12.8 0.75 912 17.4 1700-9 5.16 0.55 687 13.5 0.75 933 18.3 1710-9 5.33 0.54 697 13.7 0.75 964 19.0 1720-9 5.45 0.53 696 13.9 0.75 986 19.7 1730-9 5.36 0.52 678 14.5 0.70 905 19.3 1740-9 5.67 0.52 712 15.1 0.65 888 18.9 1750-9 5.87 0.53 742 15.9 0.60 848 18.1 1760-9 6.25 0.49 745 16.5 0.55 745 16.5 1770-9 6.56 0.47 748 17.9 0.50 748 17.9 1780-9 7.14 0.44 751 19.5 0.45 751 19.5 1790-9 7.77 0.40 753 22.2 0.40 753 22.2 1800-9 8.59 0.37 756 28.3 1810-9 9.77 0.35 813 35.9 1820-9 11.35 0.33 894 34.5 1830-9 13.16 0.30 937 35.9 1840-9 15.78 0.26 975 39.0 1850-9 17.77 0.24 1,036 43.5 1860-9 19.97 0.21 1,013 46.6 1870-9 22.75 0.17 956 55.2 1880-9 25.78 0.15 921 52.2 1890-9 28.83 0.12 845 49.1 1900-9 32.12 0.10 810 51.1
1910-12 34.30 0.10 785 53.1
Sources: See the text.
13
agriculture in England before 1700. He assumes, for example, that agriculture employed 74
percent of labor in 1500 (Allen (2000)). I thus also construct an alternative labor input series
which has 75% of the population employed in agriculture from 1500 to 1720-9, and then has an
evenly declining share to 1800-9. These alternative estimates are also shown in table 3.
To estimate the amount of capital employed before 1860 I assume that there was a fixed
capital-output ratio. The reason for this assumption is in part the importance of livestock, seeds,
and labor payments in the farmers’ capital stock in 1861 and the unimportance of implements.
There is no reason to believe that the required stock of draft animals per unit of output was any
less in the years before 1860, the turnover of meat producing animals was any faster, or the seed
per unit of grain output.
I can do a check on this assumption for 1770 when Arthur Young in his account of his
Northern Tour reports frequently local views on the required amount of farmers’ capital per acre,
quoted as how many £ of capital were required per £ of rent paid by the farmer. The average
figure quoted was that a farmer taking a new letting would need a capital equal to 4.04 times the
rent (Young (1770), Volume 4, pp. 417-22). Young argues that farmers tended to increase their
capital stock in the years after a letting so that this figure would underestimate the average
capital stock of farmers. With a constant capital-output ratio the implied ratio of farmers’ capital
to land rents circa 1770 is very similar at 4.37. The implied payments for capital under this
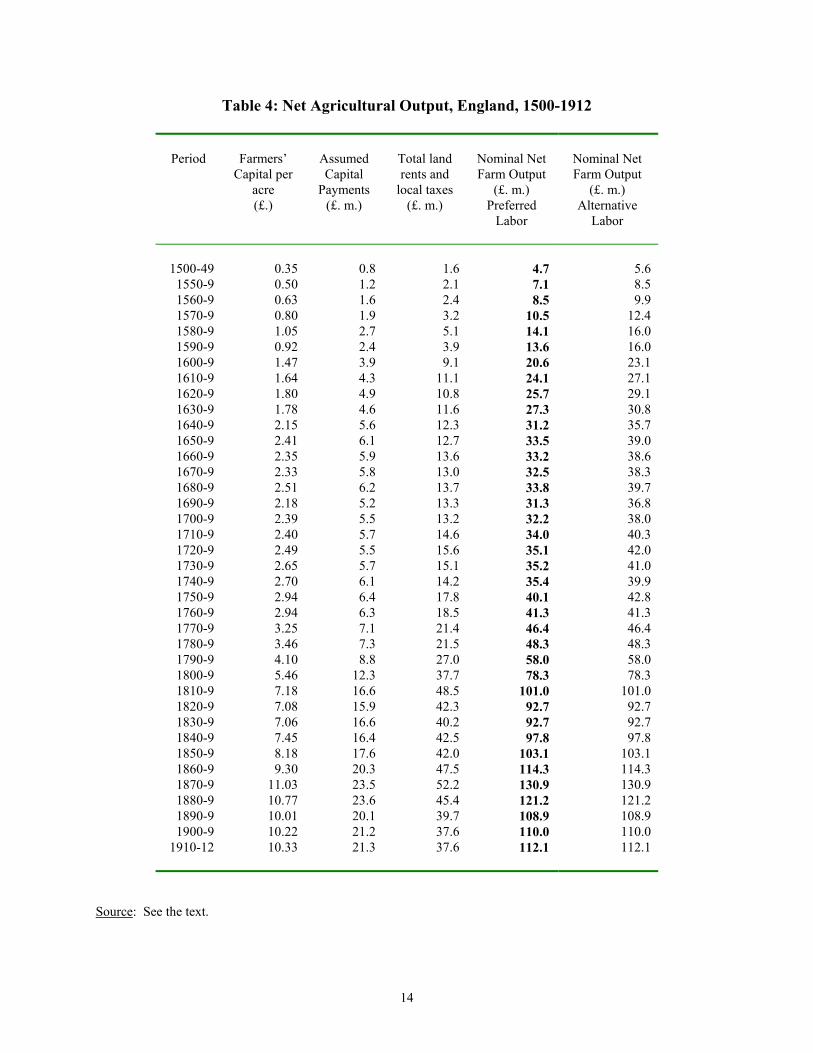
assumption are shown in table 4.3
3 The value of the capital stock in each period was calculated as the sum of the payments to land and labor divided by (v-(r+d)) where v = the output-capital ratio in 1860-9 ( = 0.473), r = the interest rate for each period, and d = the depreciation rate = .025). This multiplied by (r+d) gave the implied payments to farmers’ capital.
14
Table 4: Net Agricultural Output, England, 1500-1912
Period
Farmers’
Capital per acre (£.)
Assumed Capital
Payments (£. m.)
Total land rents and
local taxes (£. m.)
Nominal Net Farm Output
(£. m.) Preferred
Labor
Nominal Net Farm Output
(£. m.) Alternative
Labor
1500-49 0.35 0.8 1.6 4.7 5.6
1550-9 0.50 1.2 2.1 7.1 8.5 1560-9 0.63 1.6 2.4 8.5 9.9 1570-9 0.80 1.9 3.2 10.5 12.4 1580-9 1.05 2.7 5.1 14.1 16.0 1590-9 0.92 2.4 3.9 13.6 16.0 1600-9 1.47 3.9 9.1 20.6 23.1 1610-9 1.64 4.3 11.1 24.1 27.1 1620-9 1.80 4.9 10.8 25.7 29.1 1630-9 1.78 4.6 11.6 27.3 30.8 1640-9 2.15 5.6 12.3 31.2 35.7 1650-9 2.41 6.1 12.7 33.5 39.0 1660-9 2.35 5.9 13.6 33.2 38.6 1670-9 2.33 5.8 13.0 32.5 38.3 1680-9 2.51 6.2 13.7 33.8 39.7 1690-9 2.18 5.2 13.3 31.3 36.8 1700-9 2.39 5.5 13.2 32.2 38.0 1710-9 2.40 5.7 14.6 34.0 40.3 1720-9 2.49 5.5 15.6 35.1 42.0 1730-9 2.65 5.7 15.1 35.2 41.0 1740-9 2.70 6.1 14.2 35.4 39.9 1750-9 2.94 6.4 17.8 40.1 42.8 1760-9 2.94 6.3 18.5 41.3 41.3 1770-9 3.25 7.1 21.4 46.4 46.4 1780-9 3.46 7.3 21.5 48.3 48.3 1790-9 4.10 8.8 27.0 58.0 58.0 1800-9 5.46 12.3 37.7 78.3 78.3 1810-9 7.18 16.6 48.5 101.0 101.0 1820-9 7.08 15.9 42.3 92.7 92.7 1830-9 7.06 16.6 40.2 92.7 92.7 1840-9 7.45 16.4 42.5 97.8 97.8 1850-9 8.18 17.6 42.0 103.1 103.1 1860-9 9.30 20.3 47.5 114.3 114.3 1870-9 11.03 23.5 52.2 130.9 130.9 1880-9 10.77 23.6 45.4 121.2 121.2 1890-9 10.01 20.1 39.7 108.9 108.9 1900-9 10.22 21.2 37.6 110.0 110.0
1910-12 10.33 21.3 37.6 112.1 112.1
Source: See the text.
15
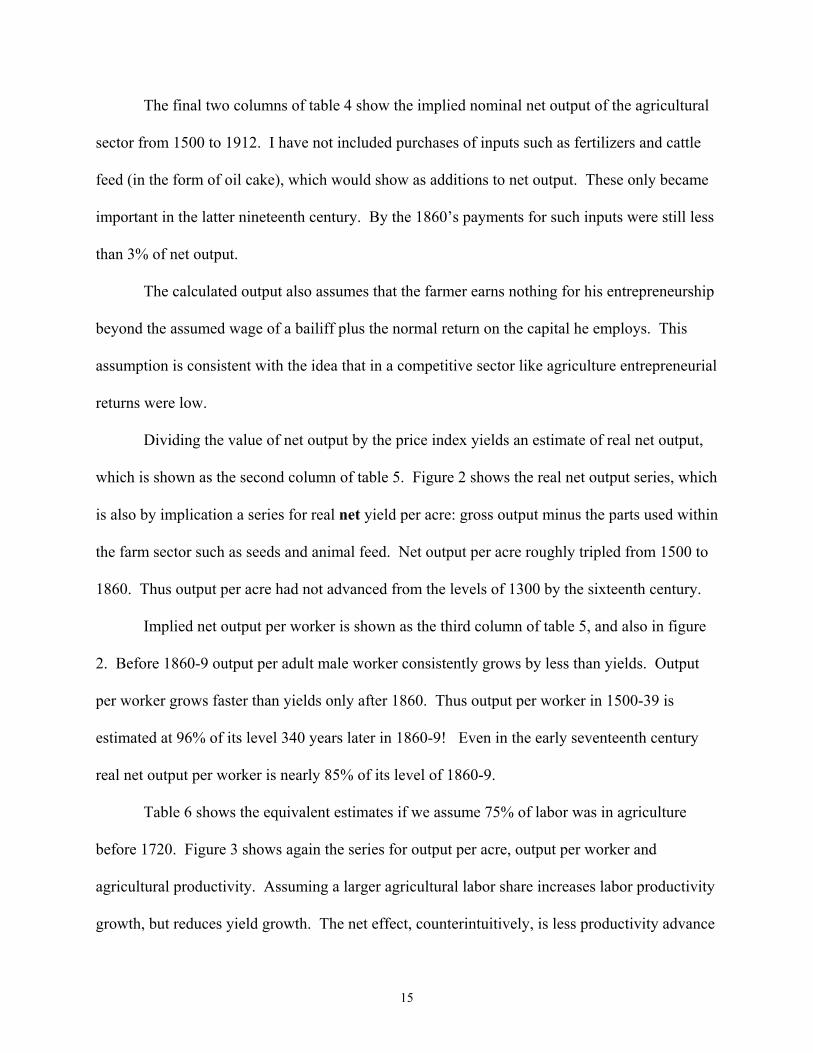
The final two columns of table 4 show the implied nominal net output of the agricultural
sector from 1500 to 1912. I have not included purchases of inputs such as fertilizers and cattle
feed (in the form of oil cake), which would show as additions to net output. These only became
important in the latter nineteenth century. By the 1860’s payments for such inputs were still less
than 3% of net output.
The calculated output also assumes that the farmer earns nothing for his entrepreneurship
beyond the assumed wage of a bailiff plus the normal return on the capital he employs. This
assumption is consistent with the idea that in a competitive sector like agriculture entrepreneurial
returns were low.
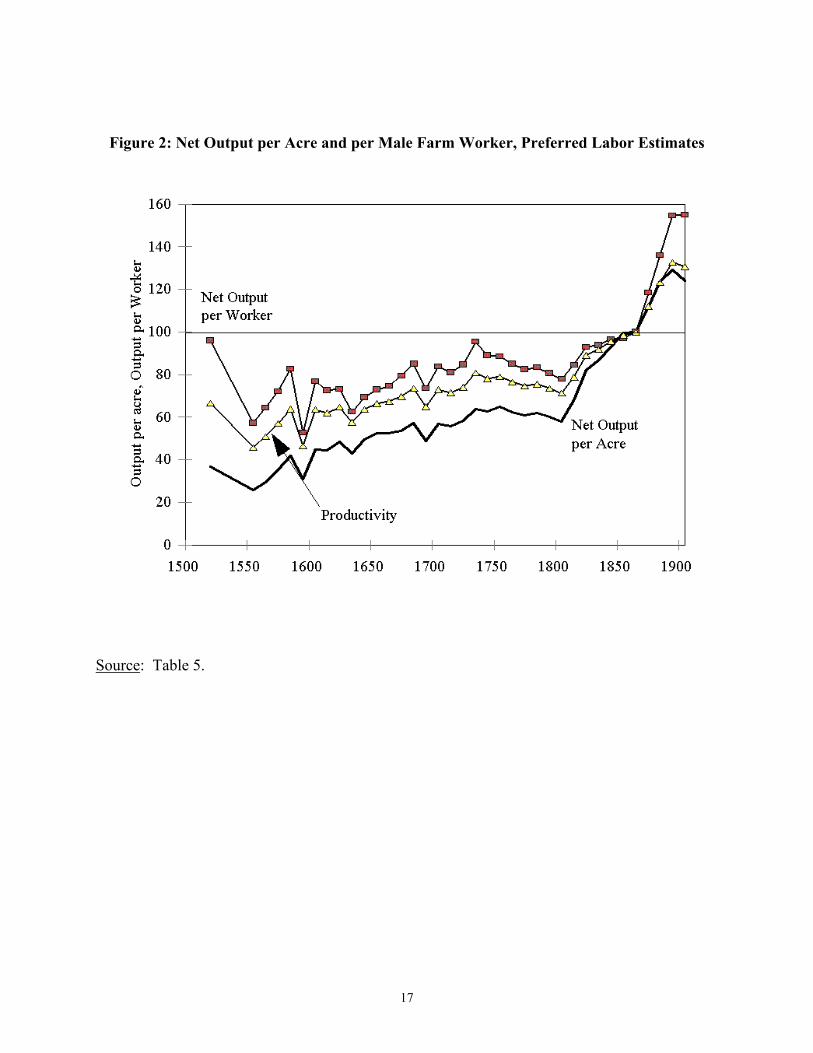
Dividing the value of net output by the price index yields an estimate of real net output,
which is shown as the second column of table 5. Figure 2 shows the real net output series, which
is also by implication a series for real net yield per acre: gross output minus the parts used within
the farm sector such as seeds and animal feed. Net output per acre roughly tripled from 1500 to
1860. Thus output per acre had not advanced from the levels of 1300 by the sixteenth century.
Implied net output per worker is shown as the third column of table 5, and also in figure
2. Before 1860-9 output per adult male worker consistently grows by less than yields. Output
per worker grows faster than yields only after 1860. Thus output per worker in 1500-39 is
estimated at 96% of its level 340 years later in 1860-9! Even in the early seventeenth century
real net output per worker is nearly 85% of its level of 1860-9.
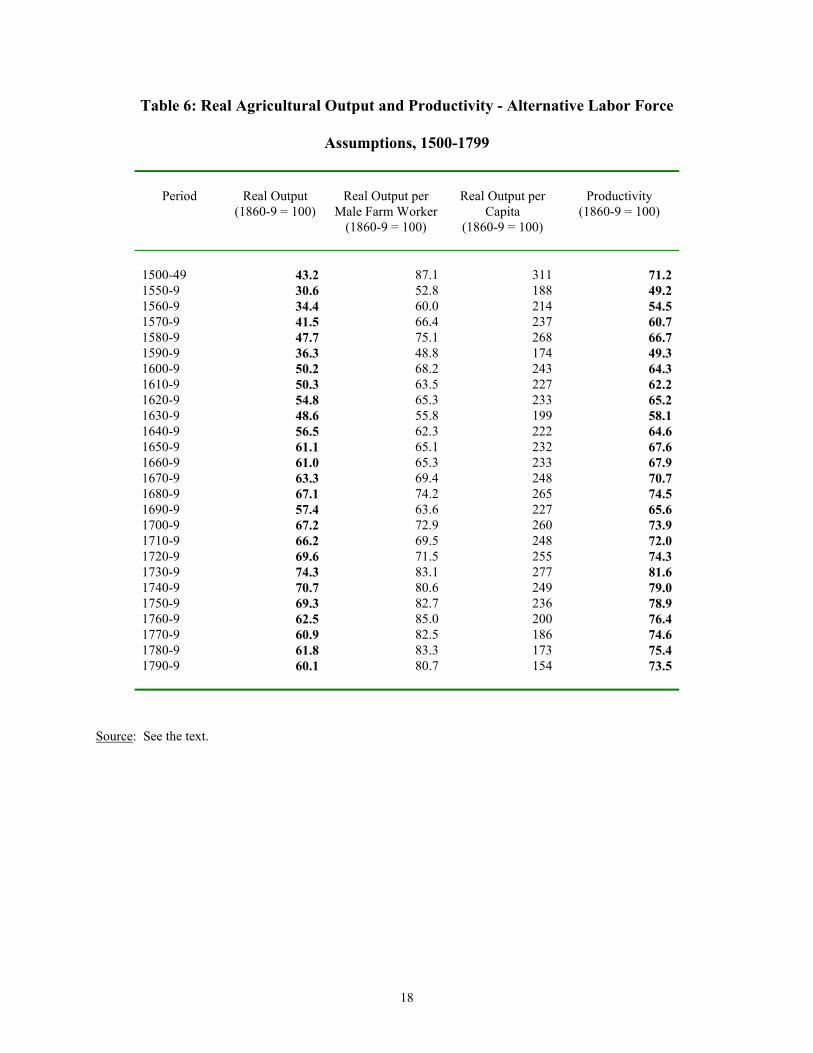
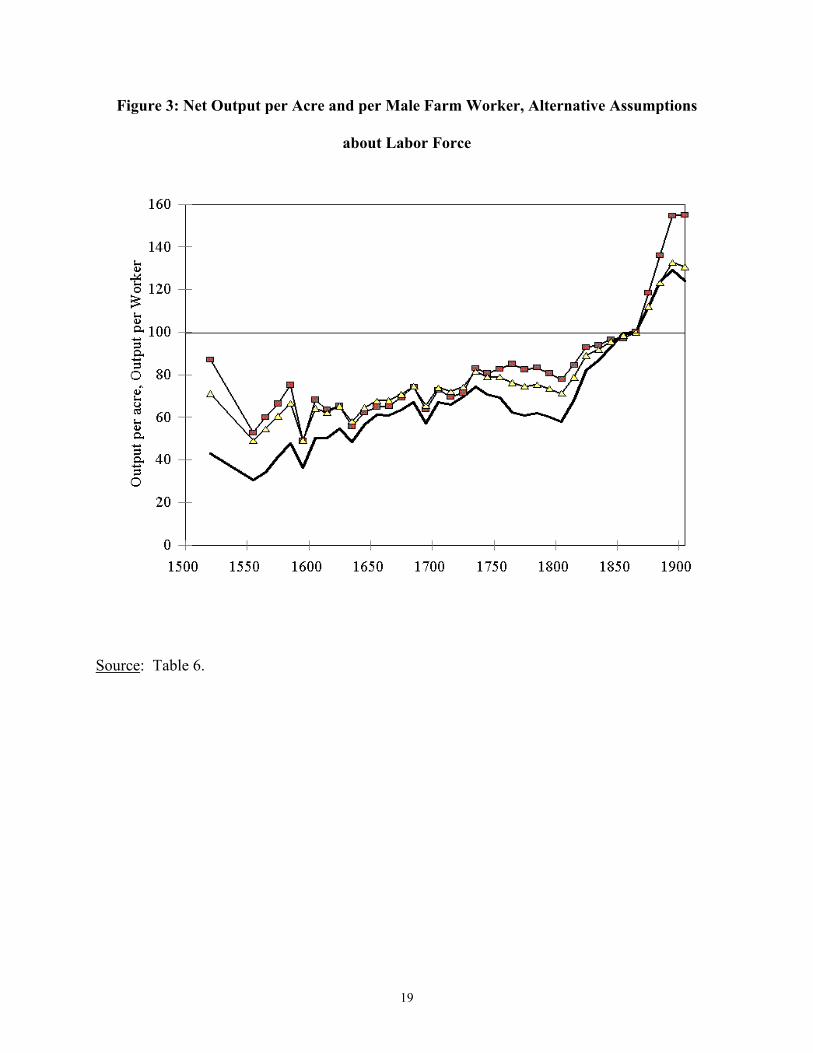
Table 6 shows the equivalent estimates if we assume 75% of labor was in agriculture
before 1720. Figure 3 shows again the series for output per acre, output per worker and
agricultural productivity. Assuming a larger agricultural labor share increases labor productivity
growth, but reduces yield growth. The net effect, counterintuitively, is less productivity advance

16
Table 5: Real Agricultural Output and Productivity - Preferred Labor Assumptions
Period
Real Output
(1860-9 = 100)
Real Output per
Male Farm Worker (1860-9 = 100)
Real Output per
Capita (1860-9 = 100)
Productivity
(1860-9 = 100)
1500-49 36.6 96.1 264 66.7
1550-9 25.7 57.2 159 45.9 1560-9 29.5 64.5 184 50.9 1570-9 35.4 72.1 202 57.1 1580-9 41.9 82.7 236 63.9 1590-9 30.9 52.7 148 46.6 1600-9 44.9 76.9 218 63.7 1610-9 44.6 72.6 201 62.0 1620-9 48.6 73.3 206 64.7 1630-9 43.1 62.6 176 57.7 1640-9 49.5 69.4 195 63.8 1650-9 52.5 73.0 200 66.5 1660-9 52.4 74.5 200 67.3 1670-9 53.7 79.4 210 69.7 1680-9 57.1 85.1 225 73.6 1690-9 48.8 73.5 193 65.0 1700-9 56.9 83.8 220 73.1 1710-9 55.8 81.1 209 71.6 1720-9 58.2 84.7 213 74.1 1730-9 63.9 95.3 238 80.9 1740-9 62.7 89.1 221 78.1 1750-9 64.9 88.5 221 79.1 1760-9 62.5 85.0 200 76.5 1770-9 60.9 82.5 186 74.7 1780-9 61.8 83.3 173 75.5 1790-9 60.1 80.7 154 73.6 1800-9 58.2 77.9 135 71.3 1810-9 67.9 84.6 139 78.8 1820-9 82.1 92.9 144 89.1 1830-9 86.9 93.9 132 91.8 1840-9 93.0 96.6 118 95.7 1850-9 99.4 97.2 112 98.6 1860-9 100.0 100.0 100 100.0 1870-9 111.8 118.4 98 112.1 1880-9 123.8 136.0 96 123.2 1890-9 129.2 154.7 90 132.7 1900-9 124.1 155.0 77 130.8 1910-2 112.0 137.2 65 119.3
Source: See the text.
17
Figure 2: Net Output per Acre and per Male Farm Worker, Preferred Labor Estimates
Source: Table 5.
18
Table 6: Real Agricultural Output and Productivity - Alternative Labor Force
Assumptions, 1500-1799
Period
Real Output
(1860-9 = 100)
Real Output per
Male Farm Worker (1860-9 = 100)
Real Output per
Capita (1860-9 = 100)
Productivity
(1860-9 = 100)
1500-49 43.2 87.1 311 71.2 1550-9 30.6 52.8 188 49.2 1560-9 34.4 60.0 214 54.5 1570-9 41.5 66.4 237 60.7 1580-9 47.7 75.1 268 66.7 1590-9 36.3 48.8 174 49.3 1600-9 50.2 68.2 243 64.3 1610-9 50.3 63.5 227 62.2 1620-9 54.8 65.3 233 65.2 1630-9 48.6 55.8 199 58.1 1640-9 56.5 62.3 222 64.6 1650-9 61.1 65.1 232 67.6 1660-9 61.0 65.3 233 67.9 1670-9 63.3 69.4 248 70.7 1680-9 67.1 74.2 265 74.5 1690-9 57.4 63.6 227 65.6 1700-9 67.2 72.9 260 73.9 1710-9 66.2 69.5 248 72.0 1720-9 69.6 71.5 255 74.3 1730-9 74.3 83.1 277 81.6 1740-9 70.7 80.6 249 79.0 1750-9 69.3 82.7 236 78.9 1760-9 62.5 85.0 200 76.4 1770-9 60.9 82.5 186 74.6 1780-9 61.8 83.3 173 75.4 1790-9 60.1 80.7 154 73.5
Source: See the text.
19
Figure 3: Net Output per Acre and per Male Farm Worker, Alternative Assumptions
about Labor Force
Source: Table 6.
20
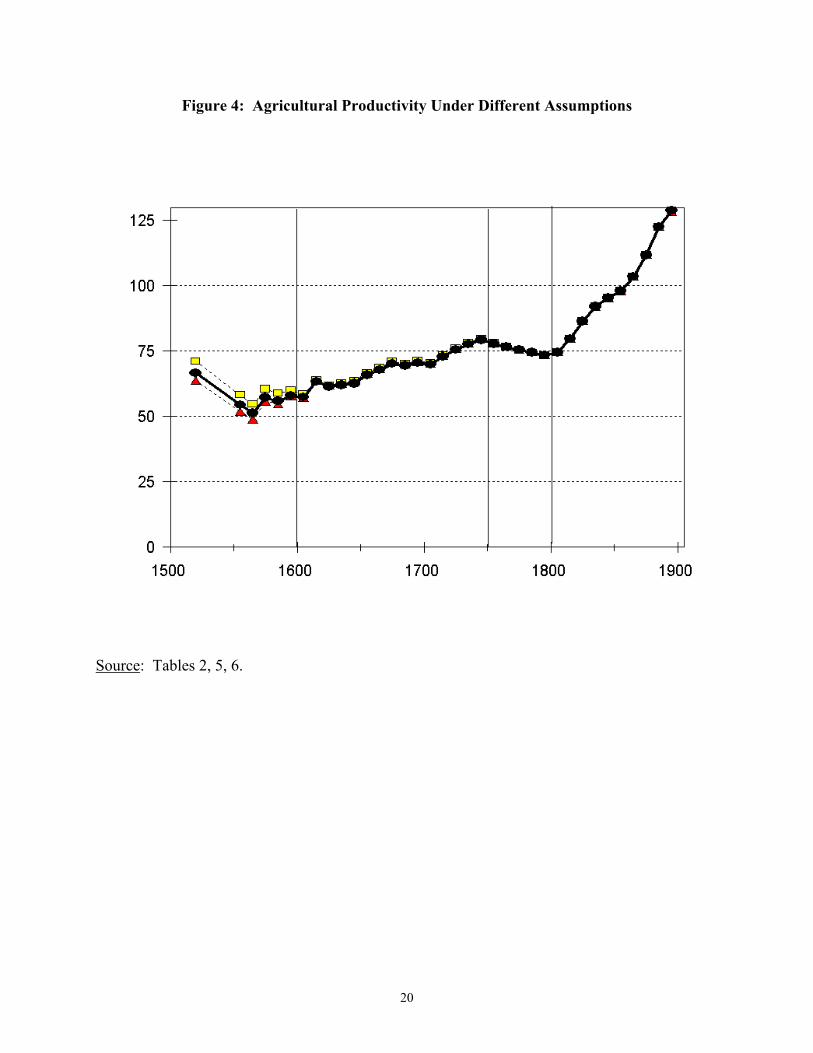
Figure 4: Agricultural Productivity Under Different Assumptions
Source: Tables 2, 5, 6.
21
than before because now also labor, which shows little rise in real costs, gets a larger weight in
earlier years in calculating productivity. Thus now estimated productivity in the years 1500-49
is 71% of the level in 1860-9, as opposed to 67% on the preferred estimate. Figure 4 shows the
estimated movement of productivity, calculated as a 30 year moving average, inferred by three
different methods: first assuming the share of different inputs in costs remained constant at the
1860s levels throughout, second that only 55% of workers in agriculture in 1500-49, and lastly
that 75% of workers were so employed. For most periods these assumptions make little
difference to calculated productivity. Productivity under the preferred labor share estimates in
general lies between productivity estimated by the other assumptions.
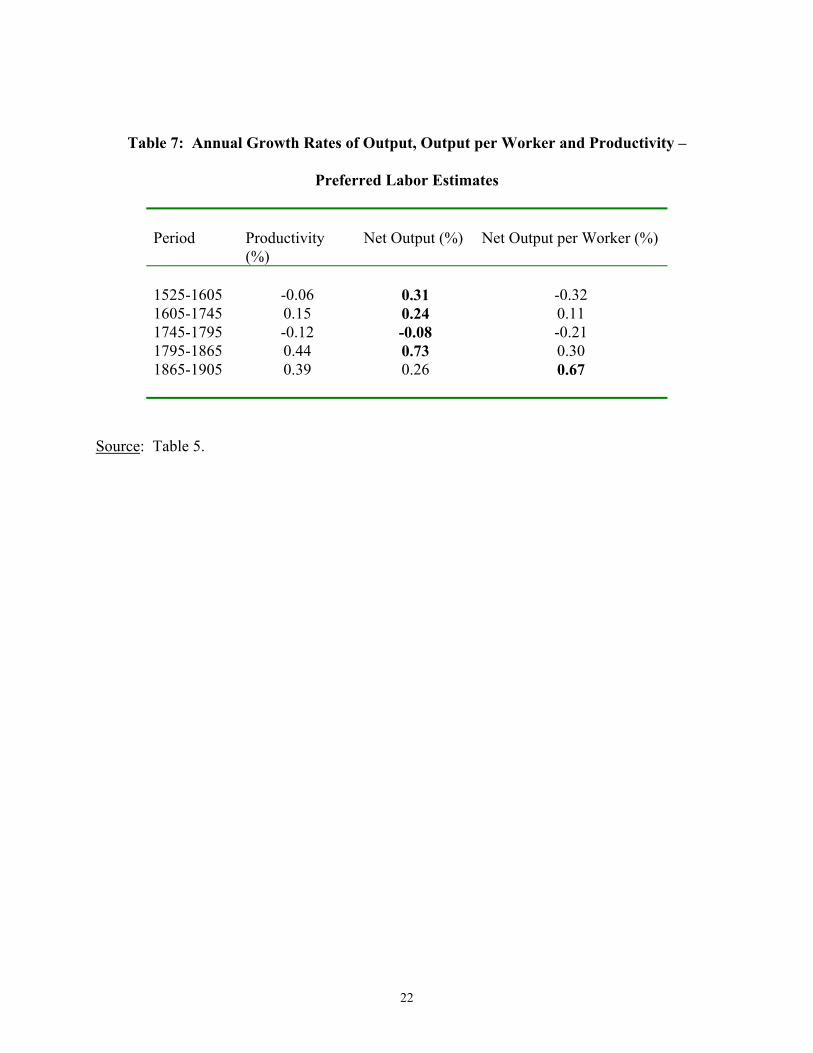
Figure 4 suggests that there are four distinct phases in productivity growth. The first, the
sixteenth century, is one of stagnant productivity levels. As table 7 shows it is estimated that
between 1525 and 1605 there a modest net decline in productivity.4 But this overall result
occurs at a time when labor productivity was falling quite significantly while land productivity
was rising. This, I think, was just the predicted economic response of farmers to rising land
values and declining labor costs created by population growth. There followed a long period of
very modest but steady productivity advance from 1600 to 1750. This seems to be mainly driven
by a growth in yields, since land productivity advances by more than twice as much as labor
productivity. By the 1750 average output per acre increased 40% from its 1600 level. There
follows a 50 year hiatus in productivity growth in the late eighteenth century where both yields
and labor productivity decline modestly. After 1800 there is slow but sustained productivity
growth, though by different primary means in the early and late nineteenth centuries.
4 The benchmark dates chosen for table 7 were those outside periods of rapid price inflation since if rents did not adjust immediately these would be associated with lower productivity levels.
22
Table 7: Annual Growth Rates of Output, Output per Worker and Productivity –
Preferred Labor Estimates
Period
Productivity (%)
Net Output (%)
Net Output per Worker (%)
1525-1605 -0.06 0.31 -0.32 1605-1745 0.15 0.24 0.11 1745-1795 -0.12 -0.08 -0.21 1795-1865 0.44 0.73 0.30 1865-1905 0.39 0.26 0.67
Source: Table 5.
23
Productivity rises mainly through yield growth before 1860. Labor productivity gains are more
important after 1860. Thus the agrarian history of England in the years 1500 to 1912 really falls
into two phases. In the first, 1500-1860, the primary driver of productivity growth in agriculture
is gains in yields. In the second phase, in the late nineteenth century, labor productivity gains
take over.
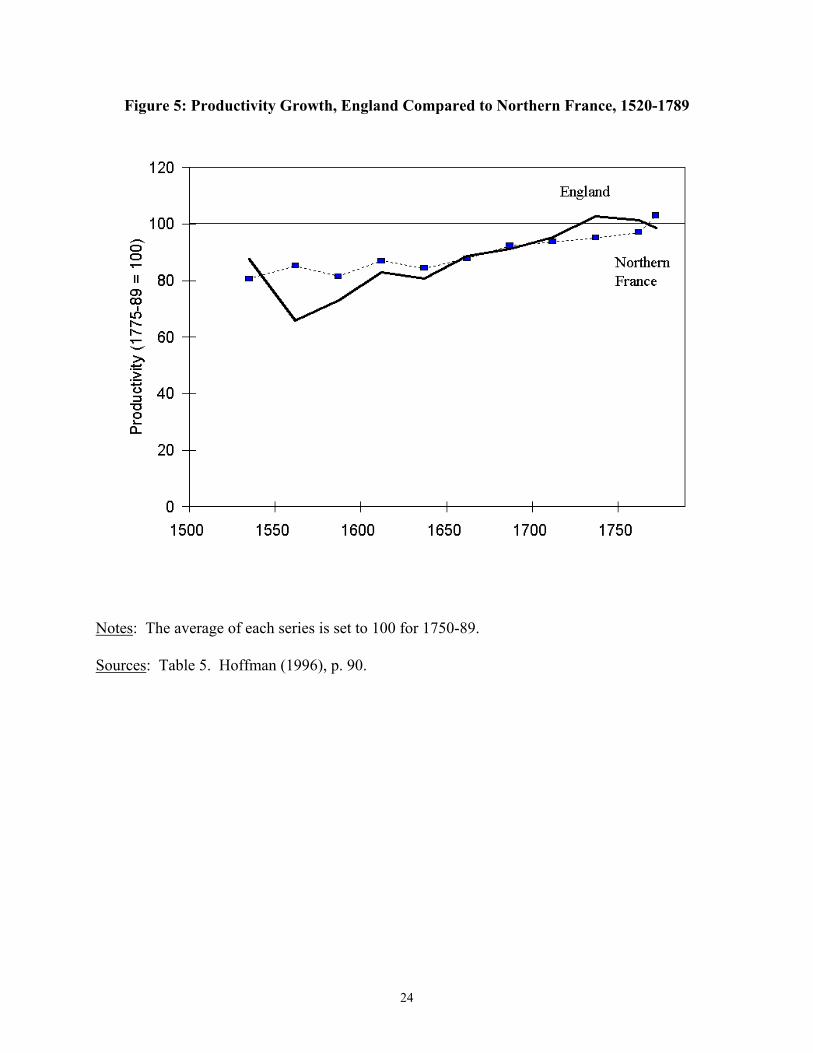
Philip Hoffman recently estimated total factor productivity in a similar way for a set of
farms in the Paris Basin for the years 1520-1789 (with a constant set of input and output
weights). Figure 5 shows the productivity movement on these farms compared to productivity
movement for England, for 25 year periods, where 1775-89 is set to 100 in each country.
Overall these farms in the Paris Basin show as much or more evidence of productivity growth in
the years 1520-1789 as does England. Thus the conventional picture that in the eighteenth
century France had a stagnating agricultural sector mired in the feudal past, while England had a
vibrant commercial agricultural sector forging ahead, simply does not appear in this productivity
comparison, at least when we compare Northern France to England. These two agricultural
regions were both achieving modest and incremental productivity gains before 1790. There is
nothing in the productivity series to suggest that after 1789 England would go on to triumph in
the world of industry and commerce, and France would lag. Indeed the 40 years immediately
before the French Revolution were characterized by relatively strong productivity growth in
France and if anything a decline of productivity in England.
24
Figure 5: Productivity Growth, England Compared to Northern France, 1520-1789
Notes: The average of each series is set to 100 for 1750-89.
Sources: Table 5. Hoffman (1996), p. 90.
25
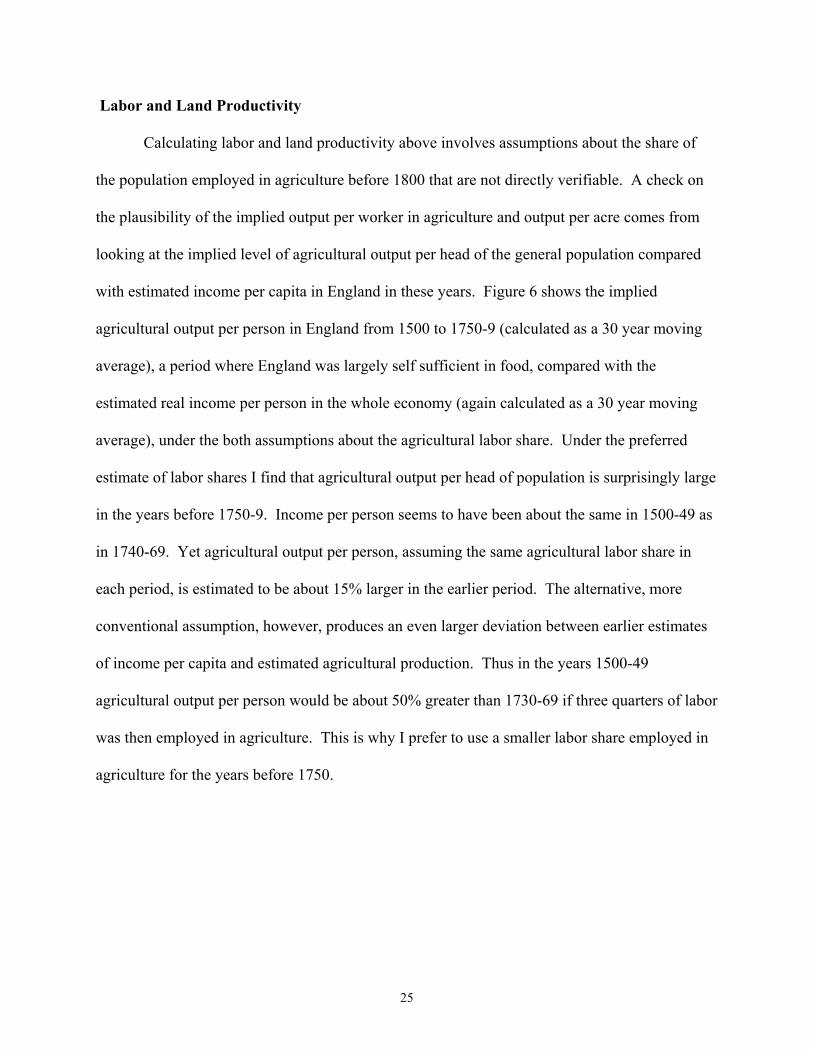
Labor and Land Productivity
Calculating labor and land productivity above involves assumptions about the share of
the population employed in agriculture before 1800 that are not directly verifiable. A check on
the plausibility of the implied output per worker in agriculture and output per acre comes from
looking at the implied level of agricultural output per head of the general population compared
with estimated income per capita in England in these years. Figure 6 shows the implied
agricultural output per person in England from 1500 to 1750-9 (calculated as a 30 year moving
average), a period where England was largely self sufficient in food, compared with the
estimated real income per person in the whole economy (again calculated as a 30 year moving
average), under the both assumptions about the agricultural labor share. Under the preferred
estimate of labor shares I find that agricultural output per head of population is surprisingly large
in the years before 1750-9. Income per person seems to have been about the same in 1500-49 as
in 1740-69. Yet agricultural output per person, assuming the same agricultural labor share in
each period, is estimated to be about 15% larger in the earlier period. The alternative, more
conventional assumption, however, produces an even larger deviation between earlier estimates
of income per capita and estimated agricultural production. Thus in the years 1500-49
agricultural output per person would be about 50% greater than 1730-69 if three quarters of labor
was then employed in agriculture. This is why I prefer to use a smaller labor share employed in
agriculture for the years before 1750.
26
Figure 6: Farm Output and GDP per head of the population under different assumptions
Source: Tables 5, 6. Clark (2001b).
27
Net Farm Output, Food Demands, and the Industrial Revolution
The real output series produced here shows much slower growth than the conventionally
accepted estimates of agricultural output growth for 1700-1869. Since these estimates underlie
Crafts’ calculation of output growth 1700-1860, if my revision is correct we need to substantially
reduce the role of agriculture in economic growth in the Industrial Revolution England. Indeed
we may need to reappraise the whole concept that the Industrial Revolution marked a significant
break in growth rates between the old and the new worlds (see Clark (2001b)). Figure 7 shows
my estimate of net farm output growth in England with 1700-9 set at 100. Also shown are the
farm output estimates of Crafts for England for 1700-1831, and of Deane and Cole for Britain for
1831-1861/71: the series that underpin the standard Crafts account of growth in Industrial
Revolution Britain. The estimates of Deane and Cole from 1831 on are derived in the same
manner as here from factor payments. But the price series they used to convert nominal farm
income into real farm output contained many imported agricultural items. These imported goods
– tea, coffee, sugar, tobacco, rum, cinnamon, olive oil, pepper and logwood – were subject to
very different price trends, and were also often heavily taxed in earlier years. Thus this price
series moves very differently from the prices of domestic farm output. The estimates of Crafts
for the years before 1831 are derived from consideration of the estimated consumption demand
of the population. Figure 7 also shows recent estimates from Bob Allen in 1994 and Mark
Overton in 1996 of farm output estimated from partial information on grain yields and animal
sizes and stocks. The Crafts/Deane and Cole estimates and those of Bob Allen and Mark
Overton from internal evidence on yields in agriculture correspond well. All of these estimates,
however, are quite inconsistent with the evidence of real farm output presented in this paper.
28
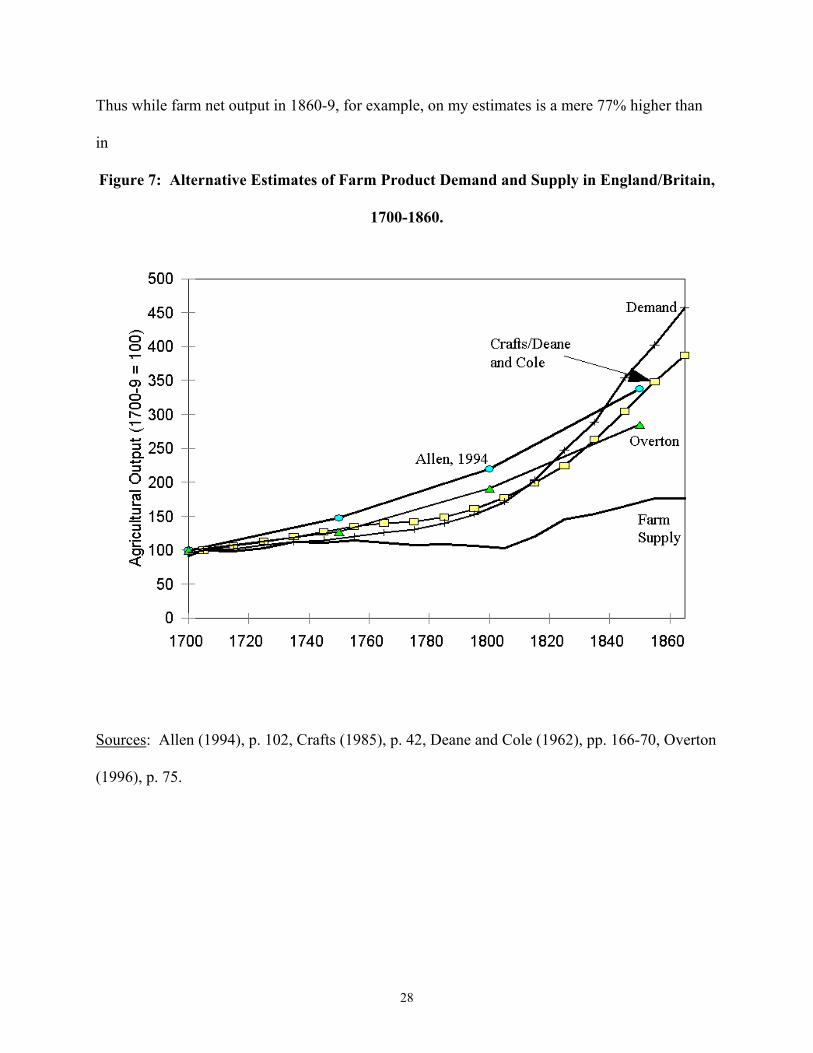
Thus while farm net output in 1860-9, for example, on my estimates is a mere 77% higher than
in
Figure 7: Alternative Estimates of Farm Product Demand and Supply in England/Britain,
1700-1860.
Sources: Allen (1994), p. 102, Crafts (1985), p. 42, Deane and Cole (1962), pp. 166-70, Overton
(1996), p. 75.
29
1700-9, on the Crafts/Deane and Cole account it is 286% higher. There is a similar mismatch for
output circa 1850. I show a gain to then of 70% from 1700-9, while Allen (1994) shows a gain
of 238%, and Overton shows a 185% gain.
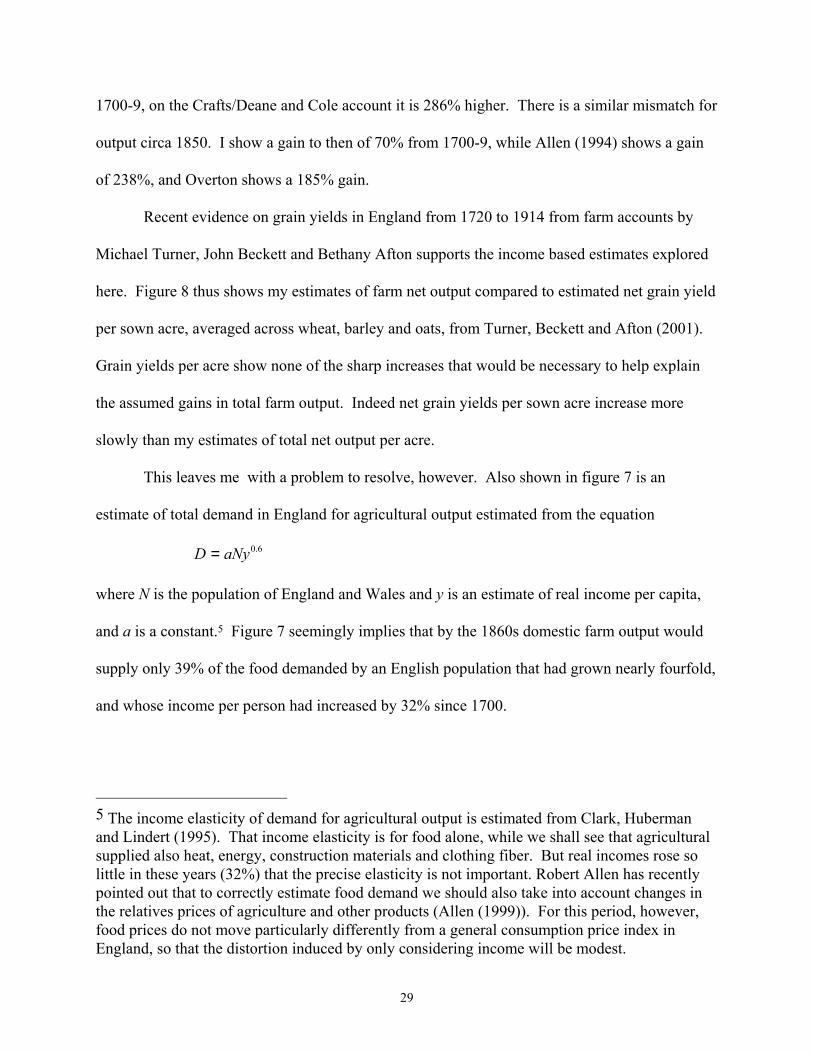
Recent evidence on grain yields in England from 1720 to 1914 from farm accounts by
Michael Turner, John Beckett and Bethany Afton supports the income based estimates explored
here. Figure 8 thus shows my estimates of farm net output compared to estimated net grain yield
per sown acre, averaged across wheat, barley and oats, from Turner, Beckett and Afton (2001).
Grain yields per acre show none of the sharp increases that would be necessary to help explain
the assumed gains in total farm output. Indeed net grain yields per sown acre increase more
slowly than my estimates of total net output per acre.
This leaves me with a problem to resolve, however. Also shown in figure 7 is an
estimate of total demand in England for agricultural output estimated from the equation
6.0aNyD =
where N is the population of England and Wales and y is an estimate of real income per capita,
and a is a constant.5 Figure 7 seemingly implies that by the 1860s domestic farm output would
supply only 39% of the food demanded by an English population that had grown nearly fourfold,
and whose income per person had increased by 32% since 1700.
5 The income elasticity of demand for agricultural output is estimated from Clark, Huberman and Lindert (1995). That income elasticity is for food alone, while we shall see that agricultural supplied also heat, energy, construction materials and clothing fiber. But real incomes rose so little in these years (32%) that the precise elasticity is not important. Robert Allen has recently pointed out that to correctly estimate food demand we should also take into account changes in the relatives prices of agriculture and other products (Allen (1999)). For this period, however, food prices do not move particularly differently from a general consumption price index in England, so that the distortion induced by only considering income will be modest.
30
Figure 8: Net Farm Output and Net Grain Yields per Sown Acre, 1720-1914
Note: Net grain yields per acre are set to 100 in 1860-9. They are derived from Turner et al.
(2001) up to the 1880s, thereafter from the official agricultural statistics, by assuming a sowing
rate of 2.5 bushels per acre for wheat, and 4 bushels per acre for barley and oats throughout.
Sources: Table 5. Turner et al. (2001). Mitchell (1988).
31
This mismatch between the food demands from the British population in the Industrial
Revolution period, and the evidence on food supply from domestic agriculture has already been
explored in Clark, Huberman and Lindert (1995). If the output series derived in this paper is to
be plausible then we have to bridge the gap between farm output in the lower curve and food
demand in the upper curve. The first important element is food imports. Unfortunately after
1830 we only have trade statistics for the United Kingdom, which incorporates also Scotland and
Ireland. Ireland was a net exporter of food to England after 1830. We thus have to make some
assumption about how food imports to the United Kingdom were allocated. What I assume here
is that Scotland and Ireland were on balance self-sufficient in food and raw materials, so that all
imports of these to the United Kingdom went to England and Wales. In the 1860s food imports
were on average £80 m. so that they were 70% of domestic net farm output. In 1700-9 food
imports were on balance £1.7 m. in 1860-9 prices (see table 8).6 But this still means that if we
assume that English agriculture in all years produced exclusively food, total food availability per
person in 1700-9 would have been £12.9 (in 1860s prices), compared to only £9.7 in 1860-9,
whereas based on rising real incomes we would expect consumption to be about £15.3 in 1860-9
given its earlier level.
Clark (1999a) suggests that this apparent puzzle is generated mainly by the mistaken
assumption that the output of English agriculture even before 1770 was almost entirely food for
human consumption. The assumption that English agriculture produced only food for humans is
close to true by the 1860s, when this was at least 90% of English agricultural output. But that
was possible in the 1860s and later because the demands of the population for heat, light,
building materials, clothing fiber, bedding fiber, dyestuffs, and transport were largely met either
6 There were exports of wheat and barley, but these were very modest relative to agricultural
32
by imports or through mined coal. In the pre-industrial period domestic agriculture could not
specialize on food production because it also had to supply all these other needs. Wood, turf and
furze was needed for fuel and construction, wool and flax were required for clothing, tallow was
needed for candles and soap, oats and hay were needed to feed horses for transport, and the
horses themselves also had to be provided.
Domestic agricultural production of energy, for example, was replaced almost entirely by
the coal industry by the 1860s. Thus coal used for domestic consumption is estimated for Britain
in 1700 at as low as 0.2 tons per capita (Hatcher (1983, pps. 68, 409)). By the 1860s coal
consumption per person in England and Wales was nearly 3.5 tons per year. Most of this was
not consumed for domestic heating, but coal consumption per capita for domestic purposes was
still at least 0.73 tons (Church (1983, p. 19) reports this figure for 1855). Even assuming an
income elasticity of demand for energy of one, this still implies consumers in 1700 would be
expected to consume at least the equivalent of 0.5 tons of coal per capita. Thus they would have
to consume the equivalent of 0.3 tons of coal in the form of wood and turf. This implies that
agriculture in 1700 should have been producing 2.3 million tons of firewood (dry weight), or
about 175 million cubic feet (Clark (2002b)). Wood was also used for fuel in brick making, iron
and steel, salt making and pottery making. Iron production in England in the early eighteenth
century was a very modest 17,000 tons annually. Yet each ton seems to have required about
1,800 cubic feet of wood. That implies that 30.6 million cubic feet of firewood per year. Thus
in total we expect the agricultural sector had to produce at least 200 million cubic feet of
firewood per year circa 1700. The average reported annual yield of coppiced wood in recent
years is 1.27 tons per acre
output, and were counterbalanced by imports of sugar, wine, coffee and tea.
33
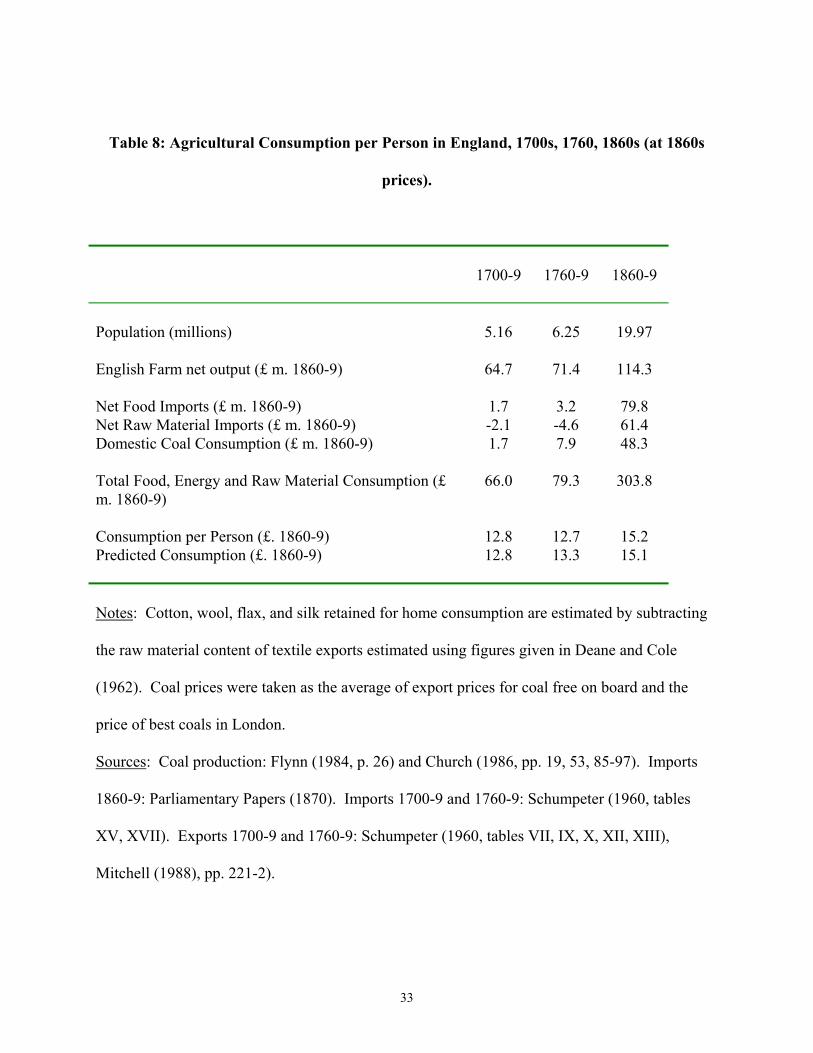
Table 8: Agricultural Consumption per Person in England, 1700s, 1760, 1860s (at 1860s
prices).
1700-9
1760-9
1860-9
Population (millions) 5.16 6.25 19.97 English Farm net output (£ m. 1860-9) 64.7 71.4 114.3 Net Food Imports (£ m. 1860-9) 1.7 3.2 79.8 Net Raw Material Imports (£ m. 1860-9) -2.1 -4.6 61.4 Domestic Coal Consumption (£ m. 1860-9) 1.7 7.9 48.3 Total Food, Energy and Raw Material Consumption (£ m. 1860-9)
66.0 79.3 303.8
Consumption per Person (£. 1860-9) 12.8 12.7 15.2 Predicted Consumption (£. 1860-9) 12.8 13.3 15.1
Notes: Cotton, wool, flax, and silk retained for home consumption are estimated by subtracting
the raw material content of textile exports estimated using figures given in Deane and Cole
(1962). Coal prices were taken as the average of export prices for coal free on board and the
price of best coals in London.
Sources: Coal production: Flynn (1984, p. 26) and Church (1986, pp. 19, 53, 85-97). Imports
1860-9: Parliamentary Papers (1870). Imports 1700-9 and 1760-9: Schumpeter (1960, tables
XV, XVII). Exports 1700-9 and 1760-9: Schumpeter (1960, tables VII, IX, X, XII, XIII),
Mitchell (1988), pp. 221-2).
34
of dried wood, or 92.5 cubic feet. To produce 200 million cubic feet of firewood annually
through coppices in 1700 would thus require 2.16 million acres of land devoted to firewood and
iron production.
The construction industry in the 1860s imported annually into England the equivalent of
6.9 cubic feet of timber per person.7 Again even assuming a high income elasticity of one the
average person in 1700 would consume nearly 5 cubic feet of construction timber, so that total
demand would be about 27 m. cubic feet. Given that imports in 1700-9 supplied only about the
equivalent of 1.5 m. cubic feet, that would imply an additional 1.75 million acres of woodland
(Clark (2002b)). Thus about 4 million acres of land must have been devoted to wood and fuel
production circa 1700, or 15 percent of the farmland area of England and Wales.
Table 8 shows estimated farm output per capita for 1700-9, 1760-9, and 1860-9 for
England in the prices of the 1860s. Also shown in 1860s prices are supplies of domestically
consumed coal, and imports of food and raw materials. Counting all of these sources of supply
of food, raw materials and energy, despite the decline in domestic farm output per person to
about half its level of the 1700s there is a nearly 20% increase in the supply of food, raw
materials and energy per capita. The rise in consumption per capita is about what we would
expect if the income elasticity of demand for food, raw materials and energy was about 0.6. As
noted the 0.6 figure comes from budget studies on food demand for working class families in the
1860s in England (see Clark, Huberman and Lindert (1995)). This elasticity may well be higher
once we include demand for energy and raw materials. On the other hand richer consumers had
7 Assuming that UK imports of timber were consumed in England, Ireland and Scotland according to population except that the Irish consumed half as much per head because of lower incomes.
35
a lower demand elasticity for food. But as was noted the elasticity assumption is not crucial here
since estimated income growth between 1760-9 and 1860-9 was so low.
An implication of the reconciliation here between food demand and farm net output is
that up to one third of English farm output in 1700-9 had to be horses, food for horses, firewood,
and raw materials.8 This implication is not at present directly testable, but farm accounts from
this period should show a larger share of income from sales of faggots, hay, oats, and timber if
the output series derived here for English agriculture is to be correct.
Another implication is that Crafts and Harley have underestimated agricultural output
circa 1700 and 1760 by about 54%. This in turn implies that they have underestimated national
income before the Industrial Revolution by about 25%. Thus their already modest growth rates
of output per capita between 1760 and 1860 of a mere .59% per year are too high. The true
figure could be an output growth of as little as 0.30% per year (see Crafts and Harley (1992)).
The Sources of Productivity Growth
Figure 2 suggests that productivity growth in the years 1500-1869 was driven mainly by
growth in output per acre, while productivity growth in the late nineteenth century was
dominated by growth in output per worker. 1860-9 in England marks the break between a pre-
mechanization era where labor productivity was largely stagnant because labor inputs on many
tasks such as threshing and harvesting were heavily dependent on outputs, and little influenced
by yields, and a mechanization era where labor productivity could rise even though yields
improved little. Thus already by 1700-49 labor productivity was at 86% of its level in 1860-9.
8 Indeed that is why in the price index for agricultural output in the years before 1775 wood, tallow, hay, and wool is given a weight of 0.18 in forming the price index (compared to a weight of 0.06 in 1860-9).
36
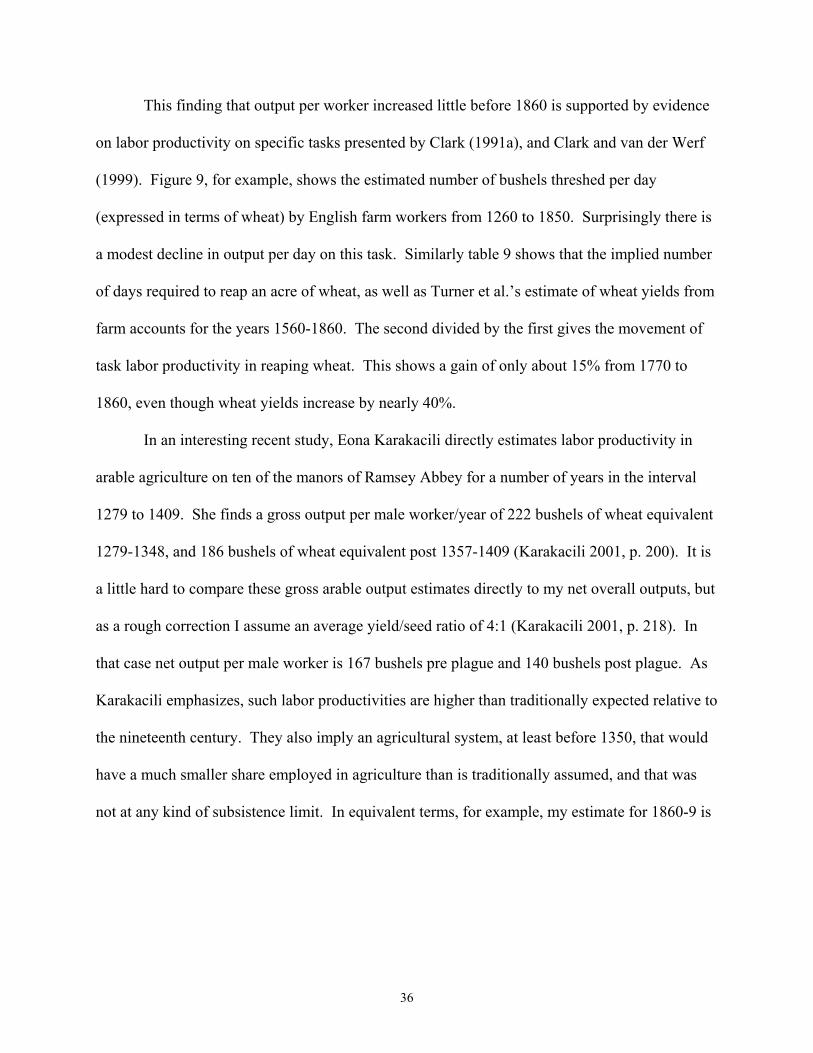
This finding that output per worker increased little before 1860 is supported by evidence
on labor productivity on specific tasks presented by Clark (1991a), and Clark and van der Werf
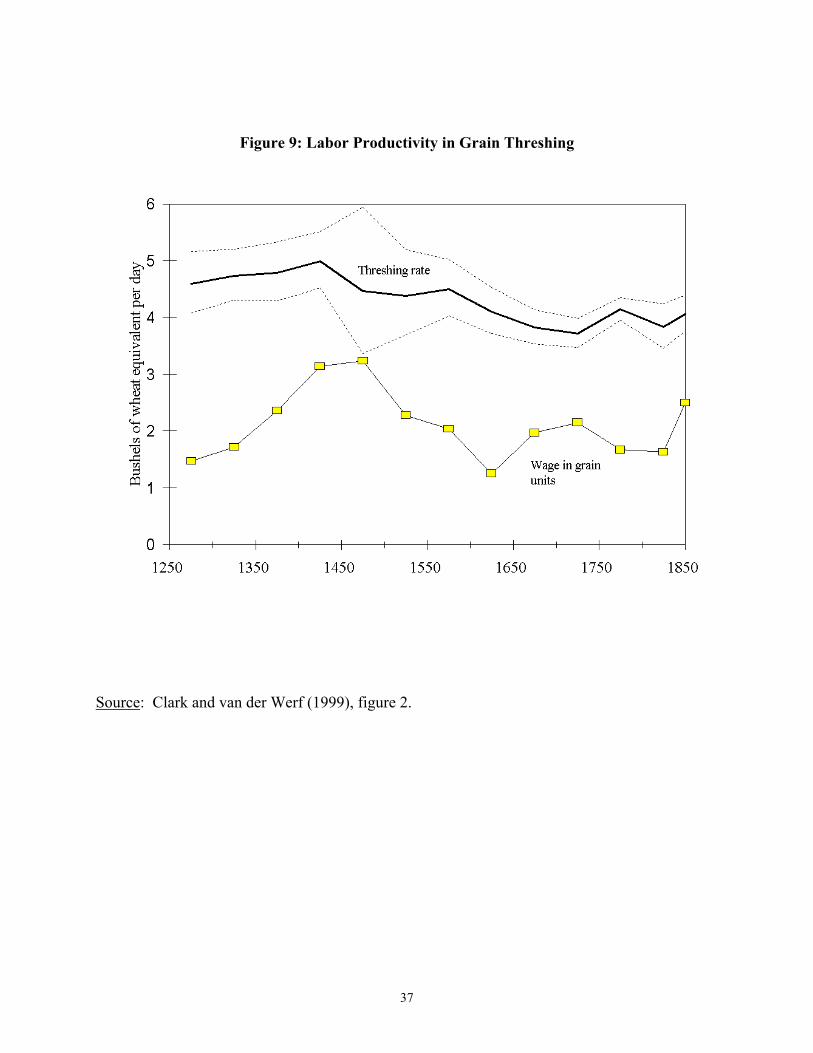
(1999). Figure 9, for example, shows the estimated number of bushels threshed per day
(expressed in terms of wheat) by English farm workers from 1260 to 1850. Surprisingly there is
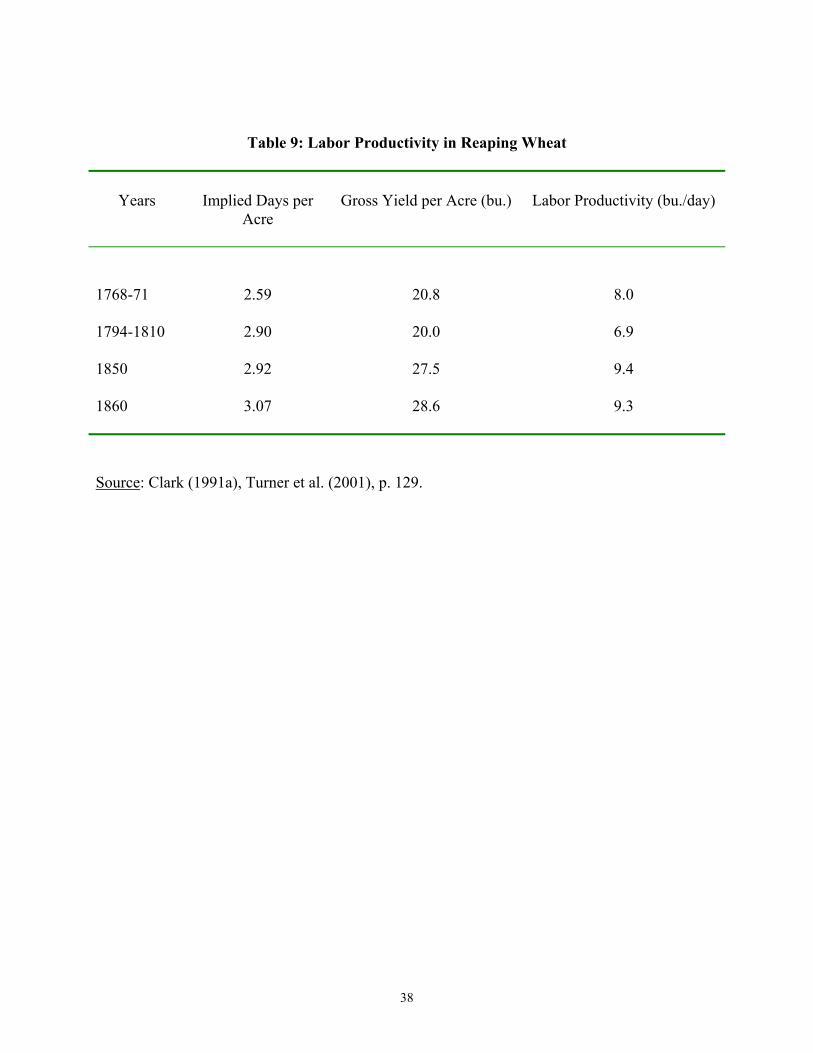
a modest decline in output per day on this task. Similarly table 9 shows that the implied number
of days required to reap an acre of wheat, as well as Turner et al.’s estimate of wheat yields from
farm accounts for the years 1560-1860. The second divided by the first gives the movement of
task labor productivity in reaping wheat. This shows a gain of only about 15% from 1770 to
1860, even though wheat yields increase by nearly 40%.
In an interesting recent study, Eona Karakacili directly estimates labor productivity in
arable agriculture on ten of the manors of Ramsey Abbey for a number of years in the interval
1279 to 1409. She finds a gross output per male worker/year of 222 bushels of wheat equivalent
1279-1348, and 186 bushels of wheat equivalent post 1357-1409 (Karakacili 2001, p. 200). It is
a little hard to compare these gross arable output estimates directly to my net overall outputs, but
as a rough correction I assume an average yield/seed ratio of 4:1 (Karakacili 2001, p. 218). In
that case net output per male worker is 167 bushels pre plague and 140 bushels post plague. As
Karakacili emphasizes, such labor productivities are higher than traditionally expected relative to
the nineteenth century. They also imply an agricultural system, at least before 1350, that would
have a much smaller share employed in agriculture than is traditionally assumed, and that was
not at any kind of subsistence limit. In equivalent terms, for example, my estimate for 1860-9 is
37
Figure 9: Labor Productivity in Grain Threshing
Source: Clark and van der Werf (1999), figure 2.
38
Table 9: Labor Productivity in Reaping Wheat
Years
Implied Days per
Acre
Gross Yield per Acre (bu.)
Labor Productivity (bu./day)
1768-71
2.59
20.8
8.0
1794-1810
2.90
20.0
6.9
1850
2.92
27.5
9.4
1860
3.07
28.6
9.3
Source: Clark (1991a), Turner et al. (2001), p. 129.
39
only 206 bushels per acre (at the relative prices of 1500-49). They thus support the story told
here for post 1500.9
The relative unimportance of labor productivity gains in the years 1500 to 1860 is
startling. For what is unusual about English agriculture compared to other European economies
in 1860 was precisely the very high labor productivity of England. Thus in the mid nineteenth
century output per acre in England was similar to output per acre in the Netherlands and
Belgium, and only about 20% greater than output per acre in France and Ireland. But output per
worker in England was double or more output per worker in all these other countries.10 In
particular output per worker in France is estimated at only 44% of its level in England in 1851.
But this implies real output per male worker in England in 1700-49 already far exceeded output
per worker in any other European economy in the 1850s. And even if 75% of the male labor
force was in agriculture in the years before 1680 real output per worker in England in 1500
would be greater than in France in 1850. English exceptionalism in agriculture thus stems, as far
as labor productivity is concerned, back to the middle ages.
9 There are some problems with these estimates, however, that suggest that while this is a promising innovation, these results must be treated cautiously. Because the estimates concentrate on the arable sector, to get true net outputs per worker we should deduct all fodder used for the work animals on the arable. Also the pre and post plague estimates are implicitly in conflict and suggest very different long run labor productivity trends. The drop in labor productivity after the Black Death contradicts basic economic reasoning so at least one of the estimates must be in error. No cultivator should adopt a technique on the arable post the plague that reduces both output per acre and per worker. If I compare the post plague estimates to 1500-49, the period most comparable in terms of the land-labor ratio and the real wage, I find a 50 percent labor productivity gain to 207 bushels per worker. But if I compare pre plague with the comparable period in terms of population 1600-49, there is no gain. So depending on whether I choose to believe the pre plague or post plague numbers I would get a very different impression about labor productivity trends. Only when this method is applied to other estates will we get an impression about whether it is robust to the vagaries of medieval estate accounting. 10 See Clark (1991), Wrigley (1985), Allen (1988)
40
High English labor productivity in 1850 compared to other Western European countries
has been taken to imply that there must have been substantial labor productivity growth in
England sometime before 1860-9. Indeed there is a long history, starting with Marx, that
emphasizes how in England the development of capitalist agriculture led to the expropriation of
the independent peasantry, and the creation of a landless rural proletariat that were easily moved
into the industrial sector. Thus there have been a series of articles recently estimating when
labor productivity in English agriculture rose and seeking to explain its causes. Wrigley (1985)
uses urbanization as a way to measure this (assuming constant food consumption per person) and
finds that labor productivity in England nearly doubled between 1500 and 1800. Allen (1988)
explores the role of larger British farm sizes in explaining this labor productivity growth and
finds that farm size growth predicts a more than doubling of labor productivity in the south
Midlands from 1600 to 1800. Patrick O’Brien concludes that “British families left the
countryside, partly in response to better opportunities in towns or abroad, but essentially because
the institutions of capitalist agriculture will not retain as much redundant labour” and that “the
institutions and culture of peasant agriculture in France operated to restrain the outflow of people
from countryside to towns and from agriculture to industry” (O’Brien (1996), p. 226, p. 228).
Allen recently in this journal applies a more sophisticated variant of Wrigley’s method over the
years 1300, 1400, 1500, 1600, 1700, 1750 and 1800 which takes into account changes in food
demand per capita also (Allen (2000)). This refined method still finds that labor productivity in
agriculture roughly doubles from 1600 to 1800, while French labor productivity hardly increases
at all, and that these were the years when the two economies diverged into a progressive England
and stagnant France.
41
My evidence on farm output estimated from factor payments suggests, however, that the
institutional changes in English agriculture between 1600 and 1800 – enclosure and the growth
of the wage labor force in the countryside - had little effect on labor productivity. If England
and France started out with the same agricultural labor productivity in 1600, and ended up with
England at more than twice the level of France, then France must have seen a substantial decline
in labor productivity over these years. Yet we see above that the evidence of Hoffman (1996)
suggests that overall productivity growth in agriculture was similar in England and northern
France in the years 1600 to 1789.
Further the observed gains in labor productivity between 1500 and 1860 may themselves
be explained mainly as a consequence of yield growth. As Clark (1991a) explores, a rise in
grain yields will itself lead to some increase in labor productivity. Indeed based on the estimates
presented there the yield gains from 1500 to 1860 would easily explain any labor productivity
gains. Even if these hypothetic calculations are incorrect it is clear that much of the observed
gain in labor productivity between 1500 and 1860 would have to be attributed to yield gains,
rather than to factors such as farm size, enclosure, or the creation of a landless rural proletariat.
Yield growth then seems to be the driving force in agricultural change between 1500 and
1860-9. The yields estimated per acre for 1500-39 are indeed low: the equivalent of 3.5 bushels
of wheat per acre as net output. Clark (1991b) estimates for southern England in 1300-49 from
manorial account records that net output per acre was the equivalent of 4.1 bushels per acre.
Thus there is no sign of any gain in yields in the 200 years from 1300 to 1500, and indeed signs
of some potential decline. Thereafter measured yields grow most rapidly in the late sixteenth
century and early nineteenth century with a long period of stasis in between. The cause of these
yield gains remains unclear.

42
Conclusion: The Agricultural Revolution
The concept of that an agricultural revolution, a counterpart to the Industrial Revolution,
occurred in Britain sometime in the years 1560 to 1850 has long been the crucial organizing
principle of English agrarian history. Thus at least eleven books have been written about English
agriculture in these years which include “agricultural revolution” in their title. Most of the
debate among agricultural historians has been about when in the long period 1560 to 1850 the
agricultural revolution occurred, with the years 1550-1650, 1650-1750, and 1750-1850 each
having their supporters.11
Yet if the rent and associated real output series derived above are correct it is not clear if
we can usefully think of developments in English agriculture in the years 1500 to 1869 as
representing any revolutionary change in technique. It is true that over these years English
agricultural output seems to have tripled, and the measured total factor productivity of the
system increased by about 50%. But this was achieved over a very long period with few abrupt
changes so that the rate of growth of productivity per years was on average 0.15%. This would
mean that even in any twenty year period farmers would be unable to discern, given the noise of
year to year fluctuations, that productivity was actually increasing.
Further the measured doubling of productivity between 1500-39 and 1860-9 certainly
overstates the true productivity gain, because it includes gains from more investment of capital
in farmland as part of pure productivity growth. For the productivity measurement should
property be done using only the site value of farmland. It implicitly assumes that each acre of
farmland was the same in 1860-9 as in 1500-49. All farmland, however, was a bundle of raw
43
land and various capital investments: housing, barns, fences, drainage, roads, soil amendments.
After 1600 land became much more valuable relative to labor, and the value of land relative to
labor continued to rise until 1800. If the cost of the capital invested in the land was
proportionate to labor costs this would mean that after 1600 landowners would have an enhanced
incentive to drain, reclaim, recycle animal waste, and build buildings. Thus, for example, about
10% of the rise in real rents from 1500-49 to 1860-9 was the result of common land being
enclosed. Hence enclosure explains about 4% of the measured productivity increase. But I
argue in Clark (1998b) that enclosure was mainly a capital investment induced by higher land
rents relative to wages, with very little associated productivity gain. If the various other
measures which resulted in higher land yields – increases in the pasture area, reduced fallow on
the arable, higher arable crop yields – resulted in part from investing more capital in the form of
maintaining increased stocks of organic matter in soil and returning more animal waste to the
soil, then again my productivity measure based on rents will mismeasure some of these gains
from intensified use of land as pure productivity gains.12 The only way we could test to see how
powerful these effects are would be to measure productivity using as a measure of land rents the
site value of agricultural land. But no such measure is available.
Thus the extent to which the “agricultural revolution” of the years 1500 to 1869 was a
revolution, in the sense of getting something for nothing through getting more output from the
same set of inputs, or was just an intensification in the use of land, getting more output by using
more inputs, is a matter still of conjecture.
11 See, for example, Overton (1996) and Allen (1999). Overton supports a later agricultural revolution, Allen an earlier one. 12 See Clark (1992).
44
References
Allen, Robert C. 1988b. “The Growth of Labor Productivity in Early Modern English Agriculture,” Explorations in Economic History, 25(2), 117-146. Allen, Robert C. 1992. Enclosure and the Yeoman. Oxford: Clarendon Press. Allen, Robert C. 1994. “Agriculture during the Industrial Revolution.” In Roderick Floud and Donald McCloskey, The Economic History of Britain since 1700, Vol. 1, 96-122. Allen, Robert C. 1999. “Tracking the Agricultural Revolution in England,” Economic History Review, 52 (2), May, 209-235. Allen, Robert C. 2000. “Economic Structure and Agricultural Productivity in Europe, 1300-1800.” European Review of Economic History, 4 (1), 1-26. Church, Roy. 1986. The History of the British Coal Industry. Vol. 3, 1830-1913. Oxford: Clarendon Press. Clark, Gregory. 1991a. “Estimating Crop Yields from Labour Inputs in English Agriculture” Economic History Review, 44 (3): 445-460. Clark, Gregory. 1991b. "Labour Productivity in English Agriculture, 1300-1860," in B.M.S. Campbell and Mark Overton, Agricultural Productivity in the European Past. Manchester: Manchester University Press, 211-235. Clark, Gregory. 1992. "The Economics of Exhaustion, the Postan Thesis, and the Agricultural Revolution," Journal of Economic History, 52, March: 61-84. Clark, Gregory. 1998a. “Commons Sense: Common Property Rights, Efficiency, and Institutional Change.” Journal of Economic History 58(1): 73-102. Clark, Gregory. 1998b. “Land Hunger: Land as a Commodity and as a Status Good in England, 1500-1914.” Explorations in Economic History 35(1): 59-82. Clark, Gregory. 1999a. “Too Much Revolution: Agriculture and the Industrial Revolution, 1700-1860” in Joel Mokyr (ed.), The British Industrial Revolution: An Economic Assessment. 2nd Edition. Boulder, Colorado: Westview Press. Clark, Gregory. 1999b. “The Long March of History: Farm Laborers’ Wages in England, 1208-1850” (University of California, Davis, http://www.econ.ucdavis.edu/faculty/gclark/). Clark, Gregory. 2001a. “Farm Wages and Living Standards in the Industrial Revolution: England, 1670-1869” Economic History Review.
45
Clark, Gregory. 2001b. “The Meaning of the Industrial Revolution” (University of California, Davis, http://www.econ.ucdavis.edu/faculty/gclark/). Clark, Gregory. 2002a. “Farmland Rental Values and Agrarian History: England and Wales, 1500-1912,” forthcoming in European Review of Economic History, 6(3) (December 2002). Clark, Gregory. 2002b. “The Price History of English Agriculture, 1500-1914.” (University of California, Davis, http://www.econ.ucdavis.edu/faculty/gclark/). Clark, Gregory, Michael Huberman and Peter Lindert. 1995. “A British Food Puzzle,” Economic History Review, 68 (May), 215-237. Crafts, Nick. 1985. British Economic Growth during the Industrial Revolution. Oxford: Clarendon Press. Crafts, N.F.R., and C. K. Harley. 1992. "Output Growth and the Industrial Revolution: A Restatement of the Crafts-Harley View." Economic History Review, 45:703-730. Deane, Phyllis and W. A. Cole. 1962. British Economic Growth, 1688-1959. Cambridge: Cambridge University Press. Flinn, Michael W. 1984. The History of the British Coal Industry. Vol. 2,1700-1830. Oxford. Clarendon Press. Grant, John. 1845. “A Few Remarks on the Large Hedges and Small Enclosures of Devonshire and the Adjoining Counties” Journal of the Agricultural Society of England, 5, 420-429. Hatcher, John. 1993. The History of the British Coal Industry, Vol. 1, Before 1700: Towards the Age of Coal. Oxford: Clarendon Press. Hoffman, Phillip. 1996. Growth in a Traditional Society: The French Countryside, 1450-1815. Princeton: Princeton University Press. Karakacili, Eona. 2001. “Peasants, Productivity and Profit in the Open Fields of England: A Study of Economic and Social Development.” Ph.D. Dissertation, University of Toronto. Lindert, Peter H. “English Occupations, 1670-1811.” Journal of Economic History, Vol. 40, No. 4. (Dec., 1980), pp. 685-712. Lindert, Peter H. and Jeffrey Williamson. 1982. “Revising England’s Social Tables, 1688-1812” Explorations in Economic History, 19: 385-408. Mitchell, B. R. 1988. British Historical Statistics. Cambridge: Cambridge University Press. O’Brien, Karl Patrick. 1996. “Path Dependency, or Why Britain Became an Industrialized and Urbanized Economy Long Before France.” Economic History Review, 49 (2), 213-248.
46
Overton, Mark. 1996. Agricultural Revolution in England: The Transformation of the Agrarian Economy 1500-1850. Cambridge: Cambridge University Press. Parliamentary Papers. 1852-3a. Number of Inhabitants, 1801-51. Volume 1 with Census Report. Vol. LXXXV. Parliamentary Papers. 1852-3b. Number of Inhabitants, 1801-51. Volume 2. Vol. LXXXVI. Parliamentary Papers. 1870. Statistical Abstract of the United Kingdon, 1855-1869. Vol. LXVIII, p. 85. Parliamentary Papers. 1888. Agricultural Returns of Great Britain. Vol. CVI. Parliamentary Papers. 1896. Royal Commission on Agriculture. Particulars of the Expenditures and Outgoings on Certain Estates in Great Britain and Farm Accounts. Vol. XVI. Schumpeter, Elizabeth. 1960. English Overseas Trade Statistics, 1697-1808. Oxford: Oxford University Press. Squarey, Elias P. 1878. “Farm Capital” Journal of the Royal Agricultural Society of England, Second Series, 14, 425-444. Stamp, Josiah. 1920. British Incomes and Property. London: King and Son. Tomson, James. 1847. “Account of Hall Farm, near Sevenoaks, Kent.” Journal of the Royal Agricultural Society of England, 8, 33-46. Turner, Michael E., J. V. Beckett and B. Afton. 2001. Farm Production in England, 1700-1914. Cambridge: Cambridge University Press. Wratislaw, Charles. 1861. “The Amount of Capital Required for the Profitable Operation of a Mixed Arable and Pasture Farm in a Midland County.” Journal of the Royal Agricultural Society of England, Second Series, 14, 425-444. Wrigley, E. A. 1985. “Urban Growth and Agricultural Change: England and the Continent in the Early Modern Period,” Journal of Interdisciplinary History, 15, 683-728. Wrigley, E. A. 1988. Continuity, Chance and Change. Cambridge: Cambridge University Press. Wrigley, E. A., R. S. Davies, J. E. Oeppen, and R. S. Schofield. 1997. English Population History from Family Reconstitution, 1580-1837. Cambridge: Cambridge University Press. Young, Arthur. 1770. A Six Months Tour through the North of England. London: W. Strahan.