The achievement gap and students living in poverty: The ...
108
James Madison University JMU Scholarly Commons Dissertations e Graduate School Spring 2016 e achievement gap and students living in poverty: e role of core self-evaluation and transformational leadership in teachers India Harris James Madison University Follow this and additional works at: hps://commons.lib.jmu.edu/diss201019 Part of the Child Psychology Commons , Cognition and Perception Commons , Curriculum and Instruction Commons , Curriculum and Social Inquiry Commons , Developmental Psychology Commons , Educational Assessment, Evaluation, and Research Commons , Educational Leadership Commons , Educational Methods Commons , Educational Psychology Commons , Educational Sociology Commons , Elementary and Middle and Secondary Education Administration Commons , Elementary Education and Teaching Commons , Junior High, Intermediate, Middle School Education and Teaching Commons , Leadership Studies Commons , Personality and Social Contexts Commons , and the Social Psychology Commons is Dissertation is brought to you for free and open access by the e Graduate School at JMU Scholarly Commons. It has been accepted for inclusion in Dissertations by an authorized administrator of JMU Scholarly Commons. For more information, please contact [email protected]. Recommended Citation Harris, India, "e achievement gap and students living in poverty: e role of core self-evaluation and transformational leadership in teachers" (2016). Dissertations. 101. hps://commons.lib.jmu.edu/diss201019/101
Transcript of The achievement gap and students living in poverty: The ...

James Madison UniversityJMU Scholarly Commons
Dissertations The Graduate School
Spring 2016
The achievement gap and students living inpoverty: The role of core self-evaluation andtransformational leadership in teachersIndia HarrisJames Madison University
Follow this and additional works at: https://commons.lib.jmu.edu/diss201019Part of the Child Psychology Commons, Cognition and Perception Commons, Curriculum and
Instruction Commons, Curriculum and Social Inquiry Commons, Developmental PsychologyCommons, Educational Assessment, Evaluation, and Research Commons, Educational LeadershipCommons, Educational Methods Commons, Educational Psychology Commons, EducationalSociology Commons, Elementary and Middle and Secondary Education Administration Commons,Elementary Education and Teaching Commons, Junior High, Intermediate, Middle SchoolEducation and Teaching Commons, Leadership Studies Commons, Personality and Social ContextsCommons, and the Social Psychology Commons
This Dissertation is brought to you for free and open access by the The Graduate School at JMU Scholarly Commons. It has been accepted for inclusionin Dissertations by an authorized administrator of JMU Scholarly Commons. For more information, please contact [email protected].
Recommended CitationHarris, India, "The achievement gap and students living in poverty: The role of core self-evaluation and transformational leadership inteachers" (2016). Dissertations. 101.https://commons.lib.jmu.edu/diss201019/101

The Achievement Gap and Students Living in Poverty: The Role of Core Self-Evaluation
and Transformational Leadership in Teachers
India M. Harris
A dissertation submitted to the Graduate Faculty of
JAMES MADISON UNIVERSITY
In
Partial Fulfillment of the Requirements
for the degree of
Doctor of Philosophy
Strategic Leadership Studies
May 2016
FACULTY COMMITTEE:
Committee Chair: Dr. Karen Ford
Committee Members:
Dr. Adam Vanhove
Dr. Robin Crowder
Dr. John Almadrode

ii
Dedication
This work is dedicated to my fabulous parents, Russ and Janet Parrish, my
supportive husband and best friend, Jon, and my four remarkable children, Lena, Alton,
Romney, and Janet.
iii
Acknowledgements
I thank the incredible James Madison University faculty, with whom I have had
the pleasure to learn. Special thanks go to: Dr. Karen Ford for being supportive,
demanding, and making me laugh all at the same time; Dr. Eric Stark for introducing me
to core self-evaluation and providing me with an annotated bibliography of research
articles; Dr. Adam Vanhove for his high-expectations and expertise in methods and data
analysis; Dr. John Almarode for being my “go-to” K-12 expert and professional advisor;
and Dr. Robin Crowder for my internship experience and for being my moral support,
mentor, and advocate.
iv
Table of Contents
Dedication…………………………………………………………………………………ii
Acknowledgments ……………………………………………………………...………..iii
List of Tables ………………………………………………………...…………………vii
List of Figures ……………………………………………………………...…………..viii
Abstract…………………………………………………..……………………………....ix
Chapter 1: Introduction……………………………………………………….….……….1
The Power of Teachers…………………………………………………….……..3
Teachers as Leaders……………………………………………………………....5
Theoretical Framework……………………………………………………………6
Social cognitive learning theory……………………………………….....6
Transformational leadership theory……………………………………....8
Summary of the Issue………………………………………………………….…10
Importance……………………………………………………………………….10
Purpose of Study…………………………………………………………………11
Chapter 2: Literature Review…………………………………………………………….12
Leadership………………………………………………………………………..12
Transformational Leadership…………………………………………………….15
Children Living in Poverty………………………………………………...…….19
Teachers of Students Living in Poverty…………………………………….…...21
Core Self-Evaluation………………………………………………………….…23
Summary………………………………………………………………………....27

v
Hypotheses……………………………………………………………………….29
Chapter 3: Methodology…………………………………………………………………32
Study Type and Subjects…………………………………………………………32
Measurements…………………………………………………………………....33
Prior academic achievement…………………………………………..…33
Academic achievement…………………………………………………..35
Demographic measures…………………………………………………..35
Core self-evaluation…………………………………………………...…35
Teacher leadership behaviors…………………………………………….37
Data Analysis…………………………………………………………………….40
Ethical Considerations…………………………………………………………...43
Strengths and Weaknesses……………………………………………………….44
Chapter 4: Analysis…………………………………………………………………...….46
Phase 1: Children’s Core Self-Evaluation Scale Analysis……………………….46
Phase 2: Multivariate Analysis of Variance Analyses…………………………...52
Analysis of between group differences………………………………...53
Analyses of within group differences……………………………...…..54
Phase 3: Testing the Hypothesized Relationships………………………...……..55
A bootstrapping resampling regression analysis………………………...57
Follow-up regression analysis……………………………………………60
Discussion………………………………………………………………………..61
Chapter 5: Conclusions……………………………………………………………..……64
Implications………………………………………………………………………66

vi
Future Research………………………………………………………………….67
Appendix A: Administrator Consent to Participate in Research………………………...70
Appendix B: Teacher Consent to Participate in Research……………………….………72
Appendix C: Parent/Guardian Informed Consent……………………………………..…74
Appendix D: Student Assent Form………………………………………………………77
Appendix E: The Children’s Core Self-Evaluation Scale………………………………..78
Appendix F: Teacher Categories Vignettes……………………………………………...82
Appendix G: The Children’s Core Self-Evaluations Scale (Revised)……………...……83
References…………………………………………………………………………….….86

vii
List of Tables
Table 1 CCSES Readability Levels……………………………………………………...47
Table 2 Inter-item Correlation Matrix for 12-item CCSES……………………………...49
Table 3 Total-Item Correlations for 12-item CCSES………………………………...….49
Table 4 Factor Loadings for 12-item CCSES………………………………………..…..51
Table 5 Descriptive Statistics for Variables..…………………………………………….55
Table 6 Bivariate Correlations between Variables………………………………………56
Table 7 Descriptive Statistics on Reading Achievement and CSE By Condition……….56
Table 8 Multiple Regression Coefficients and Semi-Partial Squared Correlations…...…60

viii
List of Figures
Figure 1 The Core Self-Evaluation Cycle………………………………………..…........26
Figure 2 Diagram of Hypotheses………………………………………………………...31
Figure 3 Diagram of Moderated Mediation Model………………………………………59
Figure 4 Interaction Between Teacher Leadership Behavior and Poverty…………...….59
Figure 5 Interaction Between CSE and Teacher Leadership Behavior …………………61
ix
Abstract
Research has shown that the combination of locus of control, self-efficacy, self-
confidence, and emotional stability is a good predictor of life success. Until now, this
second order factor, called core self-evaluations (CSE) has only been studied in adults.
Findings from this study, showed levels of CSE were significantly and positively
connected with academic achievement for middle and elementary aged students. CSE
appears to play to a similar role between students and academic achievement as it plays
with adults and job performance. In this study, the dimensions of transformational
leadership were applied to teacher behaviors and students were grouped based on their
teachers’ leadership behavior. Reading achievement and core self-evaluation (CSE) were
then examined across student groups. Findings indicated students living in poverty and
students with low CSE performed better on reading achievement tests when a teacher,
who exhibited transformational leadership behavior, taught them. This study establishes
transformational leadership in teachers has the potential to offset the effects of poverty
and negative self-views on performance. Results also add new information to our
existing knowledge about student performance indicators, the student/teacher
relationship, and the link between expectations and performance. The results of this
study have powerful implications for evidence-based teacher training and preparation
programs, hiring practices, and future research.

Running Head: THE ACHIEVEMENT GAP AND STUDENTS LIVING IN POVERTY 1
Chapter 1 Introduction
The Massachusetts Bay Colony initiated mandatory public education in the
United States to ensure the community’s social values, norms, and work ethic were
instilled in its children. Fear that parents were not managing this essential task properly,
and were thus causing a threat to the morality and economic well-being of the
community, sparked this first law in 1652 (Katz, 1976). Two hundred years later in
Massachusetts, this rationale continued to drive compulsory public education forward.
With the massive influx of immigrants and the growth of cities, the demand for public
education to ensure productive workers, law-abiding citizens, and economic contributors
escalated the need for universal education (Katz, 1976). As a result, mandatory public
education was reintroduced into law in Massachusetts in 1852. New York quickly
followed in 1853, and by 1918, all children in the United States were required to attend
elementary school (Watson, 2008).
Racial segregation and equal access became major issues for public education
during the 20th century. In 1954, Brown v. Board of Education ended segregation of
public schools, but equal access to quality education continues to be a major issue for
minorities and children living in poverty (Bollinger, 2014). As part of his War on
Poverty, President Lyndon B. Johnson recognized receiving a high quality education as
an essential component of breaking the cycle of poverty for low-income students (Kilty,
2015). Despite these efforts to ensure equality in education for all students, 40% of black
and Hispanic students currently attend schools where less than 10% of the population is
white (Bollinger, 2014). Today, this segregation is a bi-product of residency and socio-
THE ACHIEVEMENT GAP AND STUDENTS LIVING IN POVERTY 2
economics rather than educational policy or design (Semuels, 2014). Regardless of the
reason, the problem is getting worse. For example, “in 1988, there were two thousand
seven hundred and sixty-two schools in America with white populations of less than one
percent; today there are six thousand seven hundred and twenty-seven” (Bollinger, 2014).
Three hundred and sixty-three years plus after its inception, the United States
continues to struggle with successful public education for all students. Our education
system is not producing the needed workforce and as a result, many corporations are
seeking workers, but cannot find qualified candidates (Wise, 2010). Many students are
becoming disengaged and unmotivated. They no longer buy into the belief that success
in school is the key to continuing education opportunities and eventual economic
prosperity (Rumberger, 2013). Almost 30% of students do not graduate from high school
and this group has little prospect of finding employment that sustains them above the
poverty rate (Ladner, LeFevre, & Lips, 2010, p. 4). The students with the greatest need
are fairing far worse. Money (2014) explains teachers’ expectations for their students are
more predictive of success than student motivation, but teachers typically have lower
expectations for students living in poverty. In 2009, a student living in poverty was more
than fives times as likely to drop out of high school than a student from a more affluent
background (Rumberger, 2013).
Breaking the cycle of poverty is not easy. Berkman states, “A child born in the
bottom fifth of the income distribution has less than a one in ten chance of moving to the
top fifth, and even the brightest poor children are still less likely to complete college than
average wealthy children” (2015, p. 1). These students are also often isolated from their

THE ACHIEVEMENT GAP AND STUDENTS LIVING IN POVERTY 3
more affluent peers and they see little hope of changing their future. Students living in
poverty are more than six times more likely to attend high poverty schools than students
not from poverty (Boser, 2015). Semuels (2014) posits, “Without access to high-quality
education, kids born into poverty are likely to remain there their whole lives” (p.1). The
repercussions for these at-risk children and our society will be significant if these issues
continue. Research shows that persons with limited education earn less money in their
lifetimes, have shorter life expectancy, and are at increased risk for incarceration. They
are also less able to make significant economic impact as consumers (Reardon,Yun, &
Kurlaender, 2006). The results will be all of those issues our predecessors tried to
eliminate; increased crime, poverty, segregation, and need for support services (Ladner et
al., 2010). The question of how to avoid these eventualities remains and our society
again focuses on our public education system to find solutions.
The Power of Teachers
Schools cannot control many individual variables, like socio-economic status and
family dynamics, which influence student performance. Research has shown, at an
organizational level, the teacher is the dominant factor that schools can directly influence
(Nye, Konstantopoulos & Hedges, 2004; Weisberg, Sexton, Mulhern, & Keeling, 2009).
Finding ways to accurately measure the effect directly attributable to teachers has been
challenging. Educational research has examined the value added link between teacher
effectiveness and student performance (Stronge, Ward, Tucker, & Hindman, 2007). A
1994 study using multi-year data indicated that when third grade students were
consecutively placed with three high performing teachers, their scores averaged at the

THE ACHIEVEMENT GAP AND STUDENTS LIVING IN POVERTY 4
96th percentile on Tennessee’s fifth grade math assessment. Placing students with three
low performing teachers in a row resulted in their scores averaging in the 44th percentile
on the same fifth grade math test. These findings indicate a 52 percentile point difference
in math performance between students placed with highly effective teachers and those
placed with less effective instructors (Sanders & Horn, 1994). Similar findings for
reading performance have also been established. Wright, Horn, and Sanders (1997)
found students with highly effective teachers showed reading achievement gains a third
of a standard deviation above students placed with less effective teachers.
Wright et al., (1997) concluded that “effective teachers appear to be effective with
students of all achievement levels, regardless of the level of heterogeneity in the their
classrooms” (p. 63). Their research also concluded that low achieving students are more
likely to be placed with less effective teachers than high achieving students. Popp, Grant,
and Stronge (2011) also state that students living in poverty “do not have access to
teachers of the same caliber as students from higher income” (p. 277). Recent research
has also focused on identifying the factors that influence teacher performance. Stronge et
al., (2007) propose there are four dimensions that differentiate teacher effectiveness:
instruction, student assessment, learning environment, and personal qualities.
Educational researchers have also conducted meta-analyses to better understand
the effect sizes of various instructional strategies utilized by high-effect teachers (Hattie,
2009; Marzono, Pikering, & Pollock, 2001). This research supports the notion that
teachers matter a great deal when it comes to student success. Ensuring high-quality
teachers are present in all classrooms is critical for maximizing successful outcomes for
all students.

THE ACHIEVEMENT GAP AND STUDENTS LIVING IN POVERTY 5
To date, research has primarily examined the qualities of effective teachers, on a
broad spectrum. Popp et al., (2011) state, “Little evidence has been assimilated
regarding the qualities of effective teachers of at-risk students” (p. 275). At-risk students
also have unique affective, academic, and technical needs; so developing a better
understanding of a highly effective teacher within this context is critical (Popp et al.,
2011). These students also need the most support to ensure success in school so
understanding what teacher behaviors support their needs is important. Improving our
current understanding about what types of teacher behaviors impact at-risk students and
determining if these behaviors impact all students in the same way is one area of focus
for this research.
Teachers as Leaders
Teachers are leaders of students within classrooms; yet examining the relationship
between teachers and students within the framework of leadership is relatively new to
research. Reeves (2008) states, “Names we know – Diderot, Kant, and Locke from
Europe – and teachers whose identity can be only inferred from archeological records
from Africa, Asia, and South America, all testify to the truth that teaching and leadership
are inseparable qualities”. Applying multiple lenses to better understand effective
teaching makes sense given the increasing concerns about our education system in the
United States. Within organizational theory, the role of leadership has been well
established (Judge, Woolf, Hurst, & Livingston, 2008). A number of researchers have
maintained organizational leadership theories can be applied within the context of the
classroom, but establishing the justification for this assertion is important (Bosler &

THE ACHIEVEMENT GAP AND STUDENTS LIVING IN POVERTY 6
Bauman, 1992; Cheng 1994; Boyd, 2009; Harris, 2005; Harrison, 2011; Reeves, 2008).
Teacher leadership and organizational leadership are not mirror images of one another,
but there are many parallels between the two roles (Kuchinke, 1999).
Day and Antonakis (2012) define leadership as “an influencing process-and its
resultant outcomes-that occurs between a leader and followers and how this influencing
process is explained by the leader’s dispositional characteristics and behaviors, follower
perceptions and attributions of the leader, and the context for which the influencing
process occurs” (p. 6). Similarly the relationship between teacher and student can be
described as an influencing process- and its resulting outcomes- explained by the
teacher’s characteristics and behaviors, student perceptions and attributions of the
teacher, and the school in which the interaction occurs. Antonakis, House, Roswold, and
Borgmann (2012) also state that leaders need to examine internal and external
environments, devise strategies based on strengths and weaknesses, and monitor
outcomes to ensure goals are met (as cited in Day & Antonakis, 2012, p. 6). Teachers
are expected to fulfill similar duties within the context of classrooms and schools.
Teachers influence students, shape their development, focus them on tasks, and facilitate
learning much like organizational leaders influence followers, focus attention, initiate and
provide direction, and design activities toward a goal (House & Posakoff, 1994).
Theoretical Framework
Social cognitive learning theory. Social Cognitive Learning Theory is an
important context to consider this research within. Albert Bandura (1989) maintained
that humans are active processers of information and respond to their environment based

THE ACHIEVEMENT GAP AND STUDENTS LIVING IN POVERTY 7
on their experiences and the conclusions they draw internally. Individuals observe and
participate in social interactions throughout their lifetimes and they develop as
individuals based on both these observations and their own interactions. Individuals who
are observed are models of behaviors that will be imitated or avoided depending on the
conclusions the observer makes. Many factors can influence if the behavior will be
imitated. If the observer views the model as being similar to him/herself, the behavior is
more likely to be imitated. The relationship between the model and the observer also
greatly influences if imitation will occur, as do the perceived consequences for the
behavior (Bandura, 1989).
Bandura (1989) proposed that behavior is not a product of unidirectional
causation; it is instead influenced by cognition, environmental factors, and personal
factors. The strength and timing of each influencer is also varied. Self-development
occurs through this process. Each child is greatly influenced by those persons closest to
him/her. The interactions, observation, and feedback of these individuals shape the
child’s view of him/herself. Personal factors also play a role in how self-development
occurs. A child’s personal and observed experiences with success and failure set the
stage for how competent a child believes him/herself to be. This sense of competency
impacts an individual’s motivation. Bandura (1989) states, “Perceived self- efficacy is
another cognitive factor that plays an influential role in the exercise of personal control
over motivation. Whether negative discrepancies between internal standards and
attainments are motivating or discouraging is partly determined by people's beliefs that
they can attain the goals they set for themselves. Those who harbor self-doubts about
their capabilities are easily dissuaded by failure. Those who are assured of their

THE ACHIEVEMENT GAP AND STUDENTS LIVING IN POVERTY 8
capabilities intensify their efforts when they fail to achieve what they seek and they
persist until they succeed” (p.47-48).
Eccles (1999) states, “Skills of self-awareness develop in middle childhood,
which spans from age 6 to 14” (p.33). She describes children entering middle childhood
as being optimistic about their abilities, but by age 10, they are far less optimistic. In
regards to academic abilities this decline in confidence and motivation continues into
adolescents (p. 34). This study will attempt to better understand if teacher leadership
behaviors enhance perceptions of self-competence in children between the ages of 8 and
11.
Transformational leadership theory. There are many leadership theories that
could be utilized to better understand the student/teacher relationship, but this broad
research focus is not feasible for a single study. Narrowing this study to focus on one
leadership theory is warranted and selecting transformational leadership, which is “the
dominant theory in contemporary organizational behavior research” makes sense (Judge,
Woolf, Hurst, & Livingston, 2008, p. 335). Focusing on a leadership theory that
incorporates acting as a role model, setting high expectations, and increasing follower
motivation also makes transformational leadership a good choice. The fact that
transformational leadership has been linked with both organizational and individual
outcomes also suggests its application to the teacher/student relationship may prove
fruitful (Bono & Judge, 2004; Givens, 2008).
Transformational leadership is associated with employee performance, job
satisfaction, and citizenship behaviors at the organizational level (Bono & Judge, 2004).
THE ACHIEVEMENT GAP AND STUDENTS LIVING IN POVERTY 9
Examining the role of a transformational teacher as it relates to student academic
performance aligns with the established relationships between transformational
leadership and employee performance outcomes. Transformational leadership is also
linked with outcomes like self-efficacy, motivation, and empowerment at the personal
level (Givens, 2008). These variables have also been linked to learning outcomes; so
developing a better understanding of the relationships between transformational teacher
leadership, academic performance, and these intrinsic states is sensible (Multon, Brown,
& Lent, 1991).
New research in organizational behavior, psychology, and motivation has
proposed that the combination of locus of control, self-efficacy, self-confidence, and
emotional stability is a good predictor of job performance (Bono & Judge, 2003;
Durham, Kluger, Locke, & Judge, 1998; Gardner & Pierce, 2009; Judge & Hurst, 2007).
The positive relationships with this combination of “core self-evaluation” variables and
other life-long success variables have also been promising. Core self-evaluation (CSE) is
associated with wellbeing, lifetime earnings, leadership, and physical health (Judge,
2009). In 2013, Nübold, Muck, and Günter concluded that transformation leadership
behaviors increase CSE in adults with low CSE. Core self-evaluation has yet to be
explored in children, despite these promising findings and the fact that self-concepts are
first formed in childhood. If the findings with adult subjects can be replicated with
children, particularly those from poverty, the implications for teacher training, hiring, and
development can be established.
THE ACHIEVEMENT GAP AND STUDENTS LIVING IN POVERTY 10
Summary of the Issue
There is an increasing divide between the academic achievement of students
living in poverty and students from more affluent backgrounds. Research also shows
students living in poverty are dropping out of school more frequently than their more
affluent peers and they have little prospect of becoming economically independent
members of society. Educational attainment is the best-documented strategy to break the
cycle of poverty; therefore finding ways to help these at-risk students succeed in school is
paramount.
Importance
Prior academic performance is the variable primarily used to project future
academic performance in public school organizations (Center for Public Education,
2007). If CSE in children can add further value over and above prior academic
performance (as it does with adults and job performance) it may provide educators with a
viable area of focus to increase academic performance. Understanding if the potential
transformational leadership impact is different based on socio-economics is especially
important. If a difference can be established it may suggest that transformational
leadership behaviors in teachers can help counteract the negative impact of socio-
economic status on student academic performance. This type of finding would have
major implications for teacher preparation programs and professional development
initiatives for teachers, particularly those in high poverty schools.

THE ACHIEVEMENT GAP AND STUDENTS LIVING IN POVERTY 11
Purpose of Study
The first purpose of this study is to determine if core self-evaluation stimulates
variance in reading and math achievement in 3rd and 4th grade children. The second
purpose is to explore the relationships between teacher transformational leadership
behaviors, student’s CSE, student’s socio-economic status and student’s reading and
math achievement while controlling for prior reading and math performance. The third
purpose is to gain better understanding of the factors associated with the reading and
math achievement of at-risk students.

THE ACHIEVEMENT GAP AND STUDENTS LIVING IN POVERTY 12
Chapter 2 Literature Review
Leadership
Day and Antonakis (2012) state, “leadership is often easy to identify in practice,
but difficult to define precisely” (p. 5). Its importance in human and animal interactions
is well documented and easily observable, but establishing a unified leadership theory or
even definition has yet to be established. Instead, leadership theory has evolved over
history and continues to do so.
The study of leadership started at the end of the nineteenth century and the
beginning of the 20th century and primarily focused on a trait-based perspective. This
school of thought is rooted in the work of Thomas Carlyle, a nineteenth century Scottish
historian. Carlyle (1940) maintained history is simply “a biography of great men”.
Similarly, the trait-based leadership perspective maintains that leaders are born, not
made. Trait theorists believe leaders have specific, biological dispositions that
differentiate them from non-leaders. Trait theorists like Mann and Stogdill “identified
traits like intelligence and dominance as being associated with leadership” in the mid
twentieth century (Day & Antonakis, 2012, p.7). The rise of behaviorism and social
psychology during this same time period caused the trait perspective to fall from favor for
several decades (Judge & Long, 2012, p. 180). It re-emerged with the “Big Five”
Personality model when a meta-analysis organized leadership traits based on the five
personality factors (Judge, Bono, Ilies, & Gerhart, 2002). This meta-analysis found that
four of the five “Big Five” traits had meaningful correlations with leadership emergence
and effectiveness: extraversion, conscientiousness, emotional stability, and openness to

THE ACHIEVEMENT GAP AND STUDENTS LIVING IN POVERTY 13
experience. The research also showed the “Big Five” factor model had a multiple
correlation of R = .53 with leader emergence and R = .39 with leader effectiveness (p.
772).
Like many social scientists, leadership researchers began studying the behavioral
practices of effective leaders in the 1950s. During this time, two overarching leadership
factors emerged known as person-oriented leadership (supportive) and task-oriented
leadership (directive) (Day & Antonakis, 2012, p. 8). Research showed that one style of
leadership was not preferable to another in all situations and tasks, so there was a shift in
focus to better understand leadership contingencies.
Fiedler is generally credited as the forerunner in leadership contingency theory.
He argued leader-member relations, task structure, and the leader’s position of power
dictate the best type of leadership style to utilize (Day & Antonakis, 2012, p. 9). In 1971
House introduced a path-goal theory of leader effectiveness. This theory proposes that a
leader’s effectiveness is based on his/her ability to match his/her leadership style to the
situation at hand and the needed outcomes. Based on the behaviorist factors, House’s
leadership styles were identified as directive, achievement-oriented, supportive, and
participative (Ayman & Adams, 2012, p. 226).
Researchers began to shift their focus a way from situational contingencies to
examining the relationship between the leader and followers. Leader-member exchange
(LMX) theory describes high-quality relationships as being based on trust and respect and
low-quality relationships as being contractual in nature. Leader-member exchange theory
maintains that high-quality relationships produce positive outcomes. A study by

THE ACHIEVEMENT GAP AND STUDENTS LIVING IN POVERTY 14
Schriesheim and Schriesheim (1980) found positive relationships were influenced by the
personal characteristics of the followers. This study maintains followers with an external
locus of control were happier with a participative leader and followers with an internal
locus of control preferred task-oriented leadership. A later study by Wofford and Liska
(1993) showed that low ability followers performed better with leaders who provide a
high degree of structure and focus on task-related behaviors, while high ability
subordinates preferred less structure and focus on task. Both of these studies’ findings
have implications for the context of the teacher/student relationship. Determining if
certain types of students are happier or perform better with certain types of teachers is
just beginning to be explored.
Leadership theory transitioned from examining the relationship between the
leader and followers to a focus on the followers’ influence on the leader. Brown (2012)
states “Ultimately, it is followers who legitimize leaders, empower them, and provide
them with the means to attain their visions and goals” (p. 333). These theorists stressed
leadership was dependent on followers and maintained good followers equated to
effective leadership. Bass’s transformational leadership theory acknowledges the
importance of followers, but his leadership theory examines the relationship between
followers and leaders as one of “bidirectional influence” (Brown, 2012, p. 350).
In 2008 a meta-analysis by Robinson, Lloyd and Rowe found instructional
leadership in school leaders was linked with student academic performance at higher
levels than transformational leadership. Robinson et. al. (2008) defined the most critical
dimensions of instructional leadership as: establishing goals and expectations; resourcing

THE ACHIEVEMENT GAP AND STUDENTS LIVING IN POVERTY 15
strategically; planning, coordinating and evaluating teaching and curriculum; promoting
and participating in teacher learning; and ensuring an orderly and supportive
environment. The focus of this research is not instructional expertise that potentially
increases student learning. This study also targets teacher leadership behavior rather than
the leadership of school administrators. Further, the constructs of instructional and
transformational leadership are not exclusive of one another. The most effective school
leaders are the ones who combine the characteristics of both instructional and
transformational leadership (Marks & Printy, 2003). This research will focus on
students’ sense of self-worth, how this view impacts their performance, how teachers
interact with students, what impact these factors have on academic performance, and if
this impact is different for students living in poverty. For these reasons, transformational
leadership theory best aligns with the goals of this study. Transformational leadership
theory takes both leaders and followers into account and is a good match because this
study will focus on characteristics of both teachers and students.
Transformational Leadership
In 1978, Burns proposed that the leader-follower relationship was defined as
being either transactional or transforming in nature. This relationship is based on what
the leader and follower can do for each other. The transactional relationship is bedded in
an exchange between the leader and follower. This exchange occurs when something
with perceived value (tangible or intangible) is given and/or received between the two
entities. On the other hand, a transforming relationship occurs when motivation, goals,
ethics, and vision are increased for both the leader and the followers. Burns proposed
THE ACHIEVEMENT GAP AND STUDENTS LIVING IN POVERTY 16
that most of leadership theory focused on the transactional nature of leadership and
disregarded its transformational nature. Burns states “the transforming leader looks for
potential motives in followers, seeks to satisfy higher needs, and engages the full person
of the follower” (p. 4).
Bass (1985) built on the work by Burns and developed it further. Instead of
focusing on the exchange between the leaders and followers, Bass examined the
behaviors of leaders and followers to better understand transactional and transformational
leadership. The theory evolved overtime. “In the most recent version, there are four
dimensions of transformational leadership, three dimensions of transactional leadership
and one non-leadership dimension” (Judge& Piccolo, 2004, p. 755).
The three dimensions of transactional leadership are contingent reward,
management by exception (active), and management by exception (passive). Contingent
reward describes the degree to which the leader effectively establishes a system of
expectations and rewards with the followers. According to Avoli and Howell (1993) the
major difference between passive and active management by exception is the timing of
the leader’s involvement when problems occur. Active management by exception occurs
when a leader foresees problems and intervenes before they become major issues.
Passive management by exception happens when a leader waits to intervene until the
situation has created major problems. The non-leadership dimension, Laissez-faire
leadership, can be described as an absence of leadership. Laissez-faire leaders actually
avoid or refuse to act in a leadership capacity. It is different from passive management
by exception because the leader never addresses problems or behaviors of concern,
whereas in passive management by exception problems are eventually addressed to some

THE ACHIEVEMENT GAP AND STUDENTS LIVING IN POVERTY 17
degree (Judge & Piccolo, 2004, p. 755-756).
The four dimensions of transformational leadership are idealized influence,
inspirational motivation, intellectual stimulation, and individualized consideration.
Idealized influence describes the degree to which the leader acts as a role model for
followers. Idealized influence is directly related to Bandura’s social learning theory.
Individuals are greatly impacted by their interactions with perceived role models and
many factors influence the degree to which a role model will be imitated. It is important
to remember that children’s self-concepts are fundamentally influenced by those closest
to them. Children look to role models to make meaning of the world and understand their
own role within it (Bandura, 1989). Followers want to emulate transformational
leaders. The leader models behavior for the followers and they emulate this behavior
because they have a high regard and respect for the leader (Bass, 1999).
Inspirational motivation explains a leader’s ability to communicate and inspire a
vision for followers. “Leaders with inspirational motivation challenge followers with
high standards, communicate optimism about future goal attainment, and provide
meaning for the task at hand” (Judge & Piccolo, 2004, p. 755). This dimension plays a
key role for the teacher/student relationship because it supports the importance of setting
high expectation for students. There have been many studies that show that students’
performance and behavior aligns with the expectations of their teachers (Cotton, 1989;
Dusek & Joseph, 1983; Good, 1987). Teachers who set and communicate high
expectations consistently to their students motivate them. The best teachers inspire
students to seek academic and behavioral excellence. Research shows that the social
class of the student has a direct influence on the level of expectations teachers set.
THE ACHIEVEMENT GAP AND STUDENTS LIVING IN POVERTY 18
Teachers tend to set lower expectations for students living in poverty (Cotton, 1989;
Dusek & Joseph, 1983; Good, 1987).
Intellectual stimulation is another component of transformational leadership.
Transformational leaders challenge the status quo and encourage followers to think
differently. They allow people to take risks and value the process over the product.
Failure is an opportunity for growth, learning, and improvement rather than a negative
end result. Intellectual stimulation applies to the relationship between a teacher and
students. Many maintain that intellectual stimulation is one of the primary functions of
being a teacher. Children cannot learn if they are not intellectually stimulated. The more
students are intellectually stimulated, the better they will process information and acquire
knowledge (Bandura, 1989).
The fourth and final dimension of transformational leadership is individualized
consideration. This component describes the leader’s ability to build a unique
relationship with each follower and adjust his/her behaviors to best meet the needs of
each individual. Teachers are also expected to meet the needs of each child in their class.
Building relationships by establishing trust and respect is critical for teachers and leaders
alike. By developing these bonds, teachers are able to adjust and differentiate learning
experiences based on the needs of the student. In Experience and Education, Dewey
(1938) maintains that teachers need to recognize the capacities of each student and assure
each child’s needs are addressed. Making each person feel valued and important is a
critical aspect of both transformational leadership and effective teaching.
Bass describes the transformational leader as “one who motivates us to do more

THE ACHIEVEMENT GAP AND STUDENTS LIVING IN POVERTY 19
than we originally expected to do” (p. 20). The four dimensions of transformational
leadership are the vehicles these leaders utilize to motivate, inspire, stimulate and
empower followers to grow and improve. Focusing on transformational leadership
theory for this study makes logical sense. Not only does this theory relate to the role of
teacher, it also aligns nicely with examining followers who have a distinctive set of
needs. Popp et al., (2011) indicated students living in poverty have unique academic
and affective needs. Determining what teacher qualities best meet their needs is critical if
closing the academic achievement gap is to become a reality.
Children Living in Poverty
The disparity between school performance for students living in poverty and
students from more affluent backgrounds is well documented (Berkman 2008; Bollinger,
2014; Coley & Baker, 2013; Kilty, 2015; Rumberger, 2013; Semuals, 2014). Coley and
Baker (2013) state more than one in five American children live in poverty (p. 3). They
go onto share another disturbing statistic. Although the United States is one of the 35th
wealthiest nations in the world, they rank the 2nd highest in childhood poverty for
developed nations (Coley & Baker, 2013, p. 7).
Poverty can take different forms. Situational poverty occurs because of a specific
circumstance, like loss of employment or serious illness. This form of poverty tends to
be temporary and short-lived, although not always. Generational poverty describes a
cycle of poverty experienced by two or more family generations when there are limited
resources. Finally, absolute poverty describes living circumstances that focus only on
sustenance and survival. For those experiencing absolute poverty, there are no excess

THE ACHIEVEMENT GAP AND STUDENTS LIVING IN POVERTY 20
resources for any emotional or social spending (Cuthrell, Stapleton, & Ledford, 2010).
The American Psychological Association (2015) reports poverty is associated
with decreased academic performance, increased risk for behavioral and emotional
problems, and increased risk for health issues. Children living in poverty are more likely
to be raised in single parent homes, suffer from food insecurity, live in unsafe
neighborhoods, experience abuse or neglect, and attend under-resourced schools. Coley
and Baker (2013) explain, “Children growing up in poverty complete less schooling,
work and earn less as adults, are more likely to receive public assistance, and have poorer
health. Boys growing up in poverty are more likely to be arrested as adults and female
are more likely to give birth outside of marriage” (p. 3).
Breaking the cycle of poverty is difficult. Educational attainment and income
level are positively associated in adults. Income level and academic performance are
positively associated in children. Thus, the cycle is established. Children living in
poverty do not perform as well in school, so they have lower income trajectories as adults
(Berkman 2008; Bollinger, 2014; Coley & Baker, 2013; Evans & Cassell, 2013; Kilty,
2015; Retka, 2013; Rumberger, 2013; Semuals, 2014).
Finding ways to increase success in school for students living in poverty is
critical. Of the factors that influence student performance, which schools can directly
influence, the quality of the teacher in the classroom is the most important (Nye, et al.,
2004; Weisberg, Sexton, Mulhern, & Keeling, 2009). The fact that students living in
poverty have unique needs has also been established (Payne, 1996; Popp et al., 2011;
Wright, et al., 1997; Walls, 2003). Determining if there are certain teacher qualities that
THE ACHIEVEMENT GAP AND STUDENTS LIVING IN POVERTY 21
specifically impact students living in poverty is a focus for this study.
Teachers of Students Living in Poverty
Effective instructional practices are essential for all students to meet success.
Most research on instructional practices focuses on methods that have the greatest
positive affect for students in general. Ensuring high levels of engagement and personal
relevance are important for all students. A focus on utilizing instructional time, setting
clear expectations and providing feedback are also essential instructional practices that
positively impact math and reading performance for all students (Nye, et al., 2004; Popp,
et al., 2011; Weisberg et al., 2009). In 2009, John Hattie published Visible Learning,
which shared the results of the largest meta-analysis of evidenced-based research in
education. In this work, Hattie describes what practices produce the largest effects in
student learning and encourages educators to strategically utilize the most effective,
evidence-based practices. Student expectations, teacher credibility, regular feedback,
and teacher/student relationships are among the factors that have high effect sizes for all
students (p. 266).
Less is known about how some practices may influence student groups
differently. Many students living in poverty experience unstable living conditions, which
may result in frustration, isolation and decreased motivation for these students (Walls,
2003). Payne (2005) defines eight resources whose presence or absence in a child’s life
impacts the long-term effect of poverty: financial, emotional, mental, spiritual, physical,
support systems, relationships, and role models. Teachers cannot provide all of these
resources, but some of them are within their power. Payne (2005) maintains teachers
THE ACHIEVEMENT GAP AND STUDENTS LIVING IN POVERTY 22
must understand the culture of poverty in order to work successfully with these students.
By understanding their world outside of school, teachers can help empower and teach
students behaviors that will lead to successful outcomes.
Classroom management is particularly important for students living in poverty. A
chaotic, unpredictable classroom environment is likely to exacerbate high levels of
anxiety and feelings of instability (Menchaca, & Ruiz-Escalante, 1995). The most
effective teachers for these students establish a calm, quiet, and consistent management
style. They foster students’ practicing self-control and taking personal responsibility for
their actions (Popp et al., 2011).
Effective teachers for children living in poverty meet their unique needs by
building strong, respectful, and trusting relationships with each student. These teachers
also establish and model an enthusiasm for learning and teaching. They model respect
and project a high level of expectation for their students. These teachers not only set high
expectations for their students, they also model setting them for themselves. These
teachers believe in their own power to make a difference in the lives of their students
(Cuthrell, et al., 2010; Popp, et al., 2011; Reeves , 2008).
A longitude study by Midgley, Feldlaufer, and Eccles (1989) found that teacher
efficacy impacted student achievement, particularly for low-achieving students. ‘‘The
fact that teacher efficacy beliefs have a stronger impact on low-achieving students than
on high-achieving students is especially provocative given the tendency to assign
teachers with a less positive sense of efficacy to groups of low-achieving students’’
(Midgley et al., 1989, p. 256). Although this study did not specifically focus on students

THE ACHIEVEMENT GAP AND STUDENTS LIVING IN POVERTY 23
living in poverty, research has established many of them likely fell within the low-
achieving group (Berkman 2008; Bollinger, 2014; Coley & Baker, 2013; Kilty, 2015;
Rumberger, 2013; Semuals, 2014). The discovery that low-achieving students respond
positively to teachers with high self-efficacy at higher rates than high-achieving students
supports the possibility that students living in poverty may also respond differently to
teacher leadership behaviors.
Core Self-Evaluation
Child development and social learning theory have established that children begin
to develop a sense of their own self-worth in middle childhood. During this stage of
development, children spend more and more time with their same aged peers. They
observe other children’s behaviors and see what responses are received as a result. They
begin to compare themselves to others and evaluate their own worthiness based on what
they observe and experience. A child’s personal and observed experiences with success
and failure also set the stage for how competent a child believes him/herself to be
(Bandura, 1989; Eccles, 1999).
Children living in poverty are particularly vulnerable because of their
environmental instability. How these factors might impact a child’s sense of self-worth is
concerning. Children living in poverty are more likely to be raised in stressful homes,
live in unsafe neighborhoods, experience abuse or neglect, and attend schools with
children who have similarly unstable living situations. A study by Evans and Cassell
(2013) found that low-income students exhibit greater levels of learned helplessness than
their higher income peers. The researchers surmise that helplessness is conditioned into
children living in poverty due to repeated exposure to uncontrollable and unpredictable

THE ACHIEVEMENT GAP AND STUDENTS LIVING IN POVERTY 24
stimuli. Their work indicates that these effects are long lasting and do not disappear even
if financial security improves.
Children develop learned helplessness to help protect their fragile sense of self-
worth, but learned helplessness then creates a self-reinforcing cycle. These children often
attribute their failures to lack of ability. The few times when they do experience success,
they often conclude that their achievement is the result of external factors or that the task
was made easy for them. These children believe that academic ability is a fixed
characteristic and they are powerless to change anything about themselves or their
circumstances. They do not think their academic performance can be improved by trying
hard. When a task is difficult for them, these children become anxious, experience high
levels of stress, shut down, and their negative sense of self-worth is reinforced (Elliot &
Dweck, 1988; Sinha & Gupta, 2006).
Finding ways to help children of poverty experience higher levels of
predictability, stability, empowerment, and control may have some positive impact on
their capacity to break this cycle. Setting high standards for all students and scaffolding
instruction to ensure all students meet success is critical (Retka, 2013). Some factors that
have been shown to increase self-worth for at-risk students are having an internal locus of
control, an ability to form meaningful relationships, and positive adult role models who
value education (Rockwell, 2006).
Core self-evaluation is a single personality factor comprised of four traits, which
all involve the internal evaluation of oneself. Durham, Kluger, Locke, and Judge first
proposed this factor in 1998. The four traits that comprise it are locus of control,
emotional stability, self-confidence, and self-efficacy. “Core self-evaluations are

THE ACHIEVEMENT GAP AND STUDENTS LIVING IN POVERTY 25
fundamental, bottom-line evaluations that people make of themselves. Like self-esteem,
CSE is an appraisal of one’s self-worth. However, CSE is broader than self-esteem in
that it also reflects beliefs in one’s capabilities (to control one’s life) and one’s
competence (to perform, cope, persevere, and succeed) and a general sense that life will
turn out well for oneself” (Judge, 2009, p. 58).
Core self-evaluation was first introduced within an organizational management
context to help differentiate between high-performing and low-performing employees. It
has primarily been studied in adults and little to no research addresses how CSE
develops. In adults, CSE has been shown to be a good predictor of job satisfaction, job
performance, and life satisfaction. Further, it is associated with increased lifetime
earnings, motivation, persistence, physical health, leadership, and a general sense of
wellbeing (Bono & Judge, 2003; Di Fabio & Palazzeschi, 2012; Gardner & Pierce, 2009;
Judge, 2009; Durham et al., 1998; Judge & Hurst, 2007; Koumoundourou, Tsaousis, &
Kounenou, 2011). These powerful associations with the long-range goals we have for
students warrant further exploration.
There is evidence that CSE can be influenced. Because CSE is a combination of
personality traits, we can surmise personality theory also relates to CSE (Judge, 2009).
Most broad personality traits have a genetic and environmental origin. Judge explains,
“Traits differ in their changeability and stability. Although self-esteem shows significant
heritability and long-term stability, it also shows evidence of short-term within-individual
variation. Because evaluations of our self-concept are intimately tied to our environment,
it stands to reason that CSE will show both short-term and long-term variability” (Judge,
2009, p. 61). Like learned helplessness, having high or low CSE reinforces itself (See

THE ACHIEVEMENT GAP AND STUDENTS LIVING IN POVERTY 26
Figure 1). Understanding if and how teachers can influence this cycle is one goal of this
study.
Figure 1.
The core self-evaluation cycle
The research on how CSE develops and the degree to which it fluctuates is just
beginning to be explored and so far it has reinforced Judge’s prediction that it can be
influenced (2009). Schinkel, Van Dierendonck, and Anderson (2004) found CSE to be
significantly influenced by feedback and a study by Nübold, Muck, and Günter (2013)
concluded transformation leadership behaviors increase CSE in adults with low CSE.
Given that high-levels of CSE are associated with high-levels of financial, social, and
emotional success in adults, we need to better understand CSE in children. Researchers
THE ACHIEVEMENT GAP AND STUDENTS LIVING IN POVERTY 27
must begin to ask these types of questions: Is CSE higher or lower based on student
demographics? Can parents impact a child’s CSE? If CSE can be increased in children,
what parent behaviors influence it? Can teachers impact a student’s CSE? If CSE can be
increased in students, what teacher behaviors influence it? If CSE can be influenced, are
there differences on the degree of influence based on age, gender, or other child-specific
variables? Are changes to CSE permanent? What are the long-term implications of
increasing CSE in children?
Summary
Public education in the United States was created to produce industrious, law-
abiding citizens and to ensure the economic and social welfare of our communities.
Access to public education is part of our country’s culture and links directly to our vision
that the United States is a land of opportunity for all citizens. The reality is equal access
to high-quality education is not an actuality for all citizens. Social class typically
segregates our neighborhoods, and school attendance is based on physical residence. As
a result many children living in poverty are served in schools where the majority of the
student population is economically disadvantaged. These schools are typically under
resourced and have lower-quality teachers.
Many children living in poverty experience instability, stress, abuse/neglect,
dangerous neighborhoods, and a lack of basic resources outside of school. Many of these
students develop learned helplessness, which carries over into their behavior at school.
They do not perform as well in school as their more affluent peers. They have increased
affective, emotional, and academic needs. Their increased needs are then compounded

THE ACHIEVEMENT GAP AND STUDENTS LIVING IN POVERTY 28
by under resourced schools, limited positive role models, and less qualified teachers.
Children living in poverty have little chance of breaking the cycle of poverty.
New research in human resource management has shown that adults with high
CSE perform better at work than those with low CSE. Further research has found
associations between high CSE and career and life satisfaction, general wellbeing,
physical health, and financial earnings. Despite CSE’s association with successful life
outcomes for adults, little is known about CSE in children.
Children begin to evaluate themselves and develop a sense of self-worth in middle
childhood, so focusing on this age group is appropriate. Determining if the positive
relationship between job performance and CSE can be replicated with children is a
logical place to start. Using reading and math performance as necessary conditions for
job performance is also a practical approach.
It makes sense to explore if teachers can influence CSE and how their behavior
impacts student performance in reading and math, particularly for students living in
poverty. Transformational leadership is associated with increased employee
performance, satisfaction, and citizenship behaviors in adults. The dimensions of
transformational leadership apply to teacher behaviors. Acting as a positive role model,
inspiring followers, stimulating learning, and setting high expectations have been
associated with increased reading and math performance for students. Applying
transformational leadership to the role of teacher and exploring potential connections to
student CSE, achievement in reading and math, and student socioeconomic status will
build upon previous research and lay new groundwork for future study.
THE ACHIEVEMENT GAP AND STUDENTS LIVING IN POVERTY 29
Hypotheses
While public schools cannot control most variables that influence students’ lives,
they can control who teaches them. This study will explore if and how teacher leadership
behavior impacts students’ CSE, math achievement, and reading achievement. If
leadership behavior impacts CSE, math achievement, and/or reading achievement,
understanding if the relationship is different based on students’ demographics is
warranted. Given the achievement gap between students living in poverty and those not
living in poverty, examining if poverty moderates the relationship is a practical next step.
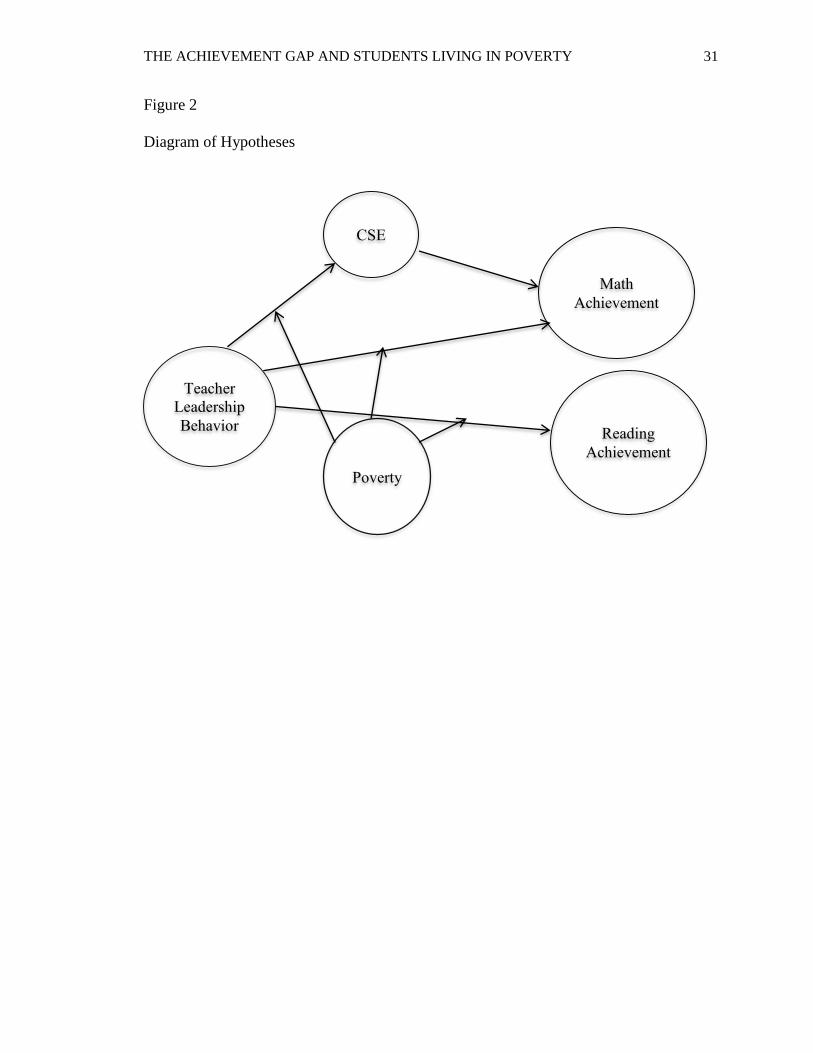
The hypothesized relationships between these variables are depicted in Figure 2.
Hypothesis 1
Transformational leadership behavior will be associated with higher levels of math
achievement than not-transformational leadership behavior.
Hypothesis 2
Transformational leadership behavior will be associated with higher levels of reading
achievement than not-transformational leadership behavior.
Hypothesis 3
Transformational leadership behavior will be associated with higher levels of CSE than
not-transformational leadership behavior.
Hypothesis 4
The relationship between transformational leadership behavior and math achievement is
mediated by CSE.

THE ACHIEVEMENT GAP AND STUDENTS LIVING IN POVERTY 30
Hypothesis 5
The relationship between transformational leadership behavior and reading achievement
is mediated by CSE.
Hypothesis 6
Poverty will moderate the relationship between transformational leadership behavior and
math achievement, so that transformational leadership behavior will be more strongly
related when the student lives in poverty and will be less strongly related when the
student does not live in poverty.
Hypothesis 7
Poverty will moderate the relationship between transformational leadership behavior and
reading achievement, so that transformational leadership behavior will be more strongly
related when the student lives in poverty and will be less strongly related when the
student does not live in poverty.
Hypothesis 8
Poverty will moderate the relationship between transformational leadership behavior and
CSE, so that transformational leadership behavior will be more strongly related when the
student lives in poverty and will be less strongly related when the student does not live in
poverty.
THE ACHIEVEMENT GAP AND STUDENTS LIVING IN POVERTY 31
Figure 2
Diagram of Hypotheses
CSE
Teacher
Leadership
Behavior
Math
Achievement
Reading
Achievement
Poverty

THE ACHIEVEMENT GAP AND STUDENTS LIVING IN POVERTY 32
Chapter 3 Methodology
This multifactor study examines a set of relationships between transformational
leadership behavior, CSE, math achievement and reading achievement, and poverty (See
Figure 2). Quantitative research design allows researchers to objectively investigate and
examine relationships between variables. Because this study will examine variables that
potentially influence outcomes and will look for group differences, a quantitative
research approach is warranted. (Creswell, 2009, p. 18).
Study Type and Subjects
This study is classified as a non-experimental study and utilizes a cross-sectional
survey design (Gliner, Morgan, & Leech, 2009, p. 12). Data were collected using
structured record reviews and administering an online survey. The James Madison
University Institutional Review Board (IRB) gave permission for the study on April 7,
2015, IRB Number 15-0478. Nine 3rd grade and eleven 4th grade classes from a small
rural city in Virginia were identified as possible participants. These classes were selected
based on accessibility for the researcher and the ages of students in 3rd and 4th grade (8-11
years). The target population is children in middle childhood, which is when self-worth
is developing (Eccles, 1999). Middle-aged children living in poverty, not living in
poverty, and their teachers are also target populations.
Seven administrators (four principals, two assistant principals, and one
instructional director) were asked to participate in the study. All seven voluntarily
participated and signed a consent form (Appendix A). One of the seven administrators is
male and the other six are female. All of the administrators are white.
THE ACHIEVEMENT GAP AND STUDENTS LIVING IN POVERTY 33
Twenty 3rd and 4th grade teachers were asked to participate in this study.
Seventeen (eight 4th and nine 3rd) voluntarily agreed to participate and signed
participation forms (Appendix B). Three of the teachers were unable to participate due
to time and/or personal conflicts. All of the teachers are female. One of the teachers is
black and 16 are white.
Three hundred and fifty-four students, in the participating teachers’ classes, were
also asked to take part in the study. One hundred and thirty-three of the students (37.6%)
agreed to participate and returned signed parent and student participation/assent forms
(Appendixes C and D). There were 66 males and 67 females in the sample. Sixty-five of
the students were on free or reduced lunch at the time of the survey’s administration. The
sample included 108 white students and 25 minority students. Forty-nine of the students
were in 4th grade and 84 were in 3rd grade at the time of the study.
Measurements
Prior academic achievement. Because students in this division are primarily
screened for intervention at the beginning of each school year, using the Phonological
Awareness Literacy Screening (PALS) reading test and the division’s math pretests, these
scores were obtained to be utilized as control variables for prior reading and math
achievement. The scores were obtained from the school system using student numbers
and student confidentiality was maintained.
The PALs reading assessment was developed in 1997 by the Curry School of
Education at the University of Virginia and is required across the state of Virginia as a
literacy screening instrument. Cronbach’s alpha has been calculated to measure internal
consistency across Word Recognition (.79-.96) and Spelling (.86-.92) tasks. Teacher
THE ACHIEVEMENT GAP AND STUDENTS LIVING IN POVERTY 34
raters also score portions of the test. Inter-rater reliability estimates for PALS have
ranged from .81 to .97 (Invernizzi, Meier, & Juel, 2004, p. 33-37).
To support content validity, “special care was taken to select tasks shown by
research to be essential to reading comprehension and to select words that are appropriate
for each grade level being assessed” (Invernizzi, Meier, & Juel, 2004, p. 39). Support
for construct validity was addressed with principal components analyses on PALS data to
confirm the underlying factor structure. Second, discriminant analyses on PALS data
was utilized to verify the degree to which group membership could be predicted
accurately from PALS subtask scores. Supportive evidence of predictive validity was
established by using PALS scores to predict achievement on the 3rd grade Virginia
Standards of Learning Reading Test (R2 = .36). The scores on the Developmental
Reading Assessment and PALS scores were consistent, which supports concurrent
validity (r = .81, p < .01), as were comparisons between the PALS and the Virginia
Standards of Learning Reading Test (r = .57, p < .01) (Invernizzi, Meier, & Juel, 2004,
p. 41-51).
The state of Virginia does not provide school divisions with a screening
assessment for mathematics as they do with reading (PALS), so the division’s math
pretests were developed by central office instructional specialists. The pretests are based
on the Virginia Math Standards of Learning (SOL) for each grade level. These tests have
been used to measure math achievement for the past two years in grades K-5. Internal
consistency was conducted and found to be acceptable: Grade four test (α = .83) and
Grade three test (α = .84). Student scores on these tests correlate with their performance
on the math SOL tests (r = .60, p < .05) and establish reliability and predictive validity.

THE ACHIEVEMENT GAP AND STUDENTS LIVING IN POVERTY 35
Academic achievement. The Spring 2015 results from the Virginia Math and
Reading SOL Tests were used to measure academic achievement. The scores were
obtained from the school system using student numbers and student confidentiality was
maintained. These are criterion-referenced tests that are given across the state annually.
In 2008-09, the Virginia Department of Education (VDOE) provided evidence of internal
consistency as well as content validity based on the tests’ alignment with the Standards of
Learning curriculum and educator input on their development (α =. 87- .90). Construct
validity was also supported by the correlation of the results with the results from the
Stanford 9 (r = .72-.78) and Literacy Passport tests (r = .76-.78). Although the standards
and tests have changed since 2008-09, validity and reliability information are not
currently provided; however it is reasonable to assume the VDOE did due diligence
before implementing the new state-wide assessments.
Demographic measures. Demographic information was obtained from the
division’s student information system. A student’s socio-economic status was measured
based on their free and reduced lunch status. These data were obtained using student
numbers and student confidentiality was maintained at all times during this study.
Core self-evaluation. The participating students completed the Children’s Core
Self-Evaluation Scale (CCSES) in the spring of 2015 (See Appendix E). One major
obstacle that prohibits studying core self-evaluation (CSE) in children is finding an
appropriate measurement instrument. Measuring CSE in young children using Judge,
Bono, and Thoresen’s 12-item Likert scale poses major problems because the questions
are tailored to adults in both content and reading level. In order to study CSE in children,
it was necessary to create and establish an effective measure of CSE for children.

THE ACHIEVEMENT GAP AND STUDENTS LIVING IN POVERTY 36
The item stem development for the CCSES was completed based on items from
Judge, Erez, Bono, and Thoresen’s CSE scale (2002). The first part of the process was
to simplify the language in the 12 items on the adult scale to match the reading and
comprehension level of a young child. For example, words like “depressed” were
replaced with “unhappy” and phrases like “I feel confident” were replaced with “I am
sure”. An additional 9 items were added to the scale to allow items that prove
problematic based on future scale analysis to be removed. These additional items attempt
to measure similar concepts, but are worded differently. For example, one item uses the
language “do not do well” and another instead uses “have a hard time”. Like the adult
CSE scale, the items probably cut across more than one of the four CSE traits rather than
measure each one in isolation.
Based on the work of Harter (2012), who found that young children report more
consistently when Likert scales are worded in third-person rather than first-person, one
version of the scale was written in third-person and the other was written in first-person.
Both scales were given to 7 children between the ages of 6-10. Each child was
independently asked which scale he/she preferred. All 7 children indicated they preferred
the scale written in third-person, which was the version utilized for this study.
The CCSES consists of 21 Likert scale items with statements describing how
some kids feel or behave. Students are asked to rate the degree to which the description
is like them or not like them. The choice are “just like me”, “like me”, “not like me” and
“not at all like me”. An additional option that states, “don't know if this is like me or not”
is also included. The items range in value from 1 to 5, with 5 indicating high CSE and 1
indicating low CSE. “Don’t know if this is like me or not” is scored with a value of 3.

THE ACHIEVEMENT GAP AND STUDENTS LIVING IN POVERTY 37
Eleven of items are negatively worded, so that “just like me” indicates low CSE and “not
at all like me” indicates high CSE. The scores for these items were reverse coded
accordingly.
One of the main challenges in adapting the adult CSE scale into a measure for
children was to ensure that the reading level is appropriate. In order to address this
concern, 6 elementary teachers and 1 reading specialist reviewed the CCSES. All agreed
that the content and reading level were appropriate for students in grades 3 and 4.
The internal consistency of the instrument was examined prior to its
administration in this study. One hundred and forty-seven middle school students were
administered the survey. Cronbach’s alpha was .87, which supports the internal
reliability of this instrument with this particular age group. Based on adult CSE studies,
which show CSE scores have correlations (r = .23 to .35) with job performance, some
evidence to support of the validity of the CCSES is based on similar correlations between
CCSES scores and academic performance (Judge et al., 2003). Using the data compiled
with the 147 middle school students, correlations between total CCSES scores and scores
on reading (r = .25, p < .01) and math (r = .39, p < .01) SOL tests are similar, which
helps establish concurrent validity. In addition to the pilot data reported, tests of internal
consistency, concurrent validity, inter-item correlations, and factor structure will be
conducted on the study sample prior to using the measure in hypotheses testing.
Teacher leadership behaviors. Two vignettes, each describing a teacher, were
used to identify teachers as primarily exhibiting transformational leadership behavior or
not (See Appendix F). Effort was made to ensure both teachers were described as being
equally competent and to remove any potential bias based on social desirability. Care
THE ACHIEVEMENT GAP AND STUDENTS LIVING IN POVERTY 38
was taken to describe each teacher as being highly effective in their instructional
practices in order to target the differences in their interactions with students, rather than
their instructional expertise. Three students enrolled in a strategic leadership doctoral
program and one professor within this program reviewed the vignettes independently.
All four correctly identified the teacher with transformational leadership behavior, which
helps support this measure’s validity for use in this study.
For this study, seventeen 3rd and 4th grade teachers and seven administrators were
asked to read the vignettes of two highly effective teachers and determine which teacher
vignette best matched their teaching behaviors. The teacher and two school
administrators with personal, direct knowledge of the teacher matched each teacher. This
exercise was conducted independently with the researcher.
To address reliability, inter-rater reliability was established at ICC (1,3) = .88
(95% CI, .72-.95) p < .01. When the ratings were not in agreement, the teacher rated
herself, as having transformational leadership behavior and the school administrators did
not. There was not a case in which the school administrators disagreed or when they
rated the teacher, as having transformational leadership behavior and the teacher did not.
Research has consistently found low levels of agreement between an individual’s
self-evaluation of his/her performance and performance evaluations completed by
supervisors, peers, and subordinates (Facteau & Craig, 2001; Ross, 2006). Individuals
tend to rate themselves higher than others and there is less discrimination in the level of
performance of self-raters (Facteau & Craig, 2001, p. 225). Based on this research and
the fact that the two administrators’ ratings matched, the teachers, who rated themselves
THE ACHIEVEMENT GAP AND STUDENTS LIVING IN POVERTY 39
as having transformational leadership behavior when their administrators did not, were
grouped with the not-transformational leadership behavior teachers.
To ensure this approach is statistically sound, two Multivariate Analysis of
Variance (MANOVA) analyses were conducted. The first MANOVA compared the
disagree classrooms with the transformational leadership behavior classrooms. Box’s M
(70.73) test of equality of variance was significant (p < .01), which indicated that
homogeneity of variance across these classrooms could not be assumed. MANOVA
results (Wilks’ λ = .71, F [22, 136] = 1.17, p = .28, partial η2 = .16) were not significant,
which indicated there were not significant classroom differences. Levene’s test of the
equality of error variances showed an insignificant result for the reading pretest (F [11,
69] = 1.38, p = .20), but there was a significant result for the math pretest (F [11, 69]
=3.54, p < .01). This finding indicated significant group differences on math pretest
between these classrooms could have existed and did not support grouping the disagree
classrooms with the transformational classrooms. When the disagree classrooms were
compared to the not-transformational leadership behavior classrooms, Box’s M (34.59)
test of equality of variance was not significant (p = .36), which indicated that
homogeneity of variance across these classrooms could be assumed. MANOVA results
(Wilks’ λ = .84, F [18, 140] = .73, p = .77, partial η2 = .09) were not significant, which
also supported no significant group differences. Levene’s test of the equality of error
variances showed insignificant results for the reading pretest (F [9, 71] = .73, p = .68)
and for the math pretest (F [9, 71] =1.47, p < .18). These results showed the assumption
of homogeneity of variance was met when the disagree classrooms were compared with
the not-transformational leadership behavior classrooms. Therefore, the decision to

THE ACHIEVEMENT GAP AND STUDENTS LIVING IN POVERTY 40
include the disagree classrooms with the not-transformational leadership behavior
classrooms was supported by both theory and statistical analysis.
Data Analysis
There will be three phases of data analysis. The first phase will focus on
analyzing the CCSES. The second phase will examine the within and between group
differences on the pretests for the transformational leadership behavior and not-
transformational leadership behavior conditions and the classrooms which are nested
within each condition. The final phase will be conducting the analyses to test the study’s
eight hypotheses.
The CCSES will be further analyzed to examine the reliability and validity of
each item. The Flesch-Kincaid Grade Level formula, Gunning-Fog formula, and the
Automated Readablity Index will be utilized to measure the reading level of each item on
the scale. If any items have reading levels that are not appropriate for children over the
age of 7, the item will be removed from the scale. Total-item and inter-item correlations
will also be used to analyze the scale. Total-item correlations will examine how each
item correlates with the total scale. Inter-item correlations will show the correlations
between each item and the other twenty items on the scale. Any items, which do not
consistently align with the scale and/or other items based on these analyses, will also be
removed. Exploratory factor analysis (EFA) will also be utilized to determine if
calculating additional variables, based on item sets within the scale, is appropriate or if
additional items need to be removed from the scale. Once the final set of items has been
determined, internal reliability and correlational analyses to establish concurrent validity
will be completed with the sample group.

THE ACHIEVEMENT GAP AND STUDENTS LIVING IN POVERTY 41
Three MANOVA analyses will be conducted during the second phase of the data
analysis. Three additional statistical tests will be included as part of the MANOVA
analyses. Correlations between the PALS and math pretest scores will be obtained to
establish if there is a reasonable relationship between the dependent variables, which
shows there is a multivariate effect. The correlation between dependent variables should
be present, but it should not be too strong because there is little sense in using two
variables to measure the same concept. Generally, a moderate relationship is considered
acceptable (Mayers, 2013). Box’s M tests for each of the three MANOVA analyses will
examine multivariate homogeneity of variance and covariance and if there are consistent
correlations between the combined dependent variables between the groups. An
insignificant Box’s M test will establish that neither of these assumptions has been
violated. Levene’s tests for each of the MANOVAs will examine the homogeneity of
between-group variance for each dependent variable in isolation. An insignificant
Levene’s test will indicate this assumption has not been compromised.
The first MANOVA analysis will be completed to ascertain if there are significant
differences on the reading and math pretests between students in the transformational and
not-transformational leadership behavior conditions. If there are not significant
differences between the two conditions based on the pretests, any resulting differences on
math and reading achievement tests cannot be attributed to the reading and math pretests.
For this reason, the reading and math pretests will not be utilized as covariates in the final
analysis if no significant differences between conditions can be established.
The second MANOVA will examine differences on the PALS and math pretests
between the classrooms nested within the transformational leadership behavior condition
THE ACHIEVEMENT GAP AND STUDENTS LIVING IN POVERTY 42
and the third MANOVA will determine if there are differences on the PALS and math
pretests between the classrooms nested within the not-transformational leadership
behavior condition. Ideally, these two analyses will establish the independence of
observation assumption, which will support utilizing linear regression for the final
analysis. Any systematic variance in student-level scores based on the classrooms nested
within each condition will be attributed to error in regression. It is important to
determine if this type of variance will negatively impact the accuracy of the regression
analysis before attempting to utilize it. If these analyses establish there are not significant
differences within the nested classrooms; linear regression is an appropriate choice for
the final analysis.
The final phase of data analysis will focus on the eight hypotheses. This study
examines a set of linear relationships (See Figure 2). There are direct relationships
between transformational leadership behavior, CSE, math achievement, and reading
achievement that correspond with hypotheses 1, 2 and 3. There are also more complex
relationships with both mediating and moderating variables as described by Baron and
Kenny in 1986. The relationship between teacher leadership behavior may be mediated
by CSE, which will result in a direct and an indirect effect, if hypotheses 4 and 5 are
supported. Additionally, hypotheses 6, 7, and 8 suggest poverty will act as a moderating
variable and impact and the direct effects proposed in hypotheses 1, 2, and 3. Baron and
Kenny explain how to use regression equations to test mediation, moderation, and
moderated mediation (1986). Preacher and Hayes (2004) also recommend utilizing
bootstrapped samples to test mediation using confidence intervals. Assuming the

THE ACHIEVEMENT GAP AND STUDENTS LIVING IN POVERTY 43
statistical assumptions are met, regression analysis with bootstrapping will be utilized to
analyze the revised model using the PROCESS macro for SPSS (Hayes, 2013).
Ethical Considerations
The CCSES is about student self-perceptions so it was possible a student could be
upset by the questions. Parents were informed of this possibility and only students with
parental consent participated in this study (See Appendix C). Children were also required
to sign an assent form (See Appendix D). The researcher was present during the survey
administration and reminded students they could stop if the survey made them
uncomfortable or if they wanted to stop for any reason. No students showed any signs of
being upset or concerned by questions on the survey. The survey took no more than 15
minutes for each child to complete. The researcher worked closely with school staff to
ensure minimal loss of instruction time for participating students. There were no major
risks for the adults who participated in this study. All of them participated voluntarily.
Participating teachers were assured the activity had no relationship with their
performance evaluation. Confidentiality of students and teachers was protected at all
times during this study. Teacher ratings were manually entered by the researcher into an
Excel spreadsheet. Each teacher was pre-assigned a number and names were not part of
this dataset. Qualtrics software was used to capture student survey data. Student
identification numbers, rather than names, were entered as part of the survey. Students’
Fall 2014 PALS and math pretest scores, Spring 2015 reading and math SOL scores,
gender, race, lunch status, and survey results were compiled. The student numbers and
corresponding teacher numbers were merged to match teachers and students in the
dataset. Only anonymous student and teacher datasets were analyzed for this study.
THE ACHIEVEMENT GAP AND STUDENTS LIVING IN POVERTY 44
Strengths and Weaknesses
The CCSES is a new measurement and its validity and reliability need to be
established. Further analysis of the CCSES’s relationship with independent measures of
each of the four factors that make up CSE is recommended. The subjects are also from
one school district in Virginia and the students, who participated in this study, were the
ones who returned parental permission forms. Teachers and administrators also
participated voluntarily. For these reasons, the subjects are homogenous so these
findings may not apply to other populations. CCSES scores were collected once at the
end of the school year, so it is impossible to know if these scores changed over time. The
potential impact of previous transformational leadership behavior is also unaccounted for
in this study. Instructional expertise was not controlled for in this study. Although the
vignettes described two highly competent teachers, it is not possible to know if the
teachers within the two groups differed on instructional expertise. Defining poverty is
difficult. Students’ status on free and reduced lunch at the time of the study was used to
identify students living in poverty. While this measure is the best available mechanism in
a public school setting, it is not perfect. It is possible and even likely that some children
on free and reduced lunch status were experiencing situational poverty and not
generational or absolute poverty. It is also possible that the required paperwork to be
placed on free or reduced lunch was not completed for all students living in poverty.
This study is the first to analyze CSE in children and examine its possible
relationships within the context of an academic setting. Applying a leadership lens to the
role of teacher is also a relatively new area of research. It is essential to find methods and
practices that reduce the achievement gap to ensure students living in poverty have equal

THE ACHIEVEMENT GAP AND STUDENTS LIVING IN POVERTY 45
opportunities to become successful, productive adults. More research on the qualities of
successful teachers, who work with students living in poverty, is needed. This study
seeks to help address this area of need and contribute to our existing body of knowledge.
The findings may have implications for student intervention programs, student
monitoring, teacher development programs, teacher professional development, and
leadership programs.

THE ACHIEVEMENT GAP AND STUDENTS LIVING IN POVERTY 46
Chapter 4 Analysis
The data analysis process was conducted in three phases. The first phase
examined the reliability and validity of the Children’s Core Self-Evaluation Scale
(CCSES). The second phase analyzed the within and between group differences on the
pretests for the transformational and not-transformational teacher leadership behavior
conditions. The final phase addressed the study’s hypotheses.
Phase 1: Children’s Core Self-Evaluation Scale Analysis
Prior to this study, six certified elementary teachers and a reading specialist
reviewed the CCSES and all agreed it was appropriate in content and reading-level to use
with 3rd and 4th grade students. Several readability calculations were utilized to further
analyze the scale as a whole and also each item within it. The readabilty formulas used in
this study are available for public use on-line and require text to be entered directly on the
website, Readability-score.com (Child, 2016). The formulas utilized were the Flesch-
Kincaid Grade Level (FKGL), Gunning-Fog Score (GFS), and the Automated Readablity
Index (ARI). The FKGL formula is based on total words, total sentences, and total
syllables. The GFS utilizes sentence length and the complexity of words, based on the
number of syllables. The ARI also calculates number and length of sentences and
complexity of words, but bases the calculation on characters in the word rather than
syllables (Childs, 2016).
The 21-item CCSES, excluding the directions, which were read orally to
participants, was scored as a whole and yielded two scores below the 3rd grade-level and
one score above the 3rd grade-level (See Table 1). The answer choices and each item
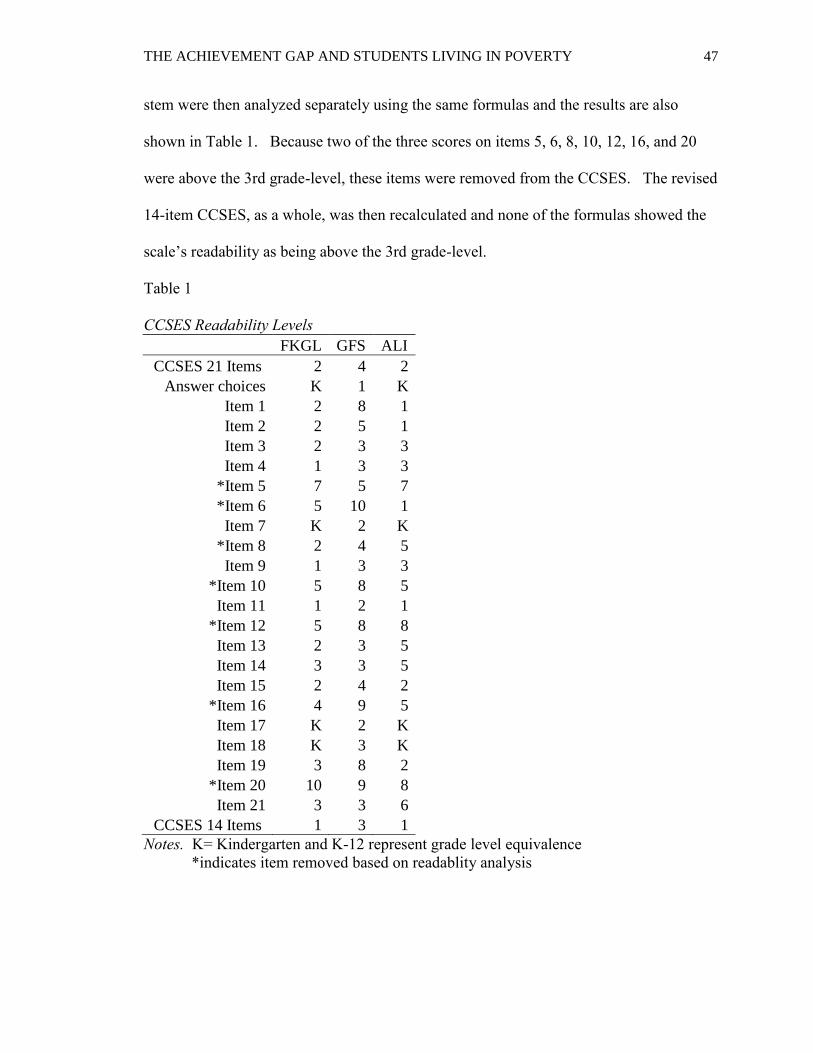
THE ACHIEVEMENT GAP AND STUDENTS LIVING IN POVERTY 47
stem were then analyzed separately using the same formulas and the results are also
shown in Table 1. Because two of the three scores on items 5, 6, 8, 10, 12, 16, and 20
were above the 3rd grade-level, these items were removed from the CCSES. The revised
14-item CCSES, as a whole, was then recalculated and none of the formulas showed the
scale’s readability as being above the 3rd grade-level.
Table 1
CCSES Readability Levels
FKGL GFS ALI
CCSES 21 Items 2 4 2
Answer choices K 1 K
Item 1 2 8 1
Item 2 2 5 1
Item 3 2 3 3
Item 4 1 3 3
*Item 5 7 5 7
*Item 6 5 10 1
Item 7 K 2 K
*Item 8 2 4 5
Item 9 1 3 3
*Item 10 5 8 5
Item 11 1 2 1
*Item 12 5 8 8
Item 13 2 3 5
Item 14 3 3 5
Item 15 2 4 2
*Item 16 4 9 5
Item 17 K 2 K
Item 18 K 3 K
Item 19 3 8 2
*Item 20 10 9 8
Item 21 3 3 6
CCSES 14 Items 1 3 1
Notes. K= Kindergarten and K-12 represent grade level equivalence
*indicates item removed based on readablity analysis
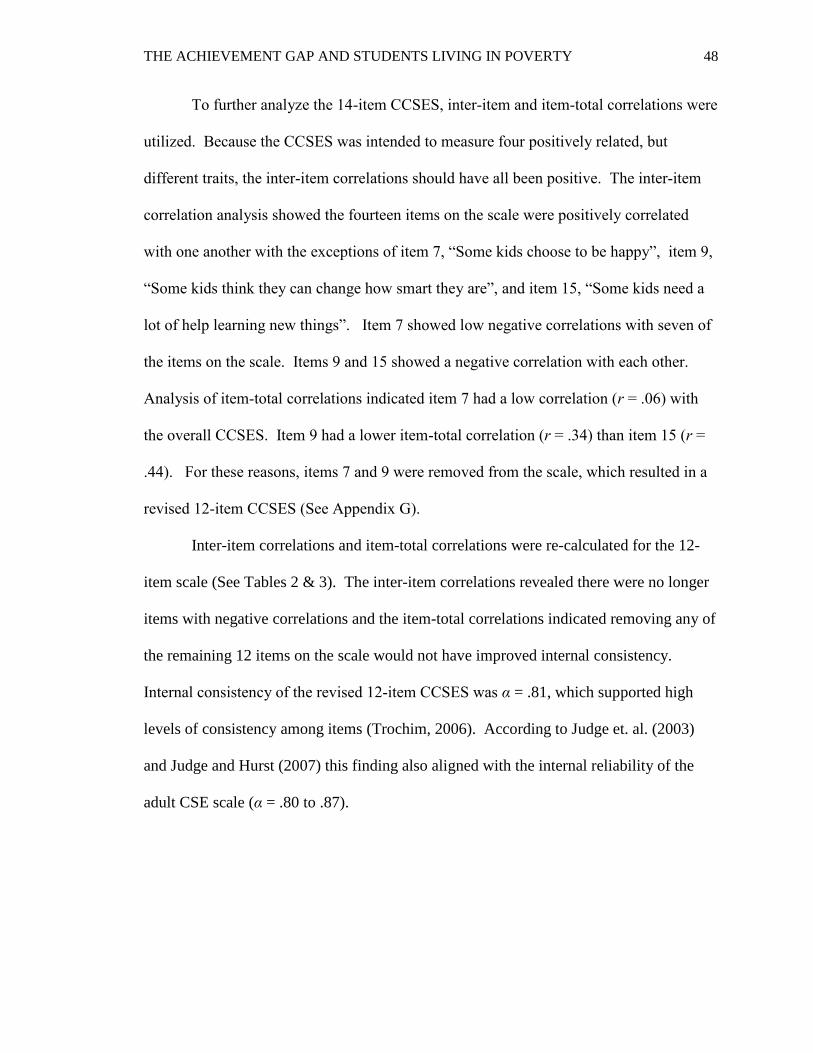
THE ACHIEVEMENT GAP AND STUDENTS LIVING IN POVERTY 48
To further analyze the 14-item CCSES, inter-item and item-total correlations were
utilized. Because the CCSES was intended to measure four positively related, but
different traits, the inter-item correlations should have all been positive. The inter-item
correlation analysis showed the fourteen items on the scale were positively correlated
with one another with the exceptions of item 7, “Some kids choose to be happy”, item 9,
“Some kids think they can change how smart they are”, and item 15, “Some kids need a
lot of help learning new things”. Item 7 showed low negative correlations with seven of
the items on the scale. Items 9 and 15 showed a negative correlation with each other.
Analysis of item-total correlations indicated item 7 had a low correlation (r = .06) with
the overall CCSES. Item 9 had a lower item-total correlation (r = .34) than item 15 (r =
.44). For these reasons, items 7 and 9 were removed from the scale, which resulted in a
revised 12-item CCSES (See Appendix G).
Inter-item correlations and item-total correlations were re-calculated for the 12-
item scale (See Tables 2 & 3). The inter-item correlations revealed there were no longer
items with negative correlations and the item-total correlations indicated removing any of
the remaining 12 items on the scale would not have improved internal consistency.
Internal consistency of the revised 12-item CCSES was α = .81, which supported high
levels of consistency among items (Trochim, 2006). According to Judge et. al. (2003)
and Judge and Hurst (2007) this finding also aligned with the internal reliability of the
adult CSE scale (α = .80 to .87).

THE ACHIEVEMENT GAP AND STUDENTS LIVING IN POVERTY 49
Table 2
Inter-item correlation matrix for 12-item CCSES
Item
1
Item
2
Item
3
Item
4
Item
11
Item
13
Item
14
Item
15
Item
17
Item
18
Item
19
Item 1
Item 2 .25*
Item 3 .27* .47*
Item 4 .24* .32* .32*
Item 11 .23* .19* .15* .24*
Item 13 .24* .15* .16* .12 .28*
Item 14 .16* .27* .45* .58* .24* .11
Item 15 .16* .35* .23* .37* .40* .03 .54*
Item 17 .13 .50* .40* .30* .18* .17* .31* .34*
Item 18 .25* .36* .26* .31* .30* .20* .33* .29* .33*
Item 19 .24* .10 .26* .16* .17* .31* .26* .13 .20* .22*
Item 21 .10 .12 .33* .40* .16* .10 .46* .28* .20* .19* .26*
Note. * p < .05
Table 3
Item-total correlations for 12-item CCSES and Cronbach’s alpha if item deleted
Item
Corrected
Item Total
Correlation
Cronbach’s
Alpha if
deleted
Item 1 .35 .80
Item 2 .48 .79
Item 3 .52 .79
Item 4 .54 .78
Item 11 .41 .80
Item 13 .29 .80
Item 14 .61 .78
Item 15 .51 .79
Item 17 .49 .79
Item 18 .49 .79
Item 19 .36 .80
Item 21 .40 .80
An exploratory factor analysis (EFA) was conducted to determine if calculating
additional variables, based on item sets within the scale, was appropriate or if additional
items needed to be removed from the scale. Before conducting the analysis, the

THE ACHIEVEMENT GAP AND STUDENTS LIVING IN POVERTY 50
factorability of the 12-item CCSES was considered. As previously shown in Table 2, the
12 items correlated at least .27 with at least one other item on the scale and the majority
of pairs were significantly correlated. The anti-image correlation matrix also showed
mostly small values in the off-diagonal calculations (Tabachnick & Fidell, 2013, p. 619-
620). The Kaiser-Meyer- Olkin measure of sampling adequacy was .79, which met the
recommended value of .60 or above (Tabachnick & Fidell, 2013, p. 620). Bartlett’s test
of sphericity was also significant (χ2 (66) = 391.27, p < .01), which supported the
postulation that the correlations within the correlations matrix were not zero. Given these
indicators, which confirmed each item shared common variance with the other items;
factor analysis was appropriate to utilize (Tabachnick & Fidell, 2013; Neill, 2016; Neill,
2008).
A principal components analysis with a Varimax rotation was utilized. The
analysis found four factors with Eigenvalues greater than 1.0, which aligned theoretically
with CSE as a factor composed of four traits. The four factors explained 33%, 11%, 9%,
and 9% respectively and total 62% of the variance. Based on Tabachnick and Fidell’s
rule for interpretation, all of the items loadings were acceptable (2013, p.654). Several
items had loadings over .30 on multiple factors, but only the highest loading was
considered in interpretation (See Table 4).
THE ACHIEVEMENT GAP AND STUDENTS LIVING IN POVERTY 51
Table 4
Factor loadings for 12-item CCSES
Item
Factor
One
Factor
Two
Factor
Three
Factor
Four
Item 1
.57
Item 2
.85
Item 3
.63
Item 4 .64
Item 11
.82
Item 13
.75
Item 14 .78
Item 15
.63
Item 17
.70
Item 18
.49
Item 19
.69
Item 21 .78
Notes. Factor loadings < .47 are repressed
Based on a principal component analysis with a Varimax rotation
Although the scale loaded with four factors with Eigenvalues greater than 1.0 and
each item loaded at an acceptable level on at least one factor, the items did not clearly
cluster based on the four CSE traits. For example, three items from the scale loaded
highest on Factor 3, but the three items were not necessarily aligned with one another.
Item 1, “Some kids feel unhappy most of the time” and item 13, “Some kids believe they
will have really happy lives” logically aligned with emotional stability, but item 19,
“Some kids make up their minds to do something and then do it”, did not. This item
would have better aligned with either self-efficacy or internal locus of control.
The fact that the items did not clearly cluster based on the four traits that make up
CSE was not overly concerning because the items were not developed to measure each
trait separately. Instead, the items should measure the CSE factor as a whole. The item
design process was based on that of the adult CSE scale, which designed items to
THE ACHIEVEMENT GAP AND STUDENTS LIVING IN POVERTY 52
measure the commonality between the traits, not each trait in isolation (Judge et. al,
2003).
Despite the items not clearly clustering on one of the four CSE traits, the CCSES
was balanced across the four factors identified in this analysis. Three items loaded
highest on each of the four factors and at least one of the three items loaded above .71,
which was considered excellent (Tabachnick & Fidell, 2013, p. 654). For these reasons,
none of the 12 items were removed from the scale and like the adult CSE scale, the
CCSES was interpreted as a total score and subsets of items were not utilized to measure
additional variables.
As previously shown in the pilot study, support for the validity of the CCSES was
based on its having a similar relationship with academic performance as the adult CSE
scale has with job performance. Adult CSE studies have consistently shown CSE scores
correlate with job performance (r = .23 to .35). Using the data from this study,
correlations between total CCSES scores and scores on reading (r = .33, p < .01) and
math (r = .41, p < .01) Standards of Learning tests were again similar.
Phase 2: Multivariate Analysis of Variance analyses
For this study, it was critical to determine if there were significant differences on
pretest scores between students in the transformational and not-transformational
conditions because significant differences on pretests would carry over to the posttest
scores unless they were controlled in the final analysis. In addition to determining if the
students in each condition were homogeneous on pretest scores, it was also important to
consider differences that might have existed between the classrooms nested within the
transformational and not-transformational conditions. If classroom differences existed

THE ACHIEVEMENT GAP AND STUDENTS LIVING IN POVERTY 53
within the two conditions, a regression analysis would have calculated them as error,
which would impact the results. In such a case, a hierarchical linear model (HLM)
analysis would have been a better analysis to utilize. Three Multivariate Analysis of
Variance (MANOVA) analyses were conducted to examine the possible differences on
pretest scores between the transformational and not-transformational conditions and the
classrooms nested within the transformational and not-transformational conditions. Prior
to conducting these MANOVAs, a correlational analysis between reading and math
pretests found they were moderately correlated (r = .34, p < .01) and appropriate for
MANOVA
Analysis of between group differences for transformational and not-
transformational conditions. The first MANOVA was conducted to determine if there
were significant differences on math and reading pretest scores between students in the
transformational and not-transformational conditions. Box’s M (1.57) was not significant
(p = .67), which indicated homogeneity of variance across the two leadership conditions
could be assumed. Results of the MANOVA were not significant, which indicated there
were not significant differences between the conditions on math and reading pretest
scores (Wilks’ λ = .984, F [2, 130] = 1.25, p =. 29, partial η2 = .02). Levene’s test of the
equality of error variances also supported non-significant differences between the two
leadership conditions on both the reading pretest (F [1, 131]=. 20, p = .66) and the math
pretest (F [1, 131]=. 01, p = .80). Because the transformational and not-transformational
conditions did not differ on math and reading pretest scores, there was no need to control
for pre-existing differences and the pretest scores were not included as control variables
in the final analysis.
THE ACHIEVEMENT GAP AND STUDENTS LIVING IN POVERTY 54
Analyses of within group differences for classrooms nested within the
transformational and not-transformational conditions. Two MANOVAs were
utilized to examine possible differences between classrooms nested within the not-
transformational and transformational conditions. For the classrooms within the not-
transformational condition, Box’s M (34.59) was not significant (p = .37) which
indicated homogeneity of variance across these classrooms could be assumed. The
results of the MANOVA (Wilks’ λ = .84, F [18, 142] = .73, p = .77, partial η2 = .09)
were also not significant and indicated there were not significant classroom differences.
Levene’s test of the equality of error variances also supported no significant classroom
differences on both the reading pretest (F [9, 71] = .73, p = .68) and the math pretest (F
[9, 71] =1.5, p = .18). For the classrooms within the transformational condition, Box’s M
(44.97) was significant (p < .05), which indicated homogeneity of variance across the
classrooms could not be assumed. MANOVA results (Wilks’ λ = .68, F [12, 88] = 1.6,
p = .11, partial η2 = .18) were not significant, which indicated there were not significant
classroom differences. Levene’s test of the equality of error variances supported no
significant classroom differences on the reading pretest (F [6, 45] = 1.8, p = .11);
however, the test indicated possible significant classroom differences on the math pretest
(F [6, 45] = 5.5, p <. 05). Because homogeneity between the classrooms nested in the
transformational condition on the math pretests could not be assumed, math achievement
was dropped as a dependent variable in the final analysis and hypotheses 1, 4, and 6 were
not tested.

THE ACHIEVEMENT GAP AND STUDENTS LIVING IN POVERTY 55
Phase 3: Testing the Hypothesized Relationships
The final stage of data analysis was to test the remaining hypothesized
relationships using a regression analysis in SPSS PROCESS with bootstrapped samples.
Before conducting this analysis, the variables’ descriptive statistics were examined. The
reading achievement test scores fell between 294 and 600 and the scores on 12-item
CCSES fell between 20 and 60. Mean scores and standard deviations are shown in Table
5. The data for the continuous variables were also analyzed to ensure normality by
plotting the score distributions and calculating skewness, and kurtosis, which are also
shown in Table 5. Both the reading achievement scores and the CSE scores fell between
+/-1 for both kurtosis and skewness, which indicated a good distribution in terms of
normality for both variables. Correlations between the variables are shown in Table 6.
Because group differences were hypothesized in this study, the descriptive statistics of
the groups were also examined before the final analysis and are shown in Table 7.
Table 5
Descriptive statistics for variables
M SD Skewness Kurtosis
Reading Achievement 465 66.69 -.13 .11
CSE 46 7.91 -.87 .61
Poverty .49 .50 - -
Teacher Leadership .39 .49 - -

THE ACHIEVEMENT GAP AND STUDENTS LIVING IN POVERTY 56
Table 6
Bivariate correlations between variables
Teacher
Leadership
Reading
Achievement
Poverty
Teacher Leadership - - -
Reading Achievement .22* - -
Poverty -.11 -.25** -
CSE .03 .34** -.13
Note: * p < .05, ** p < .01
Table 7
Descriptive data on continuous variables by not-transformational and transformational
conditions
Measure Poverty Teacher Lead. M SD N
Reading
Achievement
Not in poverty Not-trans 480.11 69.52 38
Trans 482.23 59.36 30
Total 481.04 64.77 68
Living in poverty Not-trans 429.51 60.00 43
Trans 484.45 59.72 22
Total 448.11 64.95 65
Total Not-trans 453.25 69.07 81
Trans 483.17 58.93 52
Total 464.95 66.69 133
CSE Not in poverty Not-trans 47.74 6.10 38
Trans 46.40 7.05 30
Total 47.15 6.52 68
Living in poverty Not-trans 44.42 7.76 43
Trans 46.59 11.30 22
Total 45.15 9.08 65
Total Not-trans 45.98 7.18 81
Trans 46.48 8.99 52
Total 46.17 7.91 133
A bootstrapping resampling method for linear regression was utilized to analyze
the hypotheses using the PROCESS macro for SPSS (Hayes, 2013). This type of
analysis obtains confidence intervals for specified indirect effects by taking random cases
from the existing sample to create bootstrapped samples (Preacher & Hayes, 2004).
THE ACHIEVEMENT GAP AND STUDENTS LIVING IN POVERTY 57
Significance is determined based on zero falling within the 95% confidence interval. If
the confidence interval does not contain zero, the mediation is significant. Conversely, if
zero falls within the confidence interval there is not significant mediation. Based on the
PROCESS model options provided by the Institute for Digital Research and Education
(2016), PROCESS model 8 was used to test for moderated mediation utilizing 1000
bootstrapped resamples. In this model, reading achievement was the dependent variable
and teacher leadership behavior was the independent variable. CSE was treated as a
mediator between teacher leadership behavior and reading achievement. Poverty was a
moderator between teacher leadership behavior and reading achievement and for the
mediation between teacher leadership behavior and CSE (See Figure 3).
A bootstrapping resampling regression for moderated mediation. Results for
the moderating effect of poverty in the relationship between teacher leadership behavior
and reading achievement showed the main effect of teacher leadership behavior on
reading achievement (b = 5.41, SE = 14.65, p = .71) was not significant. This finding did
not support hypothesis 2. Findings showed a significant direct effect of CSE on reading
achievement (b = 2.46, SE = .67, p < .01). The direct effect of teacher leadership
behavior on CSE was not significant (b = -1.34, SE = 1.93, p = .49), which indicated
there were no differences in students’ CSE scores associated with teacher leadership
conditions. Thus, Hypothesis 3 was not supported. There was also a non-significant
indirect effect of teacher leadership behavior on reading achievement through CSE (b = -
3.28, SE= 4.21, 95% CI [-13.30, 3.21], p > .05) because zero fell within the confidence
interval. This finding indicated there was not a mediated relationship between teacher
leadership behavior and CSE, and hypothesis 5 was not supported. The main effect of
THE ACHIEVEMENT GAP AND STUDENTS LIVING IN POVERTY 58
poverty on reading achievement (b = - 42.45, SE = 13.51, p < .01) and the interaction
between teacher leadership behavior and poverty on reading achievement (b = 44.20, SE
= 21.58, p < .05) were both significant. The total direct moderation effect of teacher
leadership behavior on reading achievement moderated by poverty (b = 49.61, SE
=15.76, p < .01) was significant and supported hypothesis 7. The significant interaction
between teacher leadership behavior and poverty was plotted and showed students living
in poverty performed better on reading achievement with teachers who had
transformational leadership behavior (See Figure 4). There was little difference between
leadership conditions for students not living in poverty. Based on the work of Preacher,
Rucker, & Haynes (2007) moderated mediation between variables cannot exist if there is
not significant mediation. Hypothesis 8 suggested poverty would moderate the
mediation between teacher leadership behavior and CSE and was not supported by the
results of this study. As previously shown the direct effect of teacher leadership
behavior on CSE was not significant. The interaction effect for poverty and teacher
leadership behavior on CSE was also not significant (b = 3.51, SE = 2.83, p = .22).
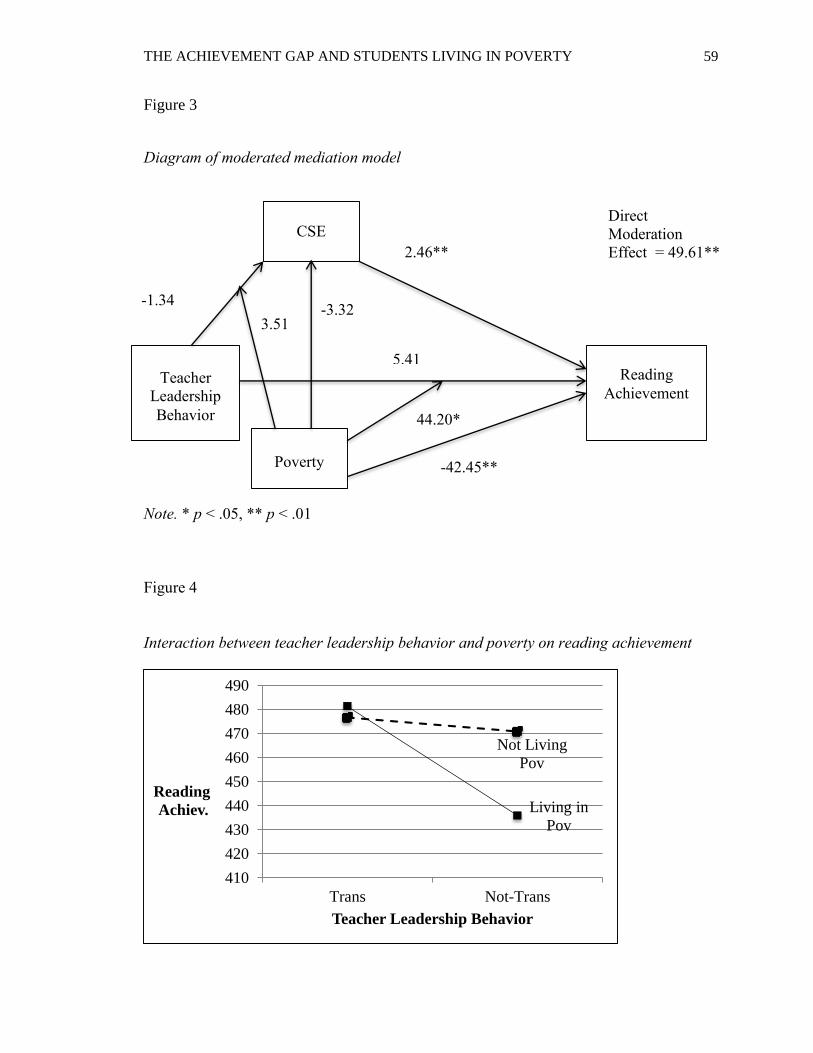
THE ACHIEVEMENT GAP AND STUDENTS LIVING IN POVERTY 59
Poverty
Figure 3
Diagram of moderated mediation model
Note. * p < .05, ** p < .01
Figure 4
Interaction between teacher leadership behavior and poverty on reading achievement
Not Living
Pov
Living in
Pov
410
420
430
440
450
460
470
480
490
Trans Not-Trans
Reading
Achiev.
Teacher Leadership Behavior
CSE
Reading
Achievement
Teacher
Leadership
Behavior
-1.34
2.46**
-3.32 3.51
-42.45**
44.20*
5.41
Direct
Moderation
Effect = 49.61**

THE ACHIEVEMENT GAP AND STUDENTS LIVING IN POVERTY 60
Follow-up regression analysis. The positive correlation between reading
achievement and teacher leadership behavior (r = .22, p < .01) showed a significant
relationship. Inspection of the mean reading achievement scores of the teacher leadership
conditions, as shown in Table 7, also indicated a mean difference of 29.92 points.
However, the relationship between teacher leadership behavior and reading achievement
within the PROCESS model analysis was not significant. An interaction between teacher
leadership behavior and CSE on reading achievement, that was not a mediated
relationship, needed to be considered. In order to test this moderation, a multiple
regression analysis without bootstrapped samples was conducted. The regression of
teacher leadership behavior, CSE, and their interaction on reading achievement was
significant (R2 = .19, F [3, 129] = 10.02, p < .01). Each variable played a significant role
in the variability of reading achievement (See Table 8). The interaction was plotted
based on mean scores one standard deviation below and one standard deviation above the
mean score of CSE (See Figure 5). For students with high levels of CSE there was little
difference between teacher leadership conditions; however, students with low levels of
CSE performed significantly higher on reading achievement when in the transformational
leadership condition.
Table 8
Multiple regression coefficients and semi-partial squared correlations
B SE sr2 p
TeachLeadCond 164.61 62.78 .04 .01
CSE 4.27 .95 .12 .00
CSExTeachLeadCond -2.94 1.34 .03 .03
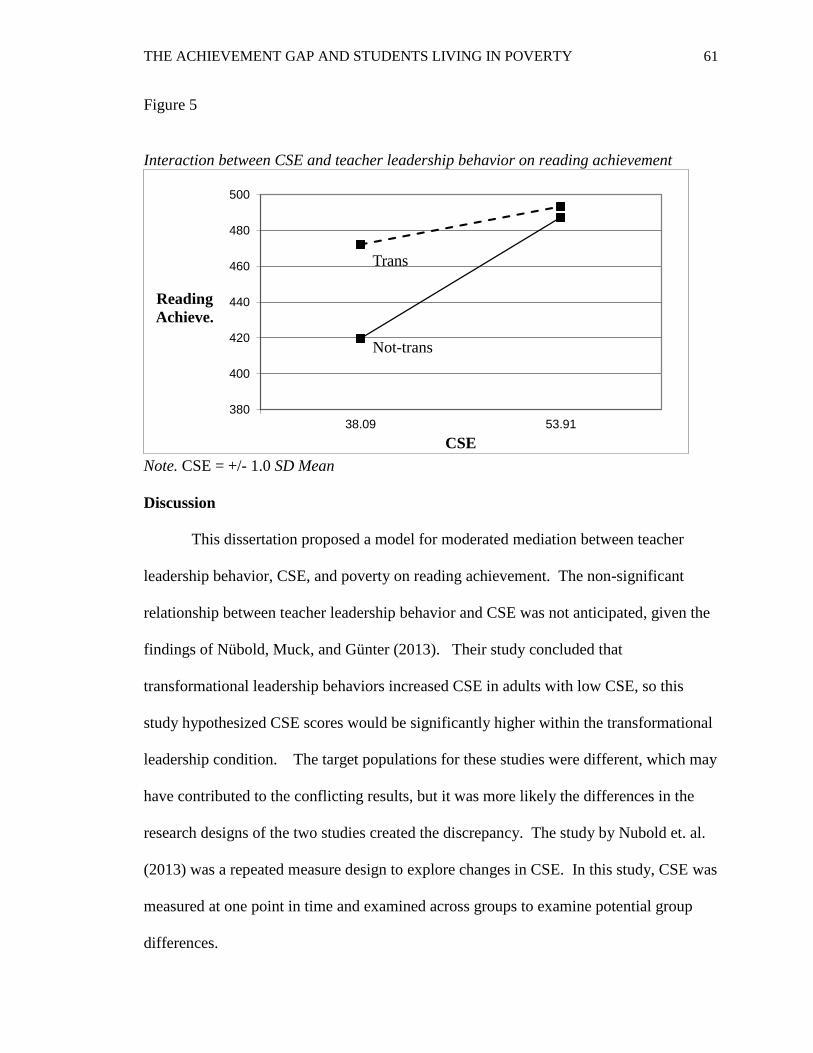
THE ACHIEVEMENT GAP AND STUDENTS LIVING IN POVERTY 61
Figure 5
Interaction between CSE and teacher leadership behavior on reading achievement
Note. CSE = +/- 1.0 SD Mean
Discussion
This dissertation proposed a model for moderated mediation between teacher
leadership behavior, CSE, and poverty on reading achievement. The non-significant
relationship between teacher leadership behavior and CSE was not anticipated, given the
findings of Nübold, Muck, and Günter (2013). Their study concluded that
transformational leadership behaviors increased CSE in adults with low CSE, so this
study hypothesized CSE scores would be significantly higher within the transformational
leadership condition. The target populations for these studies were different, which may
have contributed to the conflicting results, but it was more likely the differences in the
research designs of the two studies created the discrepancy. The study by Nubold et. al.
(2013) was a repeated measure design to explore changes in CSE. In this study, CSE was
measured at one point in time and examined across groups to examine potential group
differences.
Not-trans
Trans
380
400
420
440
460
480
500
38.09 53.91
Reading
Achieve.
CSE

THE ACHIEVEMENT GAP AND STUDENTS LIVING IN POVERTY 62
Although this study found no direct effect between teacher leadership behavior
and CSE, interaction effects between teacher leadership behavior and CSE and teacher
leadership behavior and poverty were discovered. Students with low levels of CSE and
students living in poverty performed significantly better on reading achievement with
teachers, who exhibited transformational leadership behaviors than with teachers who did
not. Previous research surrounding self-efficacy, self-esteem, and self-confidence has
consistently established the positive correlation between views of self-worth and
performance (Bono & Judge, 2003; Elliott & Dweck, 1988; Good, 1987; Judge 2009:
Multon, Brown, & Lent 1991). Hattie’s meta-analysis results showed students’
expectations of their own academic success had the highest effect size of the indicators
studied (2009, p. 268). Educational research has also established students living in
poverty have significantly lower academic performance than those who are not living in
poverty (Berkman 2008; Bollinger, 2014; Coley & Baker, 2013; Hattie, 2009; Kilty,
2015; Rumberger, 2013; Semuals, 2014). Findings from this study suggest
transformational leadership may be able to off set the negative influences of living in
poverty and of having low levels of CSE.
Transformational leaders serve as positive role models (Idealized Influence),
express individualized concern (Individualized Consideration), stimulate (Inspirational
Motivation), and challenge followers (Intellectual Stimulation). Individuals with low
CSE do not believe in their own competence and they believe they have little control over
their lives. Often these internal beliefs are reinforced by learned helplessness, low levels
of intrinsic motivation, and lack of effort (Sinha & Gupta, 2006). Transformational
leaders empower followers to develop their skills, knowledge, and abilities and ultimately

THE ACHIEVEMENT GAP AND STUDENTS LIVING IN POVERTY 63
to reach their full potential (Zhu, Sosik, Riggio, & Yang 2012). Bass’s description of a
transformational leader as “one who motivates us to do more than we originally expected
to do” (p. 20) describes this finding. Pairing students with low CSE with a teacher, who
exhibits transformational leadership behavior, likely allows them to feel a sense of
empowerment, provides them with a role model who sets high expectations, increases
their motivation, and is ultimately associated with improved reading performance.
For the students living in poverty, who participated in this study, transformational
leadership behavior in their teachers offset the achievement gap associated with poverty.
Students living in poverty often do not have families who highly value education.
Because education is not highly valued, these students are often apathetic and
unmotivated at school (Rumberger, 2013). The findings of this study suggest teachers
with transformational leadership behaviors increase motivation and inspire learning for
students living in poverty much as they do for students with low CSE.

THE ACHIEVEMENT GAP AND STUDENTS LIVING IN POVERTY 64
Chapter 5 Conclusion
Free public education is engrained in our country’s culture and contributes to our
belief that the United States is a land of opportunity for its people. However, equal
access to high-quality education is not a reality for all children. Social class divides our
neighborhoods and as a result, our schools experience segregation based on socio-
economics. Schools, with impoverished student populations, operate with fewer
resources and less financial capital. These schools tend to hire lower-quality teachers,
despite the fact that the quality of the teacher is the most important school-based factor in
predicting student academic success (Bollinger, 2014; Coley & Baker, 2013; Rumberger,
2013; Weisberg, Sexton, Mulhern, & Keeling, 2009).
Research shows that persons with limited education earn less money in their
lifetimes, have shorter life expectancy, and are at increased risk for incarceration. They
are also less able to make significant economic impact as consumers (Reardon,Yun, &
Kurlaender, 2006). Despite the fact that educational attainment is the best way to break
the cycle of poverty, many students do not value the idea that success in school is the key
to eventual economic prosperity (Rumberger, 2013). These students are also often
isolated from their more affluent peers and they see little hope of changing their future.
Public education continues to face many challenges so finding new approaches to
help schools implement sound research-based best practices is essential. One
overarching goal of this dissertation was to apply leadership theory to the complex
relationship between teacher and student, which is paramount to student success (Hattie,
2009). Within organizational theory, the role of leadership has been well established
(Judge, Woolf, Hurst, & Livingston, 2008), but it is not often applied to the relationship

THE ACHIEVEMENT GAP AND STUDENTS LIVING IN POVERTY 65
between teacher and student. By viewing this relationship through the lens of leadership,
practices that have proven successful in organizational research, can be explored and
applied within the realm of our public schools. Results from this study legitimize this
approach and suggest successful leadership training programs should be applied to the
professional development of teachers.
Research in organizational behavior, psychology, and motivation has shown that
the combination of locus of control, self-efficacy, self-confidence, and emotional stability
is a good predictor of job performance, wellbeing, lifetime earnings, leadership, and
physical health. Theory posits that core self-evaluation (CSE) is a personality trait and its
formation is based on both genetics and environment (Bono & Judge, 2003; Durham,
Kluger, Locke, & Judge, 1998; Gardner & Pierce, 2009; Judge & Hurst, 2007). There is
also indication that high and low levels of CSE are reinforced much like learned
helplessness reinforces itself (Judge, 2009). Another purpose of this study was to
establish CSE as a viable area for educational research. Results support CSE is
significantly associated with academic achievement for middle and elementary aged
students, much like it is associated with job performance in adults. This finding
establishes it as a promising area of research focus.
Current research has primarily examined the qualities of effective teachers
on a comprehensive spectrum. Little focus has been given to the notion that teacher
behaviors might impact at-risk students differently. Improving our current understanding
about what types of teacher behaviors impact at-risk students and determining if these
behaviors impact all students in the same way was also a goal for this study. This
research aimed to explore the relationships between teacher transformational leadership

THE ACHIEVEMENT GAP AND STUDENTS LIVING IN POVERTY 66
behaviors, student’s CSE, student’s socio-economic status, and student’s reading
achievement to gain a better understanding of the factors associated with the achievement
of at-risk students. Findings indicated CSE and poverty were not significantly correlated
so students with low CSE and students living at poverty were not the same. However,
both of these groups were associated with low reading performance unless a teacher with
transformational leadership behaviors taught them. This finding did not hold true for
students with high levels of CSE and those not living in poverty, which shows teacher
behaviors impact at-risk students differently. This result adds to the existing research
concerning the actions of highly effective teachers and establishes the need to examine
teacher effects for different student groups.
Implications
Training teachers to apply transformational leadership behaviors in the classroom
will add a new area of focus to existing evidence-based teacher development programs.
The description of the transformational teacher in the transformational leadership
measure from this study should be utilized to design targeted teacher training and units of
study for teacher preparation programs. School divisions should provide professional
development specifically designed for teachers of at-risk students. This training should
include strategies to ensure students meet success while simultaneously challenging them
to meet high demands. Creating a classroom climate that empowers students to take
ownership of their own learning, strive for excellence, and find their passion needs to be
stressed. At-risk students need teachers whose main focus is empowering students rather
than helping them. Providing this evidence-based training to teachers in high-poverty
schools will improve teacher effectiveness within these schools. If these types of teacher

THE ACHIEVEMENT GAP AND STUDENTS LIVING IN POVERTY 67
behaviors are taught, fostered, and increased over time, the likelihood of breaking the
negative and reinforcing CSE and poverty cycles for at-risk students will be increased.
Future Research
The problems facing public education are complex and multiple solutions are
needed to help move schools forward. This study establishes the potential benefits of
utilizing a leadership lens to improve student and teacher relationships and establishes
CSE as a viable area of focus for schools. As part of this study, the first measure of CSE
in children, the Children’s Core Self-Evaluation Scale (CCSES) was designed and
utilized. Its reliability and validity were also explored. The CCSES is a new
measurement and examination of its validity and reliability needs to be continued.
Investigating the CCSES’s relationship with independent measures of each of the four
factors that make up CSE is needed to further support its validity. This study’s sample
size (N=133) was a limitation and increasing the sample for future studies to further
examine the scale’s validity and reliability is suggested.
Determining what aspects of transformational leadership account for the
improved reading performance of at-risk students should be part of future studies. The
vignette used to measure transformational leadership behaviors in teachers should be
closely analyzed to understand why these behaviors positively impact at-risk students and
have little impact on other students. To fully understand CSE and the impact of
transformational leadership on the performance of at-risk children, longitudinal data is
needed. Future studies that extend over long periods of time to account for
developmental changes in children and the influence of multiple teachers will need to be
implemented. This study suggests plausible avenues for improving the performance of

THE ACHIEVEMENT GAP AND STUDENTS LIVING IN POVERTY 68
at-risk students and evidence-based professional development for teachers. It also adds
new dimensions to the existing body of knowledge of these complex constructs and lays
the groundwork for continued research.

THE ACHIEVEMENT GAP AND STUDENTS LIVING IN POVERTY 69
Appendices
Appendix A: Administrator Consent to Participate in Research
Appendix B: Teacher Consent to Participate in Research
Appendix C: Parent/Guardian Informed Consent
Appendix D: Student Assent Form
Appendix E: The Children’s Core Self-Evaluation Scale
Appendix F: Teacher Categories Vignettes
Appendix G: The Children’s Core Self-Evaluations Scale (Revised)
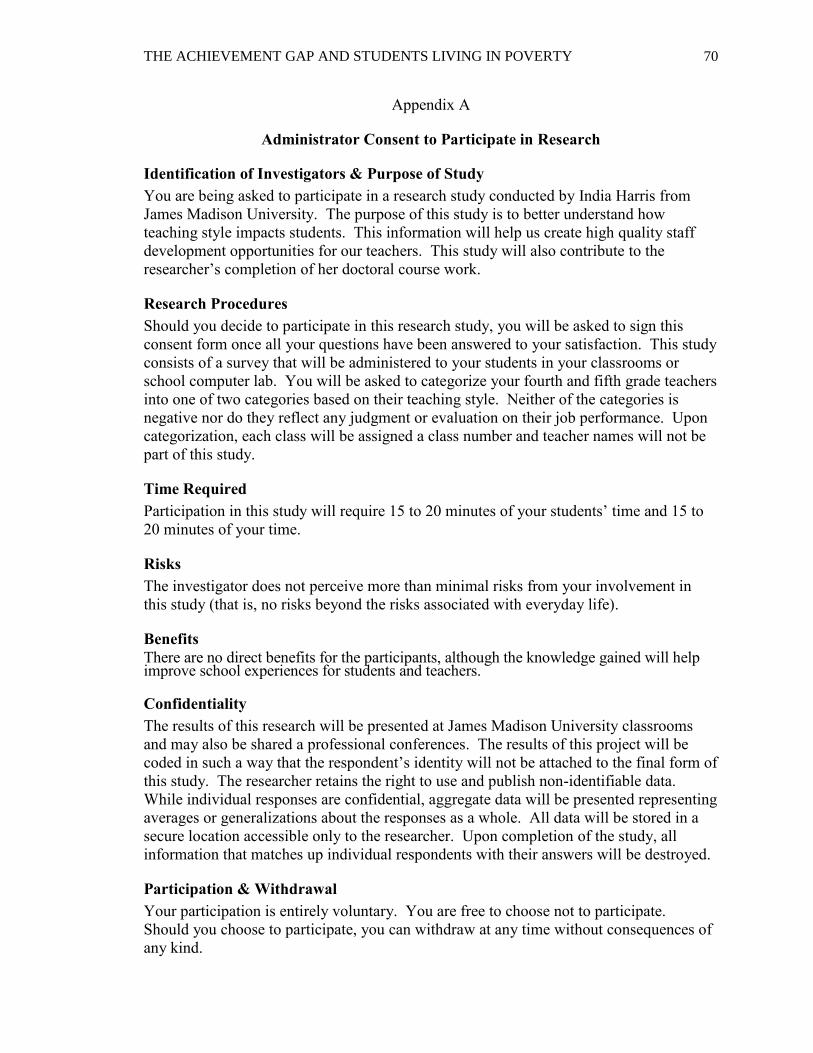
THE ACHIEVEMENT GAP AND STUDENTS LIVING IN POVERTY 70
Appendix A
Administrator Consent to Participate in Research
Identification of Investigators & Purpose of Study
You are being asked to participate in a research study conducted by India Harris from
James Madison University. The purpose of this study is to better understand how
teaching style impacts students. This information will help us create high quality staff
development opportunities for our teachers. This study will also contribute to the
researcher’s completion of her doctoral course work.
Research Procedures
Should you decide to participate in this research study, you will be asked to sign this
consent form once all your questions have been answered to your satisfaction. This study
consists of a survey that will be administered to your students in your classrooms or
school computer lab. You will be asked to categorize your fourth and fifth grade teachers
into one of two categories based on their teaching style. Neither of the categories is
negative nor do they reflect any judgment or evaluation on their job performance. Upon
categorization, each class will be assigned a class number and teacher names will not be
part of this study.
Time Required
Participation in this study will require 15 to 20 minutes of your students’ time and 15 to
20 minutes of your time.
Risks
The investigator does not perceive more than minimal risks from your involvement in
this study (that is, no risks beyond the risks associated with everyday life).
Benefits
There are no direct benefits for the participants, although the knowledge gained will help improve school experiences for students and teachers.
Confidentiality
The results of this research will be presented at James Madison University classrooms
and may also be shared a professional conferences. The results of this project will be
coded in such a way that the respondent’s identity will not be attached to the final form of
this study. The researcher retains the right to use and publish non-identifiable data.
While individual responses are confidential, aggregate data will be presented representing
averages or generalizations about the responses as a whole. All data will be stored in a
secure location accessible only to the researcher. Upon completion of the study, all
information that matches up individual respondents with their answers will be destroyed.
Participation & Withdrawal
Your participation is entirely voluntary. You are free to choose not to participate.
Should you choose to participate, you can withdraw at any time without consequences of
any kind.

THE ACHIEVEMENT GAP AND STUDENTS LIVING IN POVERTY 71
Questions about the Study
If you have questions or concerns during the time of your participation in this study, or
after its completion or you would like to receive a copy of the final aggregate results of
this study, please contact:
India Harris Dary Erwin, Ph.D.
School of Strategic Leadership Studies School of Strategic Leadership Studies
James Madison University James Madison University
[email protected] Telephone: (540) 568-7020
Questions about Your Rights as a Research Subject
Dr. David Cockley
Chair, Institutional Review Board
James Madison University
(540) 568-2834
Giving of Consent
I have read this consent form and I understand what is being requested of me as a
participant in this study. I freely consent to participate. I have been given satisfactory
answers to my questions. The investigator provided me with a copy of this form. I
certify that I am at least 18 years of age.
______________________________________
Name of Participant (Printed)
______________________________________ ______________
Name of Participant (Signed) Date
______________________________________ ______________
Name of Researcher (Signed) Date
THE ACHIEVEMENT GAP AND STUDENTS LIVING IN POVERTY 72
Appendix B
Teacher Consent to Participate in Research
Identification of Investigators & Purpose of Study
You are being asked to participate in a research study conducted by India Harris from
James Madison University. The purpose of this study is to better understand how
teaching style impacts students. This information will help us create high quality staff
development opportunities for our teachers and successful intervention programs for
students. This study will also contribute to the researcher’s completion of her doctoral
course work.
Research Procedures
Should you decide to participate in this research study, you will be asked to sign this
consent form once all your questions have been answered to your satisfaction. This study
consists of a survey that will be administered to your students in your classroom or
school computer lab. Your principal will be asked to categorize you into one of two
categories based on your teaching style. Neither of the categories is negative nor do they
reflect any judgment or evaluation of your job performance. Upon categorization, your
class will be assigned a class number and your name will not be part of this study.
Time Required
Participation in this study will require 15 to 20 minutes/hours of your students’ time.
Risks
The investigator does not perceive more than minimal risks from your involvement in
this study (that is, no risks beyond the risks associated with everyday life).
Benefits
There are no direct benefits for the participants, although the knowledge gained will help improve school experiences for students and professional development for teachers.
Confidentiality
The results of this research will be presented in James Madison University classrooms
and may also be shared at professional conferences. The results of this project will be
coded in such a way that the respondent’s identity will not be attached to the final form of
this study. The researcher retains the right to use and publish non-identifiable data.
While individual responses are confidential, aggregate data will be presented representing
averages or generalizations about the responses as a whole. All data will be stored in a
secure location accessible only to the researcher. Upon completion of the study, all
information that matches up individual respondents with their answers will be destroyed.
Participation & Withdrawal
Your participation is entirely voluntary. You are free to choose not to participate.
Should you choose to participate, you can withdraw at any time without consequences of
any kind.

THE ACHIEVEMENT GAP AND STUDENTS LIVING IN POVERTY 73
Questions about the Study
If you have questions or concerns during the time of your participation in this study, or
after its completion or you would like to receive a copy of the final aggregate results of
this study, please contact:
India Harris Dary Erwin, Ph.D.
School of Strategic Leadership Studies School of Strategic Leadership Studies
James Madison University James Madison University
[email protected] Telephone: (540) 568-7020
Questions about Your Rights as a Research Subject
Dr. David Cockley
Chair, Institutional Review Board
James Madison University
(540) 568-2834
Giving of Consent
I have read this consent form and I understand what is being requested of me as a
participant in this study. I freely consent to participate. I have been given satisfactory
answers to my questions. The investigator provided me with a copy of this form. I
certify that I am at least 18 years of age.
______________________________________
Name of Participant (Printed)
______________________________________ ______________
Name of Participant (Signed) Date
______________________________________ ______________
Name of Researcher (Signed) Date

THE ACHIEVEMENT GAP AND STUDENTS LIVING IN POVERTY 74
Appendix C
Parent/Guardian Informed Consent
Identification of Investigators & Purpose of Study
Your child is being asked to participate in a research study conducted by India Harris
from James Madison University. The purpose of this study is to better understand how
teacher behaviors impact students. This information will help us create high quality staff
development opportunities for our teachers and effective intervention programs for
students. This study will also contribute to the researcher’s completion of her doctoral
course work.
Research Procedures
Should you decide to allow your child to participate in this research study, you will be
asked to sign this consent form once all your questions have been answered to your
satisfaction. Your child will also be asked to sign a consent form, which will be read and
discussed with him/her. This study consists of a survey that will be administered to
students in their current classroom. Your child will be asked to provide answers to a
series of questions related to their feelings about school and themselves. Standards of
Learning Test scores for math and reading from spring 2014 and 2015 will also be used
to measure academic performance. Demographic data (gender, race, lunch status) will
also be also accessed and used as part of this study. Your child’s identity will be
protected at all times and his/her name will not be used to collect information. Your
child’s Waynesboro Public Schools (WPS) student identification number will be
collected during the survey. This student number will be utilized to link your child’s
survey responses to his/her reading and math SOL scores and demographic (gender, race,
lunch status) information. Your child will be assigned a de-identifiable number, which
will replace his/her WPS student number once all data has been connected. All
identifying information will be destroyed once this process is complete.
Time Required
Participation in this study will require 15 to 20 minutes of your child’s time. The
researcher and school staff will work together to minimize any loss of instruction or
valued free time for your child.

THE ACHIEVEMENT GAP AND STUDENTS LIVING IN POVERTY 75
Risks
The investigator does not perceive more than minimal risks from your child’s
involvement in this study; however, the survey questions are related to your child’s self-
perceptions. It is possible a student could experience some stress. Students will be
closely monitored during the survey to ensure each child is comfortable. The survey will
be discontinued immediately if a child reports or shows any signs of being under stress.
The school guidance counselor will be available and you will be notified if your child
shows any signs of stress.
Benefits
There are no direct benefits for the participants, although the knowledge gained will help improve school experiences for students.
Confidentiality
Your child will be identified in the research records with a code number. The researcher
retains the right to use and publish non-identifiable data. When the results of this
research are published or discussed in conferences, no information will be included that
would reveal your child’s identity. All data will be stored in a secure location accessible
only to the researcher. Upon completion of the study, all information that matches up
individual respondents with their answers will be destroyed.
There is one exception to confidentiality we need to make you aware of. In certain
research studies, it is our ethical responsibility to report situations of child abuse, child
neglect, or any life-threatening situation to appropriate authorities. However, we are not
seeking this type of information in our study nor will you or your child be asked
questions about these issues.
Participation & Withdrawal
Your child’s participation is entirely voluntary. He/she is free to choose not to
participate. Should you and your child choose to participate, he/she can withdraw at any
time without consequences of any kind.
Questions about the Study
If you have questions or concerns during the time of your child’s participation in this
study, or after its completion or you would like to receive a copy of the final aggregate
results of this study, please contact:
India Harris Dary Erwin, Ph.D.
School of Strategic Leadership Studies School of Strategic Leadership Studies
James Madison University James Madison University
[email protected] Telephone: (540) 568-7020

THE ACHIEVEMENT GAP AND STUDENTS LIVING IN POVERTY 76
Questions about Your Rights as a Research Subject
Dr. David Cockley
Chair, Institutional Review Board
James Madison University
(540) 568-2834
Giving of Consent
I have read this consent form and I understand what is being requested of my child as a
participant in this study. I freely consent for my child to participate. I have been given
satisfactory answers to my questions. I certify that I am at least 18 years of age.
________________________________________________
Name of Child (Printed)
______________________________________
Name of Parent/Guardian (Printed)
______________________________________ ______________
Name of Parent/Guardian (Signed) Date
______________________________________ ______________
Name of Researcher (Signed) Date
THE ACHIEVEMENT GAP AND STUDENTS LIVING IN POVERTY 77
Appendix D
STUDENT ASSENT FORM
I would like to invite you to take part in a research study. I am asking you to complete a
short survey on the computer. This survey will describe the behavior and feelings of
some kids. You will be asked to choose if these behaviors or feelings are a lot like you,
like you, not like you, or not at all like you. Your responses will help us better
understand how fourth and fifth graders feel about themselves and about school.
Your parents have been asked to give their permission for you to take part in this study.
Please talk this over with your parents before you decide whether or not to participate.
You do not have to be in this study if you do not want to. If you decide to participate in
the study, you can stop answering questions at anytime. The researcher and your teacher
will work together to make sure that you do not miss important information or special
free time while you complete the survey.
If you have any questions at any time, please ask me.
IF YOU PRINT YOUR NAME ON THIS FORM IT MEANS THAT YOU HAVE
DECIDED TO PARTICIPATE AND HAVE READ EVERYTHING THAT IS ON THIS
FORM. YOU AND YOUR PARENTS WILL BE GIVEN A COPY OF THIS FORM TO
KEEP.
_______________________________________________ ___________________
Name of Child (printed) Date
_______________________________________________ ___________________
India Harris
301 Pine Avenue
Waynesboro, VA 22980
(540) 946-4600 ext. 45
Date
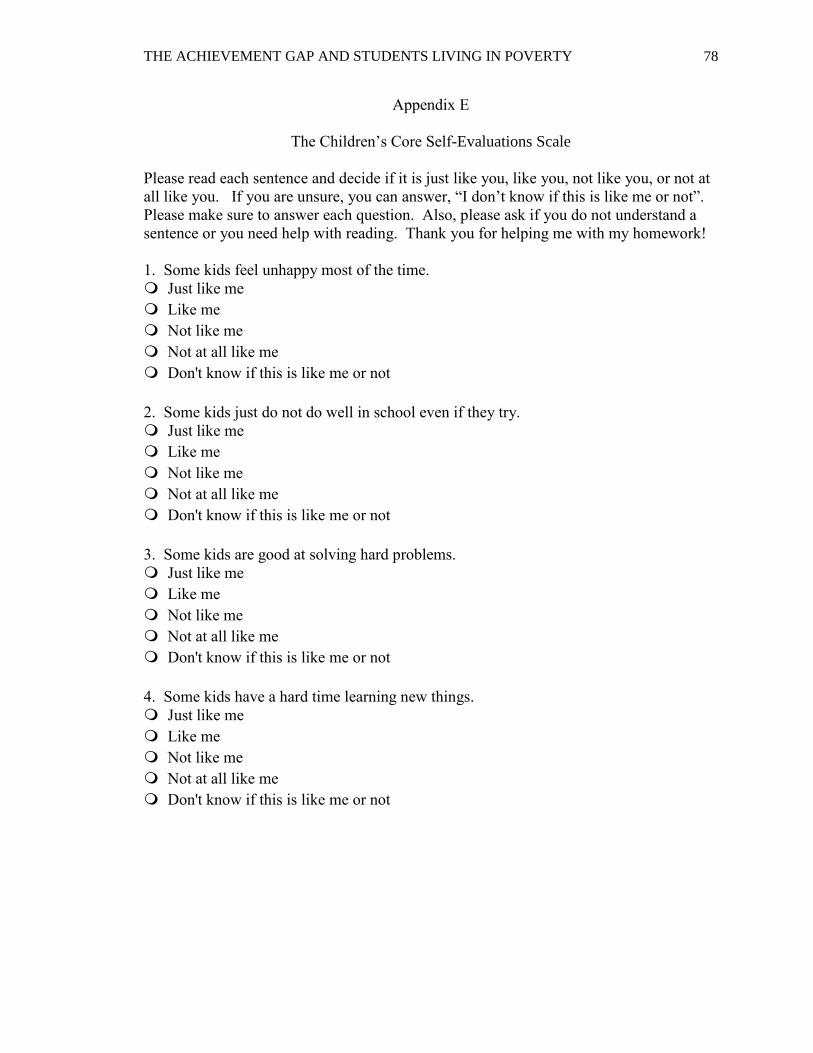
THE ACHIEVEMENT GAP AND STUDENTS LIVING IN POVERTY 78
Appendix E
The Children’s Core Self-Evaluations Scale
Please read each sentence and decide if it is just like you, like you, not like you, or not at
all like you. If you are unsure, you can answer, “I don’t know if this is like me or not”.
Please make sure to answer each question. Also, please ask if you do not understand a
sentence or you need help with reading. Thank you for helping me with my homework!
1. Some kids feel unhappy most of the time.
Just like me
Like me
Not like me
Not at all like me
Don't know if this is like me or not
2. Some kids just do not do well in school even if they try.
Just like me
Like me
Not like me
Not at all like me
Don't know if this is like me or not
3. Some kids are good at solving hard problems.
Just like me
Like me
Not like me
Not at all like me
Don't know if this is like me or not
4. Some kids have a hard time learning new things.
Just like me
Like me
Not like me
Not at all like me
Don't know if this is like me or not
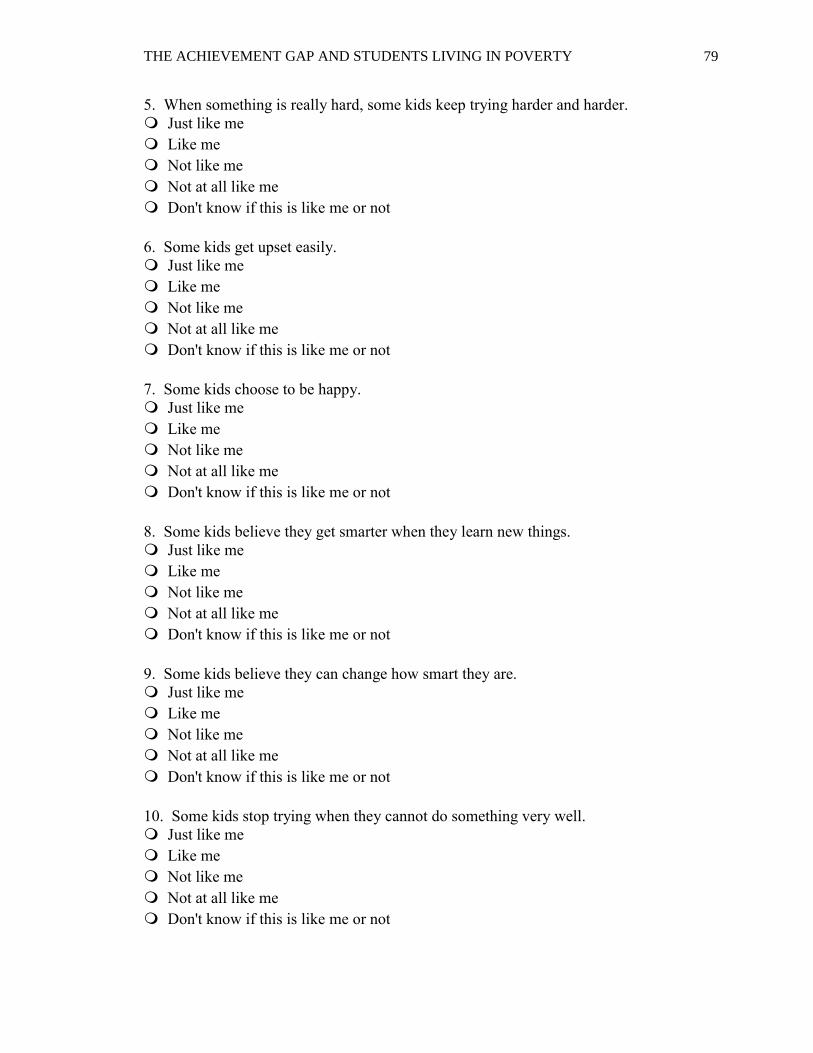
THE ACHIEVEMENT GAP AND STUDENTS LIVING IN POVERTY 79
5. When something is really hard, some kids keep trying harder and harder.
Just like me
Like me
Not like me
Not at all like me
Don't know if this is like me or not
6. Some kids get upset easily.
Just like me
Like me
Not like me
Not at all like me
Don't know if this is like me or not
7. Some kids choose to be happy.
Just like me
Like me
Not like me
Not at all like me
Don't know if this is like me or not
8. Some kids believe they get smarter when they learn new things.
Just like me
Like me
Not like me
Not at all like me
Don't know if this is like me or not
9. Some kids believe they can change how smart they are.
Just like me
Like me
Not like me
Not at all like me
Don't know if this is like me or not
10. Some kids stop trying when they cannot do something very well.
Just like me
Like me
Not like me
Not at all like me
Don't know if this is like me or not
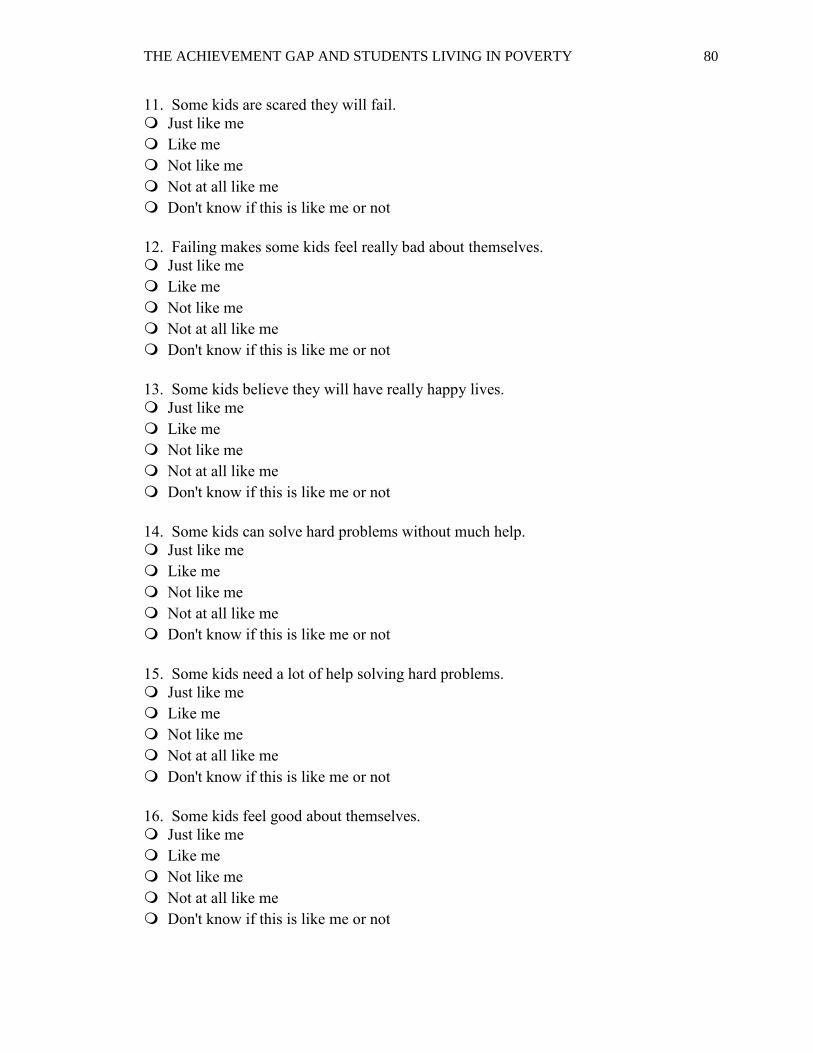
THE ACHIEVEMENT GAP AND STUDENTS LIVING IN POVERTY 80
11. Some kids are scared they will fail.
Just like me
Like me
Not like me
Not at all like me
Don't know if this is like me or not
12. Failing makes some kids feel really bad about themselves.
Just like me
Like me
Not like me
Not at all like me
Don't know if this is like me or not
13. Some kids believe they will have really happy lives.
Just like me
Like me
Not like me
Not at all like me
Don't know if this is like me or not
14. Some kids can solve hard problems without much help.
Just like me
Like me
Not like me
Not at all like me
Don't know if this is like me or not
15. Some kids need a lot of help solving hard problems.
Just like me
Like me
Not like me
Not at all like me
Don't know if this is like me or not
16. Some kids feel good about themselves.
Just like me
Like me
Not like me
Not at all like me
Don't know if this is like me or not

THE ACHIEVEMENT GAP AND STUDENTS LIVING IN POVERTY 81
17. Some kids are just not very smart.
Just like me
Like me
Not like me
Not at all like me
Don't know if this is like me or not
18. Some kids are afraid to try new things.
Just like me
Like me
Not like me
Not at all like me
Don't know if this is like me or not
19. Some kids make up their minds to do something and then do it.
Just like me
Like me
Not like me
Not at all like me
Don't know if this is like me or not
20. Some kids worry about almost everything.
Just like me
Like me
Not like me
Not at all like me
Don't know if this is like me or not
21. Some kids can handle their problems without much help.
Just like me
Like me
Not like me
Not at all like me
Don't know
Student Information
Please enter your lunch number.
Student Number ____________________

THE ACHIEVEMENT GAP AND STUDENTS LIVING IN POVERTY 82
Appendix F
Teacher categories vignettes
Teacher: Name______________________________
Alex
Alex is an excellent teacher, who is goal-oriented and works diligently to ensure
that goals are achieved. Alex sets realistic expectations for students and helps them
throughout the learning process. Alex leads a well-structured classroom and ensures
students understand the content. Alex tailors instruction, remediation, and enrichment
to match each student’s ability and current level of performance. Alex quickly responds
to students who are struggling academically or socially to fix the problem. Alex
sympathizes with students and tries to support them as much as possible. Alex cares
passionately about students and expresses this feeling with students, parents, and
colleagues.
Pat
Pat is an excellent teacher, who recognizes and understands the learning style of
each student and often incorporates student choice into learning. Pat empowers and
motivates students. Pat leads by example and establishes a calm and stable sense of
security for students. Pat fosters student autonomy and independence. When problems
occur, Pat expects students to take an active role in finding a solution. Pat challenges
students to strive for excellence and inspires creativity. Pat believes that a student can
reach goals with determination and hard work. Pat sets high expectations for students
and communicates with confidence that students will meet or exceed them.

THE ACHIEVEMENT GAP AND STUDENTS LIVING IN POVERTY 83
Appendix G
The Children’s Core Self-Evaluations Scale
(Updated Based on Scale Analysis)
Please read each sentence and decide if it is just like you, like you, not like you, or not at
all like you. If you are unsure, you can answer, “I don’t know if this is like me or not”.
Please make sure to answer each question. Also, please ask if you do not understand a
sentence or you need help with reading. Thank you for helping me with my homework!
1. Some kids feel unhappy most of the time.
Just like me
Like me
Not like me
Not at all like me
Don't know if this is like me or not
2. Some kids just do not do well in school even if they try.
Just like me
Like me
Not like me
Not at all like me
Don't know if this is like me or not
3. Some kids are good at solving hard problems.
Just like me
Like me
Not like me
Not at all like me
Don't know if this is like me or not
4. Some kids have a hard time learning new things.
Just like me
Like me
Not like me
Not at all like me
Don't know if this is like me or not
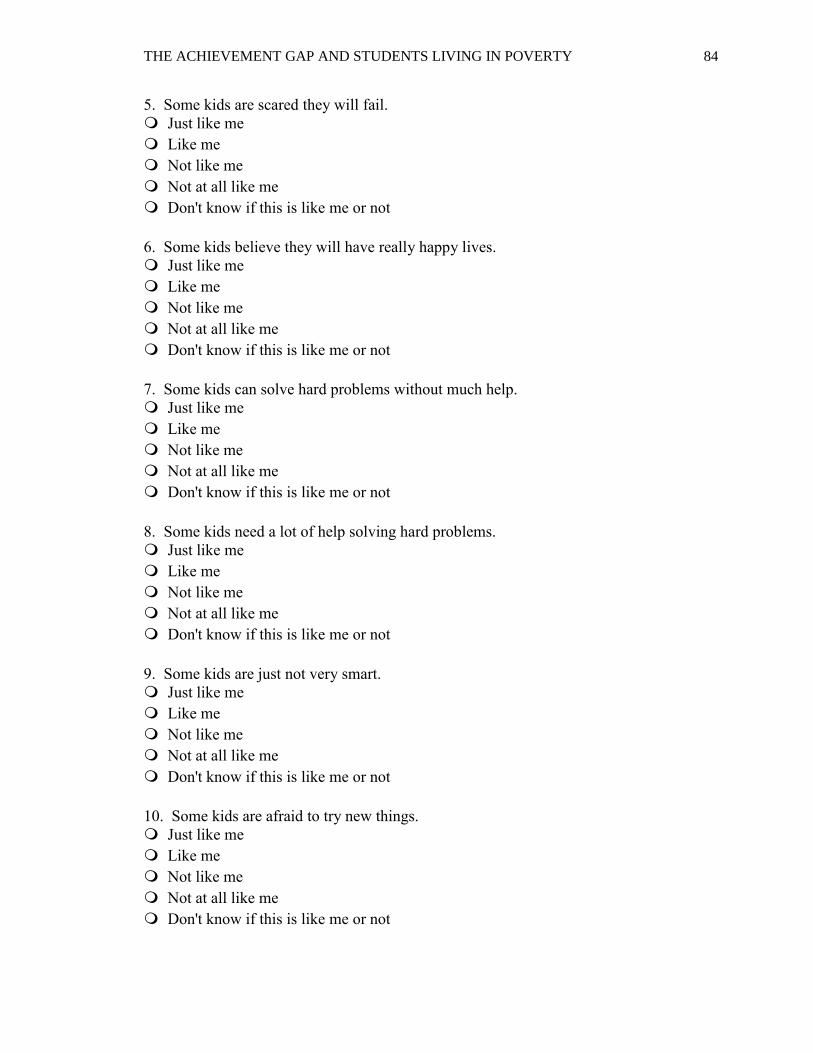
THE ACHIEVEMENT GAP AND STUDENTS LIVING IN POVERTY 84
5. Some kids are scared they will fail.
Just like me
Like me
Not like me
Not at all like me
Don't know if this is like me or not
6. Some kids believe they will have really happy lives.
Just like me
Like me
Not like me
Not at all like me
Don't know if this is like me or not
7. Some kids can solve hard problems without much help.
Just like me
Like me
Not like me
Not at all like me
Don't know if this is like me or not
8. Some kids need a lot of help solving hard problems.
Just like me
Like me
Not like me
Not at all like me
Don't know if this is like me or not
9. Some kids are just not very smart.
Just like me
Like me
Not like me
Not at all like me
Don't know if this is like me or not
10. Some kids are afraid to try new things.
Just like me
Like me
Not like me
Not at all like me
Don't know if this is like me or not

THE ACHIEVEMENT GAP AND STUDENTS LIVING IN POVERTY 85
11. Some kids make up their minds to do something and then do it.
Just like me
Like me
Not like me
Not at all like me
Don't know if this is like me or not
12. Some kids can handle their problems without much help.
Just like me
Like me
Not like me
Not at all like me
Don't know
Student Information
Please enter your lunch number.
Student Number ____________________

THE ACHIEVEMENT GAP AND STUDENTS LIVING IN POVERTY 86
References
American Psychological Association (2015). Effects of poverty, hunger, ND
homelessness on children and youth. Retrieved from:
http://www.apa.org/pi/families/poverty.aspx
Ayman, R. & Adams, S. (2012). Contingencies, context, situation, and leadership. . In
D.V. Day & J. Antonakis (Eds.) The nature of leadership (pp. 179-217). Los
Angeles, CA: Sage.
Bandura, A. (1989). Social cognitive theory. In R. Vasta (Ed.), Annals of child
development. Vol. 6. Six theories of child development (pp. 1-60). Greenwich,
CT: JAI Press. Retrieved from:
http://www.uky.edu/~eushe2/Bandura/Bandura1989ACD.pdf
Baron, R. & Kenny, D. (1986). The moderator-mediator variable distinction in social
psychological research: Conceptual, strategically, and statistical considerations.
Journal of Personality and Social Psychology, 51(6), 1173-1182
Bass, B. M. (1985). Leadership and performance beyond expectations. New York: The
Free Press.
Bass, B.M. (1990). From transactional to transformational leadership: Learning to share
the vision. Organizational Dynamics, 13(3), 26-40.
Bass, B.M. (1999). Two decades of research and development in transformational
leadership. European Journal of Work and Organizational Psychology, 8(1), 9-
32.
Berkman, E. (2015). It’s not a lack of self-control that keeps people poor. The Psych

THE ACHIEVEMENT GAP AND STUDENTS LIVING IN POVERTY 87
Report. Retrieved from: http://thepsychreport.com/society/its-not-a-lack-of-self-
control-that-keeps-people-poor/
Bollinger, L.C. (2014). Sixty years later, we need a new Brown. The New Yorker.
Retrieved from: http://www.newyorker.com/news/news-desk/sixty-years-later-
we-need-a-new-brown
Bono, J., Erez, A., Judge, T., & Thoreson, C. (2002). Are measures of self-esteem,
neuroticism, locus of control, and generalized self-efficacy indicators of a
common core construct? Journal of Personality and Social Psychology, 83 (3),
693–710.
Bono, J. & Judge, T. (2003). Core self-evaluations: A review of the trait and its role in
job satisfaction and job performance. European Journal of Personality, 17, 5–18.
Bono, J. & Judge, T. (2004). Personality and transformational and transactional
leadership: a meta-analysis. Journal of Applied Psychology, 89 (5), 901-910.
Boser, U. (2015). Separate and economically unequal: Lack of economic diversity in
schools is a problem that needs to be addressed. U.S. News. Retrieved from:
http://www.usnews.com/opinion/knowledge-bank/2015/06/17/separate-and-
economically-unequal-why-schools-need-socioeconomic-diversity
Bosler, R. & Bauman, D. J. (1992, June 2-7). Meeting cultural diversity with personal
conviction: The teacher as change agent and transformational leader. The
National Forum of the Association of Independent Liberal Arts Colleges,
Louisville, KY.
THE ACHIEVEMENT GAP AND STUDENTS LIVING IN POVERTY 88
Boyd, B. (2009). Using a case to develop the transformation teaching theory. Journal of
Leadership Education, 7 (3), 50-59. Retrieved from:
http://www.leadershipeducators.org/Resources/Documents/jole/2009_winter/JOL
E_7_3_Boyd.pdf
Brown, D. J. (2012). In the mind of followers. In D.V. Day & J. Antonakis (Eds.) The
nature of leadership (pp. 331-362). Los Angeles, CA: Sage.
Burns, J. M. (1978). Leadership. NY: Harper & Row.
Carlyle, T. (1840). On heroes, hero worship and the heroic in history. Retrieved from:
http://www.gutenberg.org/files/1091/1091-h/1091-h.htm
Carter, S. C. (2000). No excuses: Lessons from 21 high-performing, high-poverty
schools. Washington, DC: Heritage Foundation. Retrieved from:
http://files.eric.ed.gov/fulltext/ED440170.pdf
Cheng, Y. C. (1994). Teacher leadership style: A classroom-level study. Journal of
Educational Administration, 32, 54-71.
Child, D. (2016). Test Statistics Project. Retrieved from: https://readability-score.com/
Coley, R.J. & Baker, B. (2013). Poverty and the future: finding the way forward. The
ETS Center for Research on Human Capital and Education Retrieved from:
http://www.ets.org/s/research/pdf/poverty_and_education_report.pdf
Cotton, K. (1989). Expectations and student outcomes. School Improvement Series.
Retrieved from: http://educationnorthwest.org/sites/default/files/expectations-and-
student-outcomes.pdf

THE ACHIEVEMENT GAP AND STUDENTS LIVING IN POVERTY 89
Creswell, J. W. (2009). Research design: Qualitative, quantitative and mixed methods
approaches. Thousand Oaks, California. Sage Publishing.
Cuthrell, K., Stapleton, J., & Ledford, C. (2010). Examining the culture of poverty:
promising practices. Preventing School Failure, 54 (2), 104-110.
Elliott, E.S., & Dweck, C.S. (1988). Goals: An approach to motivation and achievement.
Journal of Personality and Social Psychology, 54, 5-12.
Evans & Casell (2013). Childhood poverty, cumulative risk exposure and mental health
in emerging adults Retrieved from:
http://cpx.sagepub.com/content/early/2013/09/26/2167702613501496.full.pdf+ht
ml
Day, D.V. & Antonakis, J. (2012). Leadership: past, present and future. In D.V. Day & J.
Antonakis (Eds.) The nature of leadership (pp. 3-25). Los Angeles, CA: Sage.
Dewey, J. (1938). Experience and Education. New York: The MacMillian Company.
Durham, C., Kluger, A. Locke, E., & Judge, T. (1998). Dispositional effects on job and
life satisfaction: The role of core evaluations. Journal of applied Psychology
83(1), 17-34.
Dusek, J.B., and Joseph, G. (1983). The bases of teacher expectancies: A meta-analysis."
Journal of Educational Psychology, 75, 327-346.

THE ACHIEVEMENT GAP AND STUDENTS LIVING IN POVERTY 90
Eccles, J. (1999). The development of children ages 6-14. When School Is Out, 9 (2) 30-
44.
Facteau, J. D. & Craig, S. B. (2001). Are performance appraisal ratings from different
rating sources comparable? Journal of Applied Psychology, 86 (2) 215-227.
Gardner, D. & Pierce, J. (2009). The core self-evaluation scale: Further construct
validation evidence. Educational and Psychological Measurement, 70 (2), 291-
304.
Givens, R. (2008). Transformational leadership: The impact on organizational and
personal outcomes. Emerging Leadership Journeys. 1(1), 4-24.
Gliner, J.A., Morgan, G.A., Leech, N.L. (2009). Research methods in applied settings:
An integrated approach to design and analysis. New York, NY: Routledge.
Good, T.L. (1987). Two decades of research on teacher expectations: Findings and future
directions. Journal of Teacher Education 38, 32-47.
Harris, A. (2005). Teacher leadership: More that just a feel good factor? Leadership and
Policy in Schools, 4: 201-219.
Harrison, J. L. (2011). Instructor transformational leadership and student outcomes.
Emerging Leadership Journeys, 4 (1), 82- 136.
Harter, S. (2012). Self-perception profile for children: Manual and questionnaires.
Retrieved from: file:///Users/iharris/Downloads/Self-
Perception%20Profile%20for%20Children%20(4).pdf

THE ACHIEVEMENT GAP AND STUDENTS LIVING IN POVERTY 91
Hattie, J. (2009). Visible learning: A synthesis of over 800 meta-analyses related to
achievement. New York, NY: Routledge.
Hoffmann, L. (2012). Computer science and the three r’s. Communications Of The
ACM, 55 (10), 17-19.
House, R. J., & Podsakoff, P. M. (1994). Leadership effectiveness: Past perspectives and
future directions for research.
Institute for Digital Research and Education (2016). SPSS statistical computing
workshop: Moderation and mediation using the Process macro. Retrieved from:
http://www.ats.ucla.edu/stat/spss/seminars/process_macro/process_training.htm
Invernizzi, M., Meier, J., & Juel, C. (2004). Phonological awareness literacy screening:
Technical reference. The Rector and The Board of Visitors of the University of
Virginia, 29-41. Retrieved from:
http://datacenter.spps.org/uploads/sotw_pals_tech_ref_for_grades_1-3_2.pdf
Judge, T. A., Bono, J.E., Ilies, R., & Gerhardt, M. (2002). Personality and leader-ship: A
qualitative and quantitative review. Journal of Applied Psychology, 89, 428-411.
Judge, T. A., Erez, A., Bono, J. E. & Thoreson, C. J. (2002). The core self-evaluation
scale: Development of a measure. Personnel Psychology, 56, 303-331
Judge, T. A., & Hurst, C. (2007). Capitalizing on one’s advantages: Role of core self-
evaluations, Journal of Applied Psychology, 92 (5), 1212-1227.
Judge, T. A. (2009). Core self- evaluations and work success. Current Directions in

THE ACHIEVEMENT GAP AND STUDENTS LIVING IN POVERTY 92
Psychological Science, 18(1), 58-62.
Judge T. A. & Kammeyer-Mueller J. (2011). Implications of core self-evaluations for a
changing organizational context. Human Resource Management Review. 21, 331-
341.
Judge, T. A. & Long, D. M. (2012). Individual differences in leadership. In D.V. Day &
J. Antonakis (Eds.) The nature of leadership (pp. 179-217). Los Angeles, CA:
Sage.
Judge, T. A. & Piccolo, R. F. (2004). Transformational and transactional leadership: A
meta-analytic test of their relative validity. Journal of Applied Psychology, 89(5),
755-768.
Judge, T. A., Woolf, E. F., Hurst, C., & Livingston, B. (2008). Leadership. In Barling
(Ed) Organizational behavior handbook (pp. 334-352) Retrieved from:
http://www.timothy-judge.com/5124-Barling-Ch18.pdf
Kammeyer- Mueller, J. D, Judge, T.A., & Scott, B.A. (2009). The role of core self-
evaluations in the coping process. Journal of Applied Psychology, 94 (1) 177-
195.
Katz, M. S. (1976). A history of compulsory education laws. No. 75. Bicentennial Series.
Bloomington, IN: Phi Delta Kappa Education Foundation.
Keeping kids in school: What research tells us about preventing dropouts. (2007).
Retrieved from the Center for Public Education website:

THE ACHIEVEMENT GAP AND STUDENTS LIVING IN POVERTY 93
http://www.centerforpubliceducation.org/Main-Menu/Staffingstudents/Keeping-
kids-in-school-At-a-glance/Keeping-kids-in-school-Preventing-dropouts.html
Kilty, K. M. (2015). Fifty years later: Access to education as an avenue out of poverty,
Journal of Poverty, 19(3), 324-329
Kuchinke, K. (1999). Workforce education faculty as leaders: do graduate-level
university instructors exhibit transformational leadership behaviors? Journal of
Vocational Education Research, 24(4), 209-25.
Ladner, M., LeFevre, A. T., & Lips, D. (2010). Report card on American education:
Ranking state k-12 performance, progress, and reform. Retrieved from:
http://www.alec.org/docs/2010-report-card_finalcopycondensed.pdf
Marks, H. M., & Printy, S. M. (2003). Principal leadership and school performance: An
inte- gration of transformational and instructional leadership. Educational
Administration Quarterly, 39(3), 370-397.
Marzano, R. J., Pickering, D.J., & Pollock, J. E. (2001). Classroom instruction that
works: Research-based strategies for increasing student achievement. Alexandria,
VA: McREL.
Mayers, A. (2013). Introduction to statistics in SPSS in psychology: Multivariate
Analyses. New York, NY: Pearson PLC
Menchaca, V. D., & Ruiz-Escalante, J. A. (1995). Instructional strategies for migrant
students. ERIC Digest. Charleston, WV: ERIC Clearinghouse on Rural Education

THE ACHIEVEMENT GAP AND STUDENTS LIVING IN POVERTY 94
and Small Schools. Retrieved from: http://www.ericdigests.org/2001-
3/migrant.htm
Midgley, C., Feldlaufer, H., & Eccles, J. S. (1989). Change in teacher efficacy and
student self-and task-related beliefs in mathematics during the transition to junior
high school. Journal of Educational Psychology, 81, 247–258. Retrieved from:
http://rcgd.isr.umich.edu/garp/articles/midgley89.pdf
Money, J. (2014). Study: Pygmalion effect links teacher expectations to student success.
Retrieved from:
http://blogs.edweek.org/teachers/teaching_now/2014/10/pygmalion_effect_links_t
eacher_expectations_to_student_success.html
Multon, K. D., Brown, S. D., & Lent, R. W. (1991). Relation of self- efficacy beliefs to
academic outcomes: A meta-analytic investigation. Journal of Counseling
Psychology, 38, 30–38.
Niell, J. (2016). Exploratory factor analysis: Survey research and design in psychology.
Retrieved from: http://www.slideshare.net/jtneill/exploratory-factor-analysis
Niell, J. (2008). Writing up a factor analysis. Creative Commons Attribution. Retrieved
from:
http://www.bwgriffin.com/gsu/courses/edur9131/content/Neill2008_WritingUpA
FactorAnalysis.pdf

THE ACHIEVEMENT GAP AND STUDENTS LIVING IN POVERTY 95
Nye, B., Konstantopoulos, S., & Hedges, L. V. (2004). How large are teacher effects?
Educational Evaluation and Policy Analysis, 26(3), 237-257.
Payne, R. K. (2005). A framework for understanding poverty (4th ed.). Highlands, TX:
aha! Process.
Popp, P.A., Grant, W.G., & Stronge, J.H. (2011). Effective teachers for at-risk or highly
mobile students: what are the dispositions and behaviors of award winning
teachers? Journal of Education for Students Placed at Risk, 16: 275-291
Preacher, K.J. & Hayes A. F. (2004). SPSS SAS procedures for measuring indirect
effects in simple mediation models. Behavior, Research Methods, Instruments, &
Computers, 36 (4), 717- 731.
Preacher, K.J., Rucker, D.D., & Hayes, A.F. (2007). Assessing moderated mediation
hypotheses: theory, methods, and prescriptions. Multivariate Behavioral
Research, 42, 185–227.
Reardon, S. F., Yun, J. T., & Kurlaender, M. (2006). Implications of income-based
school assignment policies for racial school segregation. Educational Evaluation
& Policy Analysis, 28(1), 49-75.
Reeves, D. B. (2008) Leadership and learning. The William Walker Oration, The
Australian Council for Educational Leaders. The ACEL Monograph, 43, 3-21.
Repka, M. (2013). Enduring the damage: the effects of childhood poverty on adults.
Chicago Policy Review. Retrieved from:

THE ACHIEVEMENT GAP AND STUDENTS LIVING IN POVERTY 96
http://chicagopolicyreview.org/2013/11/27/enduring-damage-the-effects-of-
childhood-poverty-on-adult-health/
Robinson, V.M. J., Lloyd, C.A., & Rowe, K.J. (2008). Leadership on student outcomes:
An analysis of the differential effects of leadership types. Educational
Administration Quarterly, 44, 635-674.
Rockwell, S. (2006). Facilitating the fourth r: Resilience. Kappa Delta Pi Record, 43(1),
14–19. Retrieved from:
http://www.tandfonline.com/doi/pdf/10.1080/00228958.2006.10516453
Ross, J.A. (2006) The reliability, validity, and utility of self-assessment. Practical
Assessment, Research, & Evaluation 11, (10) 1-13.
Rumberger, R. W. (2013). Poverty and dropouts. American Psychological Association.
Retrieved from: http://www.apa.org/pi/ses/resources/indicator/2013/05/poverty-
dropouts.aspx
Sanders, W. L. & Horn, S. P. (1994) The Tennessee value-added assessment system
(TVAAS): Mixed-model methodology in educational assessment. Journal of
Personnel Evaluation in Education, 8, 299-311.
Schinkel, S., Van Dierendonck, D., & Anderson, N. (2004). The impact of selection
encounters on applicants: An experimental study into feedback effects after a
negative selection decision. International Journal of Selection and Assessment,
THE ACHIEVEMENT GAP AND STUDENTS LIVING IN POVERTY 97
12, 197–205. Retrieved from: http://dx.doi.org/10.1111/j.0965-
075X.2004.00274.x.
Schrieshiem, C. A. & Schrieshiem, J. F. (1980). A test of path-goal theory: The long and
winding road. The Leadership Quarterly, 7, 317-321.
Semuels, A. (2014). A different approach to breaking the cycle of poverty. The Atlantic.
Retrieved from: http://www.theatlantic.com/business/archive/2014/12/a-different-
approach-to-breaking-the-cycle-of-poverty/384029/
Sinha, S. P. & Gupta, S. (2006). State self-esteem and causal attribution in reattribution
training among self-worth protective students. Journal of the Indian Academy of
Applied Psychology, 32 (3), 145-151.
Stronge, J. H., Ward, T. J., Tucker, P. D., & Hindman, J. L. (2008). What is the
relationship between teacher quality and student achievement? An exploratory
study. Journal of Personnel Evaluation in Education, 20(3-4), 165-184.
Tabachnick, B. G. & Fidell, L. S. (2013). Using multivariate statistics (6th ed.). Upper
Saddle River, NJ: Pearson Education Inc.
Trochim, W. M. (2006). Types of reliability. Research methods knowledge base.
Retrieved from: http://www.socialresearchmethods.net/kb/reltypes.php
Walls, C. A. (2003). Providing highly mobile students with an effective education. New
York: ERIC Clearinghouse on Urban Education. Retrieved from:
http://iume.tc.columbia.edu/i/a/document/15763_Digest_191.pdf
THE ACHIEVEMENT GAP AND STUDENTS LIVING IN POVERTY 98
Watson, S. (2008). How public schools work. HowStuffWorks.com. Retrieved from:
http://people.howstuffworks.com/public-schools.htm
Weisberg, D., Sexton, S., Mulhern, J., & Keeling, D. (2009). The widget effect: Our
national failure to acknowledge and act on differences in teacher effectiveness.
Retrieved from www.widgeteffect.org
Wise, B. (2010). The online learning imperative: a solution to three looming crises in
education. Education Digest, 76(3), 52.
Wofford, J. C. & Liska, L. Z. (1993). Path-goal theories of leadership: A meta-analysis.
Journal of Management, 19, 857-876.
Wright, S. P., Horn, S. P., & Sanders, W. L. (1997). Teacher and classroom context
effects on student achievement: Implications for teacher evaluation. Journal of
Personnel Evaluation in Education, 11, 57–67.
Zhu, W., Sosik, J.J., Riggio, R.E., & Yang, B. (2012). Relationship between
transformational and active transactional leadership and followers organizational
identification: The role of psychological empowerment. Institute of Behavioral
and Applied Management (186-212).


![Achievement Gap[1]](https://static.fdocuments.net/doc/165x107/55842058d8b42aa81e8b4931/achievement-gap1-5584b8761200b.jpg)