The 2013 Biopharma Value Creators Report...Mark Lubkeman, Ulrik Schulze, Michael Ringel, André...
20
The 2013 Biopharma Value Creators Report Key Imperatives for Sustaining the Sector’s Resurgence
Transcript of The 2013 Biopharma Value Creators Report...Mark Lubkeman, Ulrik Schulze, Michael Ringel, André...

The 2013 Biopharma Value Creators ReportKey Imperatives for Sustaining the Sector’s Resurgence

The Boston Consulting Group (BCG) is a global management consulting firm and the world’s leading advisor on business strategy. We partner with clients from the private, public, and not-for-profit sectors in all regions to identify their highest-value opportunities, address their most critical challenges, and transform their enterprises. Our customized approach combines deep in sight into the dynamics of companies and markets with close collaboration at all levels of the client organization. This ensures that our clients achieve sustainable compet itive advantage, build more capable organizations, and secure lasting results. Founded in 1963, BCG is a private company with 81 offices in 45 countries. For more information, please visit bcg.com.
January 2014
Mark Lubkeman, Ulrik Schulze, Michael Ringel, André Kronimus, and Falk Bielesch
The 2013 Biopharma Value Creators Report Key Imperatives for Sustaining the Sector’s Resurgence

2 The 2013 Biopharma Value Creators Report
AT A GLANCE
After a decade of lagging the overall stock market, the biopharmaceutical sector has created significant value for investors since 2010, thanks to revamped R&D models, reduced operating costs, and attractive fundamentals. BCG analyzed the factors driving value creation within the sector, and the results point to several clear imperatives for generating sustainable value.
Maximize Growth from Current ProductsCompanies need to apply a comprehensive set of commercial-excellence initiatives across their existing products and enhance their commercial capabilities to better meet the needs of large customers such as hospital chains and health systems.
Focus the R&D PipelineCompanies should focus relentlessly on a smaller number of truly promising molecules in markets where they can clearly win—by being either “first in class” or “best in class.”
Prepare for a Value-Based Health-Care EnvironmentPayers and investors will increasingly reward companies that demonstrate superior, cost-effective outcomes for patients. Delivering those outcomes will be critical for all biopharma companies.

The Boston Consulting Group 3
Success in value creation lies within management teams’ control and depends on truly effective strategic choices and flawless execution.
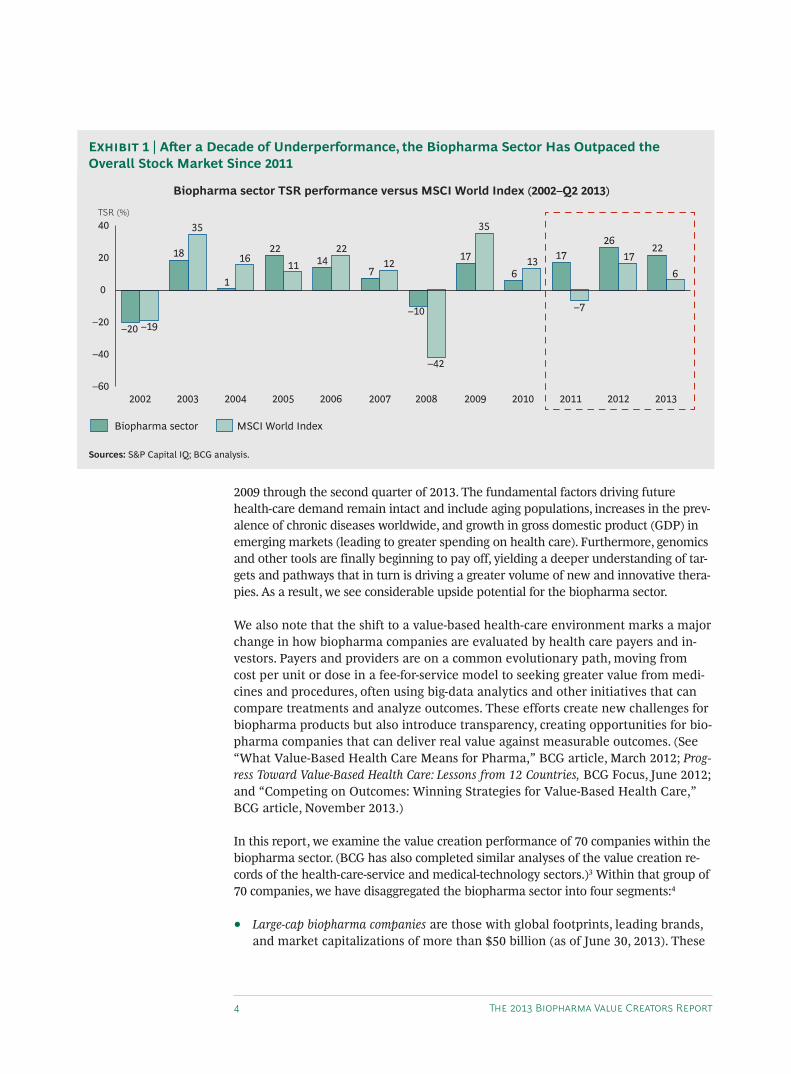
In the period from 2002 through 2010, the biopharmaceutical sector significant-ly underperformed the benchmark MSCI World Index, as measured by total
shareholder return (TSR).1 The sector lagged in seven of those nine years, by as much as 18 percentage points—though, thanks to its defensive nature and strong dividends, it beat the overall market during the financial crisis in 2008 and 2009.
The explanation for such poor performance is well known. Many companies in the biopharma sector were richly valued in the early 2000s, as a consequence of unreal-istic optimism about their growth prospects. In addition, their operating costs were high. When many of the industry’s blockbuster drugs began to lose patent protec-tion, cost pressures and the need for increased R&D productivity drove critical scru-tiny of biopharma companies, and investors lost confidence in the sector.
In 2008 and 2009, several biopharma companies began taking decisive measures to improve their operational and financial performance. Companies trimmed their R&D pipelines and rationalized their R&D models to become more productive. They reduced their costs, particularly in commercial and back-office functions, and pursued growth in emerging markets. In addition, the first major “patent cliff,” which occurred in 2011 and 2012, passed, and many biopharma companies were able to add promising new projects to their R&D pipelines.
Advances in discovery and development began to pay off; for example, drugs against targets revealed through genome-wide association studies (GWAS)—such as CFTR in cystic fibrosis and PCSK9 in dyslipidemia—began to reach the market. As a result, in-vestors regained their confidence in biopharma companies, and the sector significant-ly outperformed the MSCI World Index from 2011 through 2013.2 (See Exhibit 1.)
Is this resurgence a short-term spike or a more sustainable shift in value creation performance? Although the biopharma sector is currently outperforming the mar-ket, biopharma companies’ performance continues to exhibit extreme variance. We conclude that value creation is fundamentally a matter of individual company ef-forts, rather than “riding the rising tide” of an attractive sector. For management teams, success in value creation lies within their own control and depends on truly effective strategic choices and flawless execution.
The Drivers of Biopharma Value CreationTo identify the specific actions that companies can take to ensure sustainable value cre-ation at current levels, we analyzed the factors behind biopharma value creation from
4 The 2013 Biopharma Value Creators Report
2009 through the second quarter of 2013. The fundamental factors driving future health-care demand remain intact and include aging populations, increases in the prev-alence of chronic diseases worldwide, and growth in gross domestic product (GDP) in emerging markets (leading to greater spending on health care). Furthermore, genomics and other tools are finally beginning to pay off, yielding a deeper understanding of tar-gets and pathways that in turn is driving a greater volume of new and innovative thera-pies. As a result, we see considerable upside potential for the biopharma sector.
We also note that the shift to a value-based health-care environment marks a major change in how biopharma companies are evaluated by health care payers and in-vestors. Payers and providers are on a common evolutionary path, moving from cost per unit or dose in a fee-for-service model to seeking greater value from medi-cines and procedures, often using big-data analytics and other initiatives that can compare treatments and analyze outcomes. These efforts create new challenges for biopharma products but also introduce transparency, creating opportunities for bio-pharma companies that can deliver real value against measurable outcomes. (See “What Value-Based Health Care Means for Pharma,” BCG article, March 2012; Prog-ress Toward Value-Based Health Care: Lessons from 12 Countries, BCG Focus, June 2012; and “Competing on Outcomes: Winning Strategies for Value-Based Health Care,” BCG article, November 2013.)
In this report, we examine the value creation performance of 70 companies within the biopharma sector. (BCG has also completed similar analyses of the value creation re-cords of the health-care-service and medical-technology sectors.)3 Within that group of 70 companies, we have disaggregated the biopharma sector into four segments:4
• Large-cap biopharma companies are those with global footprints, leading brands, and market capitalizations of more than $50 billion (as of June 30, 2013). These
–60
–40
–20
0
20
4026
–7
17
2010
136
2009
35
17
2008
–42
–10
2007
127
2011
2214
2005
1122
2004
16
1
2003
35
20132002
–19–20
TSR (%)
2006 2012
6
221718
MSCI World Index
Biopharma sector
Biopharma sector TSR performance versus MSCI World Index (2002–Q2 2013)
Sources: S&P Capital IQ; BCG analysis.
Exhibit 1 | After a Decade of Underperformance, the Biopharma Sector Has Outpaced the Overall Stock Market Since 2011

The Boston Consulting Group 5
include established companies such as AstraZeneca, Pfizer, and Roche, as well as newer players such as Amgen, Gilead Sciences, and Biogen Idec.
• Midsize biopharma companies are those with market capitalizations from $10 billion to $50 billion. In general, these companies have already branched out into multiple therapeutic areas (TAs) but are not as large or diversified as the first group. Exam-ples include Alexion, Regeneron Pharmaceuticals, and Vertex Pharmaceuticals.
• Emerging biopharma companies are those with market capitalizations of less than $10 billion and focus very narrowly on a small number of TAs—or just one. Examples include Ariad Pharmaceuticals, Medivation, and Pharmacyclics.
• Generics companies generate at least 60 percent of their sales from off-patent, generic medications. Companies including Hospira, Mylan, Ranbaxy Laborato-ries, and Teva fall into this category.
For each of these four segments, we looked at the key drivers of value creation over the nearly five-year period from 2009 through the second quarter of 2013. These drivers include operational factors (sales growth and margin change), investor ex-pectations (change in valuation multiples), and financial policies (dividend yield, change in the number of shares, and change in net debt).
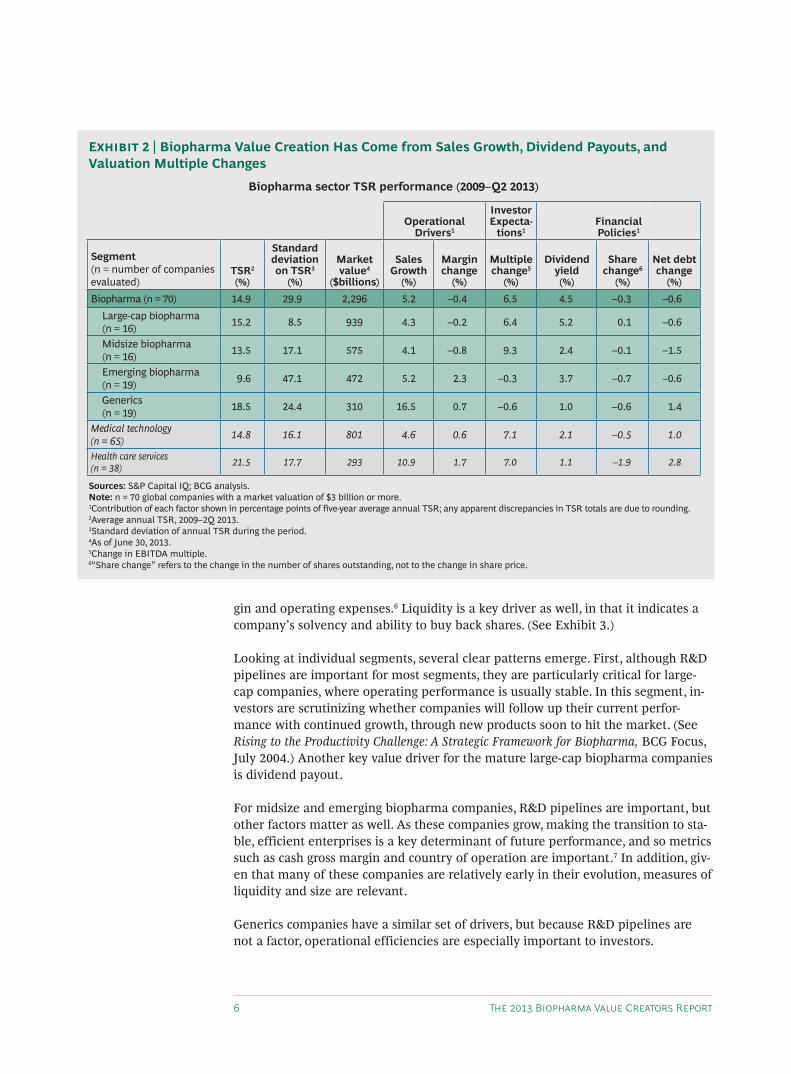
In the aggregate, the 70 biopharma companies that we analyzed generated average annual TSR of 14.9 percent from 2009 through the second quarter of 2013. Of that total, the biggest drivers for the overall sector were changes in the valuation multi-ple (contributing 6.5 percent), sales growth (contributing 5.2 percent), and dividend yield (contributing 4.5 percent). The remaining three drivers actually reduced TSR during this period. (See Exhibit 2.)
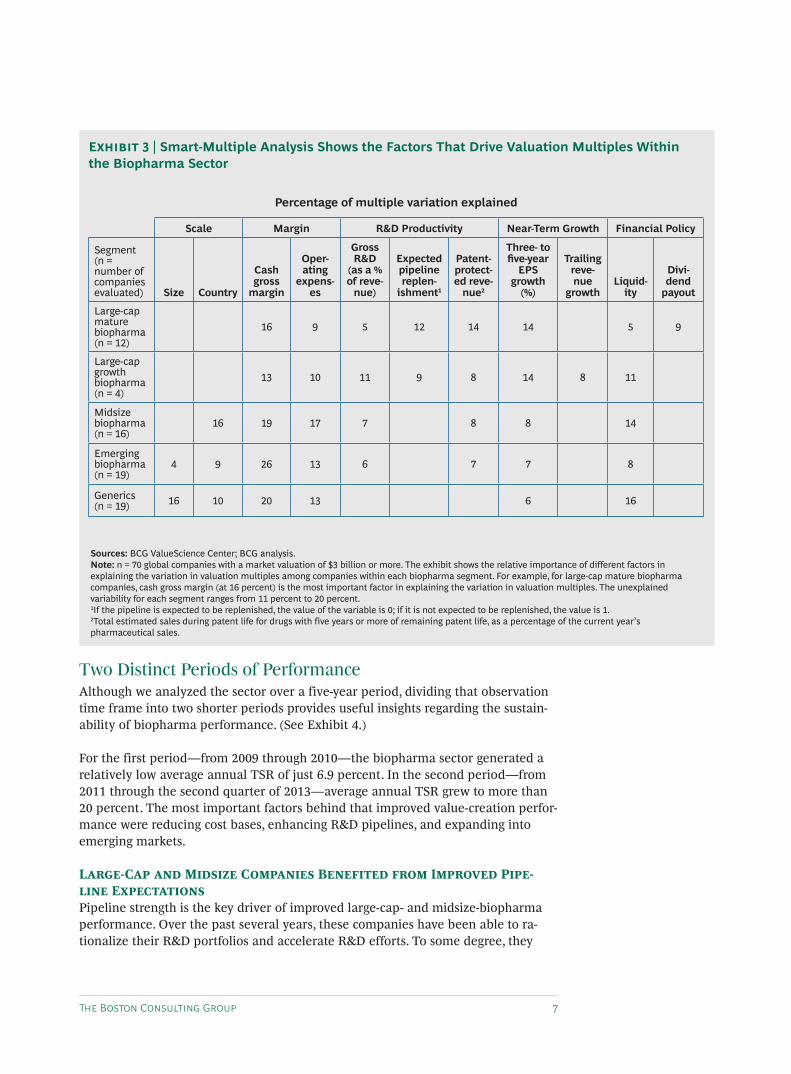
Key Drivers of Valuation MultiplesTo better understand the drivers of investors’ future expectations, we also applied The Boston Consulting Group’s proprietary “smart multiple” methodology, which empirically identifies the drivers of valuation multiples—that is, how investors view the future prospects of companies in the sector.5 This methodology explains rough-ly 80 percent of the variation in multiples for a given segment, and it provides criti-cal insights for companies seeking to improve their value-creation performance.
To conduct our smart-multiple analysis, we further divided the group of large-cap biopharma players into two subcategories based on their financial-management strategy and dividend policy: “mature” and “growth” companies. Large-cap mature companies are well-known, established players that pay attractive dividends to maintain investor interest. Examples include AstraZeneca, Eli Lilly, and Pfizer. Large-cap growth companies are those that are growth-oriented and pay little or no dividends. Of the group we analyzed, just four companies fit this profile: Biogen Idec, Celgene, Gilead Sciences, and Novo Nordisk.
What are the biggest drivers of valuation multiples for biopharma? Across all four segments, operational efficiency is a large contributor, specifically cash gross mar-
The 70 biopharma companies that we analyzed generated 14.9 percent average annual TSR from 2009 through the second quarter of 2013.
6 The 2013 Biopharma Value Creators Report
gin and operating expenses.6 Liquidity is a key driver as well, in that it indicates a company’s solvency and ability to buy back shares. (See Exhibit 3.)
Looking at individual segments, several clear patterns emerge. First, although R&D pipelines are important for most segments, they are particularly critical for large-cap companies, where operating performance is usually stable. In this segment, in-vestors are scrutinizing whether companies will follow up their current perfor-mance with continued growth, through new products soon to hit the market. (See Rising to the Productivity Challenge: A Strategic Framework for Biopharma, BCG Focus, July 2004.) Another key value driver for the mature large-cap biopharma companies is dividend payout.
For midsize and emerging biopharma companies, R&D pipelines are important, but other factors matter as well. As these companies grow, making the transition to sta-ble, efficient enterprises is a key determinant of future performance, and so metrics such as cash gross margin and country of operation are important.7 In addition, giv-en that many of these companies are relatively early in their evolution, measures of liquidity and size are relevant.
Generics companies have a similar set of drivers, but because R&D pipelines are not a factor, operational efficiencies are especially important to investors.
Sources: S&P Capital IQ; BCG analysis.Note: n = 70 global companies with a market valuation of $3 billion or more.1Contribution of each factor shown in percentage points of five-year average annual TSR; any apparent discrepancies in TSR totals are due to rounding.2Average annual TSR, 2009–2Q 2013. 3Standard deviation of annual TSR during the period.4As of June 30, 2013.5Change in EBITDA multiple.6“Share change” refers to the change in the number of shares outstanding, not to the change in share price.
Exhibit 2 | Biopharma Value Creation Has Come from Sales Growth, Dividend Payouts, and Valuation Multiple Changes
Biopharma sector TSR performance (2009–Q2 2013)
Operational Drivers1
Investor Expecta-
tions1Financial Policies1
Segment (n = number of companies evaluated)
TSR2 (%)
Standard deviation on TSR3
(%)
Market value4
($billions)
Sales Growth
(%)
Margin change
(%)
Multiple change5
(%)
Dividend yield(%)
Share change6
(%)
Net debt change
(%)Biopharma (n = 70) 14.9 29.9 2,296 5.2 –0.4 6.5 4.5 –0.3 –0.6
Large-cap biopharma (n = 16) 15.2 8.5 939 4.3 –0.2 6.4 5.2 0.1 –0.6
Midsize biopharma (n = 16) 13.5 17.1 575 4.1 –0.8 9.3 2.4 –0.1 –1.5
Emerging biopharma (n = 19) 9.6 47.1 472 5.2 2.3 –0.3 3.7 –0.7 –0.6
Generics (n = 19) 18.5 24.4 310 16.5 0.7 –0.6 1.0 –0.6 1.4
Medical technology (n = 65) 14.8 16.1 801 4.6 0.6 7.1 2.1 –0.5 1.0
Health care services (n = 38) 21.5 17.7 293 10.9 1.7 7.0 1.1 –1.9 2.8
The Boston Consulting Group 7
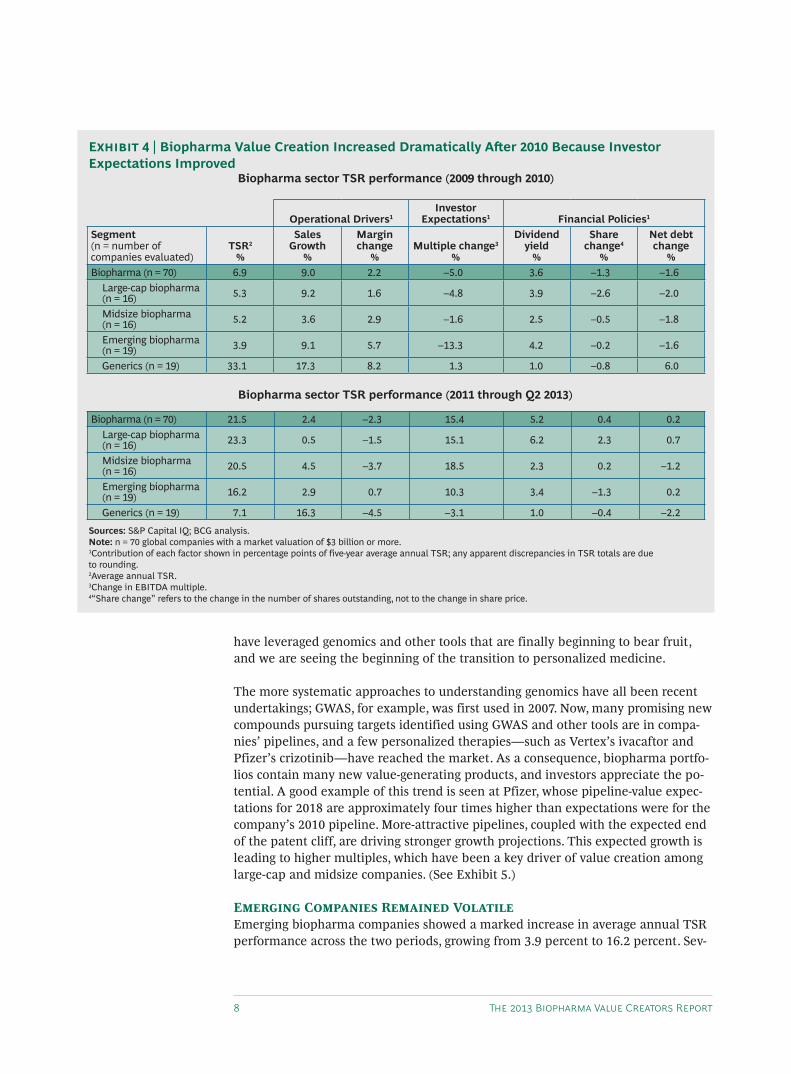
Two Distinct Periods of PerformanceAlthough we analyzed the sector over a five-year period, dividing that observation time frame into two shorter periods provides useful insights regarding the sustain-ability of biopharma performance. (See Exhibit 4.)
For the first period—from 2009 through 2010—the biopharma sector generated a relatively low average annual TSR of just 6.9 percent. In the second period—from 2011 through the second quarter of 2013—average annual TSR grew to more than 20 percent. The most important factors behind that improved value-creation perfor-mance were reducing cost bases, enhancing R&D pipelines, and expanding into emerging markets.
Large-Cap and Midsize Companies Benefited from Improved Pipe-line ExpectationsPipeline strength is the key driver of improved large-cap- and midsize-biopharma performance. Over the past several years, these companies have been able to ra- tionalize their R&D portfolios and accelerate R&D efforts. To some degree, they
Sources: BCG ValueScience Center; BCG analysis.Note: n = 70 global companies with a market valuation of $3 billion or more. The exhibit shows the relative importance of different factors in explaining the variation in valuation multiples among companies within each biopharma segment. For example, for large-cap mature biopharma companies, cash gross margin (at 16 percent) is the most important factor in explaining the variation in valuation multiples. The unexplained variability for each segment ranges from 11 percent to 20 percent.1If the pipeline is expected to be replenished, the value of the variable is 0; if it is not expected to be replenished, the value is 1. 2Total estimated sales during patent life for drugs with five years or more of remaining patent life, as a percentage of the current year’s pharmaceutical sales.
Exhibit 3 | Smart-Multiple Analysis Shows the Factors That Drive Valuation Multiples Within the Biopharma Sector
Percentage of multiple variation explained
Scale Margin R&D Productivity Near-Term Growth Financial Policy
Segment(n = number of companies evaluated) Size Country
Cash gross
margin
Oper-ating
expens-es
Gross R&D
(as a % of reve-
nue)
Expected pipeline replen-
ishment1
Patent- protect-ed reve-
nue2
Three- to five-year
EPS growth
(%)
Trailing reve-nue
growthLiquid-
ity
Divi-dend
payout
Large-cap mature biopharma (n = 12)
16 9 5 12 14 14 5 9
Large-cap growth biopharma (n = 4)
13 10 11 9 8 14 8 11
Midsize biopharma (n = 16)
16 19 17 7 8 8 14
Emerging biopharma (n = 19)
4 9 26 13 6 7 7 8
Generics (n = 19) 16 10 20 13 6 16
8 The 2013 Biopharma Value Creators Report
have leveraged genomics and other tools that are finally beginning to bear fruit, and we are seeing the beginning of the transition to personalized medicine.
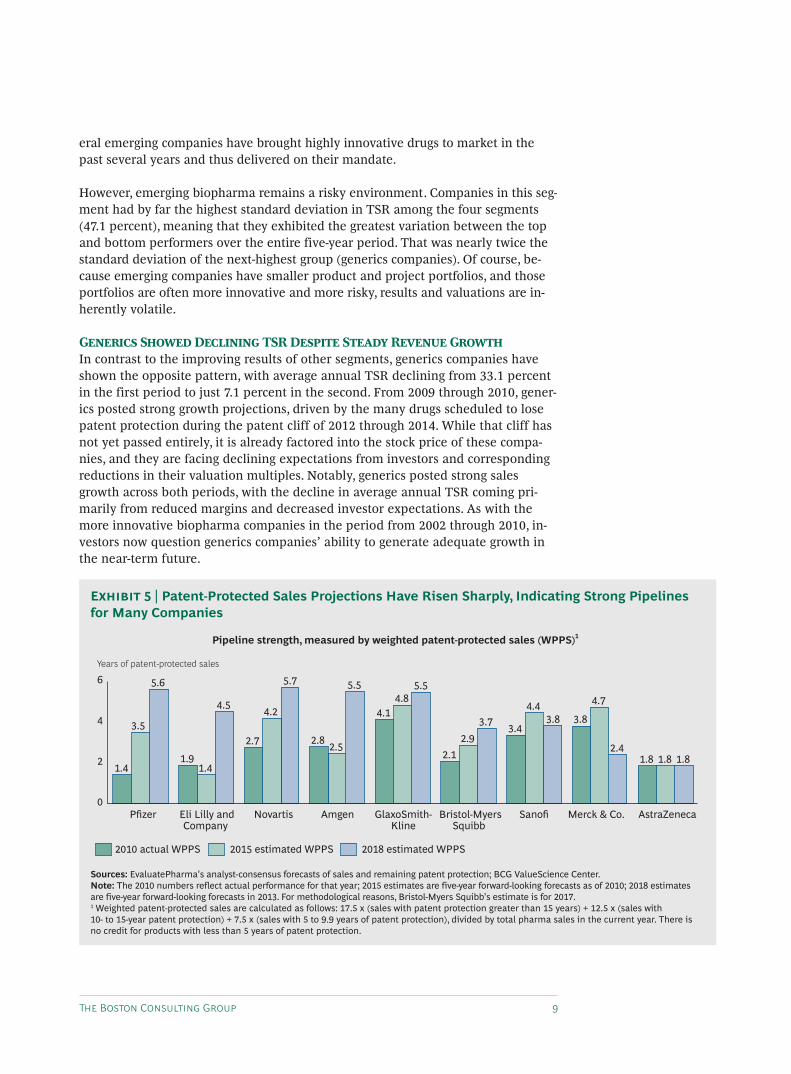
The more systematic approaches to understanding genomics have all been recent undertakings; GWAS, for example, was first used in 2007. Now, many promising new compounds pursuing targets identified using GWAS and other tools are in compa-nies’ pipelines, and a few personalized therapies—such as Vertex’s ivacaftor and Pfizer’s crizotinib—have reached the market. As a consequence, biopharma portfo-lios contain many new value-generating products, and investors appreciate the po-tential. A good example of this trend is seen at Pfizer, whose pipeline-value expec-tations for 2018 are approximately four times higher than expectations were for the company’s 2010 pipeline. More-attractive pipelines, coupled with the expected end of the patent cliff, are driving stronger growth projections. This expected growth is leading to higher multiples, which have been a key driver of value creation among large-cap and midsize companies. (See Exhibit 5.)
Emerging Companies Remained VolatileEmerging biopharma companies showed a marked increase in average annual TSR performance across the two periods, growing from 3.9 percent to 16.2 percent. Sev-
Sources: S&P Capital IQ; BCG analysis.Note: n = 70 global companies with a market valuation of $3 billion or more.1Contribution of each factor shown in percentage points of five-year average annual TSR; any apparent discrepancies in TSR totals are due to rounding.2Average annual TSR.3Change in EBITDA multiple.4“Share change” refers to the change in the number of shares outstanding, not to the change in share price.
Exhibit 4 | Biopharma Value Creation Increased Dramatically After 2010 Because Investor Expectations Improved
Biopharma sector TSR performance (2009 through 2010)
Operational Drivers1Investor
Expectations1 Financial Policies1
Segment (n = number of companies evaluated)
TSR2
%
Sales Growth
%
Margin change
%Multiple change3
%
Dividend yield
%
Share change4
%
Net debt change
%Biopharma (n = 70) 6.9 9.0 2.2 –5.0 3.6 –1.3 –1.6
Large-cap biopharma (n = 16) 5.3 9.2 1.6 –4.8 3.9 –2.6 –2.0
Midsize biopharma (n = 16) 5.2 3.6 2.9 –1.6 2.5 –0.5 –1.8
Emerging biopharma (n = 19) 3.9 9.1 5.7 –13.3 4.2 –0.2 –1.6
Generics (n = 19) 33.1 17.3 8.2 1.3 1.0 –0.8 6.0
Biopharma sector TSR performance (2011 through Q2 2013)
Biopharma (n = 70) 21.5 2.4 –2.3 15.4 5.2 0.4 0.2Large-cap biopharma (n = 16) 23.3 0.5 –1.5 15.1 6.2 2.3 0.7
Midsize biopharma (n = 16) 20.5 4.5 –3.7 18.5 2.3 0.2 –1.2
Emerging biopharma (n = 19) 16.2 2.9 0.7 10.3 3.4 –1.3 0.2
Generics (n = 19) 7.1 16.3 –4.5 –3.1 1.0 –0.4 –2.2
The Boston Consulting Group 9
eral emerging companies have brought highly innovative drugs to market in the past several years and thus delivered on their mandate.
However, emerging biopharma remains a risky environment. Companies in this seg-ment had by far the highest standard deviation in TSR among the four segments (47.1 percent), meaning that they exhibited the greatest variation between the top and bottom performers over the entire five-year period. That was nearly twice the standard deviation of the next-highest group (generics companies). Of course, be-cause emerging companies have smaller product and project portfolios, and those portfolios are often more innovative and more risky, results and valuations are in-herently volatile.
Generics Showed Declining TSR Despite Steady Revenue GrowthIn contrast to the improving results of other segments, generics companies have shown the opposite pattern, with average annual TSR declining from 33.1 percent in the first period to just 7.1 percent in the second. From 2009 through 2010, gener-ics posted strong growth projections, driven by the many drugs scheduled to lose patent protection during the patent cliff of 2012 through 2014. While that cliff has not yet passed entirely, it is already factored into the stock price of these compa-nies, and they are facing declining expectations from investors and corresponding reductions in their valuation multiples. Notably, generics posted strong sales growth across both periods, with the decline in average annual TSR coming pri-marily from reduced margins and decreased investor expectations. As with the more innovative biopharma companies in the period from 2002 through 2010, in-vestors now question generics companies’ ability to generate adequate growth in the near-term future.
Sources: EvaluatePharma’s analyst-consensus forecasts of sales and remaining patent protection; BCG ValueScience Center.Note: The 2010 numbers reflect actual performance for that year; 2015 estimates are five-year forward-looking forecasts as of 2010; 2018 estimates are five-year forward-looking forecasts in 2013. For methodological reasons, Bristol-Myers Squibb’s estimate is for 2017. 1 Weighted patent-protected sales are calculated as follows: 17.5 x (sales with patent protection greater than 15 years) + 12.5 x (sales with 10- to 15-year patent protection) + 7.5 x (sales with 5 to 9.9 years of patent protection), divided by total pharma sales in the current year. There is no credit for products with less than 5 years of patent protection.
Exhibit 5 | Patent-Protected Sales Projections Have Risen Sharply, Indicating Strong Pipelines for Many Companies
0
2
4
6
AstraZenecaMerck & Co.SanofiBristol-MyersSquibb
GlaxoSmith-Kline
AmgenNovartisEli Lilly andCompany
Pfizer
1.8 1.81.82.4
4.7
3.83.84.4
3.43.72.9
2.1
5.54.8
4.1
5.6
3.5
1.4
5.5
2.52.8
5.7
4.2
2.7
4.5
1.41.9
2018 estimated WPPS2015 estimated WPPS2010 actual WPPS
Pipeline strength, measured by weighted patent-protected sales (WPPS)1
Years of patent-protected sales
10 The 2013 Biopharma Value Creators Report
Imperatives for Biopharma CompaniesWhat can biopharma companies do to make the increase in value creation over the past three years sustainable? Despite the fundamentals we noted previously that will drive demand—aging populations, increasing rates of chronic diseases, and growing emerg-ing-market economies—several other forces will also reduce profitability and growth. In particular, pricing and reimbursement for medicines will show a complex dynamic given the shift to value-based health care. There will be a focus on cost-effective innovation.
We discuss specific actions for each biopharma segment in later subsections. How-ever, several imperatives are clearly “no regret” moves that are relevant for all four segments, regardless of company size, maturity level, market, and other factors:
• Maximize efficiency and productivity. Many biopharma companies are proud of their recent efforts to improve efficiency. However, we consistently observe that best practices in other industries have not been fully exploited in the biopharma sector, and ultimately there are usually major opportunities to further increase productivity. Executives who have worked in lower-margin industries and who transition to biopharma are often astonished at the relative inefficiency of biopharma companies. The necessary changes to the biopharma sector’s commercial model will generate material cost savings, as will the rationalization of general and administrative costs, operations, and R&D. Focusing on efficiency and, at the same time, redeploying resources to the highest-value use is a critical enabler of superior value creation. Note, however, that efficiency should not be pursued at the expense of current and projected revenue growth.
• Drive near-term growth through commercial excellence for existing products. Brand renaissance efforts and customer-facing excellence will be critical to creating value from current products. A more specific approach to defining exactly where and how a medicine is best positioned versus competing products can generate a renaissance in the brand. Customer-facing excellence is necessary to optimize the productivity of commercial resources, making the organization truly custom-er centric. The shift in power from physicians to payers continues to accelerate, and competing on value to meet the needs of payers and organizations conduct-ing health technology assessments will be increasingly critical to success. In addition, biopharma companies can enhance sales through life-cycle-manage-ment initiatives, to ensure that they are extracting all possible value out of their current commercial pipeline. (See Brand Renaissance: Five Ways to Win Commer-cially in Pharmaceutical Markets, BCG Focus, December 2011.)
• Keep the R&D pipeline focused. Companies should ensure that they have an R&D portfolio that is positioned to win in their TAs and markets of choice. This entails focusing on a sufficiently small number of TAs in which the company has a meaningful chance to differentiate its products from those of competitors, along with marked confidence in pipeline molecules’ mechanism of action. A lack of R&D focus is often based on insufficient scientific depth, which leads to poor decisions, such as which project to start or advance, or how to design clinical trials. For example, pursuing more than three or four TAs introduces significant complexity and fragmentation, resulting in insufficient resources and complex decision-making. To reach this objective, companies will need to
Productivity best practices in other
industries have not been fully exploited in the biopharma sector.

The Boston Consulting Group 11
terminate projects or programs to yield a targeted set of truly promising mole-cules aimed at markets in which they can clearly win, rather than continuing to fund research on undifferentiated or second-tier molecules. The intent must be to generate “first in class” or “best in class” medicines. (See “What Matters Most in Commercial Success: First-in-Class or Best-in-Class?” Nature Reviews Drug Discovery, May 2013; and “Does Size Matter in R&D Productivity? If Not, What Does?” Nature Reviews Drug Discovery, December 2013.)
• Prepare to excel in a value-based health-care environment. This entails being more patient centric in the go-to-market approach and focusing on demonstrating superior outcomes compared with competitors, through either the drug alone or a combination of the drug plus services. One example is Pfizer’s Getquit pa-tient-motivation program coupled with its smoking-cessation drug varenicline; another is GlaxoSmithKline’s alli program, which provides lifestyle coaching on diet and exercise. In addition, payers will drive greater cost-effectiveness reviews, and regulators will continue to restrict approvals for drugs that do not demonstrate materially superior outcomes. There are many examples of these market trends, but too many biopharma management teams still believe that a “me too” product with commercial “push” will generate value.
• Actively communicate strategy to investors. Each company has investor segments with different requirements. Meeting all investor needs is not an effective approach; rather, management teams need to define the targeted investor segments and ensure that their strategy fits with the objectives of those share-holders (such as growth or stable dividends). For example, both Pfizer and Novartis are rationalizing their corporate portfolios by potentially divesting noncore units and focusing on the businesses where they can achieve a clear market advantage. Specifically, Pfizer divested its nutrition and animal-health operations and reorganized into three distinct business units—a move that enhances clarity for its investor base.
Management teams should also understand the requirements of different investor segments—particularly as biopharma companies mature. For example, growth-fund managers typically seek revenue and earnings-per-share (EPS) growth of 5 percent or more, make investments based on a three- to five-year time horizon, and are un-interested in dividends. By contrast, growth-at-a-reasonable-price (GARP) managers can tolerate slower revenue growth—as long as it exceeds overall GDP expansion—and they invest for longer periods of five to ten years. In exchange, however, GARP investors generally require dividend payouts (typically 2 to 3 percent).
Large-Cap- and Midsize-Company ImperativesRevenue growth is critically important in the large-cap- and midsize-biopharma seg-ments, and some companies have pursued growth through M&A. For example, Gile-ad Sciences acquired Pharmasset for $11 billion, and Amgen recently bought Onyx Pharmaceuticals for $10.4 billion. Both deals represent material sources of top-line and EPS growth, and both reinforce the acquirer’s position in a leading TA. In both cases, the combined entity was seen as greater than the sum of its parts, through both cost and revenue synergies. A good example is the Pharmasset drug sofosbu-vir, for the treatment and cure of hepatitis C. According to analysts’ estimates, sofos-
Some companies have pursued growth through M&A.
12 The 2013 Biopharma Value Creators Report
buvir had a net present value (NPV) of about $2 billion prior to the acquisition; af-ter the acquisition, the March 2012 consensus NPV was $15.5 billion. That amount is higher than the price Gilead paid for all of Pharmasset.
Despite short-term EPS dilution, these transactions were significantly TSR-accretive. Yet many management teams still hesitate to pursue such transformative deals. In an envi-ronment of bullish expectations and high share prices, such deals are expensive, which means that they can dilute earnings in the short term. We have found, however, that short-term EPS impact is not the ideal metric to gauge the attractiveness of any transac-tion. Instead, management should apply a value creation metric when evaluating po-tential deals. If the transaction is a strategic move that truly drives value creation—transparently adding revenues or cost synergies to the combined entity—investors will respond favorably, even if the deal reduces EPS in the short term. That said, the re-wards do not materialize automatically. They require both an effective investor-rela-tions program that can tailor the right message to targeted investors and the right ap-proach to smoothly and swiftly integrating the acquired company and its assets.
Emerging-Company ImperativesEmerging-biopharma management teams must define their five-year strategic goals. Does management want the emerging company to become a fully vertically inte-grated global biopharma player? Or does it want to continue to innovate within a targeted set of TAs? The shift to value-based health care actually gives emerging companies a small advantage relative to their more-established competitors, in that they have less institutional inertia to overcome in reorienting to win in the new en-vironment. They can determine the right business model, the right position in the value chain, and the right capability set for their strategic goals. However, they must actively assess the market and determine their ideal position.
Generics Company ImperativesTo pursue growth, some generics players are now expanding into more-differentiat-ed biopharma markets. These include branded generics, technologies, and TAs that have traditionally entailed higher barriers to entry—such as oncology, respiratory, and ophthalmology—that often require more-complex delivery forms (such as patches, injections, and inhalable formulations and devices).
An important source of additional growth lies in the biosimilars segment, given that a number of the largest biologic drugs (such as infliximab and rituximab) will lose patent protection in the next few years. As many generics players are current-ly experiencing, the challenges and barriers to entry into this exciting new market segment are daunting. Placing bets wisely, investing in the right technologies and go-to-market models, and sharing the associated risks of entry through such mea-sures as joint ventures will be key drivers of sustainable value creation from bio-similars.
In many cases, these growth strategies will require investments in new technolo-gies, along with developing innovation capabilities that have traditionally been ab-sent at many generics companies. These initiatives will also introduce technology risk in addition to the traditional legal and commercial risks that the generics seg-ment has dealt with in the past. Yet given the current unattractive growth prognosis
The shift to value- based health care
gives emerging companies a small
advantage relative to their more-estab-
lished competitors.
The Boston Consulting Group 13
for generics—driven by a decline in the number and market potential of drugs coming off-patent, as well as the expansion of global low-cost competitors—many generics companies will likely decide that such initiatives are worth the risk.
In sum, the biopharma sector has rebounded significantly over the past three years, but the rebound has been uneven and attributable to an effective set of stra-
tegic actions at the individual company level. Those management teams that have addressed the key imperatives we define have performed well. Those that have not addressed them have underperformed. We see that situation continuing. In a dy-namic market characterized by a shift to value-based health care, there are clear op-portunities to create value for investors in a sustainable manner. However, manage-ment teams must build on their current momentum and take the right strategic, operational, and financial actions to generate a sustainable competitive advantage.
Notes1. TSR is a dynamic ratio that measures the total returns that a shareholder achieves from owning a stock. It includes changes in stock price (including valuation multiples) as well as free-cash-flow yield generated through dividends.2. All analyses in this report are based on data through June 30, 2013. 3. All three reports build on research conducted as part of The Boston Consulting Group’s fifteenth an-nual Value Creators report, an annual study that analyzes the five-year value-creation and TSR performance of publicly held companies worldwide. This year’s overarching report is titled The 2013 Value Creators Report: Unlocking New Sources of Value Creation.4. All companies included in our sample were publicly listed from 2009 through the second quarter of 2013; had a market capitalization as of June 30, 2013, that was $3 billion or more; and had at least five consecutive years of financial data, as required for TSR calculations. 5. BCG’s proprietary smart-multiple analysis compares observed multiples within an industry with a broad range of financial and performance data and uses statistical regressions to identify the factors that differentiate multiples among companies. In recent years, we have done hundreds of these analyses for clients in many different industries and sectors. This work suggests that a relatively small number of factors can explain anywhere from 80 percent to 90 percent of the differences in multiples among peers and over time. For more on the smart-multiple methodology, see The 2013 Value Creators Report: Unlocking New Sources of Value Creation, BCG report, September 2013.6. Cash gross margin is defined as revenues minus the cost of goods sold plus depreciation and amortization. 7. Includes various country-specific factors, such as the cost of funds in developing countries, general country growth potential, laws, customers, and other country-specific risks.

14 The 2013 Biopharma Value Creators Report
Appendix This report builds on BCG’s fifteenth annual Value Creators report, which covers all industries. Our biopharma report ranks the total shareholder performance of the top biopharma companies from 2009 through the second quarter of 2013. To create our sample for analysis, we included all companies that were publicly listed for the period studied, with at least 25 percent of their shares publicly traded. We also im-posed a minimum market cap of $3 billion. Our rankings track performance in local currency. For companies that are listed on stock exchanges outside their home country, returns were calculated in the currency of the exchange. For a list of the top ten companies by TSR performance over the period we analyzed, see the exhib-it below. A list of the 70 companies in the sample follows.
Sources: S&P Capital IQ; BCG analysis.Note: n = 70 global companies with a market valuation of $3 billion or more.1Location refers to the location of the primary stock exchange on which the company’s shares are listed.2Average annual TSR, 2009–2Q 2013. 3As of June 30, 2013.
Top Ten Value Creators in the Biopharma Sector Sample, 2009–Q2 2013
Abbott Laboratories (includes AbbVie, which became a separate company in January 2013)
Actavis
Actelion Pharmaceuticals
Alexion
Allergan
Amgen
Ariad Pharmaceuticals
Aspen
Astellas Pharma
AstraZeneca
Bayer
Biogen Idec
BioMarin Pharmaceutical
Bristol-Myers Squibb
Cadila Healthcare
Rank Company Segment Location1 TSR2 (%)Market value3
($billions)
1 Pharmacyclics Emerging biopharma
United States 178.6 5.78
2 Jazz Pharmaceuticals Emerging biopharma Ireland 121.2 4.03
3 Ariad Pharmaceuticals Emerging biopharma
United States 95.8 3.23
4 PT Kalbe Farma Generics Indonesia 93.6 6.80
5 Regeneron Pharmaceuticals Midsize biopharma
United States 74.5 21.88
6 Wockhardt Generics India 63.9 1.84
7 Valeant Pharmaceuticals International
Midsize biopharma Canada 61.7 28.16
8 Aspen Generics South Africa 53.9 10.42
9 Medivation Emerging biopharma
United States 52.9 3.69
10 Lupin Pharmaceuticals Generics India 51.7 5.70Sector average 14.9

The Boston Consulting Group 15
Celgene
Celltrion
China Resources Pharmaceutical Group
Chugai Pharmaceutical Co.
Cipla
CSL
Daiichi Sankyo Company
Dainippon Sumitomo Pharma Co.
Dr. Reddy’s
Eisai Co.
Elan
Eli Lilly and Company
Forest Laboratories
Gedeon Richter
Gilead Sciences
GlaxoSmithKline
Grifols
Hisamitsu Pharmaceutical Co.
Hospira
Jazz Pharmaceuticals
Jiangsu Hengrui Medicine Co.
Kyowa Hakko Kirin Co.
Lupin Pharmaceuticals
Meda Pharmaceuticals
Medivation
Merck & Co.1
Merck2
Mitsubishi Tanabe Pharma
Mylan
Novartis
Novo Nordisk
Ono Pharmaceutical Co.
Onyx Pharmaceuticals (acquired by Amgen on October 1, 2013)
Orion
Perrigo
Pfizer
Pharmacyclics
PT Kalbe Farma
Ranbaxy Laboratories
Regeneron Pharmaceuticals
Roche Holding
Sanofi
Santen Pharmaceutical Co.
Shanghai Fosun Pharmaceutical Group Co.
Shanghai Pharmaceuticals Holding Co.
Shionogi
Shire
Sun Pharmaceutical Industries
Takeda Pharmaceutical Company
Teva Pharmaceutical Industries
UCB
Valeant Pharmaceuticals International
Vertex Pharmaceuticals
Warner Chilcott (acquired by Actavis on October 1, 2013)
Wockhardt
Notes1. Doing business as MSD outside the U.S. and Canada.2. Doing business as EMD Serono in the U.S. and Canada.

16 The 2013 Biopharma Value Creators Report
About the AuthorsMark Lubkeman is a senior partner and managing director in the Los Angeles office of The Bo-ston Consulting Group. You may contact him by e-mail at [email protected].
Ulrik Schulze is a senior partner and managing director in the firm’s Zurich office. You may con-tact him by e-mail at [email protected].
Michael Ringel is a partner and managing director in BCG’s Boston office. You may contact him by e-mail at [email protected].
André Kronimus is a partner and managing director in the firm’s Frankfurt office and the global topic leader for Corporate Development in biopharma. You may contact him by e-mail at [email protected].
Falk Bielesch is a project leader in BCG’s Berlin office. You may contact him by e-mail at [email protected].
AcknowledgmentsThe authors would like to acknowledge the contributions of Joe Brilando from the BCG ValueScience Center in San Francisco, a research center that develops leading-edge valuation tools and techniques for M&A and corporate-strategy applications, as well as the contributions of Philippe Dehillotte and Kerstin Hobelsberger of BCG‘s Value Creators team. They also thank Katherine Andrews, Gary Callahan, Catherine Cuddihee, Angela DiBattista, Jeff Garigliano, and Sara Strassenreiter for their writing, editing, and production assistance.
For Further ContactIf you would like to discuss this report, please contact one of the authors.

To find the latest BCG content and register to receive e-alerts on this topic or others, please visit bcgperspectives.com.
Follow bcg.perspectives on Facebook and Twitter.
© The Boston Consulting Group, Inc. 2014. All rights reserved.1/14 Rev. 4/14
Abu DhabiAmsterdamAthensAtlantaAucklandBangkokBarcelonaBeijingBerlinBogotáBostonBrusselsBudapestBuenos AiresCalgaryCanberraCasablanca
ChennaiChicagoCologneCopenhagenDallasDetroitDubaiDüsseldorfFrankfurtGenevaHamburgHelsinkiHo Chi Minh CityHong KongHoustonIstanbulJakarta
JohannesburgKievKuala LumpurLisbonLondonLos AngelesLuandaMadridMelbourneMexico CityMiamiMilanMinneapolisMonterreyMontréalMoscowMumbai
MunichNagoyaNew DelhiNew JerseyNew YorkOsloParisPerthPhiladelphiaPragueRio de JaneiroRomeSan FranciscoSantiagoSão PauloSeattleSeoul
ShanghaiSingaporeStockholmStuttgartSydneyTaipeiTel AvivTokyoTorontoViennaWarsawWashingtonZurich
bcg.com