THE 1/spo.nmfs.noaa.gov/Fishery Leaflets/leaflet327.pdf · 57,919 .' 112, 119~" 66,345...
6
United States J)epart.men't of the Interior, Krug" Secretary Fi , sh and Wildlife Albert M. Day, Director ... . {. , . Fishery Leaflet 327 ,!, 'Washington 25. D. Ce ' December 1948 THE FISHING INDUSTRY , AND THE FOR FISH, IH 1/ By Georg Frostenson, Clerk This report is designed to provide a picture of the fishing industry in Sweden and on general ma;rketingconditions for fish in recent years. Tons metric tons. SOURCES OF DNrA Informati'on on the status and progress 9f the fi shing industry is, given in "Fiske" published an!1ually by the Central Bureau of Statistics, The iseu8..1'lce of this publication is usually delayed about years after the end of each fishing season. Current statistics on catches and sales in ' the 3 sea fishing regions--the West Coast, the South Coast and the East Coast--are presented in "Jordbruksekonom- iska UppgiftElrH, which is sent ' regularly to the of the Depart- ment of should be noted that the account of catches and sales, as given in JordbrUksekonomiska Uppgifter, is not inclusive. The cov- erager,anges 'between 75 and 80 percent of ' the ' total. Official statistics do not include fresh water catches estimated at 15.000 tons annually. The figures given ' in thi s report represent total catches. SCOPE OF INDUSTRY :J:n the year of 1:9l4'5 about 16 1 000 perso'nsder ,i ved , the larger share of their ,income from.salt water The corr.esponding number in 1940 was 13.306. Inaddition,,-aroun<l; 9.000 -persons had fish,ing as an important supplemental source of income" The fishing fleet numbered vessels or boats in 1945 as compared wit.h in 19 4 00 Of these. 3,282 were larger vessels , with decks and motor. Of the open boat.s, 6,594 were equipped with motors" Total 1945 investments of the fishing industry amounted to 49 kronor for vessels and 39 million kronor for equipment, or a total of 88 million kronor. 1/ American Consulate Report No. 475, Stockholm, Sweden, October 6, - 1948 0
Transcript of THE 1/spo.nmfs.noaa.gov/Fishery Leaflets/leaflet327.pdf · 57,919 .' 112, 119~" 66,345...

~,
United States J)epart.men't of the Interior, J.A~ Krug" Secretary Fi,sh and Wildlife Service~ Albert M. Day, Director
--~---.,.-----...
. { . , . Fishery Leaflet 327
,!, 'Washington 25. D. Ce ' December 1948
THE FISHING INDUSTRY ,AND THE lJi.AP..KE~ FOR FISH, IH SWE~]l{ 1/
By Georg Frostenson, Clerk
This report is designed to provide a picture of the fishing industry in Sweden and on general ma;rketingconditions for fish in recent years. Tons ar~ metric tons.
SOURCES OF DNrA
Informati'on on the status and progress 9f the fi shing industry is, given in "Fiske" published an!1ually by the Central Bureau of Statistics, The iseu8..1'lce of this publication is usually delayed about l~ years after the end of each fishing season. Current statistics on catches and sales in ' the 3 sea fishing regions--the West Coast, the South Coast and the East Coast--are presented in "Jordbruksekonomiska UppgiftElrH, which is sent ' regularly to the ~ibrary of the Department of A.gricult'!J.re~
~t should be noted that the account of catches and sales, as given in JordbrUksekonomiska Uppgifter, is not inclusive. The coverager,anges 'between 75 and 80 percent of ' the ' total.
Official statistics do not include fresh water catches estimated at 15.000 tons annually.
The figures given' in thi s report represent total catches.
SCOPE OF INDUSTRY
:J:n the year of 1:9l4'5 about 16 1 000 perso'nsder,i ved ,the larger share of their ,income from.salt water fishing~ The corr.esponding number in 1940 was 13.306. Inaddition,,-aroun<l; 9.000 -persons had fish,ing as an important supplemental source of income" The fishing fleet numbered 21~924 vessels or boats in 1945 as compared wit.h 20~294 in 19400 Of these. 3,282 were larger vessels, with decks and motor. Of the open boat.s, 6,594 were equipped with motors"
Total 1945 investments of the fishing industry amounted to 49 ~i111o~ kronor for vessels and 39 million kronor for equipment, or a total of 88 million kronor. 1/ American Consulate Report No. 475, Stockholm, Sweden, October 6, - 19480

, ,' "'."' . ... .. '
., :. ' '. '2 " .-. ,: .... , ', ..
. . '" ' . . . . .,.. . ~'.
Chiaf wholesale markets on "the West Coast' are GothenbUrg. Gravarne. Smogen, Lysekil, and Stromst~q,~ . . .- ,.' ....
There are :Ln the country"al.to~ether ,~r.ound 1600 cooperative fishery associations, most of which operate as sales and bargaining organizations at the local level. The producers associations on the East Coast enjoy monopoly ' intht3sa1es of herring', l'I'hi1ethe West CQ~8t catches are sold largely 'through private channels. ' ~' ( '
The fishermen on t'he West Coast ai'e, h~wever,' members' of' ~pecia1 price regulation assoc-iat~oI}s .design.ad tq .,assist in the implementa- ' Uon of the Government price support program (see bt3low) •
. . '
, .
A national. federation,basedupor. local .fishery associationa and individual fishermen, wa::. recently (Septem"Q.er .19~'8) formed,. under the name of The Nati~nal Federation of Swedish Fishermen (Sveriges Fiskares Riksforbund),
CATCHES
The ,salt water catchec of fish rose substantially d.ur~the war and exce~de~ i5C,000 tons'in 1945 Bnd 1946. Catches ,durlng ' th6~first haJ,f of'lo/~g were .exceptional1y large (Table 1). ' ' .
Table 1 - S'}]eden',:Catch~~ of Sal.t Wat er Fi sh JJLJ9';8 "to 1948 Year East Coast South Coast Wast Coast : , Country ..
1938-'"40, •••• > •• ••••• "
1941 .. ; ' ...... ~ ..... '. 1942 •........•• " .. 1943 ••.. , ...••...• 1944 ....... ' ...... . 1945 7········ ,· ··· 194h1 , l ou7u1/' . . ,".' .. ',' >-.,,~.
-,' - ........ .. /'- -. . Jan.-June 19431/ ..• 1..1 Preliminary
tons 31,000 32,761 39,293 .-43,106 35,581. 34:375 28,100 13,700 8,500
tons 12,630 21,499 19,762 20,422 17,707 21,491 19,064 18;900. 15.700
KINDS OF FISH C~UP.HT
tons tons . ' 58,500 > .. : 10'2,130
57,919 .' 112, 119~" 66,345 125,400-80,281 143,809 72,143' 1299431 96,775 ' 152,641 '
109,000 156,064. 99.500 " 132,100 63,000 87,200
, > '
, . Mor'e than h.i3J.f of: th~ yolume of ,fish ' 6a:ught '.-is herriDg.Co.d • . ',
sprat, whiting, mackerel. haddock and ~lound..er~ in the orde.r.men-ti.on,ed, .are the next most im~o.rtMt,: ~~incl~o' (Table 2J. :. . ' . " .. " ..
!.
, I , <"
.t

'f
3 Table 2 - Sweden: Importance of Various Kinds of Salt Water
__ === ..... ==== ... = ~h Call~ht .. ..Ay.fll'..a.~o~r"===:l!!::09i!.:4~1==-;.=1~q~4_"i:!:5:!=. ==:=;;';::::00======== Ki~(t~_, ___ , Volume in 1.000 tOlls'
Herring ., •• , •••• 0 • • • • • • • • • • 69. 7 pod • 0 0. !II • " ..... t •• Co • ., .'. • • • • • ].306
. §3p:a.." a. t ft _ tt • to t' 0 • ., • ., c. ..... Q • 0 • • • 90 2· Wl1 i'~ ing 'II ••••••••• .:. ~ • -J! • (I !) 6. (). . Mackerel • r •••• , ••• , •• ~. • • ,6.1 Haddock ••••. '.0 ••••• r a • • • 4.1 Flounder ".0". ," .• "' .•••••• ' • •• 2.2 Shell fi sh ................. 2 ~ 1 Eel • c ., • 10.' • • • • II go • • • 10) • • • " r '" •
PI ai c e r.-, •• '. • • • •• " •• II " ~ ••••. .. ·S01e ......... e •••• ·,jll ..... •• .....
. Ling •. "." ................. ::1 'I 0
P i·kt;; •••• l' • ., • III • • • ~ • ~ 0:; , • • • "
Salrr.on ~ 0 'I •• , •• 1 ~ • " " • " ., •••
Not speci:t""tied ••• ~ • ;) ~ " ••••
106 1,,5 009 0.8 0~7 0.6 8<8
Percen"..,t~_
52 14 7 5 5 3 2 2 1 1
* * * '* 7
__ Total •.. ,' •.•... _ ... ~_._._. L--.. __ ._.l ":)2_0 c) .. _________ .::1,0"'-""'-0 __ _ * Less than 1 percent.
The percentage distribution, as shown above,' reflects fairly the re1atl've importance of the va.rious kinds of salt water fish ,Ja'lght in a normal year.
Prices of fish reacheQ a peak in 19l+3 when, for example, herring sold at 72 are per kilogram at the Gothenburg fisil auction. The de-, clining trend from that year wap reversed in 1947--a relatively poor fishing yearo The p:dcetren1 since pr~war, for the most important kinds is shown below (Table 3).
Table 3 - Prices of Fish at· Gothenb.-0.rg ;b"i~h 1l,uction":-oy Year and Kinds of Fish; in. Ore per Kilo'gram
_~ind ___ 1.9.")8 ]34'), 1'146 1947 Herring ••..• < , • • • • • 17 64 . 34 ' 36 Cod •••••• ' •••••.. ,. 29 66 57· ' 65 Sp~at·e •• '"" •• ,,' .• ~,2 51 54, ""55'
.July 1948 54 68
Whiting 5 ... •••••••• 26 46 36 39' 47 Mackerel •...•.....• 3~ '67 73 72 86 P~dd.ock ,Ot ..•• "... . 32 76 53 62 71 Floujder •....... a.. 30 61 56 73 56 Eell .••... D" •••••• 169 301 311 326 207 Plaice •..••......•• 85 128 110 ' 121 1 ~1 Sole .......... ", .• 0 69 137 --.-:9.~'_· __ :..=1;;:.2-,,5~ ____ ~1..:.6.J.9 __ 11 Estimated 't"!holesale price for Baltic ca.tches. "
The value of fish sold averaged 30,6'87 1000 Kronor in 1936.-40. It reached about 120,000,009 Kronor in 1943'0 With food supplies more ample in recent years) the gross income of'the flshing industry has shown a downward trend in recent years. (Table 4).

4
Table 4 - Sweden: Approximate Sales Value of Salt Water Fish Caught Year herring Other Fish Total
Million .Kronor Million · KrOnor Million .Kronor 1936-1940 4 •••••••••
1941·-J.945 ••. · •..•• 0
1946 yY o. < •••••••••
11 20 . : 31 43 58 . 101 . .
4" 1 32 52 84
19 7 ... C' .0 •••••• 27 51 78 II Preliminary -'
The Government has fixed guarantee price~ . t;o prod.ucers for all important kinds of fish~ This regulation . is financed by means of a levy amounting to 5 p8rcent of the sales value , on the \~est Coast, 4 percent on the South Coast, and 2 are· per k~logram of herring* sold. Prices are kept at or above the support level by the withdrawing of any surplus from the market. Most of the surplus fish are salted and only a small quantity are put into cold storage.
FOEEI GN TRADE
If landings of fish in foreign ports by Suedish fishermen are considered , the exports of fresh and processed fish about equalled tee impOTts in the period 1938-40~ Foreign trade was insignificant du.ring the period 1942-.440 During 1945-47, export deficits alternated \7ith export surpl'.1ses. Due to good catches, an Unusually large export surplus of 33,263 tons was registered during the first 6 months of 194B. (Table 5)0
Table 5 ~ Sweden: Foreign Trade in Fish. by Years Year Fresh P~ocessed17 Total
!. Import s tons tons tons 193B-1940 .................•.• 14» 120 ;;8..830 42,950 1941 ... Co .. :! 0 ...... C :J .................... ., 1,640 13,9B7 15 3 627 1942 ...... :J .............. C . . ........... 0 ~ 4,661 3 J 051 7.712 1943 ........ e ..... ., e ...... ~ .... t o .. ... 0 .. ~ It 2,B20 · 129 2,949 19 44 ~ ~ ... " ..... ~ ... f> :) eo ~ .. ~ . to ........ ceo 1,109 21 1,130 1945 . " .. c ...... Q ........... .:0 t_ ' , ••••••
1 q46 .................. ,. ... . ( . . 1947 •.... " .. ... . r •• • ••••••••• ~ . Jan. - June 194B , . ............•
3,974 12,244 1.6.218 4,166 22,434 26,600 7,789 19.926 27,715 2,235 . 41122 6,357
Year Landings by
Fresh Processed?) Total Swedish fishermen in foreign Eorts
II . Exports tons tons tons tons 1938-194o, ......... 22:600 4,130 26~ 730 13,700 1941 ... '\~ .... , ..... 2,121 1»455 3,576 1,164 1942 • •••• Co •••• ., ••• 1 · 191 192 7 1943 3 ••••••••••• • • 2 1544 • ....... r ••••• ~ 22 4,572 4,594 8 1945 Ii •••••••••••• c 443 6,337 ' 6,780 6.731 1946 • •••••• ' . •• ~ •• Q 1+,992 28,818 33;BI0 13,000 1547 •••••••• (-o ... o: e 6,152 11,108 17,260 6.900 JAn , -June lQ48, , ..• 1321126 2111~1 31+1647 6.686 .11 Principally sal ted herringe 2/ Salted) spiced or smokedo

5
The foreign' trade in fish in 1947 is shown below by countries of origin and'destination ,(Table 6).
Table 6 - Sweden: Foreign trade in fresh and processed fish in 1947; by countries o,f origin a.nd destination~
Country of Origin or Destination
C z echo slovak:ia •••• e .................... .
Italy ............................... 0 •
Pola.n.d ........ " ••.•••• II ••••• It •••••••••
U .. Su S. RQ • 0 ......... ".. • D •••••••• 0 ....... '0 ...
France ." ................ ' ............. 1'1 •• III •
The Netherlands 0 ..... CI .............. ~ •• IIil
Denmark 0....., ;. . .. . . . .. .. • . . .. . . . ... . . . . . 7 :I ••
Great Bri tain II .............. eo. , •• I) •• 0
Norway ...................... " •••••••••• Aus tr ia .......... ~ ••• 1;1 ...... ~ ......... ...
u.. s . A. 3...'.. 1'1 • • 0 • • • • • ft • • • • • 0 • • • • • ...
Ie ela.tld ., ...... ' .......... " ••• ~ 41 • ~ ... II ~ ..... e
Intdrnational waters " ••••..•••.•.•.•• O.~har cQ..uI.ltries "'e ......... 0 •••••••••• e
Total Add:
........ " ..................... . Swedj. sh landings in f9reign port all ............. .
All fl ............ " ... 0 •••••• co •••••••• <t ••
1/ Denmark, the Netherlands, and GrBat
Imports Exports
tons tons --- 5,186 2;665
27 2, 649 1,613 1,107
196 816 3,652 640
3 5~7 19.867 527
383 410 33
2;444 968 148 1,054
27.715 17,260
6r3.CO 2 24 160 Britain.
As indicated, Norway, De~~ark, and Iceland were the chief suppliers. The exports went to a number of countries including Italy, the Soviet Uhion and Soviet dominated states n
Most of the exports during the first half of 1948. altogether 34,647 tons--went to Czechoslovakia and the French Zone of Germany. Denmark, the Netherlands and Great Britain were the recipients of the volume of fish which was landed direct by S\"ledish fishermen at foreign ports~
SUMlv;.ARY OF Su?PLY AND UTILIZATION
The following table shows the supply and utilization of fish, including fresh water fish, during the period 1938-48~ (Table 7)0
J ,
6 , f
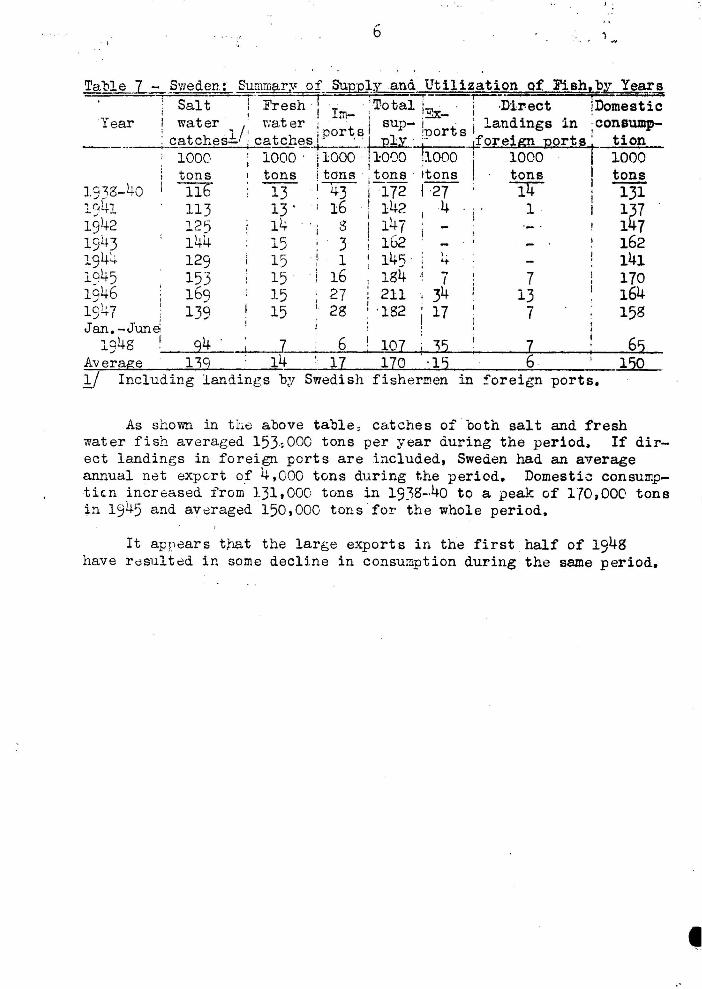
Table 7 - .pweden: SUI.!unar;v. of.~)L§.nd. Utilization of Fish, q~~:rs ! Salt T Fresh , I, 'r' , ' T,otalf.", , r-~i)ir.ect jDomestic , , m- ' , ~_ I '
Year :, water / . ria.t er : t I' sup- i t' ',' land ings in . consWllp-, , , ' por s 'nor s ' ___ .. ___ :_.g,atcr.esl. i catche~+-__ · ~LJll;L. 1- ..,forei@ports1tion
i 1000 : 1000' i 1000 ' ! 1000 ,1000!, 1000' 1000 , I , I '
! tons I tons i tons ' i19ns 'Itons , 'tons I ~ 1.938-40 I llb 13 ~~ j172 j27 14'" 131 1941 113 13 . I 16! 1424 1 . 137 1942 125 14 :3 147 147 1943 144 15 3 162 162 1944 129 15 ' ~ 1 145 ~ 141 l q45 153 15 ' j 16 184 7 7 170 1§46 169 15 27, 211 34 13 164 1947 ; 139 15 28: '182 17 7 158 Jan.-Jun~
1948 I 94 7 6 I 107 ~5 7 65 Average 1 ~q 14 ' 17 170 ' 15 6 · 150 1/ Including landings by Swedish fishermen in !oreign ports.
As shown in the above table: catches of both salt and fresh water fish averaged 153:000 tons per year ciuring the period. If direct landings in foreign ports are included, Swecien had an average annual net export of 4,coo tons during the period. Domesti·:: consumpti,n increased from 131,00(: tons in 1938-.40 to a peak of 110,000 tons b. 1945 and av~raged 150,000 tons for the whole period.
It app8ars that the large exports in the first half of 1948 have r<;;sulted in some decline in consumption during the same period.
,