(Thanks to Amnon Bar-Ilan for the origin of most of the Slides)
23
(Thanks to Amnon Bar-Ilan for the origin of most of the Slides)
-
Upload
wang-barlow -
Category
Documents
-
view
18 -
download
0
description
IPAMS/WRAP Phase III Oil & Gas Emission Inventory Project & WRAP O&G Workgroup October 22, 2008 WESTAR O&G Conference Lee Gribovicz. (Thanks to Amnon Bar-Ilan for the origin of most of the Slides). Oil and Gas Production in the Rocky Mountains. - PowerPoint PPT Presentation
Transcript of (Thanks to Amnon Bar-Ilan for the origin of most of the Slides)
(Thanks to Amnon Bar-Ilan for the origin of most of the Slides)
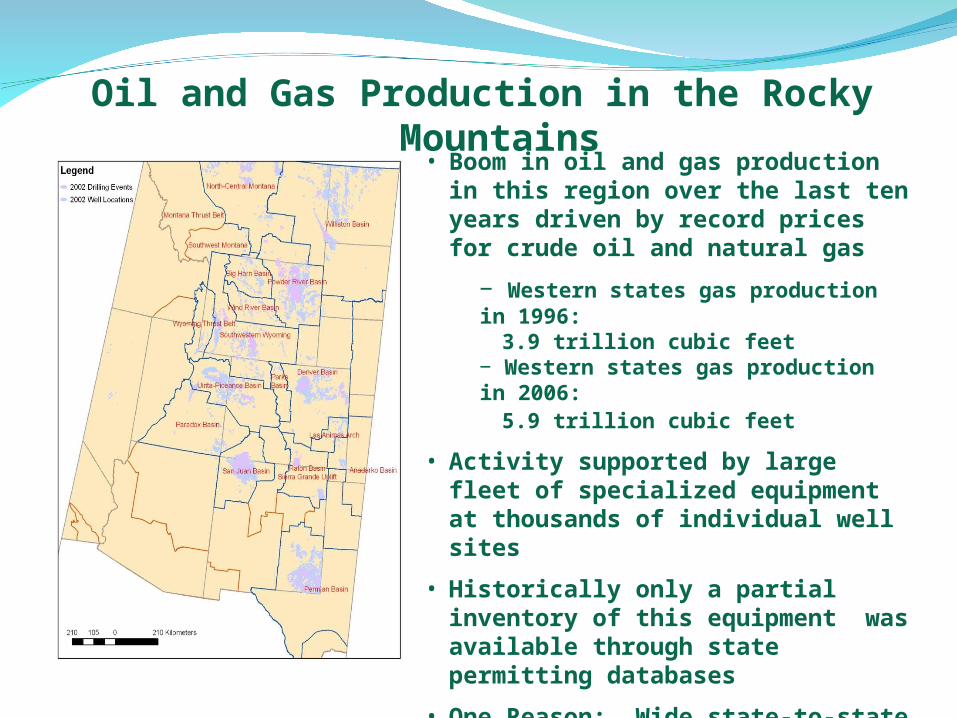
Oil and Gas Production in the Rocky Mountains
• Boom in oil and gas production in this region over the last ten years driven by record prices for crude oil and natural gas
− Western states gas production in 1996:3.9 trillion cubic feet
− Western states gas production in 2006:5.9 trillion cubic feet
• Activity supported by large fleet of specialized equipment at thousands of individual well sites
• Historically only a partial inventory of this equipment was available through state permitting databases
• One Reason: Wide state-to-state variation in permitting thresholds and source categories permitted

History of Oil and Gas EI’s – WRAP Phase I & IISummary of state point source inventory thresholds (PTE = Potential to Emit)
State Point Source Inventory Threshold
Alaska PTE 100 TPY
Arizona PTE 40 TPY
Colorado 2 TPY actual emissions
Montana PTE 25 TPY
New Mexico PTE 25 TPY
North Dakota PTE 100 TPY
Nevada PTE 5 TPY
Oregon PTE 100 TPY
South Dakota PTE 100 TPY
Utah PTE 100 TPY
Wyoming PTE 25 TPY

• Originally formed from SSJF to look at these O&G issues in the WRAP region - Guided the development of the 1st Regional O&G Emission Inventory in 2005 (“Phase I”)
• Phase I Inventory found 116K Tons of NOx from O&G Area Sources not previously counted (900% increase from previous 2002 baseline)
• In 2007 the WG completed Phase II O&G Inventory Update• improved accuracy, updated to 2005 baseline for a revised 2018
projection methodology, improved Point Source SO2 projections, evaluated potential control strategies
• Currently overseeing the IPAMS Phase III O&G Emission Inventory development project
• Website: http://www.wrapair.org/forums/ogwg/index.html

• Represented the first regional inventory for the western U.S. to address oil and gas area sources not previously inventoried
• Intent was to create a regionally consistent inventory methodology for oil and gas area source emissions estimates for all of the western states
• Output data were model-ready emissions of all criteria pollutants for use in WRAP regional haze modeling for the western U.S.

• Considered a baseline year of 2002, future year projections to 2018
• All 2002 O&G production statistics derived from each states’ OGCC database
• Most major source categories considered in WRAP Phase I: compressors, drill rigs, heaters, completion venting, condensate /oil tanks, truck loading
• Emissions factor and activity information derived from a limited number of regionally-specific sources available at the time (ie/ Wyoming state-wide inventory, EPA’s NONROAD model, NMOGA inventory for NW New Mexico)
• Activity/emissions data from these regionally-specific studies was broadly applied to entire WRAP domain
• Limited industry participation in Phase I effort
• Future year projections created using EIA Annual Energy Outlook growth factors for western U.S. and some Resource Management Plans / Environmental Impact Statements

History of Oil and Gas EI’s – WRAP Phase II• Focused on improving the methodology from
the Phase I work for two specific major NOx source categories: compressors and drill rigs
• Utilized direct industry survey to obtain detailed information from the oil and gas companies on this equipment by basin
• Updated baseline year from 2002 to 2005.
• Reviewed and updated SO2 emissions from large gas plants

History of Oil and Gas EI’s – WRAP Phase II• New methodology estimated 2002 emissions on a basin-wide average
basis for all basins in the WRAP region, focusing on those basins where major O&G activities are occurring and producer information was available
• In basins where significant activity was not occurring, or producer information was unavailable, used Phase I estimates
• Data were collected from all major and some medium-sized and independent oil and gas companies operating in the WRAP region in the form of a questionnaire sent to each producer
• Oil and gas production statistics were derived from each state’s OGCC database and updated from 2002 to 2005 to reflect growth in activity and better availability of data
• The revised 2005 base statistics were used in making 2018 projections using most recent planning information available and producer data where available

History of Oil and Gas EI’s – WRAP Phase I & II
• WRAP Phase I completed in December 2005
• WRAP Phase II completed in September 2007
• Documentation available at: (http://www.wrapair.org/forums/ogwg/Phases_I_and_II_Inventories.html)
• Documentation for both projects consists of technical reports detailing the workplan and methodologies used, with appendices showing quantitative results

History of Oil and Gas EI’s – WRAP Phase I & IIPhase I & II Results – NOx “Area Source” Emissions (Phase II Total: 118,887 T.)
WRAP Phase I and Phase II NOx Emissions for 2002
-
10,000
20,000
30,000
40,000
50,000
60,000
70,000
2002 I 2002II
2002 I 2002II
2002 I 2002II
2002 I 2002II
2002 I 2002II
2002 I 2002II
2002 I 2002II
2002 I 2002II
2002 I 2002II
2002 I 2002II
2002 I 2002II
Alaska Arizona Colorado Montana Nevada New Mexico North Dakota Oregon South Dakota Utah Wyoming
NO
x E
mis
sion
s [t
py] CBM Pump Engines
Gas Well - All Sources
Compressor Engines
Oil Well - All Sources
Salt Water Disposal
Artificial Lift
Drill Rigs

History of Oil and Gas EI’s – WRAP Phase I & IIPhase I & II Results – SOx “Area Source” Emissions (Phase II Total: 1,248
T.) WRAP Phase I and Phase II SOx Emissions for 2002
-
200
400
600
800
1,000
1,200
1,400
1,600
2002I
2002II
2002I
2002II
2002I
2002II
2002I
2002II
2002I
2002II
2002I
2002II
2002I
2002II
2002I
2002II
2002I
2002II
2002I
2002II
2002I
2002II
Alaska Arizona Colorado Montana Nevada NewMexico
NorthDakota
Oregon SouthDakota
Utah Wyoming
SO
x E
mis
sio
ns [
tpy] CBM Pump Engines
Gas Well - All Sources
Compressor Engines
Oil Well - All Sources
Salt Water Disposal
Artificial Lift
Drill Rigs

Phase II – 2002 NOx InventorySummary of All WRAP States O&G Point & Area Source Inventory
StatesAll Area Sources
All Point Sources TOTAL
Percent of WRAP
Alaska (#3) 886 45,431 46,317 16.1Arizona 17 642 659 0.2California 8,070 10,809 18,879 6.6Colorado (#2) 23,518 25,219 48,737 16.9Idaho 2,590 2,590 0.9Montana 7,557 3,996 11,553 4.0Nevada 62 83 145 0.1New Mexico (#1) 55,640 56,900 112,540 39.1North Dakota 4,631 4,638 9,269 3.3Oregon 85 1,182 1,267 0.4South Dakota 361 323 684 0.2Utah 3,335 3,049 6,384 2.2Washington 480 480 0.2Wyoming (#4) 14,725 13,423 28,148 9.8WRAP Total 118,887 168,765 287,652 100.0

Phase II – 2002 SO2 InventorySummary of All WRAP States O&G Point & Area Source Inventory
StatesAll Area Sources
All Point Sources TOTAL
Percent of WRAP
Alaska 66 773 839 2.6Arizona 0 0 0 0.0California 57 887 944 3.0Colorado 118 91 209 0.7Idaho 7 7 0.0Montana 225 11 236 0.7Nevada 1 0 1 0.0New Mexico (#1) 250 13,675 13,925 43.7North Dakota 358 2,944 3,302 10.4Oregon 0 8 8 0.0South Dakota 6 10 16 0.1Utah 17 0 17 0.1Washington 8 8 0.0Wyoming (#2) 150 12,188 12,338 38.7WRAP Total 1,248 30,602 31,850 100.0
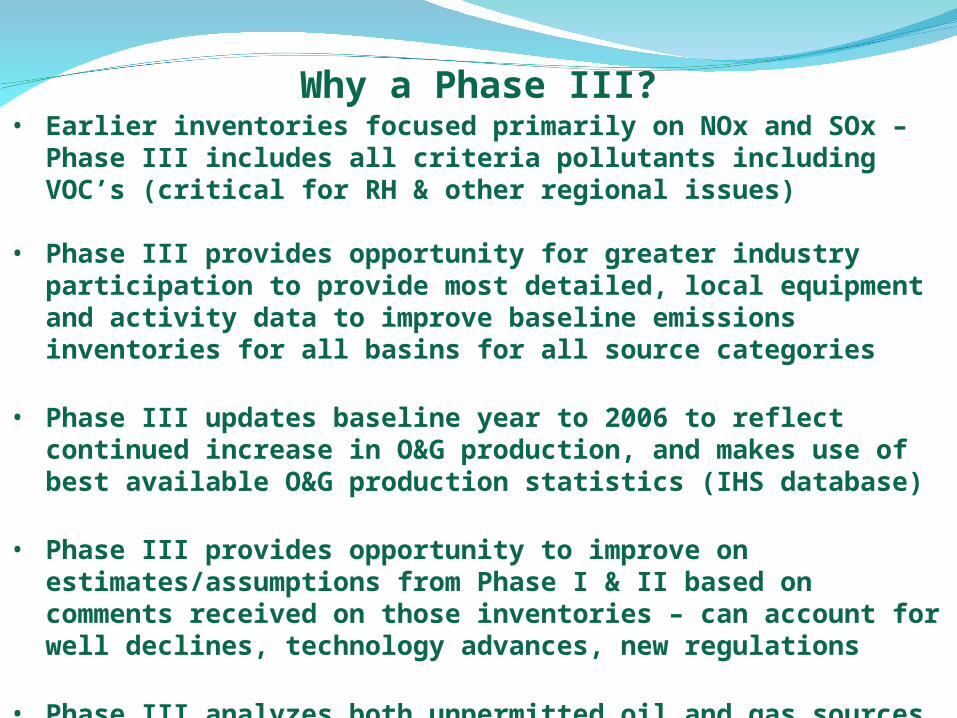
• Earlier inventories focused primarily on NOx and SOx – Phase III includes all criteria pollutants including VOC’s (critical for RH & other regional issues)
• Phase III provides opportunity for greater industry participation to provide most detailed, local equipment and activity data to improve baseline emissions inventories for all basins for all source categories
• Phase III updates baseline year to 2006 to reflect continued increase in O&G production, and makes use of best available O&G production statistics (IHS database)
• Phase III provides opportunity to improve on estimates/assumptions from Phase I & II based on comments received on those inventories – can account for well declines, technology advances, new regulations
• Phase III analyzes both unpermitted oil and gas sources and state permit data to generate complete oil and gas inventory for all major source categories
Why a Phase III?

• Project initiated (& funded) by the Independent Petroleum Association of the Mountain States
• IPAMS solicited WRAP Stakeholder participation: foster a sense of reviewer confidence in the integrity and acceptability of results
• Additional O&G Workgroup participation was recruited from interested WRAP stakeholder groups (State & Tribal Agencies, EPA, FLM’s, O&G Industry & Environmental Groups) to assure broad representation
• O&G WG provides feedback on the Scope and Methodology • O&G Workgroup identified limitations of Phase III
• does not identify emissions from on and non-road mobile sources associated with O&G field operations
• does not quantify HAP or Greenhouse Gas emissions associated with O&G field operations
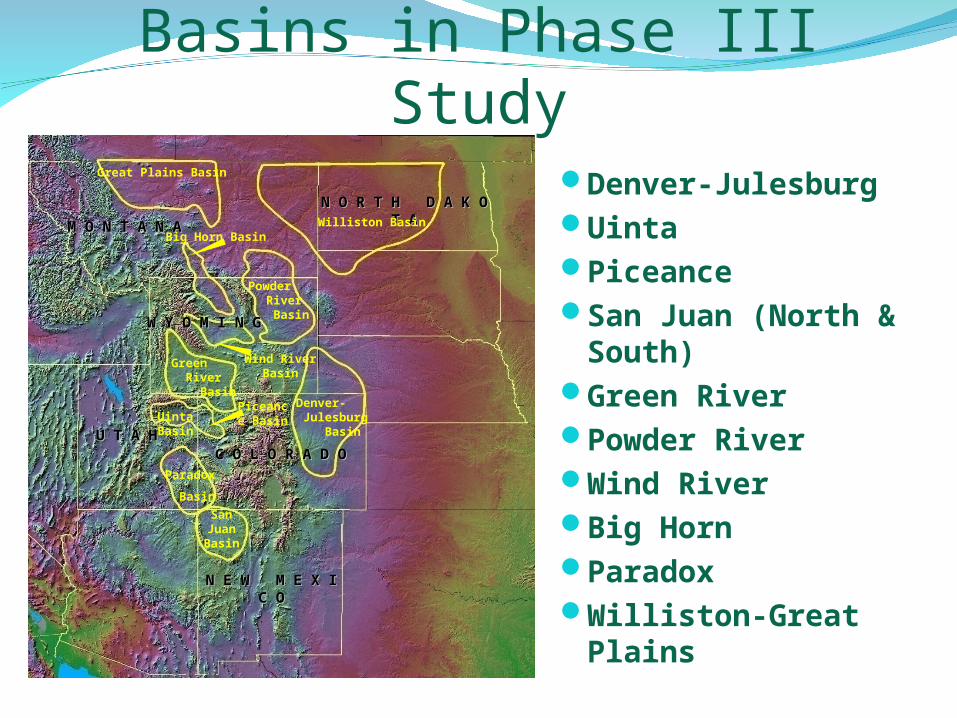
Basins in Phase III StudyDenver-JulesburgUintaPiceanceSan Juan (North &
South)Green RiverPowder RiverWind RiverBig HornParadoxWilliston-Great
Plains
N O R T H D A K O T AN O R T H D A K O T A
C O L O R A D OC O L O R A D O
N E W M E X I C ON E W M E X I C O
M O N T A N AM O N T A N A
W Y O M I N GW Y O M I N G
U T A HU T A H
Williston Basin
Wind RiverBasin
Powder River
Basin
Big Horn Basin
Green River
Basin
Uinta Basin
Paradox
Basin
SanJuanBasin
Piceance Basin
Denver- Julesburg
Basin
Great Plains Basin
Phase III Emissions Inventory
Temporal (inventories produced for 3 time frames)All basins will have complete source
inventories for a base year (2006), a mid-term projection (2010 or 2012) and far future year projection (2018) – for all exploration and production activities.
Pollutants NOx, SOx, PM, VOC, CO

Emissions Inventory SourcesNatural Gas Processing PlantsCompressor StationsWellhead Compressor EnginesCBM Pump EnginesMiscellaneous or Exempt
EnginesDrilling/Workover RigsSalt-water Disposal EnginesArtificial Lift Engines
(Pumpjacks)Vapor Recovery Units (VRU’s)Oil/Gas Well HeatersHydrocarbon Liquid Storage
Tanks
Well Completions Fugitive Emissions Completion Venting Well Blowdowns Dehydration Units Amine Units Hydrocarbon Liquid
Loading Landfarms Water
Treatment/Injection Flaring Pneumatic Devices Produced Water Tanks

Unpermitted sources surveys to O&G
producers
Combined survey responses for all
participating companies
Permitted sources data from state and/or
federal standard permits
Any additional state reporting data
Complete oil and gas emissions inventory for
entire basin
Phase III Methodology Diagram for Inventory Development
IHS database (oil and gas production
and well and spud counts)
Scaled-up unpermitted sources emissions for
entire basin

November 2007 – June 2008
Completed D-J Basin baseline 2006 emissions and mid-term 2012 projections in April ‘08
Begin Uinta Basin baseline 2006 and mid-term 2012 projections Begin Piceance Basin baseline 2006 emissions
July 2008
Complete draft Uinta Basin baseline 2006 projections Complete draft Piceance Basin baseline 2006 emissions Begin Piceance Basin mid-term 2012 projections Begin North San Juan baseline 2006 emissions and mid-term 2012 projections Begin South San Juan Basin baseline 2006 and mid-term emissions
August – September 2008
Complete draft Uinta Basin mid-term 2012 projections Complete draft Piceance Basin mid-term 2012 projections South San Juan Basin Surveys to Producers
October 2008
Complete North San Juan Basin baseline 2006 emissions Wyoming Surveys to Producers

Phase III Study Schedule (cont.)
November 2008
Complete North San Juan Basin mid-term 2012 projections Complete South San Juan Basin baseline 2006 & mid-term 2012
emissions
December 2008
Complete all Wyoming basins baseline 2006 emissions Begin Wyoming basins mid-term 2012 projections
January 2009
Anticipated Release Uinta & Piceance Basin Emissions Complete Wyoming basins mid-term 2012 projections Williston, Great Plains & Paradox Basins Surveys to Producers
March 2009 Complete Williston, Great Plains & Paradox Basins 2006 Baseline
April 2009 Complete Williston, Great Plains & Paradox Basins mid-term 2012 projections
May 2009 Begin Far Future Year 2018 Projections for all Basins
June 2009 Final Project Report
Phase III Study Review Process
WRAP O&G Workgroup will study base and future years’ emission inventory results for each basin and review final technical memo
Workgroup participants represent: States & Tribal Agencies, EPA, Federal Land Managers, Industry, Environmental Interest Groups
WRAP staff will summarize comments from each basin workgroup session
Phase III work products at:http://www.wrapair.org/forums/ogwg/
PhaseIII_Inventory.html
IPAMS/WRAP Phase III Oil & Gas Emission Inventory Project& WRAP O&G Workgroup
QUESTIONS ?