Thames Estuary Long Sand Head - assets.publishing.service ...
14
Assessment – TE5A/2016 © Crown Copyright Produced for: THAMES ESTUARY LONG SAND HEAD (TE5A) ASSESSMENT TE5A/2016 V2 An assessment of the 2016 hydrographic survey of the area TE5A: to monitor recent seabed movement; to identify any implications for shipping; and to make recommendations for future surveys.
Transcript of Thames Estuary Long Sand Head - assets.publishing.service ...
Assessment – TE5A/2016 © Crown Copyright
Produced for:
THAMES ESTUARY
LONG SAND HEAD (TE5A)
ASSESSMENT TE5A/2016 V2
An assessment of the 2016 hydrographic survey of the area TE5A: to monitor recent seabed movement; to identify any implications for shipping; and to make recommendations for future surveys.
Assessment – TE5A/2016 © Crown Copyright
CONTENTS
1. Executive Summary 1
2. Introduction 1
3. Area History 2
4. Description Of The Area 3
5. Shipping In The Area 5
6. Reference Survey Detail 7
7. Comparison Survey Detail 7
8. Description of Recent Bathymetric Change 7
9. Implications for Shipping 11
10. Recommendations for Future Surveys 12
Assessment – TE5A/2016 © Crown Copyright
Page 1 of 12
LONG SAND HEAD TE5A, 2016
1. EXECUTIVE SUMMARY
The Area and Recent Changes
1.1 Area TE5A is fully surveyed every 3 years, with intervening annual surveys focusing on two critical areas within TE5A.
1.2 TE5A covers the Sunk and Trinity Deep Water Routes (DWR) approaching Black Deep, an important route into the Thames Estuary and Medway. TE5A also covers the northern tip of Long Sand Head.
1.3 The minimum depths in the TE5A survey area are drying heights on Long Sand Head, however only vessels with the smallest draughts transit close to here. The controlling depth in the Sunk DWR focused area (14m) and the controlling depth in the vicinity of Trinity DWR (12.5m) have both shoaled since last surveyed. Sandwaves up to 6m high are in the sandwave area northeast of Long Sand Head, which is similar height to previous surveys.
1.4 The largest draught of vessel transiting the TE5A area in 2016 was 16m within the Sunk DWR and Trinity DWR. The majority of vessels transiting close to Long Sand Head have draughts less than 10m.
Reasons for Continuing to Resurvey the Area
1.5 Depths in TE5A form the controlling depths for vessels using the Trinity and Sunk DW routes, where sandwaves nearby could infringe on the routes.
1.6 Long Sand Head and the sandwave areas to the northeast of Long Sand Head are migrating north-eastwards towards the start of the Long Sand Head Two-Way Route, and shoaling depths close to this route require annual monitoring.
Recommendations
1.7 The limits outlined in Section 4 and the frequency of the triannual and annual focused surveys remain unchanged.
2. INTRODUCTION
2.1 This Assessment is produced by the United Kingdom Hydrographic Office (UKHO) for the Maritime and Coastguard Agency (MCA).
2.2 Analysis of the Routine Resurvey Areas forms part of the Civil Hydrography Programme and the reports are made available to all interested parties through the UKHO website and are presented to the Civil Hydrography Working Group. When approved, the recommendations are incorporated into the Routine Resurvey Programme.
2.3 The Admiralty Chart extracts, other graphics and tables in this Report are included for illustrative purposes only and are NOT TO BE USED FOR NAVIGATION.
2.4 This material is protected by Crown Copyright. It may be downloaded from the UK Hydrographic Office's (UKHO) web site and printed in full for personal or non-commercial internal business use. Extracts may also be reproduced for personal or non-commercial internal business use on the condition that the UK Hydrographic Office is acknowledged as the publisher and the Crown is acknowledged as the copyright owner.

Assessment – TE5A/2016 © Crown Copyright
Page 2 of 12
2.5 Applications for permission to reproduce the material for any other purpose (including any distribution of the material or extracts to third parties) can be made interactively on the UKHO's web site (www.ukho.gov.uk), by e-mail to [email protected] or in writing to Intellectual Property, UK Hydrographic Office, Admiralty Way, Taunton, Somerset, TA1 2DN.
3. AREA HISTORY
3.1 Summary of Surveys:
Key: s = sonar sweep, t = seabed texture tracing, d = digital data, m = multibeam digital data Single-beam surveys (prior to 2004) conducted at 1:25,000 scale
Year Survey Reference Data Year Survey Reference Data
1985 K9654* H2341/84 s. 1986 K9848* H2342/85 s.
1987 M1118* H4025/86 s.t. 1988 M1229* H6336/87 s.t.d.
1989 M1380* H3934/88 s.d. 1990 M1596* HH090/495/01 s.d.
1991 M1805* HH090/516/01 s.d. 1992 M1913 HH090/549/01 s.t.d.
1993 M2134 HH090/574/01 s.t.d. 1994 M2269 HH090/626/01 s.d.
1995 M2496 HH090/652/01 s.t.d. 1996 M2671 HH090/690/01 s.d
1997 M2815 HH090/743/01 s.d 1998 M3009 HH090/769/01 s.d
1999 M3235 HH090/852/01 s.d 1999 M3293 HH090/852/01 s.d
2000 M3376 HH090/886/01 s.d 2001 M3558 HH090/936/01 s.d
2002 M3739 HH090/993/01 s.t.d 2003 M3924 HH091/023/01 s.d.
2004 M4183 HH091/078/01 m 2005 M4356 HH091/116/01 m
2006 M4565 RSDRA2007000444 m 2007 M4643 RSDRA2007007601 m
2008 HI1265 RSDRA2008026409 m 2012 HI1398 RSDRA2012000117404 m
2013 HI1433 RSDRA2013000244604 m 2014 HI1459 RSDRA2013000244604 m
2015 HI1483 RSDRA2013000244604 m
Assessment – TE5A/2016 © Crown Copyright
Page 3 of 12
3.2 Summary of historical recommendation enacted
Year Remarks
1985 Area 5A established (H0423/85)
1999 Area expanded to take on part of Area TE6A. Focused annual surveying of the Deep Water Tracks and Long Sand Head. Remainder of the area to be surveyed every 3 years
2000 Area extended to cover the Sunk DW track
2001 Reduction in extent of the focused areas covering Sunk and Trinity DW tracks
2002 Reduction in extent of main survey area; increase in size of focused survey areas.
2003 Area expanded to take on part of Area TE6A. Focused annual surveying of the Deep Water Tracks and Long Sand Head. Remainder of the area to be surveyed every 3 years
2006 Adjacent area TE5B combined with TE5A
2007 Reduction in extent of the focused areas covering Sunk and Trinity DW tracks
2012 Reduction in extent of main survey area; increase in size of focused survey areas
4. DESCRIPTION OF THE AREA
4.1 The two focused areas of TE5A cover parts of the Sunk and Trinity Deep Water Route (DWR), as well as the northern tip of Long Sand and the entrance to the Long Sand Head Two-Way Route. This area covers the approaches to Black Deep which is an important route into the Thames Estuary and Medway for deep draught vessels.
4.2 The shoalest depth in TE5A is -0.2m (drying) on Long Sand.
4.3 The key navigationally significant seabed feature in TE5A is the eastern extent of the sand bank at Long Sand Head. This has extended north-eastwards over recent years, continuously encroaching on the Long Sand Head two-way shipping route and requiring the repositioning of Black Deep buoy.
4.4 Sandwaves along both Sunk and Trinity DWR and north of Long Sand Head sand bank provide the controlling depths for shipping using the route as an approach into Black Deep. Sandwaves and ripples vary in height across the TE5A area, with a maximum crest height of 6m north of Long Sand Head. Sandwaves in the Trinity DWR and Long Sand Head areas are symmetric and migrate in a north-easterly direction, a trend which matches historical changes. There are small patches of ripples and sandwaves along Sunk DWR which historically haven’t migrated in any particular direction.
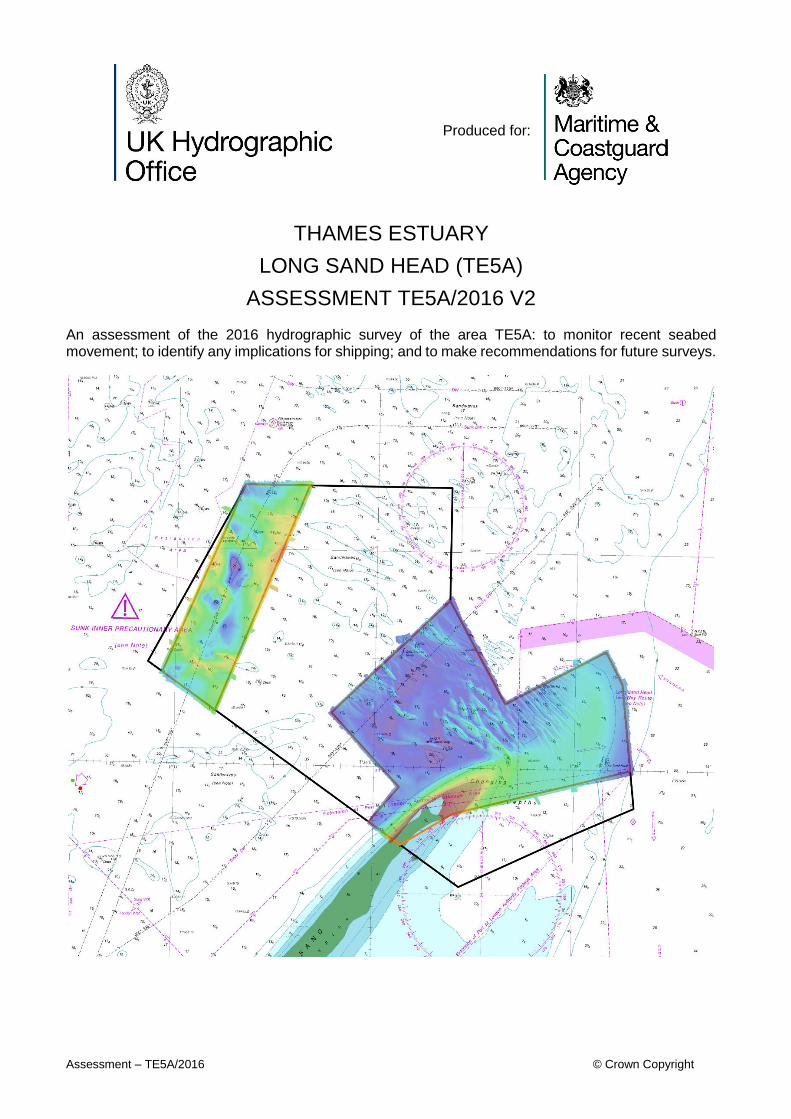
4.5 Area Covered: 4.43 NM2 (15.2 km2) as shown in Figure 1 below.

Assessment – TE5A/2016 © Crown Copyright
Page 4 of 12
Figure 1 – 2016 survey data sun-illuminated view overlaid on BA Chart 2692
4.6 The geographic limits of TE5A at the time of resurvey are shown in the Tables 1 and 2 below and coordinates are in Decimal Degrees referenced to WGS84:
Table 1: TE5A Trinity DWR and Long Sand Head Focused Area Limits
Point Latitude (N) Longitude (E)
01 51.79146 1.59890
02 51.79692 1.60635
03 51.80825 1.58920
04 51.82583 1.61834
05 51.81000 1.63252
06 51.81833 1.65750
07 51.81333 1.66167
08 51.80000 1.66400
09 51.79294 1.61996
10 51.78799 1.60693
Assessment – TE5A/2016 © Crown Copyright
Page 5 of 12
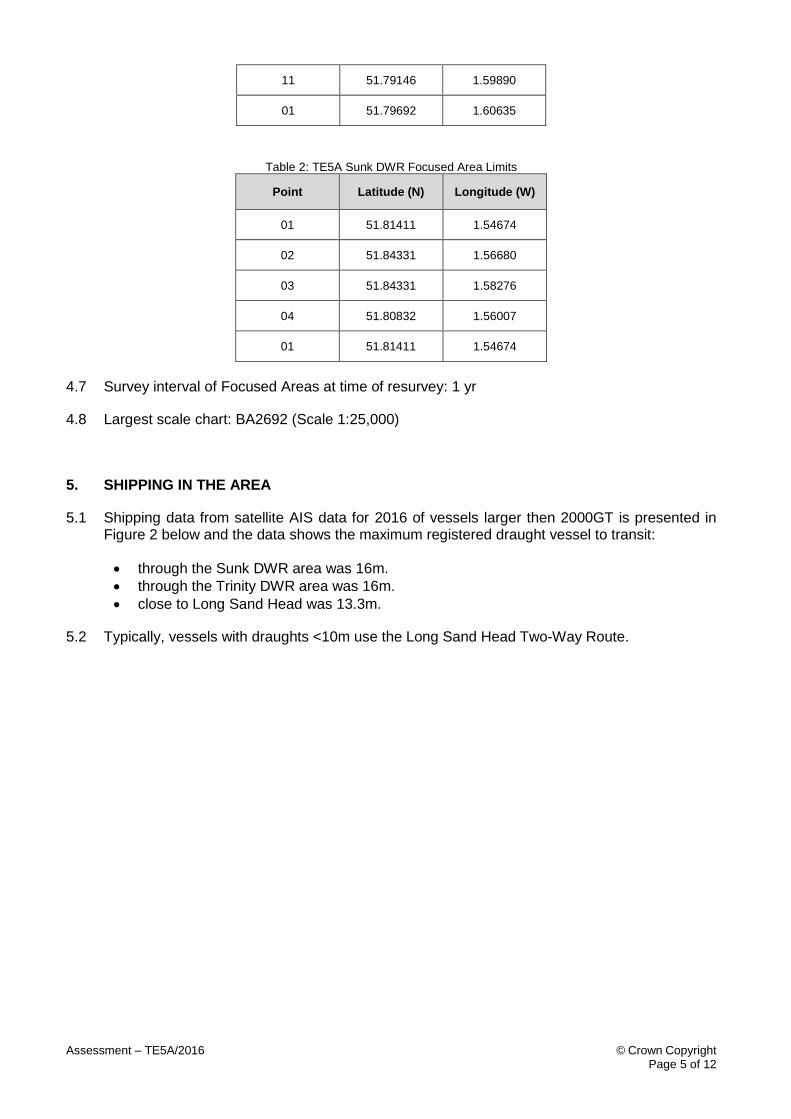
Table 2: TE5A Sunk DWR Focused Area Limits
Point Latitude (N) Longitude (W)
01 51.81411 1.54674
02 51.84331 1.56680
03 51.84331 1.58276
04 51.80832 1.56007
01 51.81411 1.54674
4.7 Survey interval of Focused Areas at time of resurvey: 1 yr
4.8 Largest scale chart: BA2692 (Scale 1:25,000)
5. SHIPPING IN THE AREA
5.1 Shipping data from satellite AIS data for 2016 of vessels larger then 2000GT is presented in Figure 2 below and the data shows the maximum registered draught vessel to transit:
• through the Sunk DWR area was 16m.
• through the Trinity DWR area was 16m.
• close to Long Sand Head was 13.3m.
5.2 Typically, vessels with draughts <10m use the Long Sand Head Two-Way Route.
11 51.79146 1.59890
01 51.79692 1.60635

Assessment – TE5A/2016 © Crown Copyright
Page 6 of 12
Figure 2 – Indicative shipping routes overlaid on BA Chart 2692
Deep Water Track
2016 Survey Area Limits
Indicative shipping routes of vessels with <10m draught
Indicative shipping routes of vessels with >10m draught
Assessment – TE5A/2016 © Crown Copyright
Page 7 of 12
6. REFERENCE SURVEY DETAIL
6.1 The last historical Routine Resurvey gathered via the Civil Hydrography Programme (CHP) for area TE5A was in 2015 under HI1483. This has been used as the reference to compile this assessment. HI1483 was surveyed from 15th August to 3rd October 2015 in conjunction with other re-survey areas and with days lost due to poor weather.
6.2 The survey data was acquired using multibeam echosounder system. The primary reference position system used GNSS and was supplemented by a dynamic GNSS Precise Point measuring system. The survey is referred to the European Terrestrial Reference Frame 1989 (ETRF89) datum.
6.3 Observations from GNSS 3D positioning were combined with the UKHO Vertical Offshore Reference Frame (VORF) to reduce depths to Chart Datum. The final deliverable was a 1m resolution CUBE (Combined Uncertainty and Bathymetry Estimator) surface.
6.4 The survey was validated by UKHO and met IHO S44 (5th Edition) Order 1a standards.
6.5 The Report of Survey for this surveys is available upon request from the UKHO and the validated bathymetric surfaces are available to download from INSPIRE portal and MEDIN Bathymetry Data Archive Centre.
7. COMPARISON SURVEY DETAIL
7.1 The latest survey undertaken as part of the Routine Resurvey Lot of CHP was in 2016 under HI1522. TE5A Sunk DWR Focused Area was surveyed on 6th August and TE5A Trinity DWR and Long Sand Head Focused Area was surveyed 7th to 11th August. There were no days lost during the data acquisition due to poor weather conditions.
7.2 The survey data was acquired using multibeam echosounder system. The primary reference position system used GNSS and was supplemented by a dynamic GNSS Precise Point measuring system. The survey is referred to the European Terrestrial Reference Frame 1989 (ETRF89) datum.
7.3 Observations from GNSS 3D positioning were combined with the UKHO Vertical Offshore Reference Frame (VORF) to reduce depths to Chart Datum. The final deliverable was a 1m resolution CUBE (Combined Uncertainty and Bathymetry Estimator) surface.
7.4 The survey was validated by UKHO and met IHO S44 (5th Edition) Order 1a standards.
7.5 The Report of Survey for this surveys is available upon request from the UKHO and the validated bathymetric surfaces are available to download from INSPIRE portal and MEDIN Bathymetry Data Archive Centre.
8. DESCRIPTION OF RECENT BATHYMETRIC CHANGE
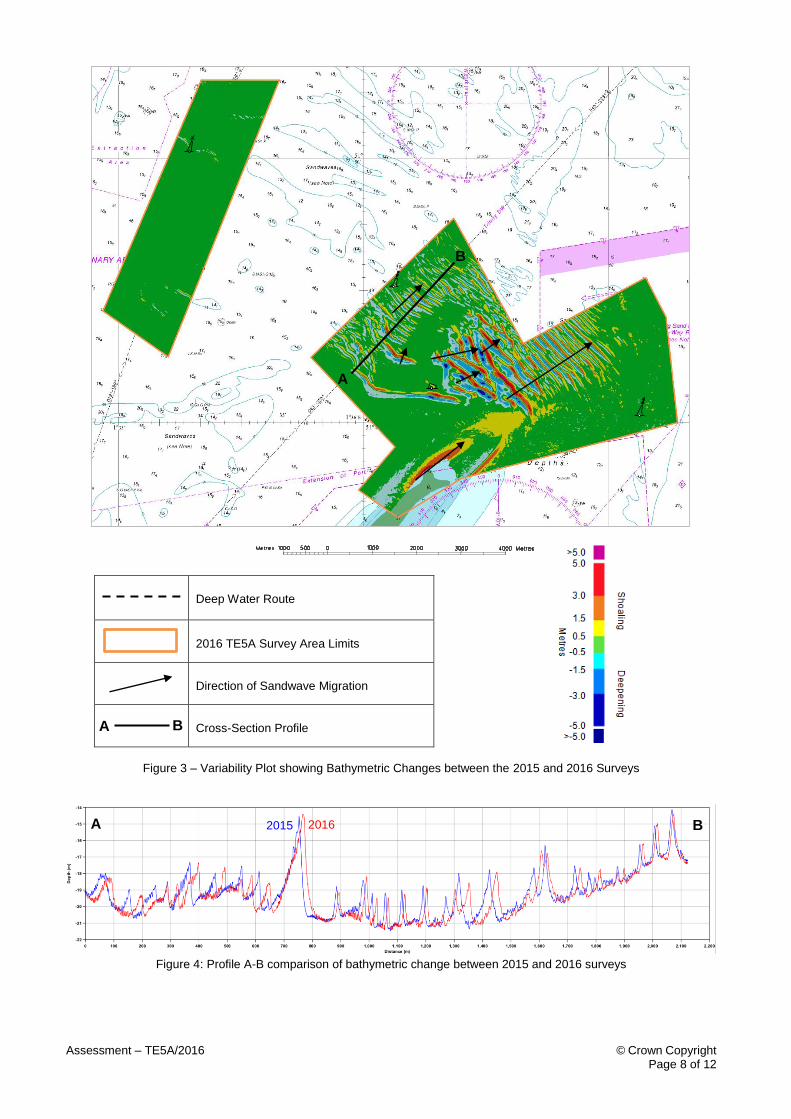
8.1 The Variability Plot in Figure 3 shows that between 2015 and 2016 the main areas of bathymetric change have been over Long Sand Head, the sandwave areas in the centre of the survey area and north-east of Long Sand Head. These have all migrated north-eastwards towards the Long Sand Head Two-Way Route and will be presented in greater detail in paragraphs 8.4 to 8.8. Figure 3 and Figure 4 show that sandwaves along Trinity DWR have migrated up to 20m north-easterly since 2015 and are of similar heights to those reported in 2015 (up to 5m). There has been little sediment migration along the Sunk DWR.
Assessment – TE5A/2016 © Crown Copyright
Page 8 of 12
Deep Water Route
2016 TE5A Survey Area Limits
Direction of Sandwave Migration
Cross-Section Profile
Figure 3 – Variability Plot showing Bathymetric Changes between the 2015 and 2016 Surveys
Figure 4: Profile A-B comparison of bathymetric change between 2015 and 2016 surveys
A B
B
A
A B 2015 2016
Assessment – TE5A/2016 © Crown Copyright
Page 9 of 12
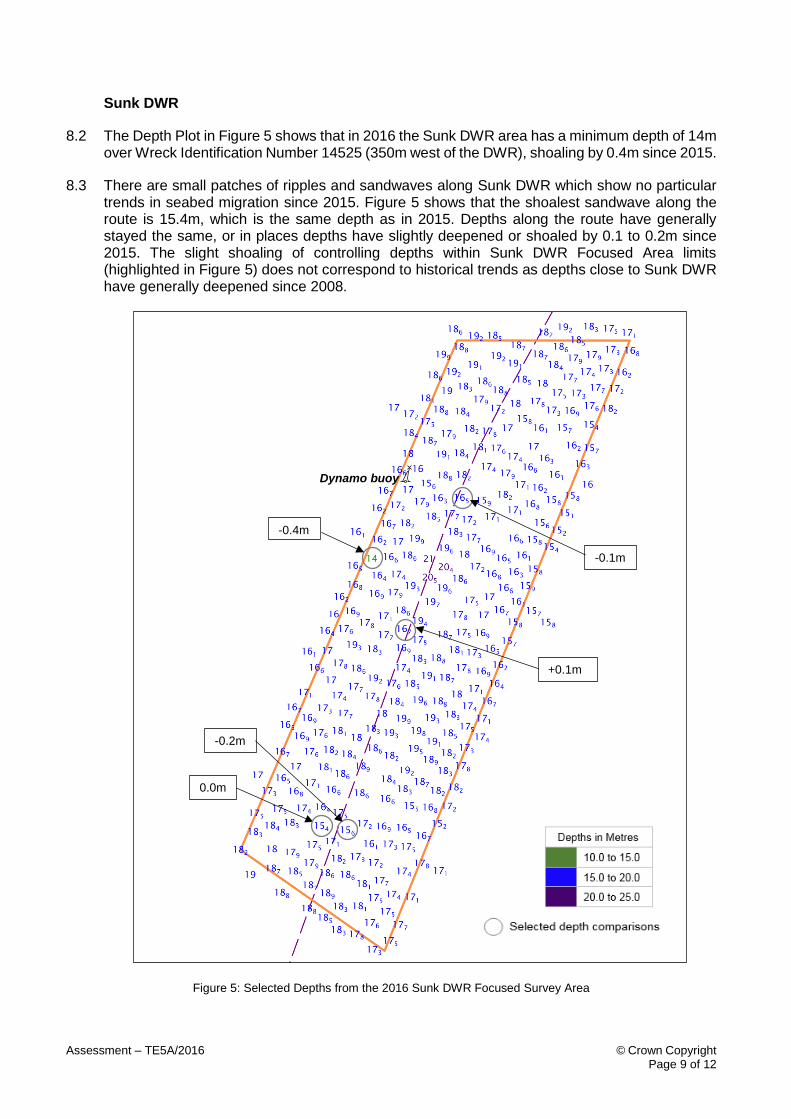
Sunk DWR
8.2 The Depth Plot in Figure 5 shows that in 2016 the Sunk DWR area has a minimum depth of 14m over Wreck Identification Number 14525 (350m west of the DWR), shoaling by 0.4m since 2015.
8.3 There are small patches of ripples and sandwaves along Sunk DWR which show no particular trends in seabed migration since 2015. Figure 5 shows that the shoalest sandwave along the route is 15.4m, which is the same depth as in 2015. Depths along the route have generally stayed the same, or in places depths have slightly deepened or shoaled by 0.1 to 0.2m since 2015. The slight shoaling of controlling depths within Sunk DWR Focused Area limits (highlighted in Figure 5) does not correspond to historical trends as depths close to Sunk DWR have generally deepened since 2008.
Figure 5: Selected Depths from the 2016 Sunk DWR Focused Survey Area
Dynamo buoy
-0.4m
-0.1m
0.0m
-0.2m
+0.1m
Assessment – TE5A/2016 © Crown Copyright
Page 10 of 12
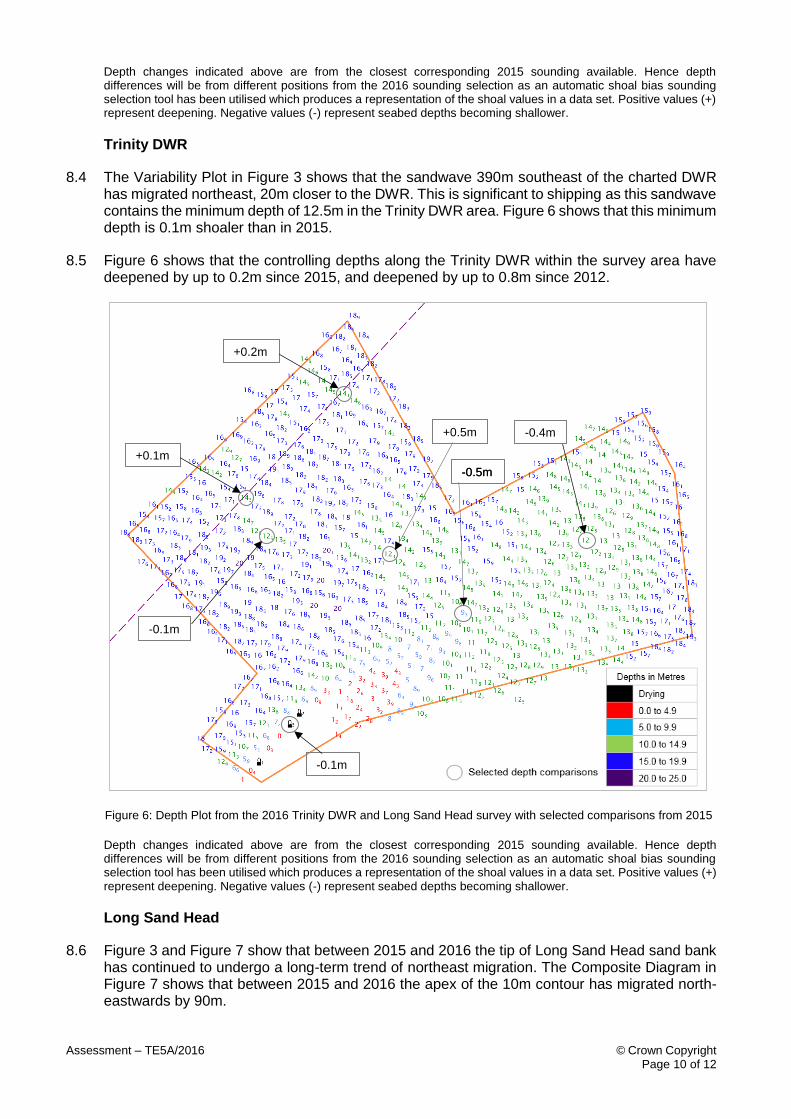
Depth changes indicated above are from the closest corresponding 2015 sounding available. Hence depth differences will be from different positions from the 2016 sounding selection as an automatic shoal bias sounding selection tool has been utilised which produces a representation of the shoal values in a data set. Positive values (+) represent deepening. Negative values (-) represent seabed depths becoming shallower.
Trinity DWR
8.4 The Variability Plot in Figure 3 shows that the sandwave 390m southeast of the charted DWR has migrated northeast, 20m closer to the DWR. This is significant to shipping as this sandwave contains the minimum depth of 12.5m in the Trinity DWR area. Figure 6 shows that this minimum depth is 0.1m shoaler than in 2015.
8.5 Figure 6 shows that the controlling depths along the Trinity DWR within the survey area have deepened by up to 0.2m since 2015, and deepened by up to 0.8m since 2012.
Figure 6: Depth Plot from the 2016 Trinity DWR and Long Sand Head survey with selected comparisons from 2015
Depth changes indicated above are from the closest corresponding 2015 sounding available. Hence depth differences will be from different positions from the 2016 sounding selection as an automatic shoal bias sounding selection tool has been utilised which produces a representation of the shoal values in a data set. Positive values (+) represent deepening. Negative values (-) represent seabed depths becoming shallower.
Long Sand Head
8.6 Figure 3 and Figure 7 show that between 2015 and 2016 the tip of Long Sand Head sand bank has continued to undergo a long-term trend of northeast migration. The Composite Diagram in Figure 7 shows that between 2015 and 2016 the apex of the 10m contour has migrated north-eastwards by 90m.
+0.1m
+0.2m
-0.1m
-0.1m
-0.4m
-0.5m -0.5m
+0.5m

Assessment – TE5A/2016 © Crown Copyright
Page 11 of 12
8.7 The largest sandwaves in the TE5A survey area are up to 6m high, found in the sandwave area in the centre of the survey area northeast of Long Sand Head. Figure 3 shows that this area of large sandwaves have migrated up to 45m in a north-eastly direction towards the Long Sand Head Two-Way Route.
8.8 The Depth Plot in Figure 6 shows that the shoalest depth on the sandwave area northeast of Long Sand Head is 9.5m (0.5m shoaler than in 2015). This may be due to the tip of Long Sand Head migrating towards this sandwave area. The minimum depth in the eastern part of the survey area has also from 12.5m in 2015 to 12.1m in 2016.
Figure 7: Composite Diagram of the 10m contour from the 2015 and 2016 Surveys
9. IMPLICATIONS FOR SHIPPING
9.1 Depths along the Sunk DWR have generally remained similar to those in 2015 and the controlling depths along the Trinity DWR have deepened. However, the shoaling of the wreck close to the Sunk DWR (14m) and the shoaling of the sandwave close to the Trinity DWR (12.5m) should continue to be monitored in future surveys due to their proximity to vessels with the largest draughts (16m). Also, the sandwave containing the 12.5m depth has migrated 20m closer to the Trinity DWR, which is therefore a concern to shipping in this area.

Assessment – TE5A/2016 © Crown Copyright
Page 12 of 12
9.2 The north-eastern migration of Long Sand Head does not affect vessels using the charted Trinity DWR, but it does remain a concern to vessels using the Long Sand Two-Way Route due to the subsequent shoaling of the seabed in the sandwave areas close to the start of the route.
10. RECOMMENDATIONS FOR FUTURE SURVEYS
10.1 Depths along main deep water shipping routes remain close to the draught of the largest vessels transiting the TE5A area. Therefore, the area should remain in the Routine Resurvey Programme. It is recommended that the limits outlined in Section 4 and the frequency of the focussed and triannual surveys remain unchanged.