Local Action Project Demo Area: Thames Estuary Partnership
62
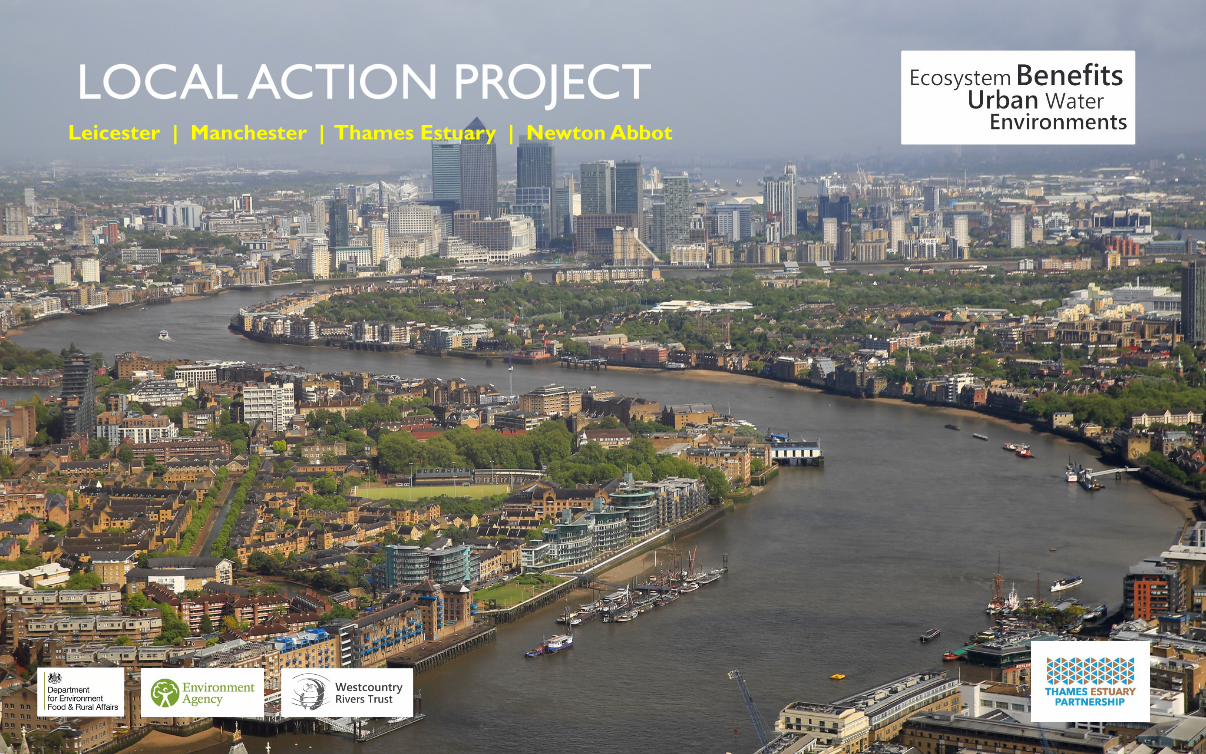
LOCAL ACTION PROJECT Leicester | Manchester | Thames Estuary | Newton Abbot
-
Upload
westcountry-rivers-trust -
Category
Environment
-
view
520 -
download
6
Transcript of Local Action Project Demo Area: Thames Estuary Partnership

LOCAL ACTION PROJECTLeicester | Manchester | Thames Estuary | Newton Abbot
LOC
AL A
CT
ION
PR
OJE
CT
Barriers to SuDS/GI delivery & evidence gaps. CaBA Urban Workshop – Birmingham, Oct 2015
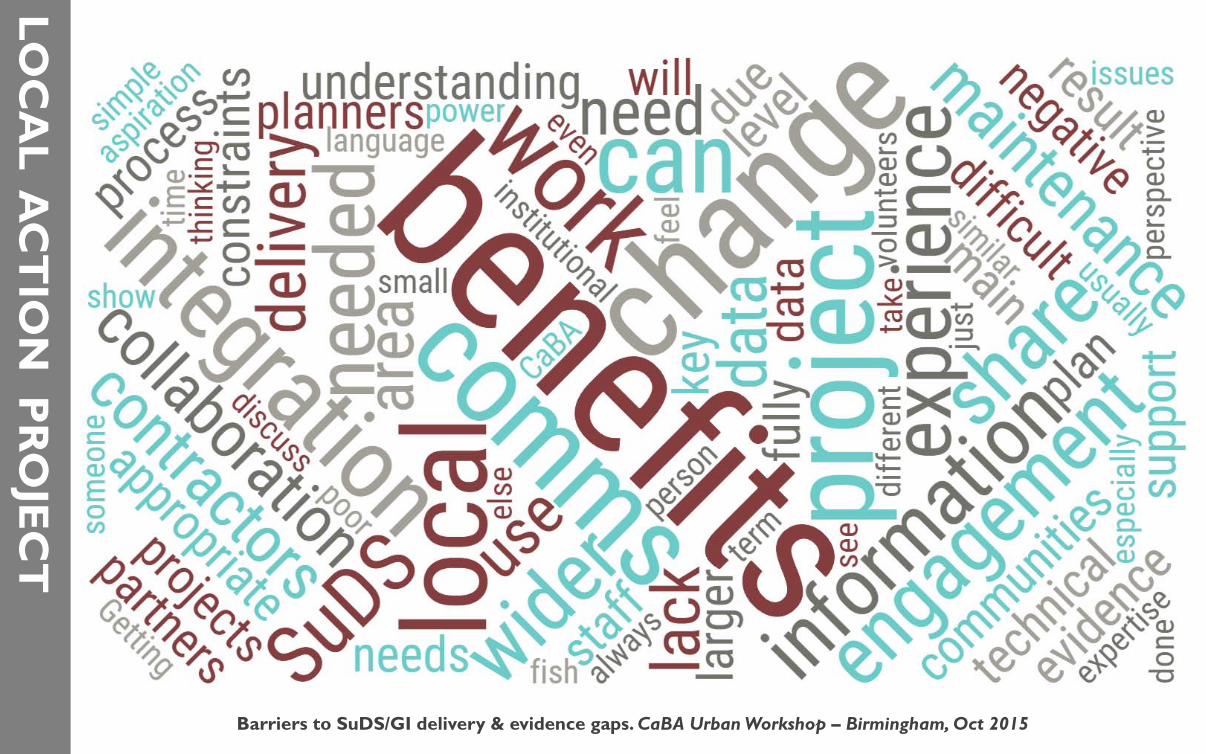
LOCAL COMMUNITY
ActionPractical implementation of environmental measures
ActionPractical implementation of environmental measures
www
Place making
GOVERNMENT BODIES
EnablingConditionsEnablingConditionsEnablingConditions
LOC
AL A
CT
ION
PR
OJE
CT
LOCAL ACTION PROJECT
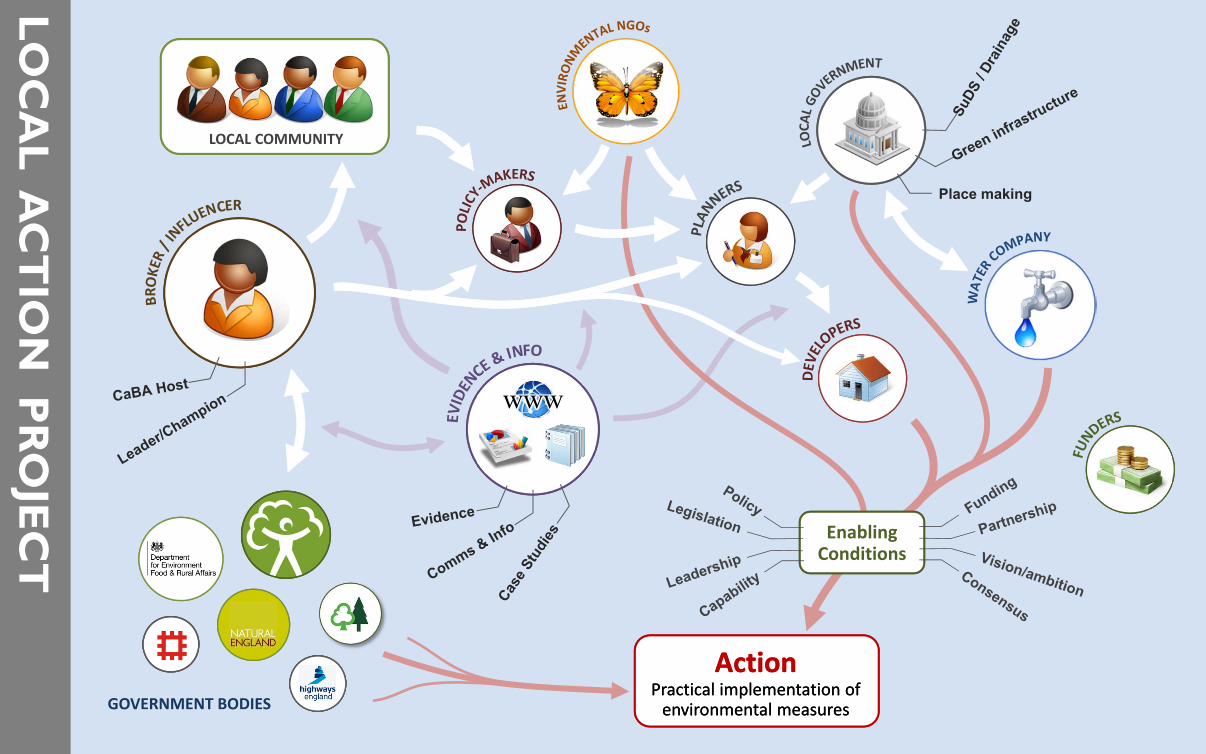
STRATEGIC DATA, EVIDENCE + INFORMATION
Present robust evidence in a clear way to help build consensus, facilitate local decision-making & secure funding
VALUING THE BENEFITS FROM NATURAL CAPITAL
Develop a clear understanding of the social, cultural, environmental and economic benefits provided by natural capital in urban landscapes and estimating potential improvements
LOCAL CHOICES, PRIORITIES + AMBITIONS
Talk to the local community and civil society groups to discover their future vision and ambition for where they live
FUNDING + RESOURCES FOR ACTION
Support the formation of effective stakeholder-led partnerships by increasing engagement, mobilising local delivery organisations and tapping into funding sources
Working with local communities to enhance the value of natural capital in ourtowns, cities and other urban spaces to improve people’s lives, the environment &economic prosperity…
LOC
AL A
CT
ION
PR
OJE
CT
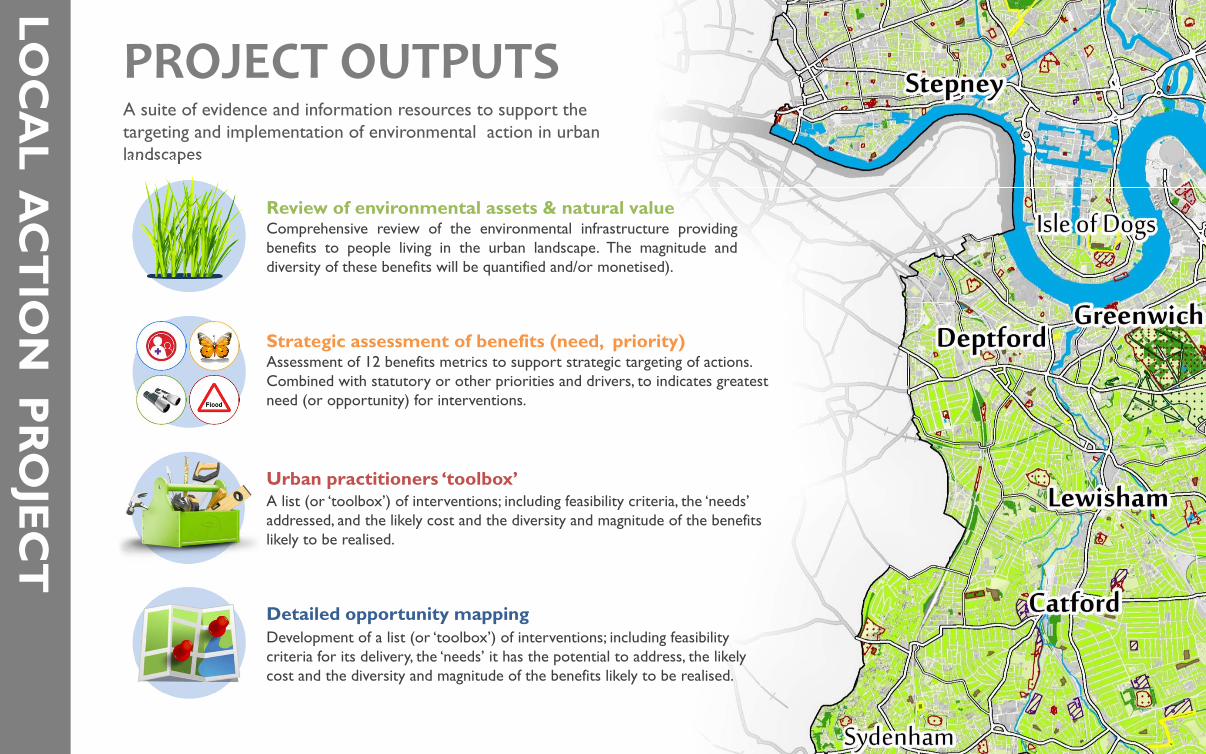
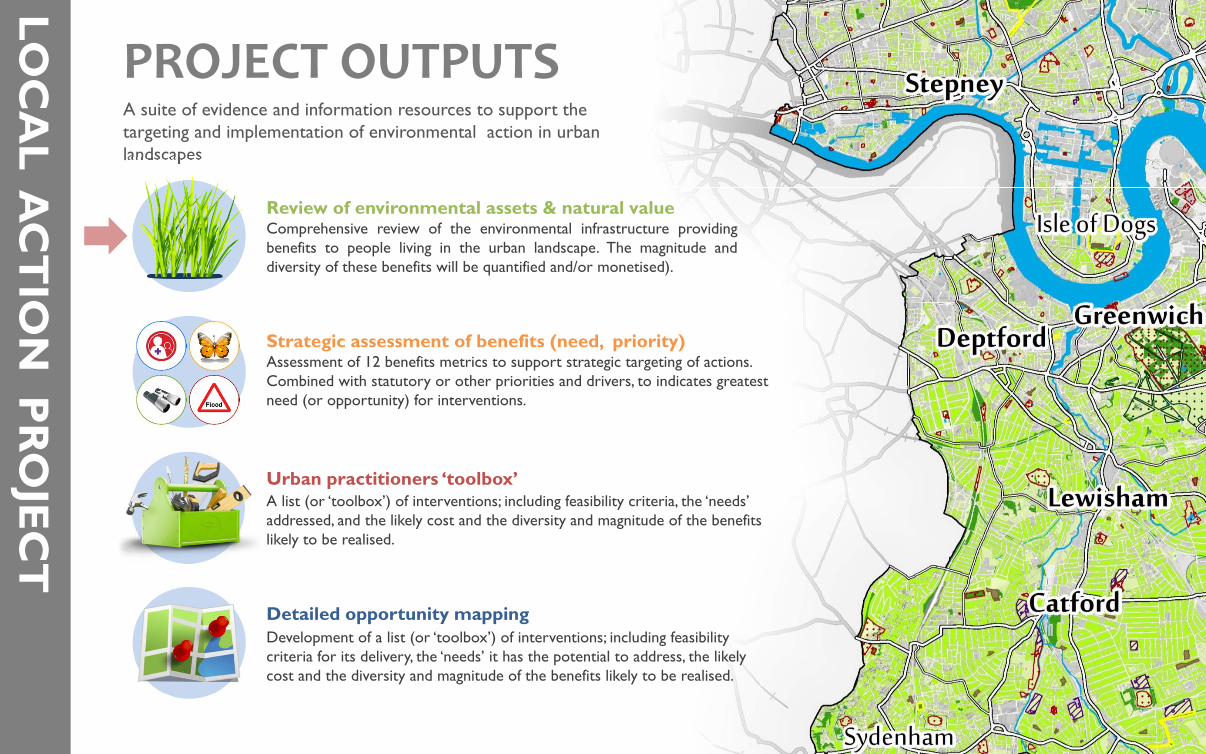
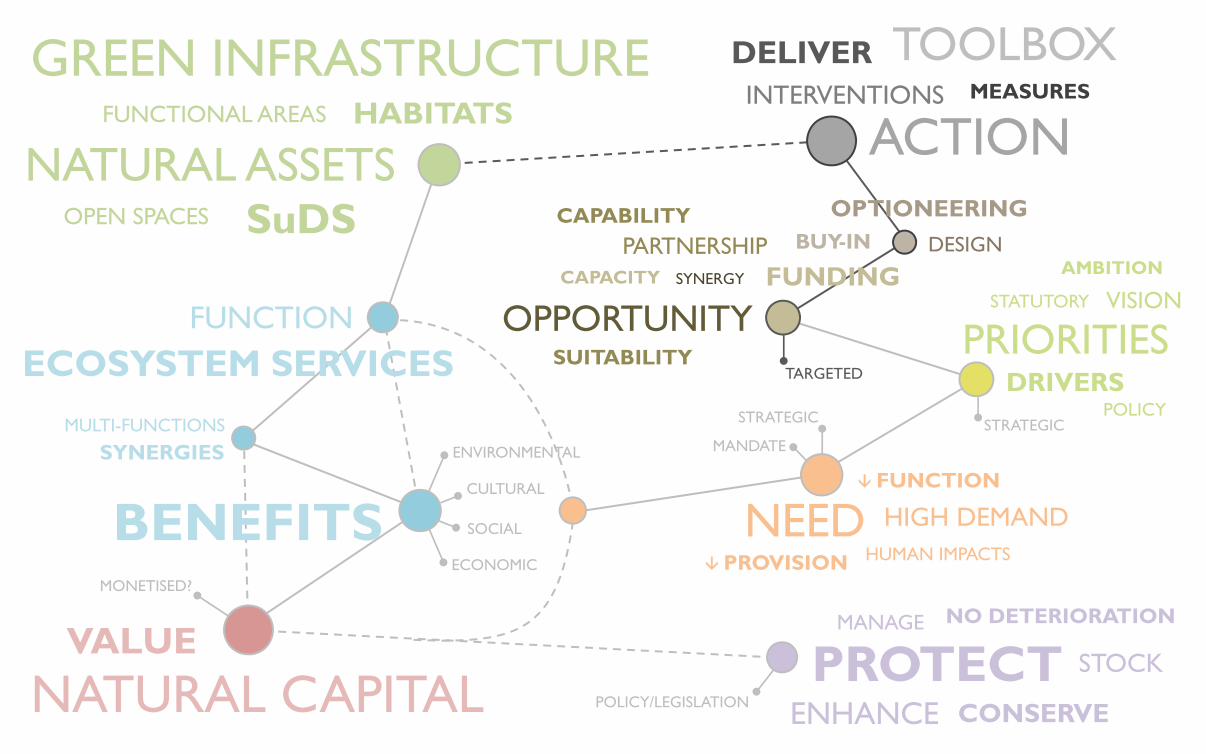
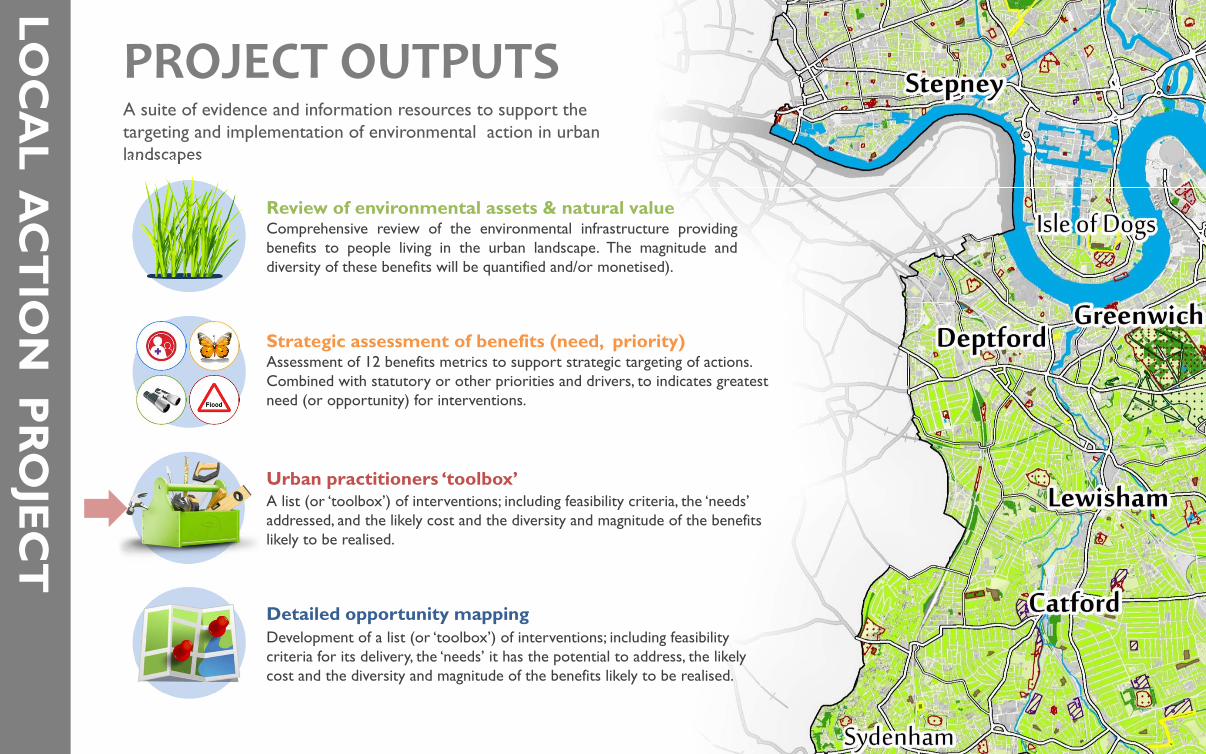
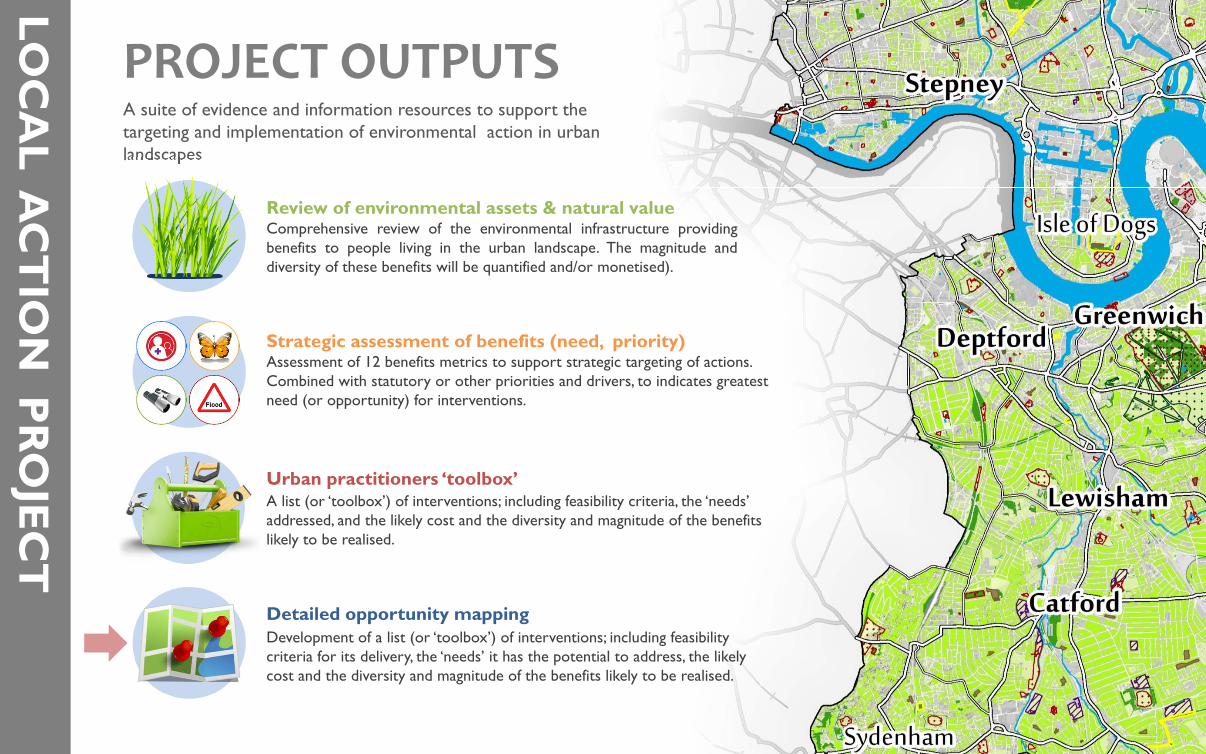
PROJECT OUTPUTSA suite of evidence and information resources to support the targeting and implementation of environmental action in urban landscapes
Review of environmental assets & natural valueComprehensive review of the environmental infrastructure providingbenefits to people living in the urban landscape. The magnitude anddiversity of these benefits will be quantified and/or monetised).
Strategic assessment of benefits (need, priority)Assessment of 12 benefits metrics to support strategic targeting of actions. Combined with statutory or other priorities and drivers, to indicates greatest need (or opportunity) for interventions.
Urban practitioners ‘toolbox’A list (or ‘toolbox’) of interventions; including feasibility criteria, the ‘needs’ addressed, and the likely cost and the diversity and magnitude of the benefits likely to be realised.
Detailed opportunity mappingDevelopment of a list (or ‘toolbox’) of interventions; including feasibility criteria for its delivery, the ‘needs’ it has the potential to address, the likely cost and the diversity and magnitude of the benefits likely to be realised.
LOC
AL A
CT
ION
PR
OJE
CT
TARGETED
STRATEGICSTRATEGIC
MANDATE
POLICY/LEGISLATION
MONETISED?ECONOMIC
SOCIAL
CULTURAL
ENVIRONMENTAL
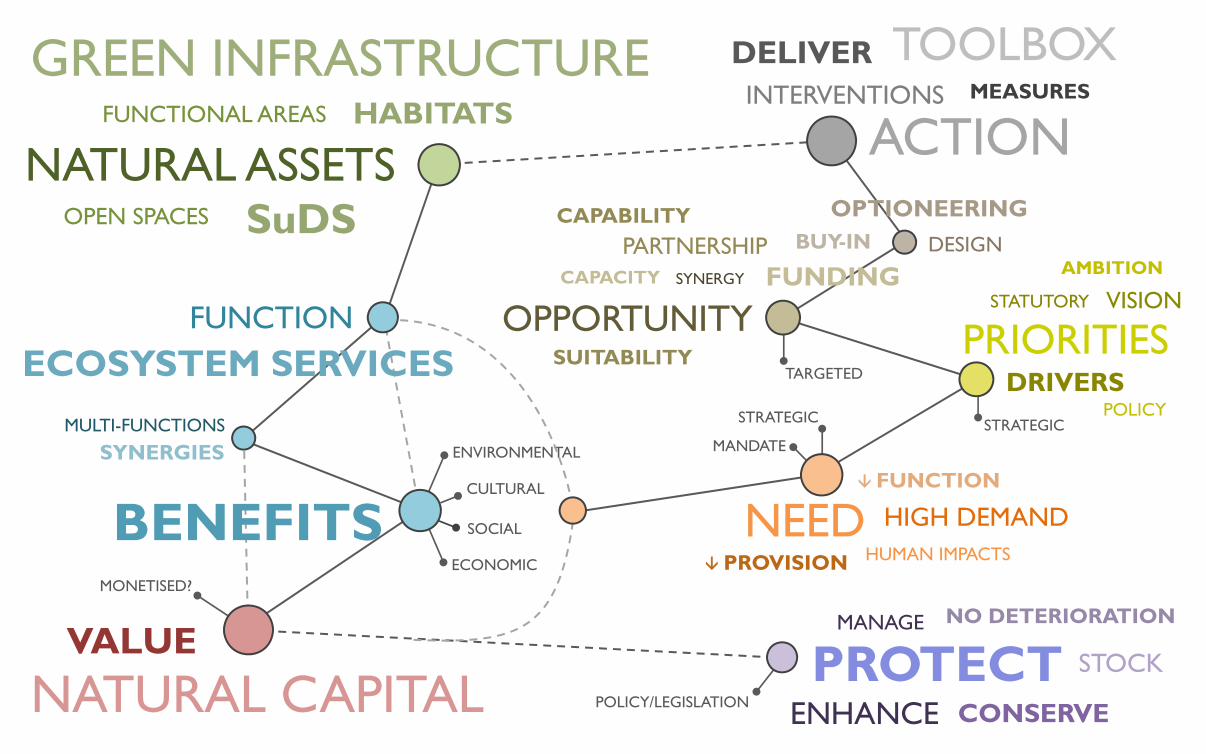
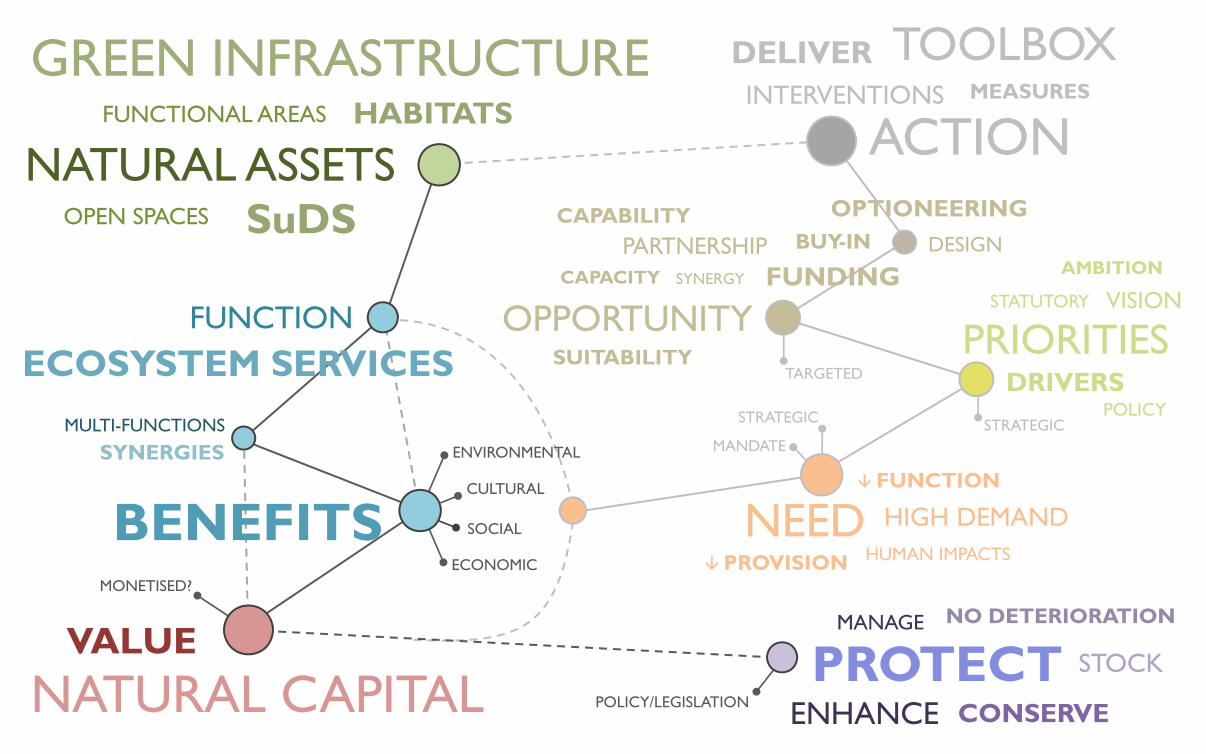
BENEFITS
NATURAL CAPITAL
FUNCTION
VALUE
MULTI-FUNCTIONS
GREEN INFRASTRUCTURE
NATURAL ASSETSHABITATSFUNCTIONAL AREAS
SuDSOPEN SPACES
ECOSYSTEM SERVICES
SYNERGIES
PROTECTCONSERVE
MANAGE
ENHANCE
NO DETERIORATION
STOCK
ACTIONINTERVENTIONS
DELIVER
FUNDING
TOOLBOX
OPPORTUNITY
NEED
PRIORITIESDRIVERS
STATUTORY
AMBITION
VISION
BUY-IN
HUMAN IMPACTS
HIGH DEMAND FUNCTION
SUITABILITY
PARTNERSHIPCAPACITY SYNERGY
DESIGN
MEASURES
OPTIONEERING
PROVISION
POLICY
CAPABILITY
LOC
AL A
CT
ION
PR
OJE
CT
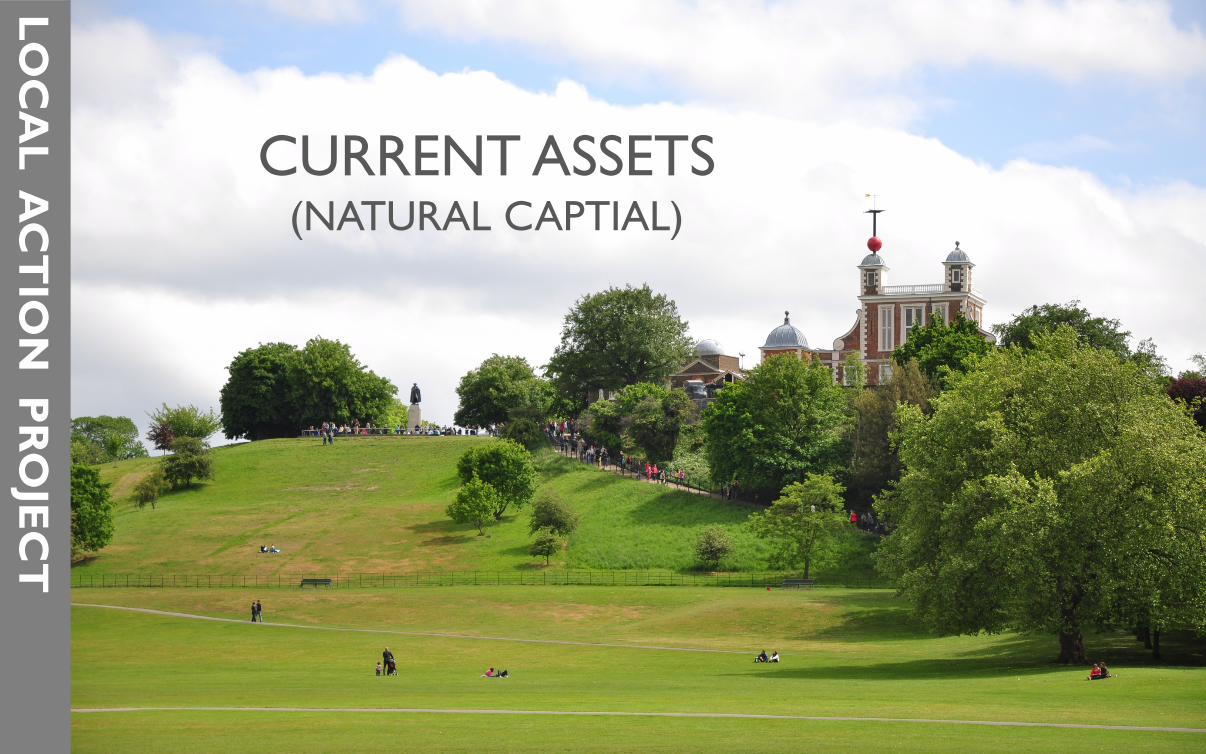
CURRENT ASSETS(NATURAL CAPTIAL)
POLICY/LEGISLATION
PROTECTCONSERVE
MANAGE
ENHANCE
NO DETERIORATION
STOCK
TARGETED
STRATEGICSTRATEGIC
MANDATE
ACTIONINTERVENTIONS
DELIVER
FUNDING
TOOLBOX
OPPORTUNITY
NEED
PRIORITIESDRIVERS
STATUTORY
AMBITION
VISION
BUY-IN
HUMAN IMPACTS
HIGH DEMAND FUNCTION
SUITABILITY
PARTNERSHIPCAPACITY SYNERGY
DESIGN
MEASURES
OPTIONEERING
PROVISION
POLICY
CAPABILITY
MONETISED?ECONOMIC
SOCIAL
CULTURAL
ENVIRONMENTAL
BENEFITS
NATURAL CAPITAL
FUNCTION
VALUE
MULTI-FUNCTIONS
GREEN INFRASTRUCTURE
NATURAL ASSETSHABITATSFUNCTIONAL AREAS
SuDSOPEN SPACES
ECOSYSTEM SERVICES
SYNERGIES
PROJECT OUTPUTSA suite of evidence and information resources to support the targeting and implementation of environmental action in urban landscapes
Review of environmental assets & natural valueComprehensive review of the environmental infrastructure providingbenefits to people living in the urban landscape. The magnitude anddiversity of these benefits will be quantified and/or monetised).
Strategic assessment of benefits (need, priority)Assessment of 12 benefits metrics to support strategic targeting of actions. Combined with statutory or other priorities and drivers, to indicates greatest need (or opportunity) for interventions.
Urban practitioners ‘toolbox’A list (or ‘toolbox’) of interventions; including feasibility criteria, the ‘needs’ addressed, and the likely cost and the diversity and magnitude of the benefits likely to be realised.
Detailed opportunity mappingDevelopment of a list (or ‘toolbox’) of interventions; including feasibility criteria for its delivery, the ‘needs’ it has the potential to address, the likely cost and the diversity and magnitude of the benefits likely to be realised.
LOC
AL A
CT
ION
PR
OJE
CT
LOC
AL A
CT
ION
PR
OJE
CT
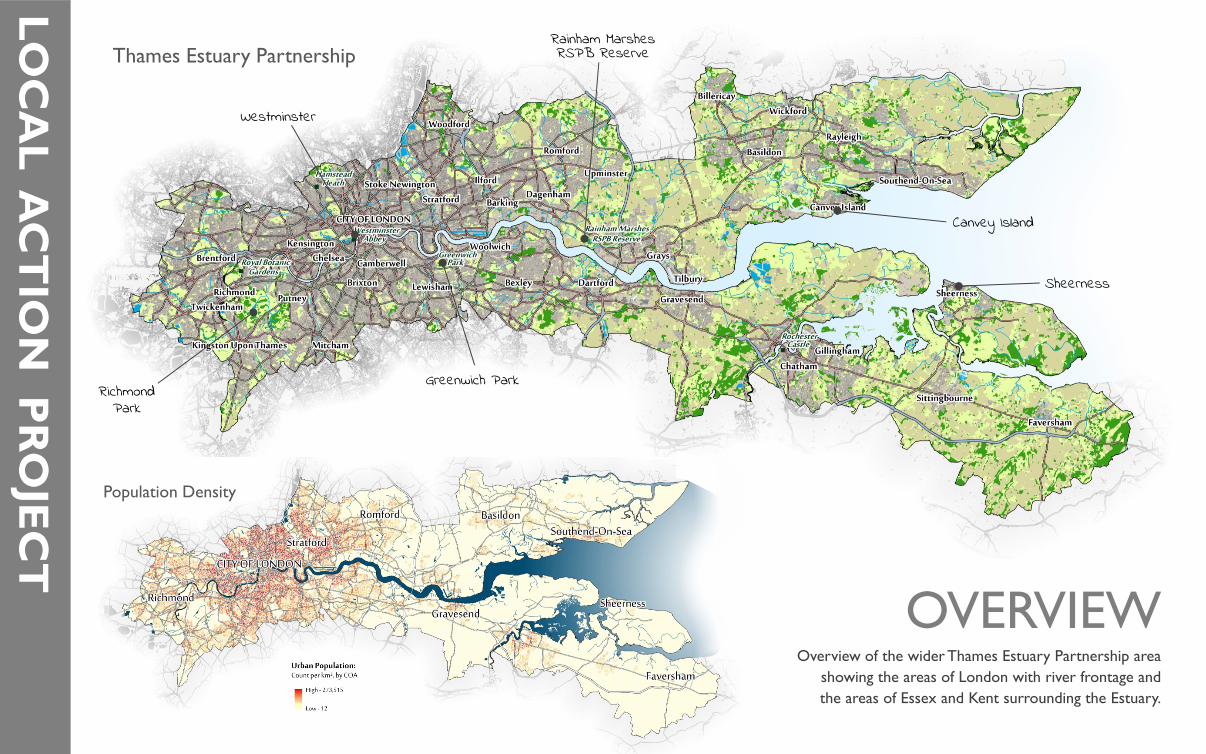
Population Density
Overview of the wider Thames Estuary Partnership area showing the areas of London with river frontage and the areas of Essex and Kent surrounding the Estuary.
Greenwich Park
Westminster
Canvey Island
Thames Estuary Partnership
Sheerness
Rainham Marshes RSPB Reserve
RichmondPark
OVERVIEW
LOC
AL A
CT
ION
PR
OJE
CT
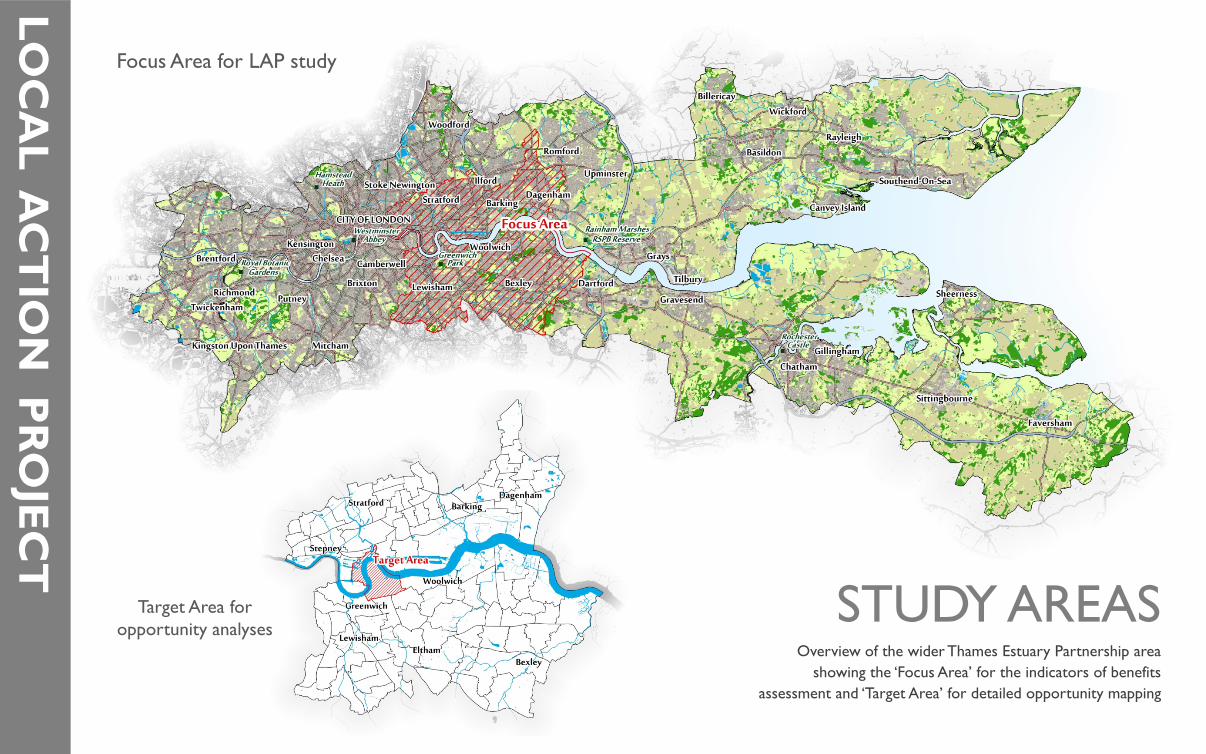
Focus Area for LAP study
STUDY AREASOverview of the wider Thames Estuary Partnership area
showing the ‘Focus Area’ for the indicators of benefits assessment and ‘Target Area’ for detailed opportunity mapping
Target Area for opportunity analyses
LOC
AL A
CT
ION
PR
OJE
CT
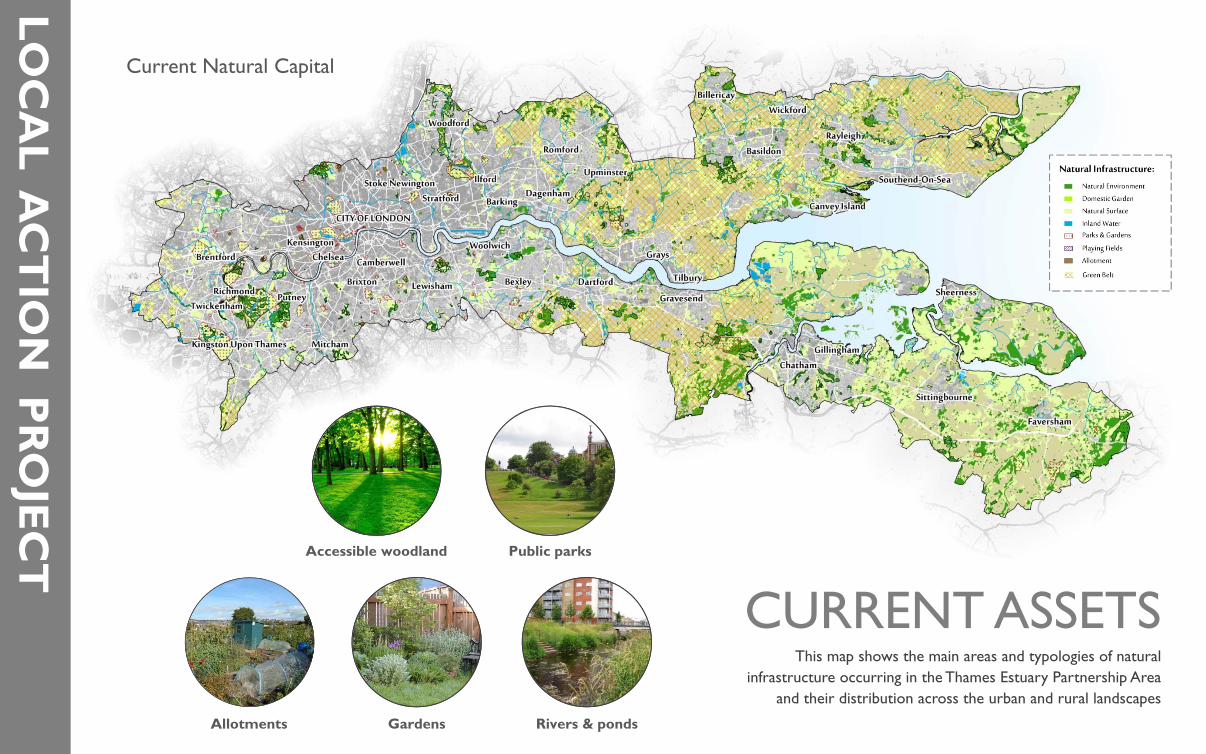
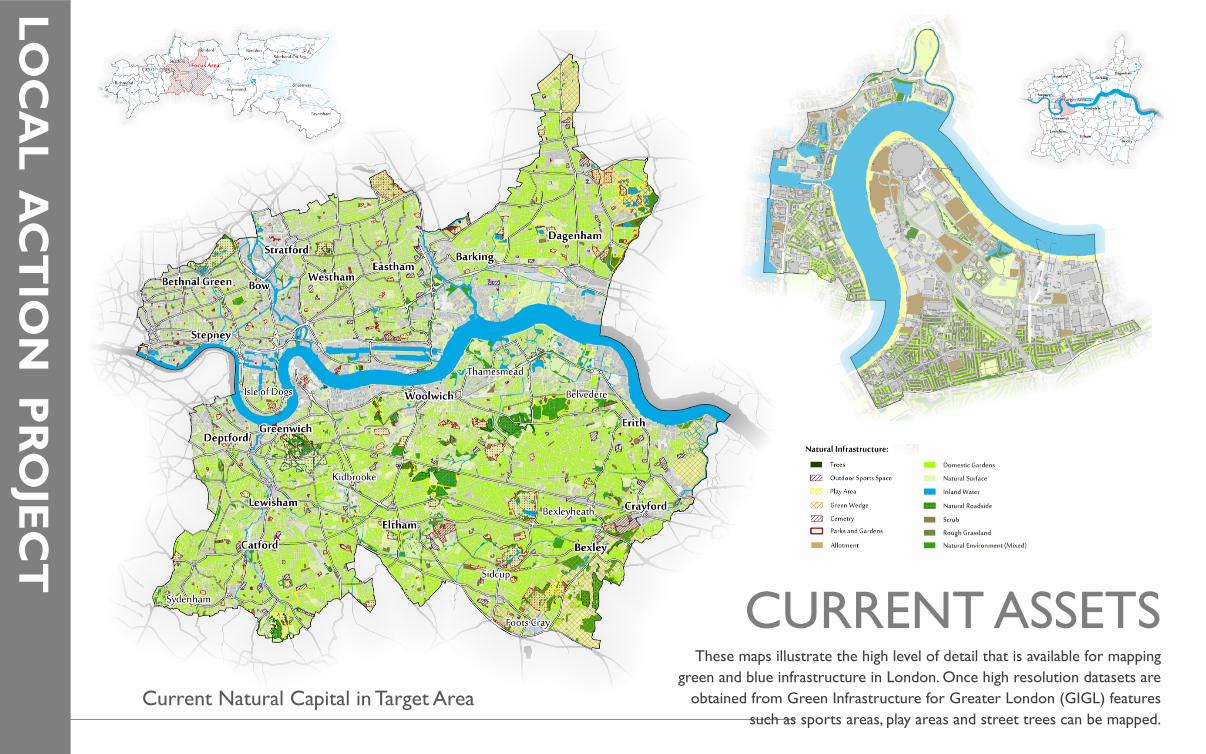
CURRENT ASSETSThis map shows the main areas and typologies of natural
infrastructure occurring in the Thames Estuary Partnership Area and their distribution across the urban and rural landscapes
Current Natural Capital
Allotments Gardens
Accessible woodland Public parks
Rivers & ponds
LOC
AL A
CT
ION
PR
OJE
CT
Current Natural Capital in Target Area
CURRENT ASSETSThese maps illustrate the high level of detail that is available for mapping
green and blue infrastructure in London. Once high resolution datasets are obtained from Green Infrastructure for Greater London (GIGL) features
such as sports areas, play areas and street trees can be mapped.
LOC
AL A
CT
ION
PR
OJE
CT
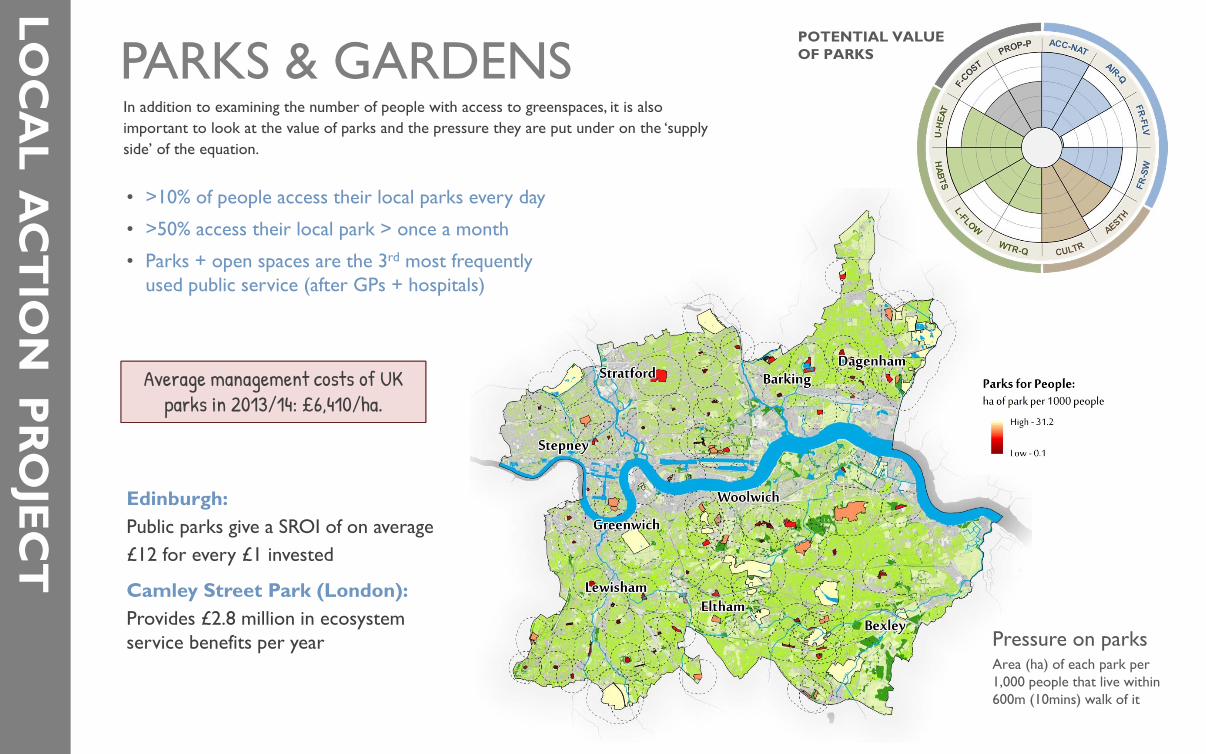
PARKS & GARDENSIn addition to examining the number of people with access to greenspaces, it is also important to look at the value of parks and the pressure they are put under on the ‘supply side’ of the equation.
• >10% of people access their local parks every day
• >50% access their local park > once a month
• Parks + open spaces are the 3rd most frequently used public service (after GPs + hospitals)
Edinburgh: Public parks give a SROI of on average £12 for every £1 invested
Camley Street Park (London): Provides £2.8 million in ecosystem service benefits per year
Average management costs of UK parks in 2013/14: £6,410/ha.
POTENTIAL VALUEOF PARKS
Pressure on parksArea (ha) of each park per 1,000 people that live within 600m (10mins) walk of it
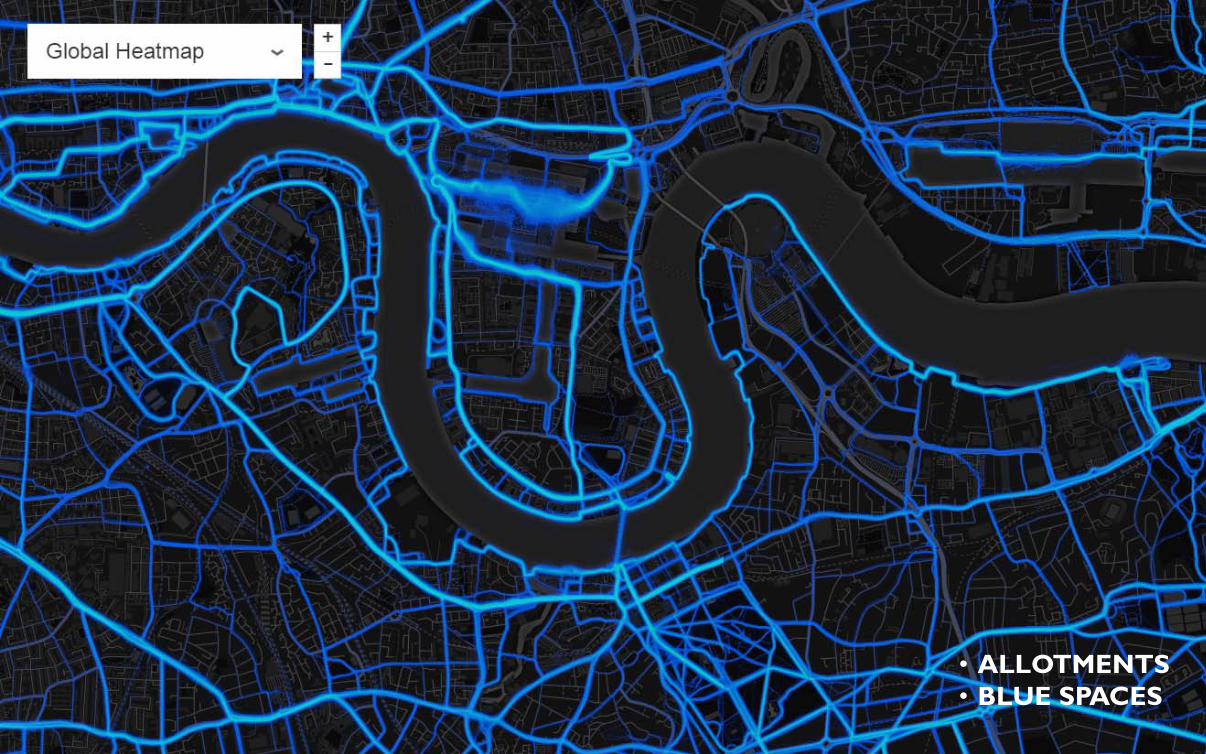
• ALLOTMENTS• BLUE SPACES
LOC
AL A
CT
ION
PR
OJE
CT
LOC
AL A
CT
ION
PR
OJE
CT
LOC
AL A
CT
ION
PR
OJE
CT
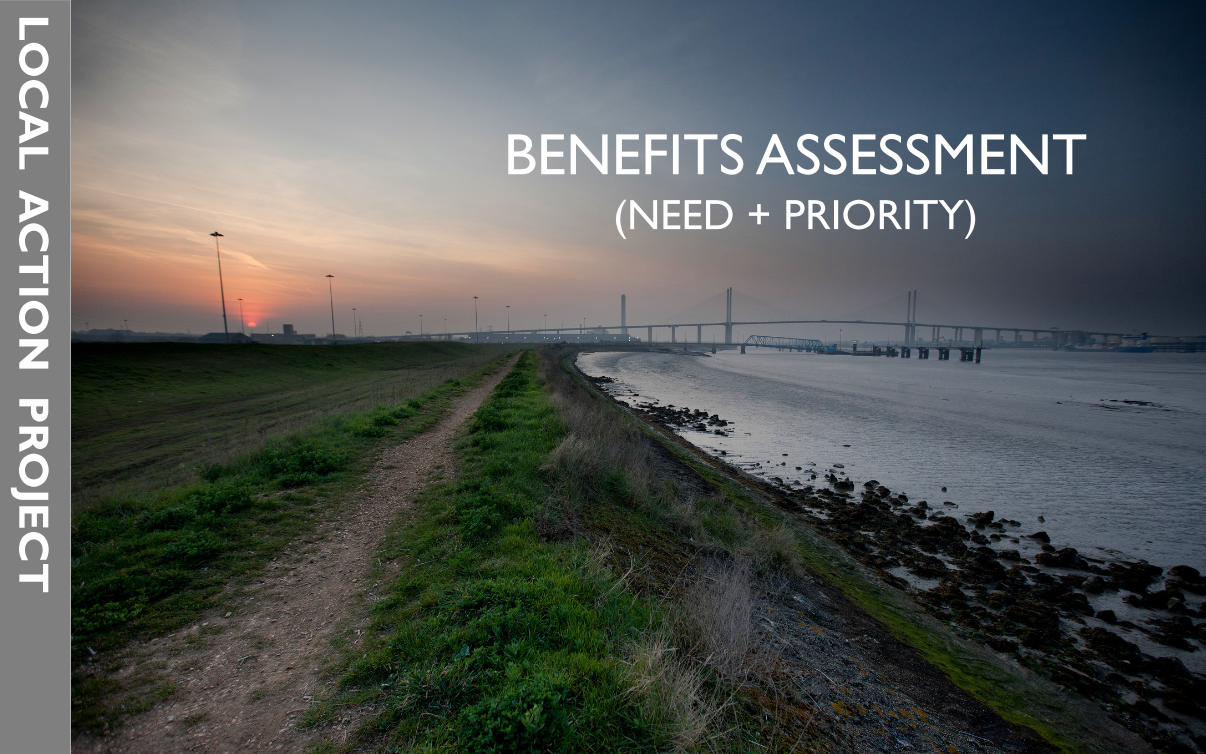
BENEFITS ASSESSMENT(NEED + PRIORITY)
TARGETED
STRATEGICSTRATEGIC
MANDATE
POLICY/LEGISLATION
MONETISED?ECONOMIC
SOCIAL
CULTURAL
ENVIRONMENTAL
BENEFITS
NATURAL CAPITAL
FUNCTION
VALUE
MULTI-FUNCTIONS
GREEN INFRASTRUCTURE
NATURAL ASSETSHABITATSFUNCTIONAL AREAS
SuDSOPEN SPACES
ECOSYSTEM SERVICES
SYNERGIES
PROTECTCONSERVE
MANAGE
ENHANCE
NO DETERIORATION
STOCK
ACTIONINTERVENTIONS
DELIVER
FUNDING
TOOLBOX
OPPORTUNITY
NEED
PRIORITIESDRIVERS
STATUTORY
AMBITION
VISION
BUY-IN
HUMAN IMPACTS
HIGH DEMAND FUNCTION
SUITABILITY
PARTNERSHIPCAPACITY SYNERGY
DESIGN
MEASURES
OPTIONEERING
PROVISION
POLICY
CAPABILITY

PROJECT OUTPUTSA suite of evidence and information resources to support the targeting and implementation of environmental action in urban landscapes
Review of environmental assets & natural valueComprehensive review of the environmental infrastructure providingbenefits to people living in the urban landscape. The magnitude anddiversity of these benefits will be quantified and/or monetised).
Strategic assessment of benefits (need, priority)Assessment of 12 benefits metrics to support strategic targeting of actions. Combined with statutory or other priorities and drivers, to indicates greatest need (or opportunity) for interventions.
Urban practitioners ‘toolbox’A list (or ‘toolbox’) of interventions; including feasibility criteria, the ‘needs’ addressed, and the likely cost and the diversity and magnitude of the benefits likely to be realised.
Detailed opportunity mappingDevelopment of a list (or ‘toolbox’) of interventions; including feasibility criteria for its delivery, the ‘needs’ it has the potential to address, the likely cost and the diversity and magnitude of the benefits likely to be realised.
LOC
AL A
CT
ION
PR
OJE
CT
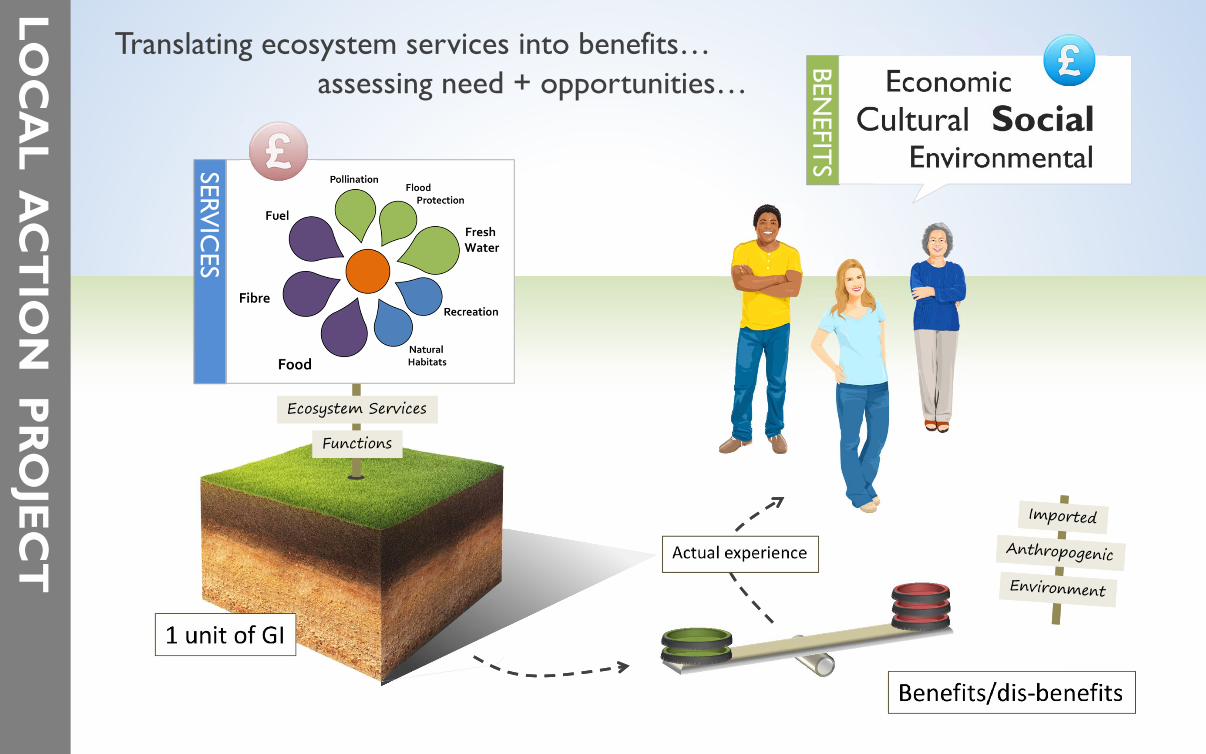
SERVIC
ES
Ecosystem ServicesEcosystem Services
FunctionsFunctions
BENEFIT
S
Translating ecosystem services into benefits…
LOC
AL A
CT
ION
PR
OJE
CT
assessing need + opportunities…
LOC
AL A
CT
ION
PR
OJE
CT
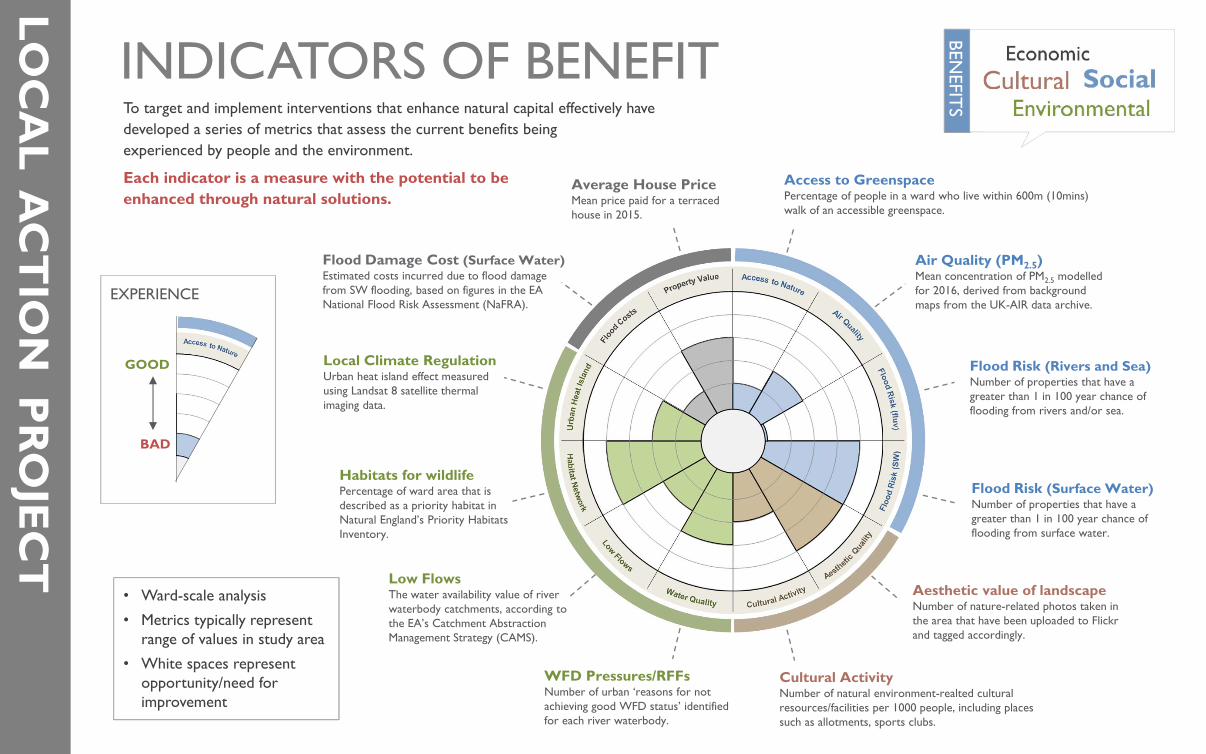
INDICATORS OF BENEFIT To target and implement interventions that enhance natural capital effectively have developed a series of metrics that assess the current benefits being experienced by people and the environment.
Each indicator is a measure with the potential to be enhanced through natural solutions.
BENEFIT
S
• Ward-scale analysis
• Metrics typically represent range of values in study area
• White spaces represent opportunity/need for improvement
Access to GreenspacePercentage of people in a ward who live within 600m (10mins) walk of an accessible greenspace.
Air Quality (PM2.5)Mean concentration of PM2.5 modelled for 2016, derived from background maps from the UK-AIR data archive.
Flood Risk (Rivers and Sea)Number of properties that have a greater than 1 in 100 year chance of flooding from rivers and/or sea.
WFD Pressures/RFFsNumber of urban ‘reasons for not achieving good WFD status’ identified for each river waterbody.
Average House PriceMean price paid for a terraced house in 2015.
Flood Damage Cost (Surface Water)Estimated costs incurred due to flood damage from SW flooding, based on figures in the EA National Flood Risk Assessment (NaFRA).
Aesthetic value of landscape Number of nature-related photos taken in the area that have been uploaded to Flickr and tagged accordingly.
Cultural ActivityNumber of natural environment-realted cultural resources/facilities per 1000 people, including places such as allotments, sports clubs.
Flood Risk (Surface Water)Number of properties that have a greater than 1 in 100 year chance of flooding from surface water.
Local Climate RegulationUrban heat island effect measured using Landsat 8 satellite thermal imaging data.
Habitats for wildlifePercentage of ward area that is described as a priority habitat in Natural England’s Priority Habitats Inventory.
Low Flows The water availability value of river waterbody catchments, according to the EA’s Catchment Abstraction Management Strategy (CAMS).
GOOD
BAD
EXPERIENCE
LOC
AL A
CT
ION
PR
OJE
CT
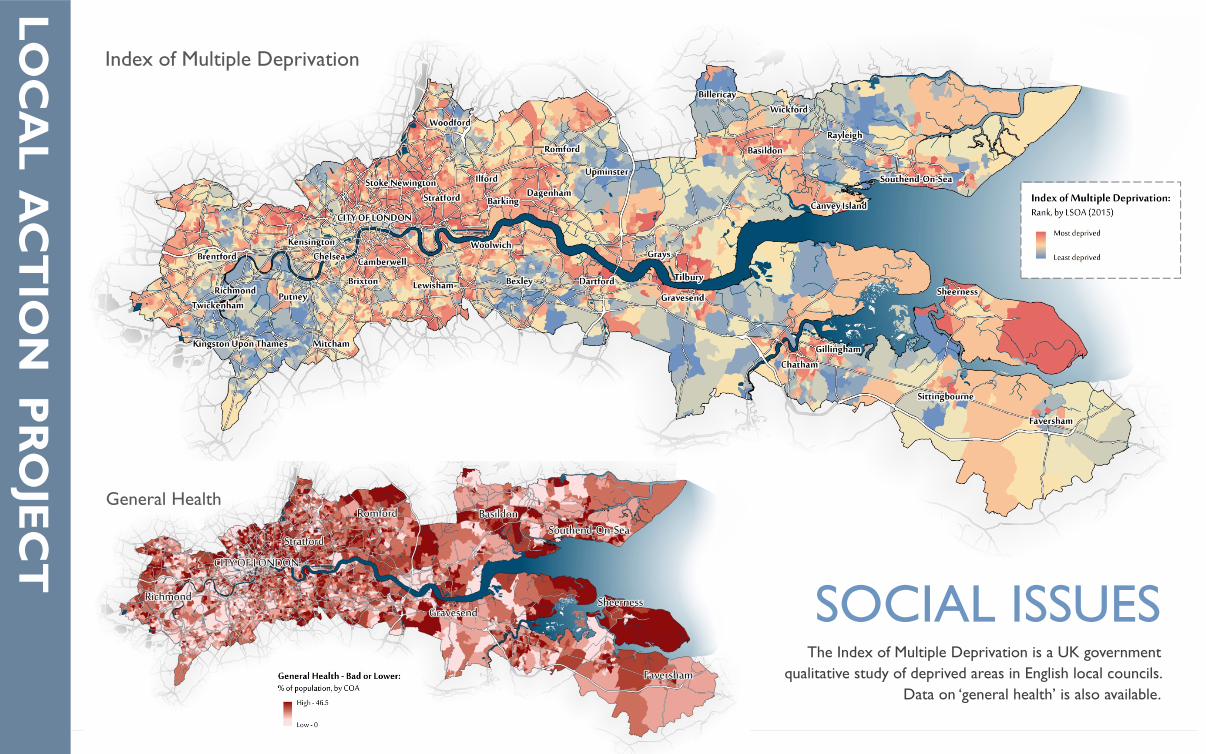
Index of Multiple Deprivation
General Health
SOCIAL ISSUESThe Index of Multiple Deprivation is a UK government
qualitative study of deprived areas in English local councils. Data on ‘general health’ is also available.
SOC
IAL
BE
NE
FIT
LOC
AL A
CT
ION
PR
OJE
CT
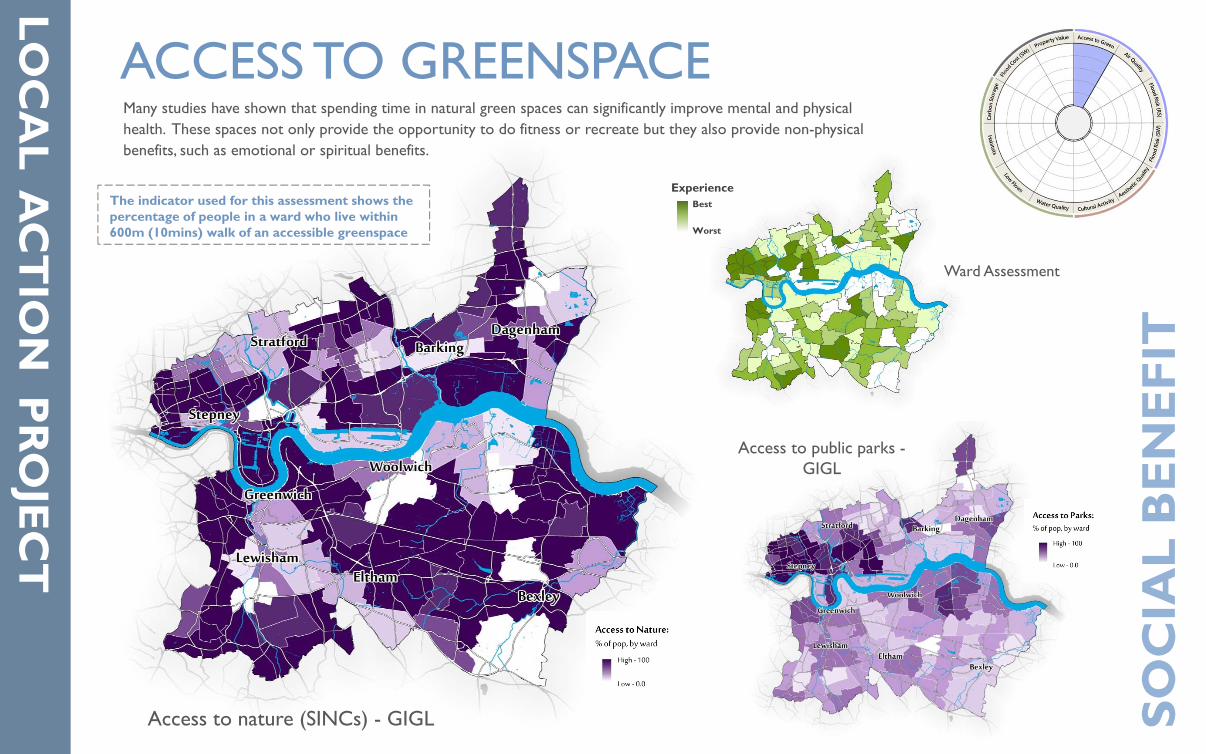
ACCESS TO GREENSPACEMany studies have shown that spending time in natural green spaces can significantly improve mental and physical health. These spaces not only provide the opportunity to do fitness or recreate but they also provide non-physical benefits, such as emotional or spiritual benefits.
Access to nature (SINCs) - GIGL
The indicator used for this assessment shows the percentage of people in a ward who live within 600m (10mins) walk of an accessible greenspace
Access to public parks -GIGL
Ward Assessment
Best
Worst
Experience
SOC
IAL
BE
NE
FIT
LOC
AL A
CT
ION
PR
OJE
CT
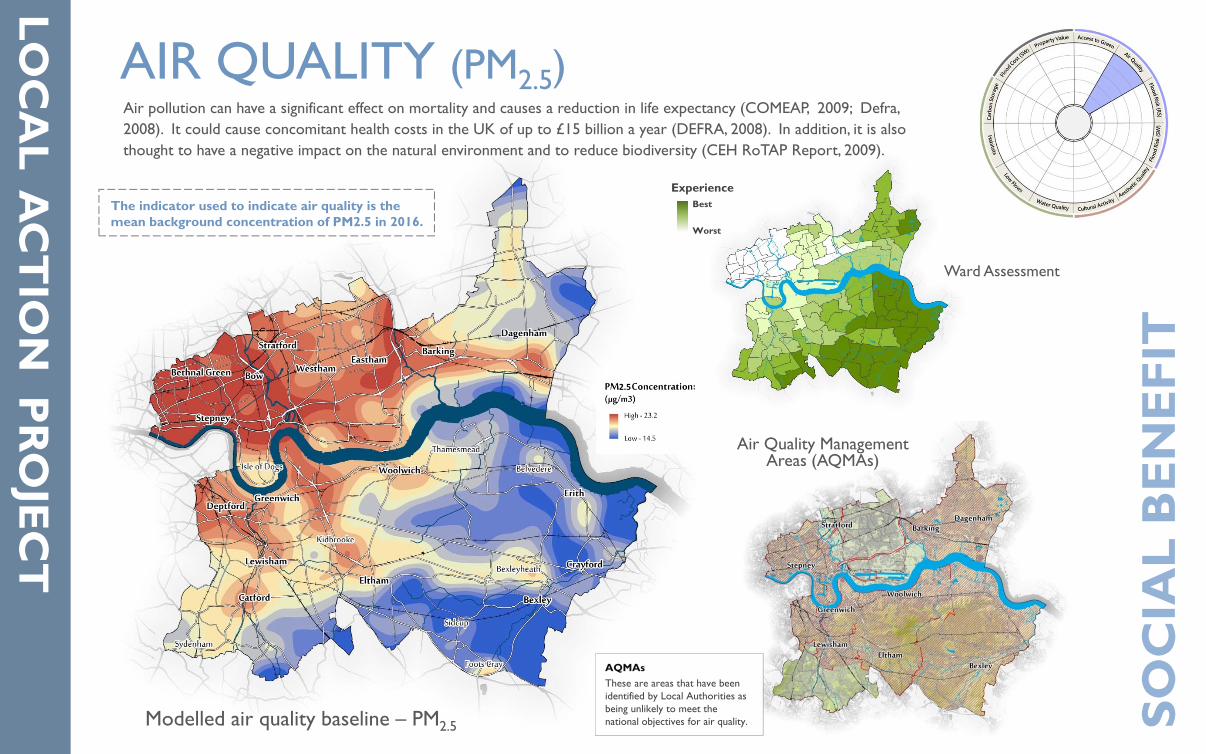
AIR QUALITY (PM2.5)Air pollution can have a significant effect on mortality and causes a reduction in life expectancy (COMEAP, 2009; Defra, 2008). It could cause concomitant health costs in the UK of up to £15 billion a year (DEFRA, 2008). In addition, it is also thought to have a negative impact on the natural environment and to reduce biodiversity (CEH RoTAP Report, 2009).
Ward Assessment
Modelled air quality baseline – PM2.5
The indicator used to indicate air quality is the mean background concentration of PM2.5 in 2016.
Air Quality Management Areas (AQMAs)
2.5
AQMAsThese are areas that have been identified by Local Authorities as being unlikely to meet the national objectives for air quality.
Best
Worst
Experience
SOC
IAL
BE
NE
FIT
LOC
AL A
CT
ION
PR
OJE
CT
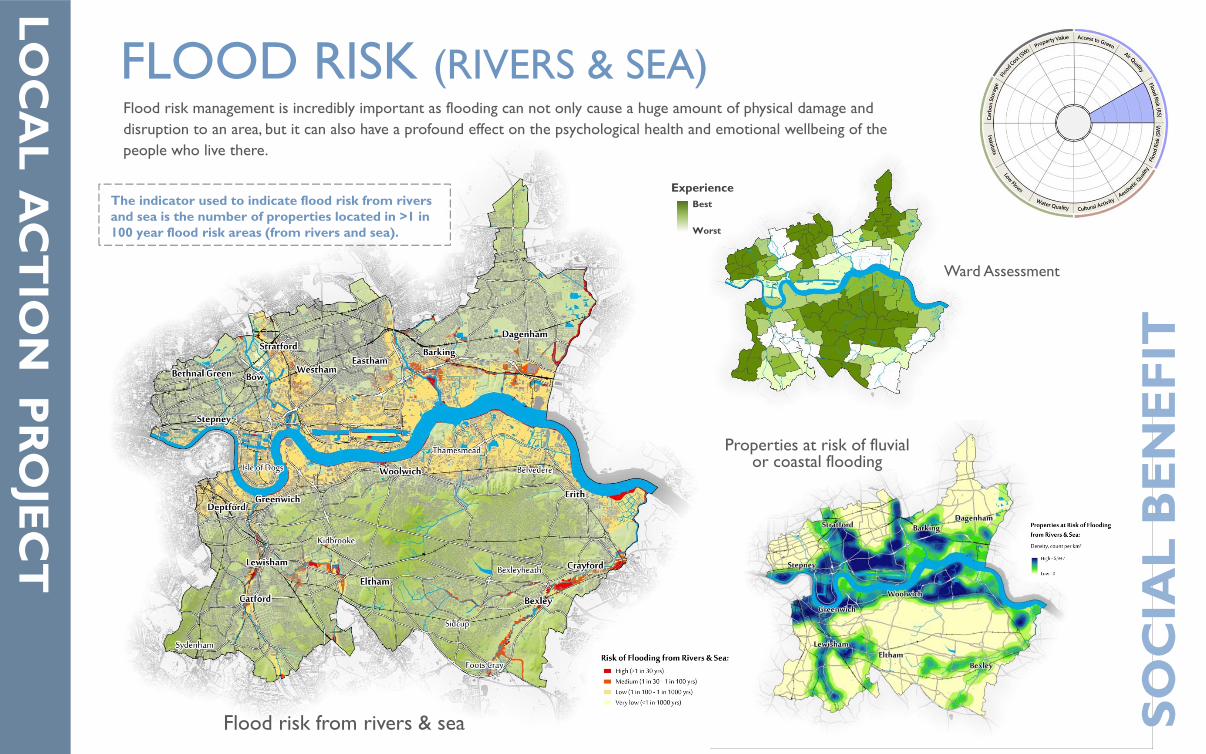
FLOOD RISK (RIVERS & SEA)Flood risk management is incredibly important as flooding can not only cause a huge amount of physical damage and disruption to an area, but it can also have a profound effect on the psychological health and emotional wellbeing of the people who live there.
Flood risk from rivers & sea
The indicator used to indicate flood risk from rivers and sea is the number of properties located in >1 in 100 year flood risk areas (from rivers and sea).
Properties at risk of fluvial or coastal flooding
Ward Assessment
Best
Worst
Experience
SOC
IAL
BE
NE
FIT
LOC
AL A
CT
ION
PR
OJE
CT
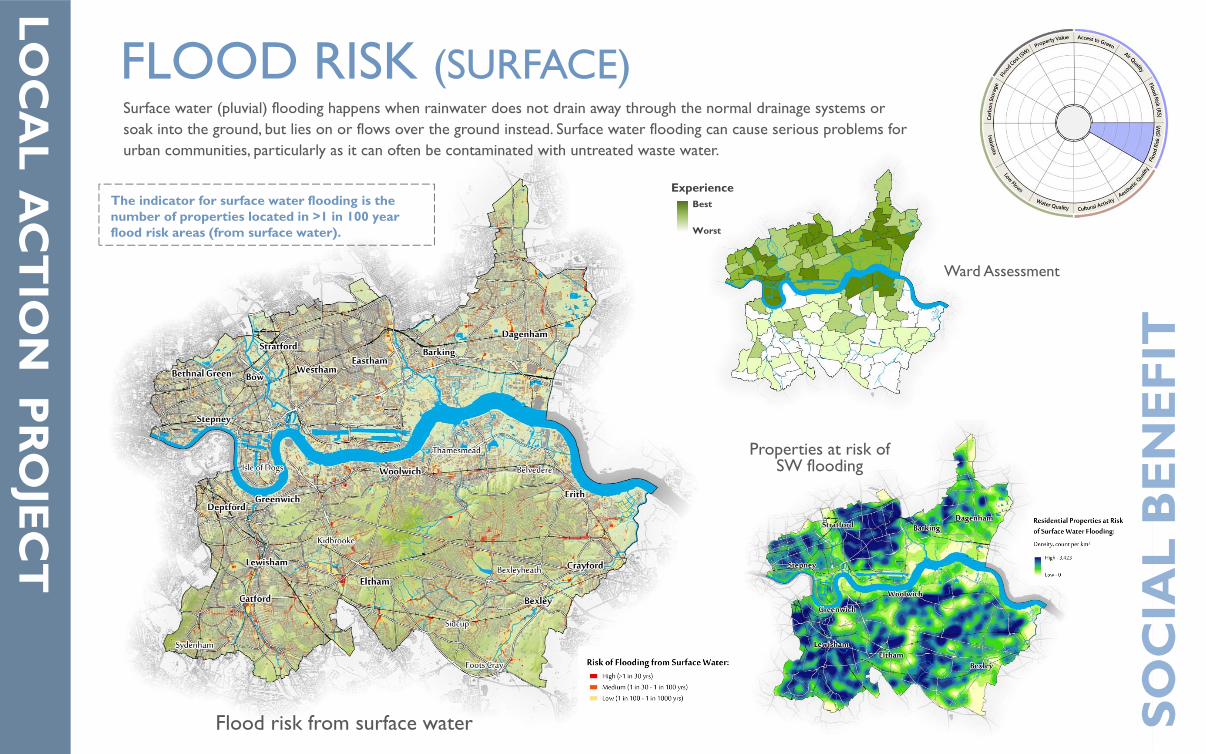
FLOOD RISK (SURFACE)Surface water (pluvial) flooding happens when rainwater does not drain away through the normal drainage systems or soak into the ground, but lies on or flows over the ground instead. Surface water flooding can cause serious problems for urban communities, particularly as it can often be contaminated with untreated waste water.
The indicator for surface water flooding is the number of properties located in >1 in 100 year flood risk areas (from surface water).
Properties at risk of SW flooding
Flood risk from surface water
Ward Assessment
Best
Worst
Experience
CU
LTU
RA
L B
EN
EFI
TLO
CA
L AC
TIO
N P
RO
JEC
T
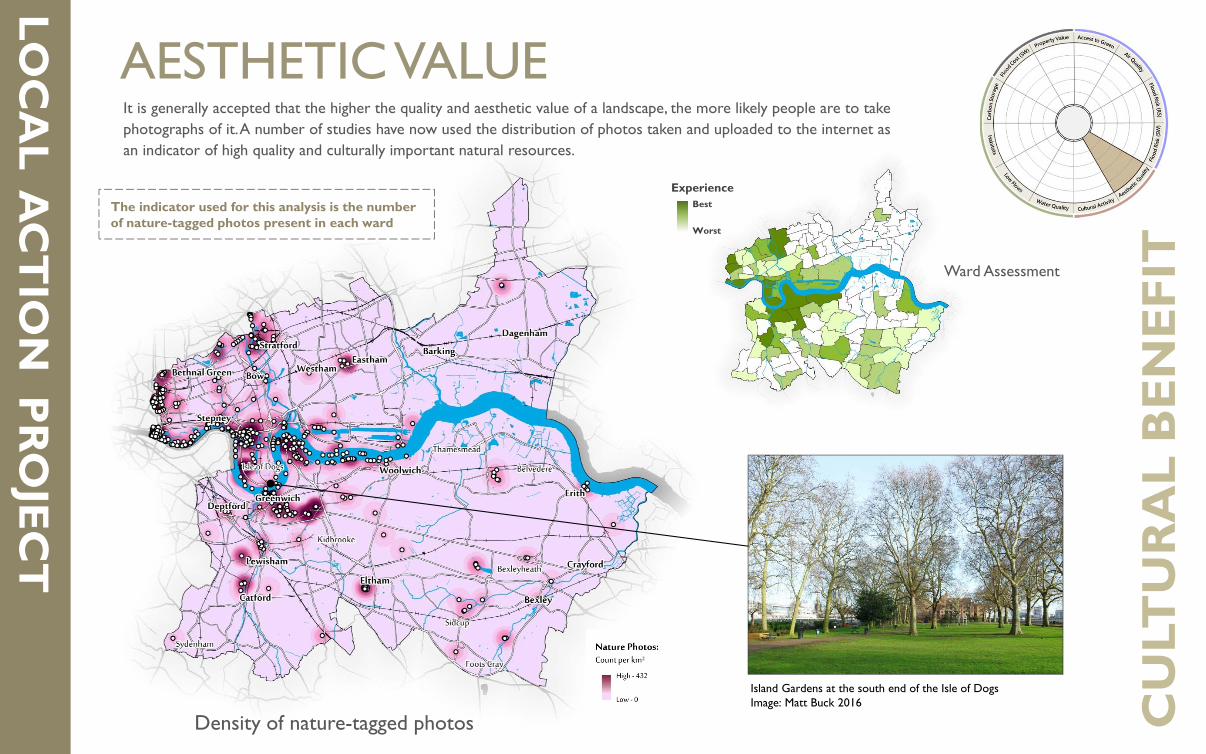
AESTHETIC VALUEIt is generally accepted that the higher the quality and aesthetic value of a landscape, the more likely people are to take photographs of it. A number of studies have now used the distribution of photos taken and uploaded to the internet as an indicator of high quality and culturally important natural resources.
The indicator used for this analysis is the number of nature-tagged photos present in each ward
Density of nature-tagged photos
Ward Assessment
Island Gardens at the south end of the Isle of DogsImage: Matt Buck 2016
Best
Worst
Experience
CU
LTU
RA
L B
EN
EFI
TLO
CA
L AC
TIO
N P
RO
JEC
T
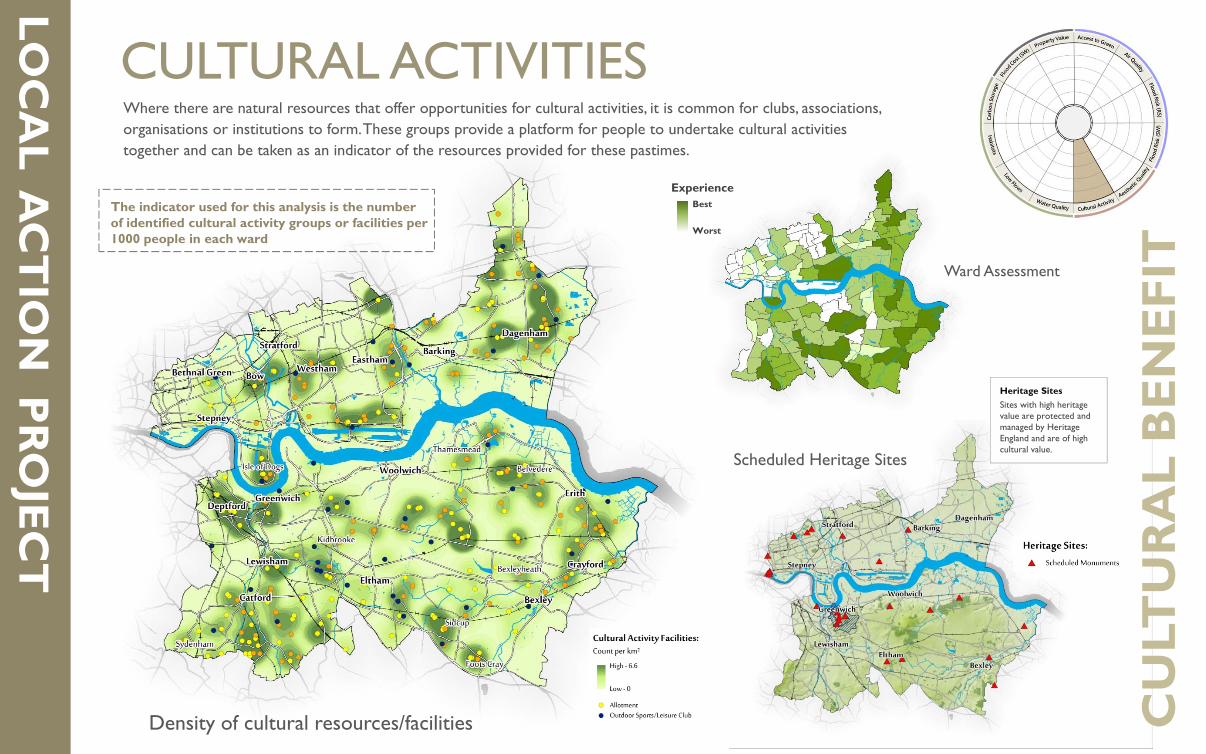
CULTURAL ACTIVITIESWhere there are natural resources that offer opportunities for cultural activities, it is common for clubs, associations, organisations or institutions to form. These groups provide a platform for people to undertake cultural activities together and can be taken as an indicator of the resources provided for these pastimes.
The indicator used for this analysis is the number of identified cultural activity groups or facilities per 1000 people in each ward
Density of cultural resources/facilities
Ward Assessment
Scheduled Heritage Sites
Heritage Sites Sites with high heritage value are protected and managed by Heritage England and are of high cultural value.
Best
Worst
Experience
EN
VIR
O. B
EN
EFI
TLO
CA
L AC
TIO
N P
RO
JEC
T
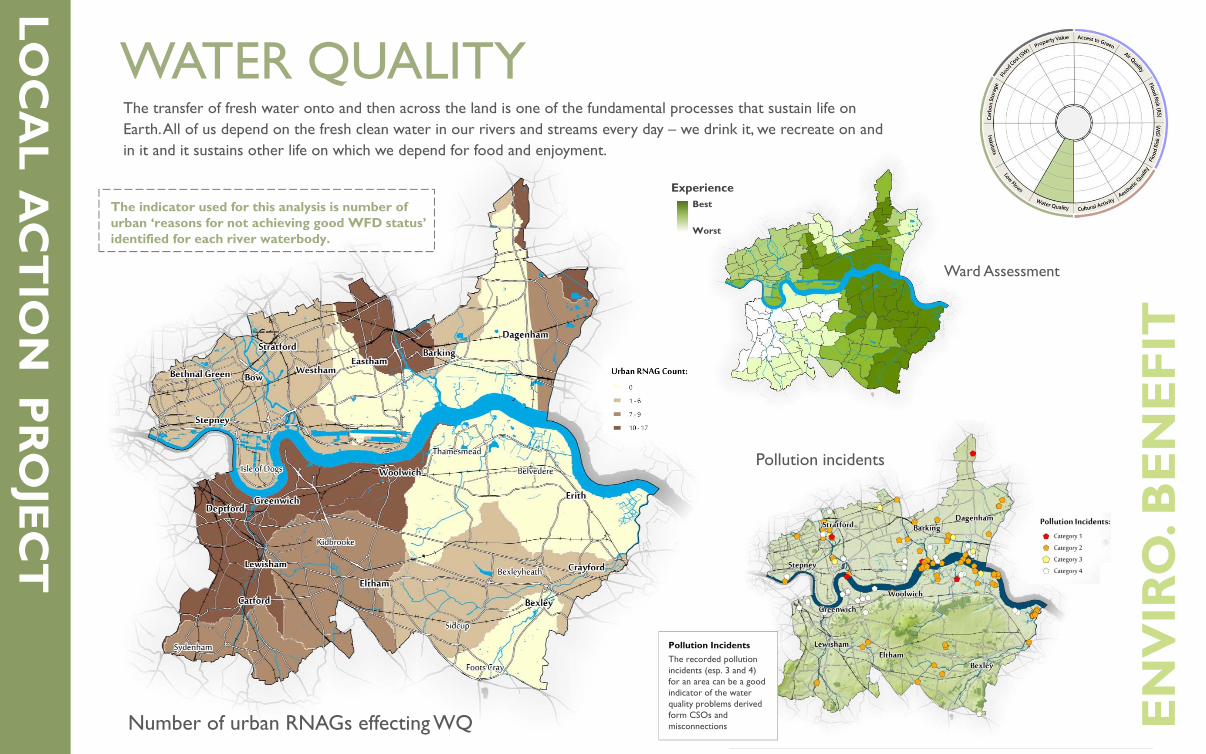
WATER QUALITYThe transfer of fresh water onto and then across the land is one of the fundamental processes that sustain life on Earth. All of us depend on the fresh clean water in our rivers and streams every day – we drink it, we recreate on and in it and it sustains other life on which we depend for food and enjoyment.
Pollution Incidents The recorded pollution incidents (esp. 3 and 4) for an area can be a good indicator of the water quality problems derived form CSOs and misconnections
The indicator used for this analysis is number of urban ‘reasons for not achieving good WFD status’ identified for each river waterbody.
Number of urban RNAGs effecting WQ
Ward Assessment
Pollution incidents
Best
Worst
Experience
EN
VIR
O. B
EN
EFI
TLO
CA
L AC
TIO
N P
RO
JEC
T
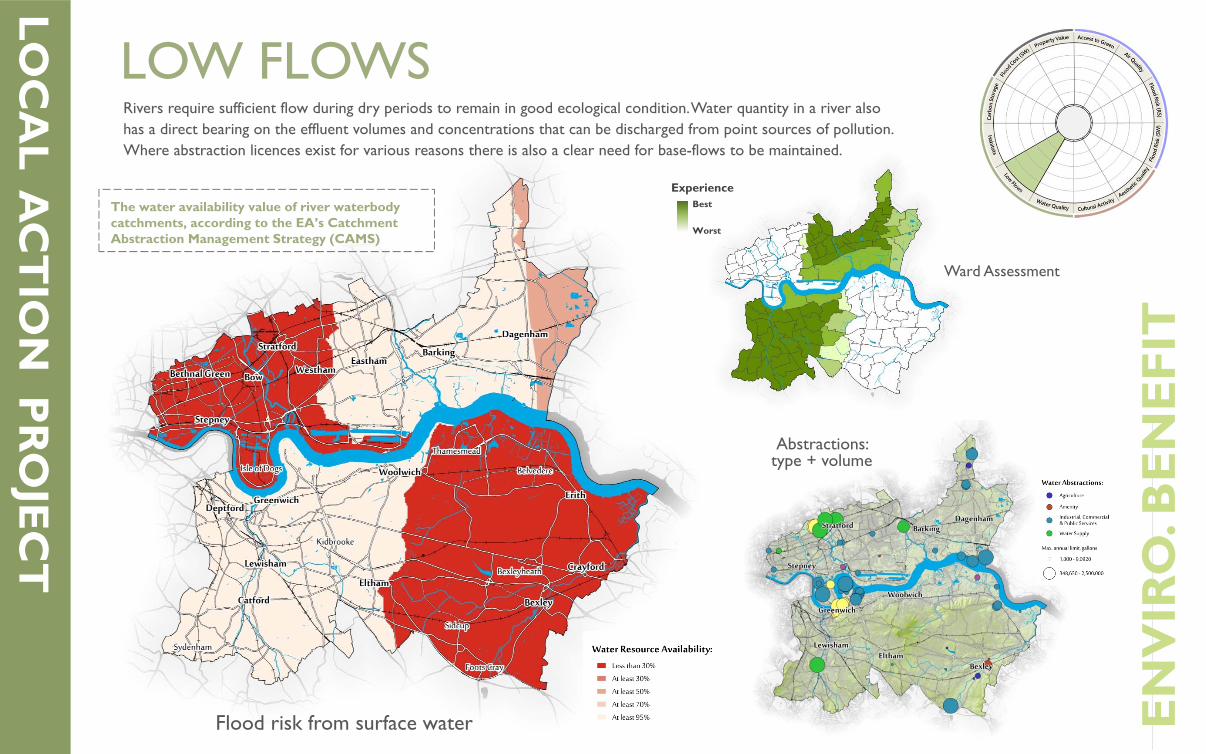
LOW FLOWSRivers require sufficient flow during dry periods to remain in good ecological condition. Water quantity in a river also has a direct bearing on the effluent volumes and concentrations that can be discharged from point sources of pollution. Where abstraction licences exist for various reasons there is also a clear need for base-flows to be maintained.
The water availability value of river waterbody catchments, according to the EA’s Catchment Abstraction Management Strategy (CAMS)
Flood risk from surface water
Ward Assessment
Abstractions: type + volume
Best
Worst
Experience
EN
VIR
O. B
EN
EFI
TLO
CA
L AC
TIO
N P
RO
JEC
T
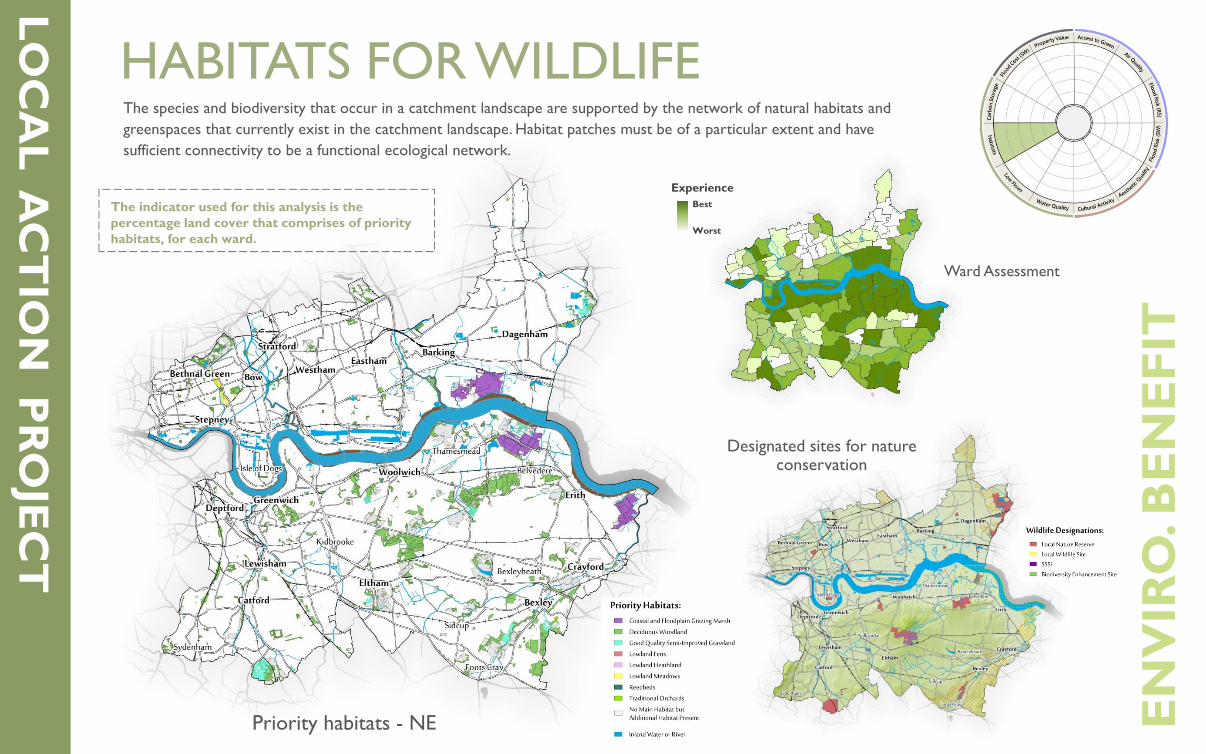
HABITATS FOR WILDLIFEThe species and biodiversity that occur in a catchment landscape are supported by the network of natural habitats and greenspaces that currently exist in the catchment landscape. Habitat patches must be of a particular extent and have sufficient connectivity to be a functional ecological network.
The indicator used for this analysis is the percentage land cover that comprises of priority habitats, for each ward.
Ward Assessment
Priority habitats - NE
Designated sites for nature conservation
Best
Worst
Experience
EN
VIR
O. B
EN
EFI
TLO
CA
L AC
TIO
N P
RO
JEC
T
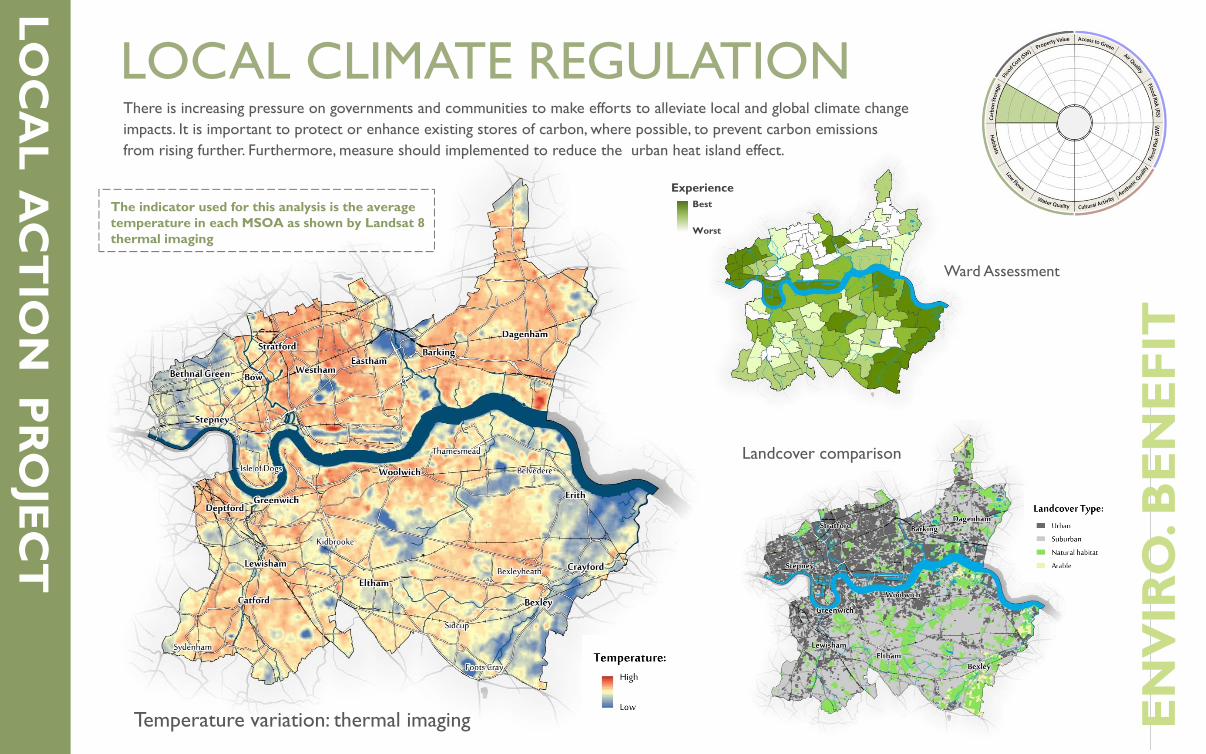
LOCAL CLIMATE REGULATIONThere is increasing pressure on governments and communities to make efforts to alleviate local and global climate change impacts. It is important to protect or enhance existing stores of carbon, where possible, to prevent carbon emissions from rising further. Furthermore, measure should implemented to reduce the urban heat island effect.
The indicator used for this analysis is the average temperature in each MSOA as shown by Landsat 8 thermal imaging
Temperature variation: thermal imaging
Ward Assessment
Landcover comparison
Best
Worst
Experience
EN
VIR
O. B
EN
EFI
TLO
CA
L AC
TIO
N P
RO
JEC
T
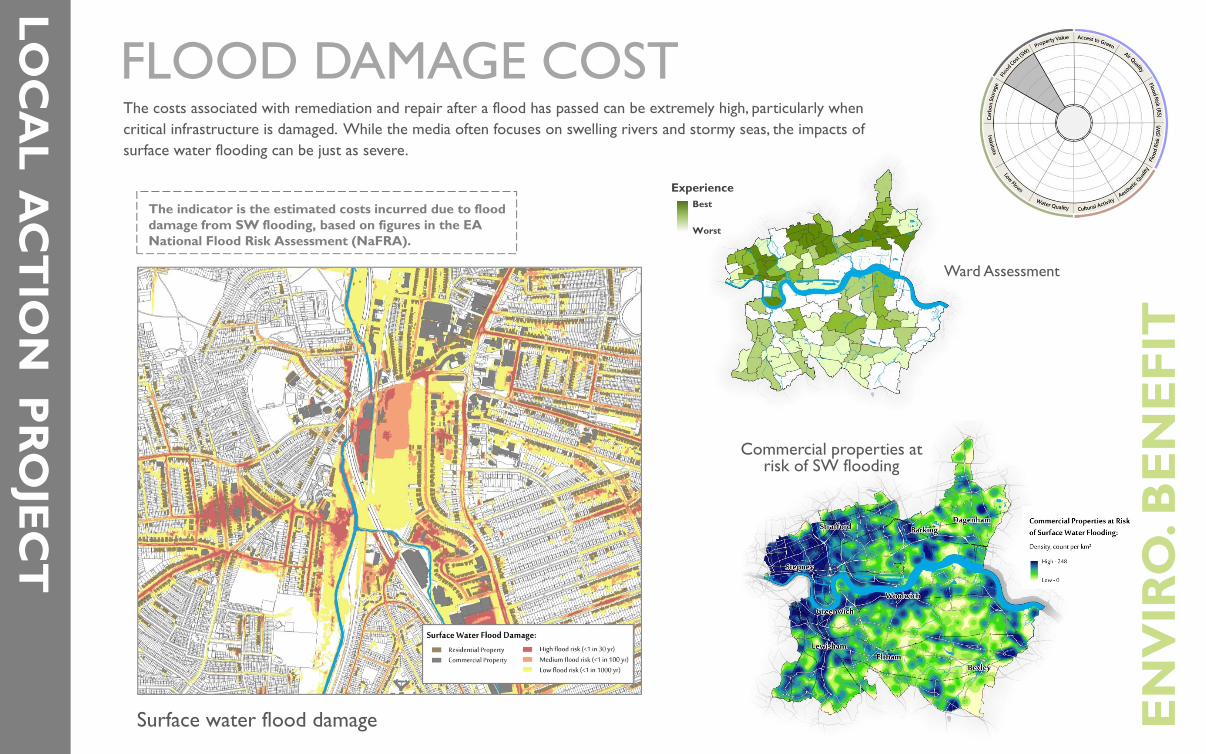
FLOOD DAMAGE COSTThe costs associated with remediation and repair after a flood has passed can be extremely high, particularly when critical infrastructure is damaged. While the media often focuses on swelling rivers and stormy seas, the impacts of surface water flooding can be just as severe.
Surface water flood damage
Ward Assessment
Commercial properties at risk of SW flooding
Best
Worst
Experience
The indicator is the estimated costs incurred due to flood damage from SW flooding, based on figures in the EA National Flood Risk Assessment (NaFRA).
EN
VIR
O. B
EN
EFI
TLO
CA
L AC
TIO
N P
RO
JEC
T
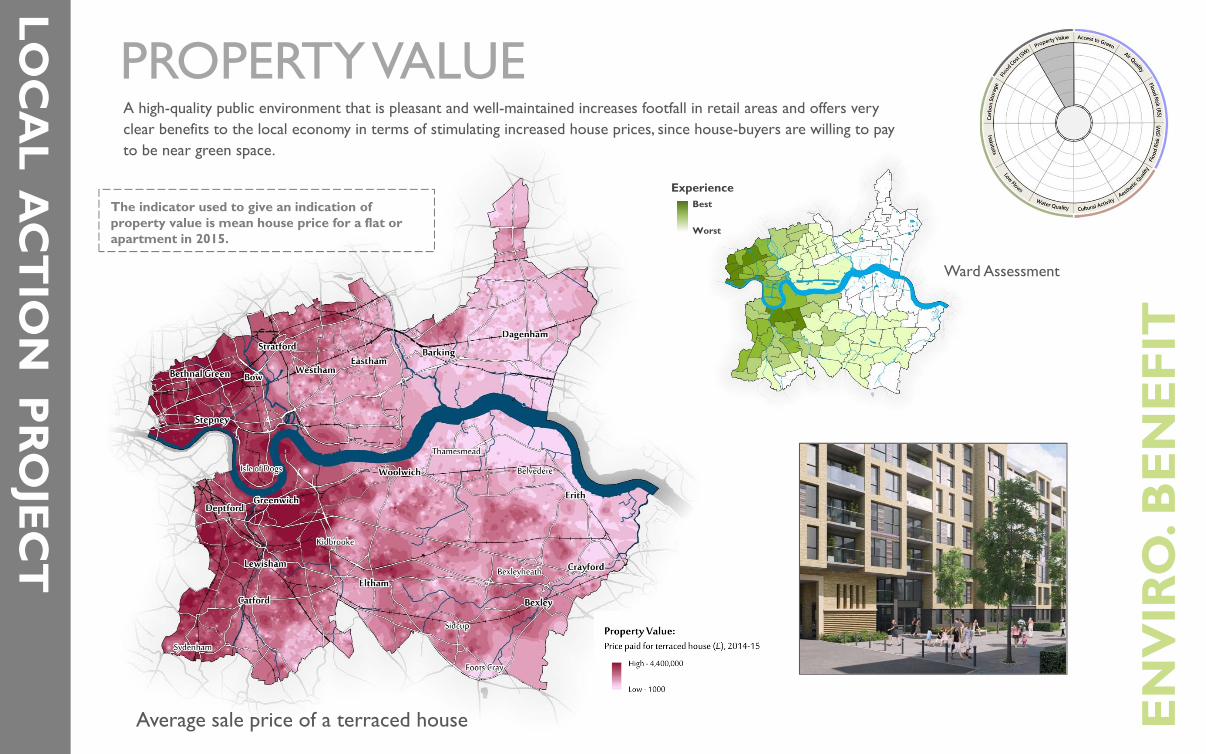
PROPERTY VALUEA high-quality public environment that is pleasant and well-maintained increases footfall in retail areas and offers very clear benefits to the local economy in terms of stimulating increased house prices, since house-buyers are willing to pay to be near green space.
The indicator used to give an indication of property value is mean house price for a flat or apartment in 2015.
Average sale price of a terraced house
Ward Assessment
Best
Worst
Experience
LOC
AL A
CT
ION
PR
OJE
CT
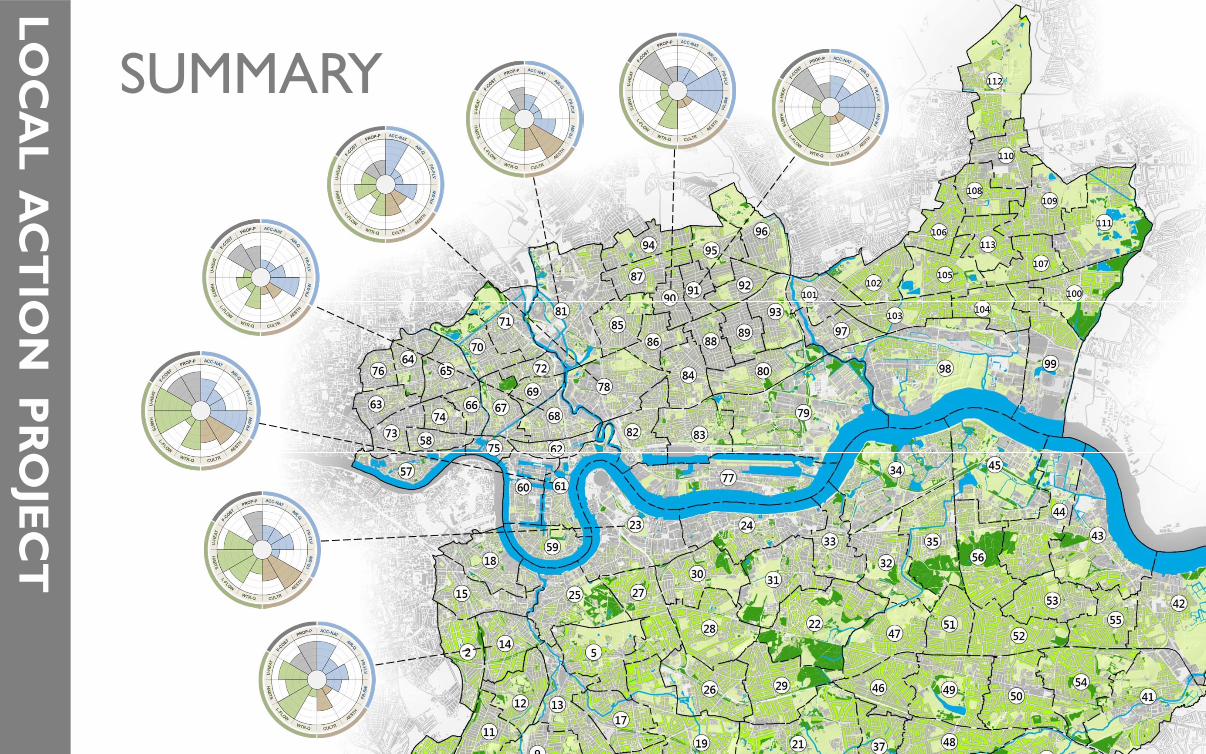
SUMMARY
LOC
AL A
CT
ION
PR
OJE
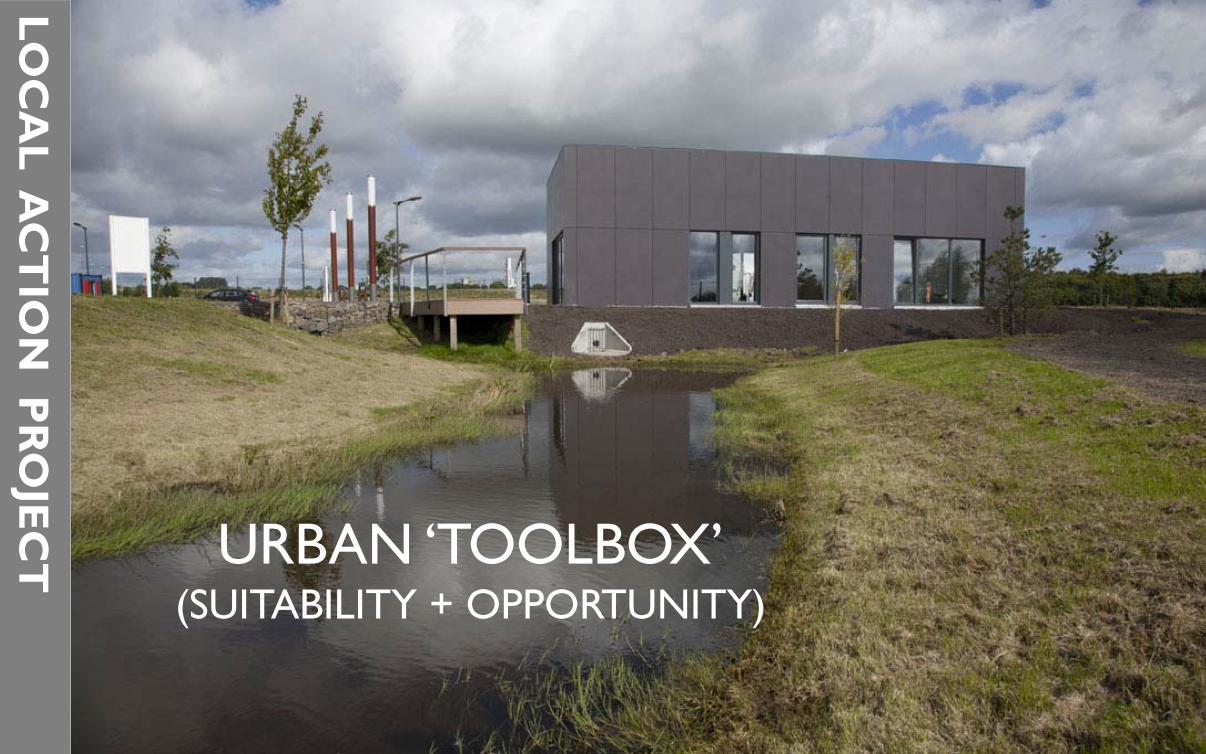
CT URBAN ‘TOOLBOX’
(SUITABILITY + OPPORTUNITY)
TARGETED
ACTIONINTERVENTIONS
DELIVER
FUNDING
TOOLBOX
OPPORTUNITY
BUY-IN
SUITABILITY
PARTNERSHIPCAPACITY SYNERGY
DESIGN
MEASURES
OPTIONEERINGCAPABILITY
STRATEGICSTRATEGIC
MANDATE
POLICY/LEGISLATION
MONETISED?ECONOMIC
SOCIAL
CULTURAL
ENVIRONMENTAL
BENEFITS
NATURAL CAPITAL
FUNCTION
VALUE
MULTI-FUNCTIONS
GREEN INFRASTRUCTURE
NATURAL ASSETSHABITATSFUNCTIONAL AREAS
SuDSOPEN SPACES
ECOSYSTEM SERVICES
SYNERGIES
PROTECTCONSERVE
MANAGE
ENHANCE
NO DETERIORATION
STOCK
NEED
PRIORITIESDRIVERS
STATUTORY
AMBITION
VISION
HUMAN IMPACTS
HIGH DEMAND FUNCTION
PROVISION
POLICY
PROJECT OUTPUTSA suite of evidence and information resources to support the targeting and implementation of environmental action in urban landscapes
Review of environmental assets & natural valueComprehensive review of the environmental infrastructure providingbenefits to people living in the urban landscape. The magnitude anddiversity of these benefits will be quantified and/or monetised).
Strategic assessment of benefits (need, priority)Assessment of 12 benefits metrics to support strategic targeting of actions. Combined with statutory or other priorities and drivers, to indicates greatest need (or opportunity) for interventions.
Urban practitioners ‘toolbox’A list (or ‘toolbox’) of interventions; including feasibility criteria, the ‘needs’ addressed, and the likely cost and the diversity and magnitude of the benefits likely to be realised.
Detailed opportunity mappingDevelopment of a list (or ‘toolbox’) of interventions; including feasibility criteria for its delivery, the ‘needs’ it has the potential to address, the likely cost and the diversity and magnitude of the benefits likely to be realised.
LOC
AL A
CT
ION
PR
OJE
CT
LOC
AL A
CT
ION
PR
OJE
CT
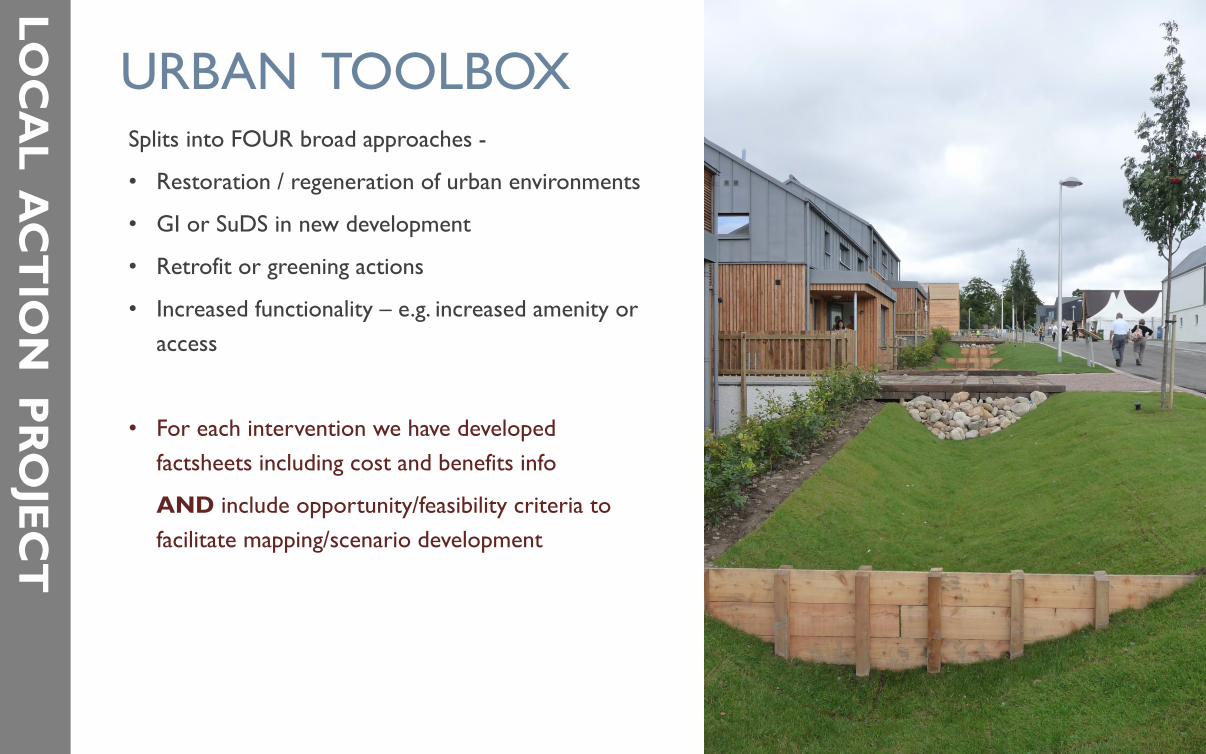
URBAN TOOLBOXSplits into FOUR broad approaches -
• Restoration / regeneration of urban environments
• GI or SuDS in new development
• Retrofit or greening actions
• Increased functionality – e.g. increased amenity or access
• For each intervention we have developed factsheets including cost and benefits info
AND include opportunity/feasibility criteria to facilitate mapping/scenario development
LOC
AL A
CT
ION
PR
OJE
CT
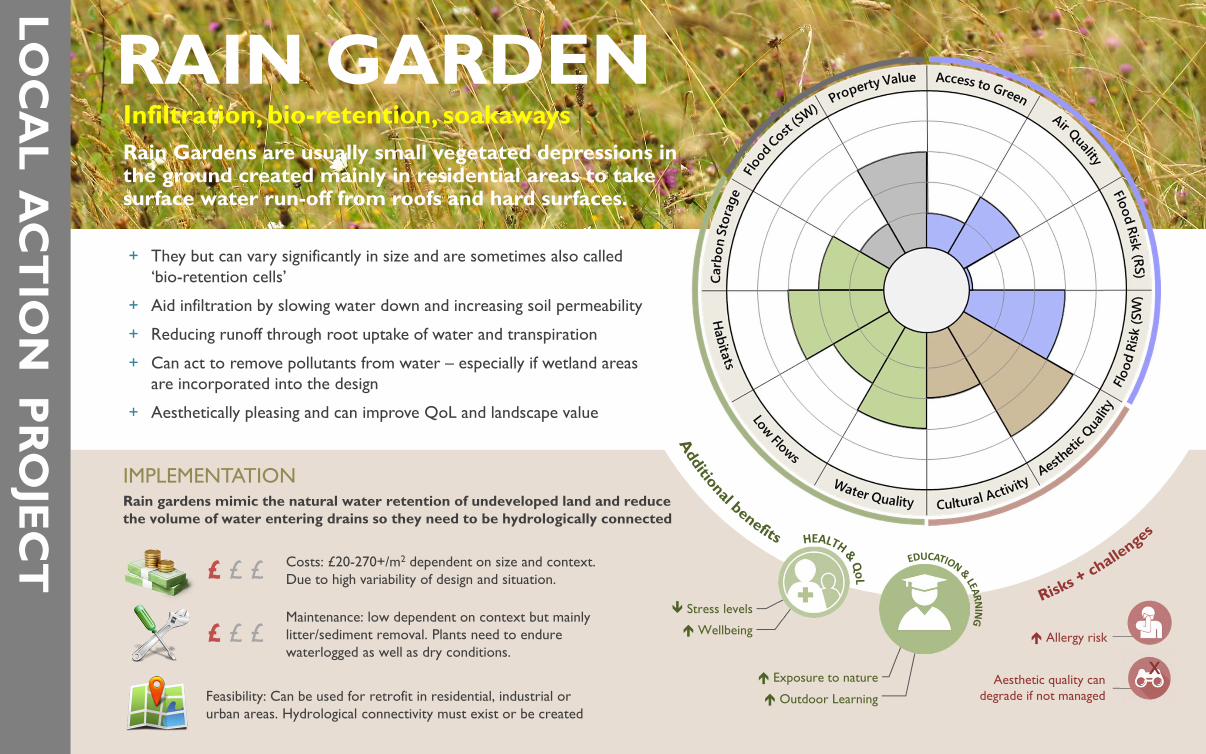
Rain Gardens are usually small vegetated depressions in the ground created mainly in residential areas to take surface water run-off from roofs and hard surfaces.
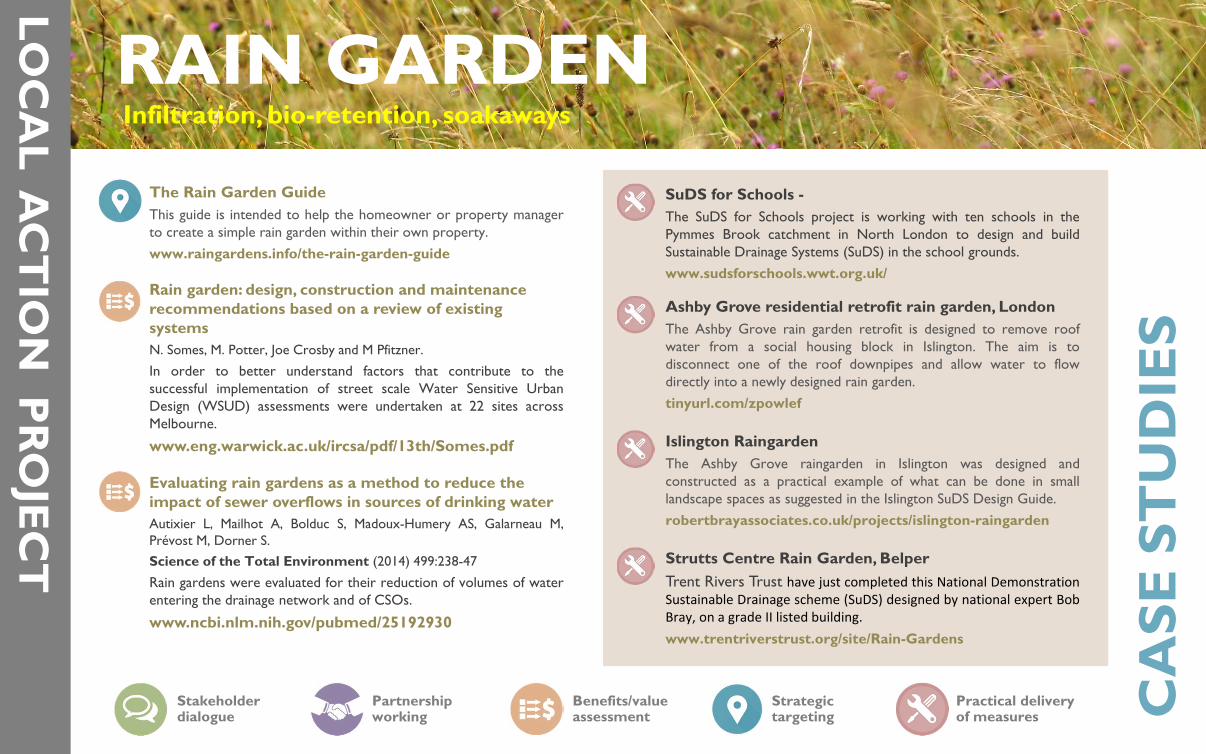
RAIN GARDENInfiltration, bio-retention, soakaways
+ They but can vary significantly in size and are sometimes also called ‘bio-retention cells’
+ Aid infiltration by slowing water down and increasing soil permeability
+ Reducing runoff through root uptake of water and transpiration
+ Can act to remove pollutants from water – especially if wetland areas are incorporated into the design
+ Aesthetically pleasing and can improve QoL and landscape value
IMPLEMENTATIONRain gardens mimic the natural water retention of undeveloped land and reduce the volume of water entering drains so they need to be hydrologically connected
Costs: £20-270+/m2 dependent on size and context. Due to high variability of design and situation. £ £ £
Maintenance: low dependent on context but mainly litter/sediment removal. Plants need to endure waterlogged as well as dry conditions.
£ £ £ Stress levels
Wellbeing
Exposure to nature
Outdoor Learning
x Allergy risk
Aesthetic quality can degrade if not managedFeasibility: Can be used for retrofit in residential, industrial or
urban areas. Hydrological connectivity must exist or be created
LOC
AL A
CT
ION
PR
OJE
CT
RAIN GARDENInfiltration, bio-retention, soakaways
Stakeholderdialogue
Partnershipworking
Benefits/valueassessment C
ASE
ST
UD
IES
Strategictargeting
Practical delivery of measures
The Rain Garden GuideThis guide is intended to help the homeowner or property managerto create a simple rain garden within their own property.www.raingardens.info/the-rain-garden-guide
Rain garden: design, construction and maintenance recommendations based on a review of existing systemsN. Somes, M. Potter, Joe Crosby and M Pfitzner.
In order to better understand factors that contribute to thesuccessful implementation of street scale Water Sensitive UrbanDesign (WSUD) assessments were undertaken at 22 sites acrossMelbourne.
www.eng.warwick.ac.uk/ircsa/pdf/13th/Somes.pdf
Evaluating rain gardens as a method to reduce the impact of sewer overflows in sources of drinking waterAutixier L, Mailhot A, Bolduc S, Madoux-Humery AS, Galarneau M,Prévost M, Dorner S.Science of the Total Environment (2014) 499:238-47
Rain gardens were evaluated for their reduction of volumes of waterentering the drainage network and of CSOs.
www.ncbi.nlm.nih.gov/pubmed/25192930
SuDS for Schools -The SuDS for Schools project is working with ten schools in thePymmes Brook catchment in North London to design and buildSustainable Drainage Systems (SuDS) in the school grounds.www.sudsforschools.wwt.org.uk/
Ashby Grove residential retrofit rain garden, LondonThe Ashby Grove rain garden retrofit is designed to remove roofwater from a social housing block in Islington. The aim is todisconnect one of the roof downpipes and allow water to flowdirectly into a newly designed rain garden.tinyurl.com/zpowlef
Islington RaingardenThe Ashby Grove raingarden in Islington was designed andconstructed as a practical example of what can be done in smalllandscape spaces as suggested in the Islington SuDS Design Guide.robertbrayassociates.co.uk/projects/islington-raingarden
Strutts Centre Rain Garden, BelperTrent Rivers Trust have just completed this National DemonstrationSustainable Drainage scheme (SuDS) designed by national expert BobBray, on a grade II listed building.www.trentriverstrust.org/site/Rain-Gardens
LOC
AL A
CT
ION
PR
OJE
CT
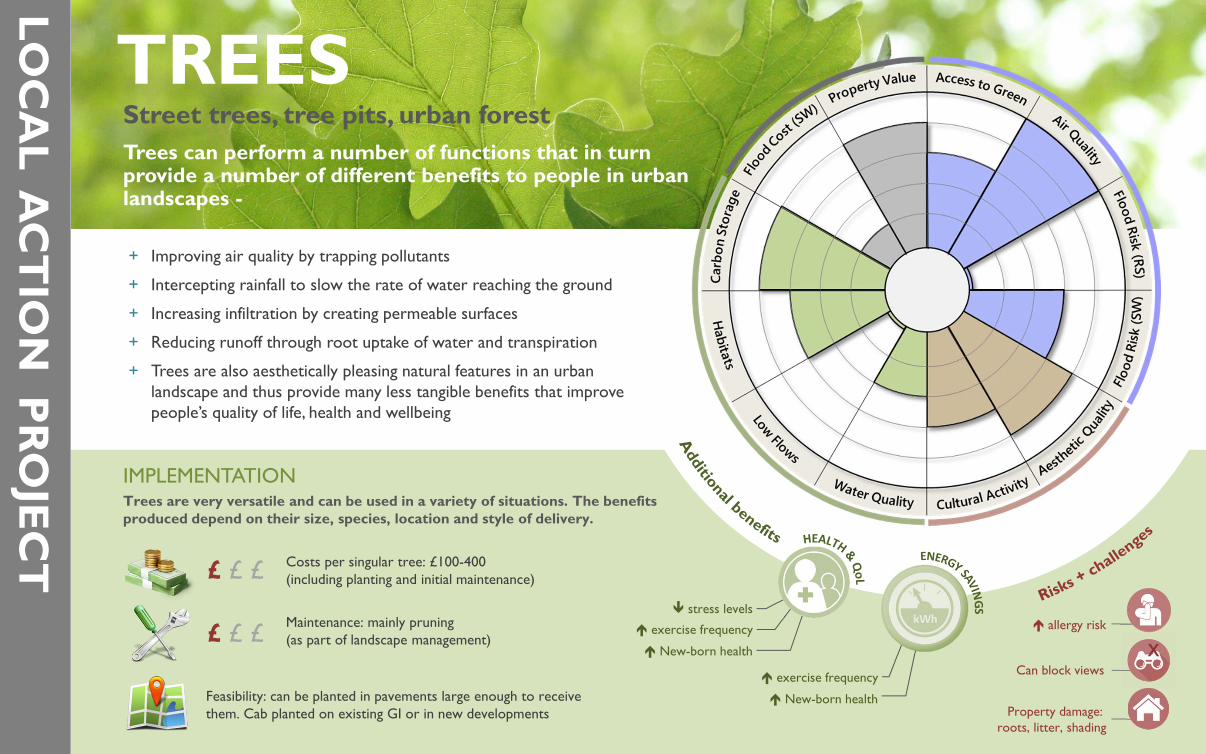
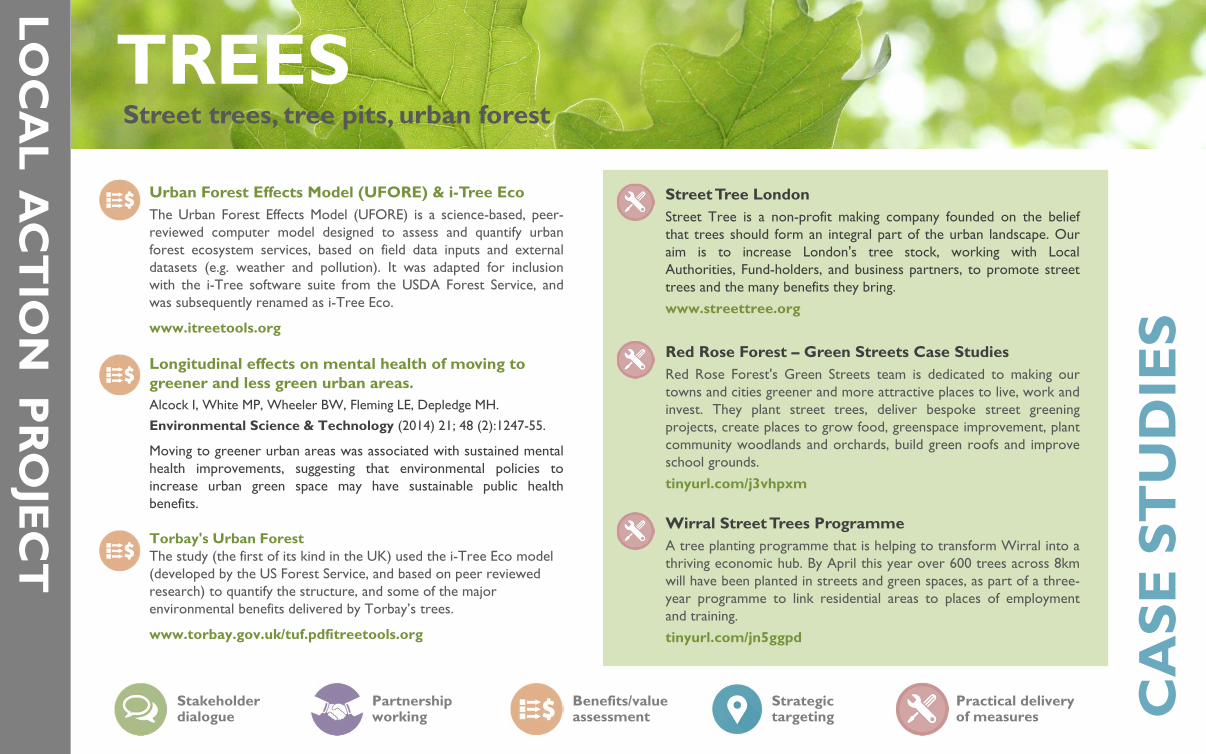
Trees can perform a number of functions that in turn provide a number of different benefits to people in urban landscapes -
TREESStreet trees, tree pits, urban forest
+ Improving air quality by trapping pollutants
+ Intercepting rainfall to slow the rate of water reaching the ground
+ Increasing infiltration by creating permeable surfaces
+ Reducing runoff through root uptake of water and transpiration
+ Trees are also aesthetically pleasing natural features in an urban landscape and thus provide many less tangible benefits that improve people’s quality of life, health and wellbeing
IMPLEMENTATIONTrees are very versatile and can be used in a variety of situations. The benefits produced depend on their size, species, location and style of delivery.
Costs per singular tree: £100-400 (including planting and initial maintenance)£ £ £
Maintenance: mainly pruning(as part of landscape management)£ £ £
stress levels
exercise frequency
New-born health
exercise frequency
New-born healthProperty damage:
roots, litter, shading
x allergy risk
Can block views
Feasibility: can be planted in pavements large enough to receive them. Cab planted on existing GI or in new developments
LOC
AL A
CT
ION
PR
OJE
CT
TREESStreet trees, tree pits, urban forest
Stakeholderdialogue
Partnershipworking
Benefits/valueassessment C
ASE
ST
UD
IES
Strategictargeting
Practical delivery of measures
Urban Forest Effects Model (UFORE) & i-Tree EcoThe Urban Forest Effects Model (UFORE) is a science-based, peer-reviewed computer model designed to assess and quantify urbanforest ecosystem services, based on field data inputs and externaldatasets (e.g. weather and pollution). It was adapted for inclusionwith the i-Tree software suite from the USDA Forest Service, andwas subsequently renamed as i-Tree Eco.
www.itreetools.org
Longitudinal effects on mental health of moving to greener and less green urban areas. Alcock I, White MP, Wheeler BW, Fleming LE, Depledge MH.Environmental Science & Technology (2014) 21; 48 (2):1247-55.
Moving to greener urban areas was associated with sustained mentalhealth improvements, suggesting that environmental policies toincrease urban green space may have sustainable public healthbenefits.
Torbay's Urban ForestThe study (the first of its kind in the UK) used the i-Tree Eco model(developed by the US Forest Service, and based on peer reviewedresearch) to quantify the structure, and some of the majorenvironmental benefits delivered by Torbay’s trees.
www.torbay.gov.uk/tuf.pdfitreetools.org
StreetTree LondonStreet Tree is a non-profit making company founded on the beliefthat trees should form an integral part of the urban landscape. Ouraim is to increase London's tree stock, working with LocalAuthorities, Fund-holders, and business partners, to promote streettrees and the many benefits they bring.www.streettree.org
Red Rose Forest – Green Streets Case StudiesRed Rose Forest's Green Streets team is dedicated to making ourtowns and cities greener and more attractive places to live, work andinvest. They plant street trees, deliver bespoke street greeningprojects, create places to grow food, greenspace improvement, plantcommunity woodlands and orchards, build green roofs and improveschool grounds.tinyurl.com/j3vhpxm
Wirral StreetTrees ProgrammeA tree planting programme that is helping to transform Wirral into athriving economic hub. By April this year over 600 trees across 8kmwill have been planted in streets and green spaces, as part of a three-year programme to link residential areas to places of employmentand training.tinyurl.com/jn5ggpd
PROJECT OUTPUTSA suite of evidence and information resources to support the targeting and implementation of environmental action in urban landscapes
Review of environmental assets & natural valueComprehensive review of the environmental infrastructure providingbenefits to people living in the urban landscape. The magnitude anddiversity of these benefits will be quantified and/or monetised).
Strategic assessment of benefits (need, priority)Assessment of 12 benefits metrics to support strategic targeting of actions. Combined with statutory or other priorities and drivers, to indicates greatest need (or opportunity) for interventions.
Urban practitioners ‘toolbox’A list (or ‘toolbox’) of interventions; including feasibility criteria, the ‘needs’ addressed, and the likely cost and the diversity and magnitude of the benefits likely to be realised.
Detailed opportunity mappingDevelopment of a list (or ‘toolbox’) of interventions; including feasibility criteria for its delivery, the ‘needs’ it has the potential to address, the likely cost and the diversity and magnitude of the benefits likely to be realised.
LOC
AL A
CT
ION
PR
OJE
CT
LOC
AL A
CT
ION
PR
OJE
CT
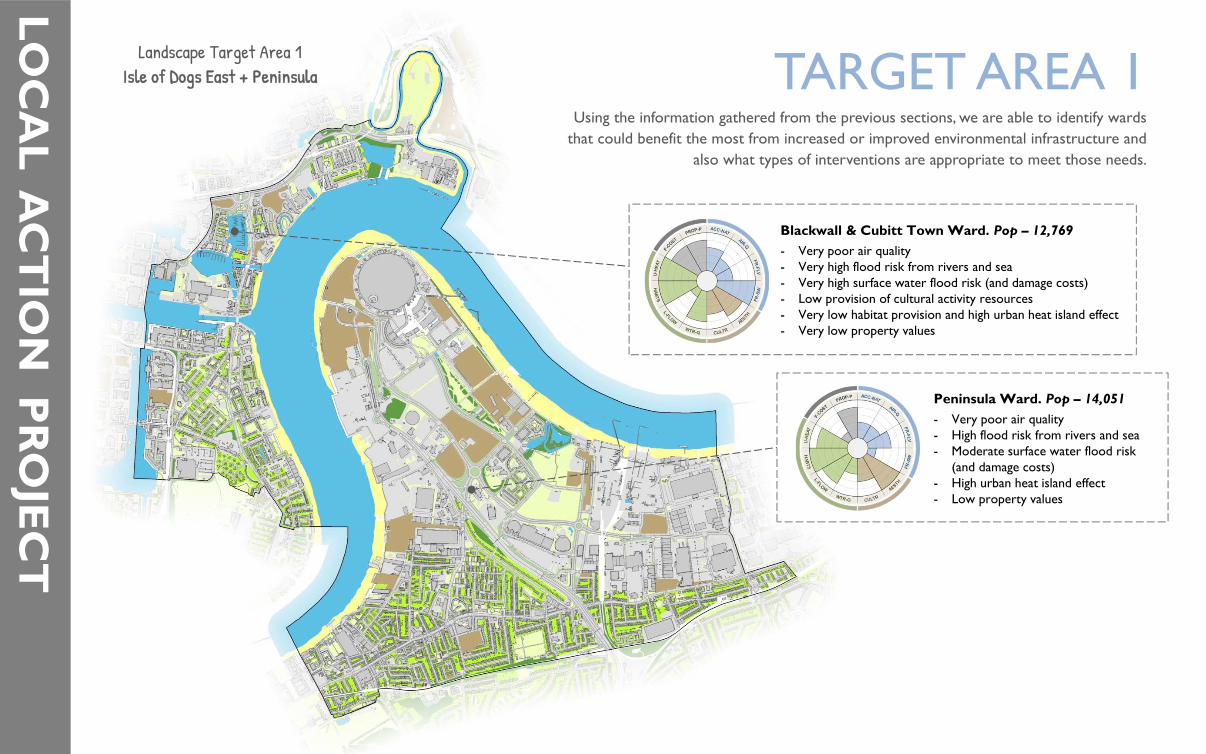
TARGET AREA 1
Peninsula Ward. Pop – 14,051- Very poor air quality- High flood risk from rivers and sea- Moderate surface water flood risk
(and damage costs)- High urban heat island effect- Low property values
Blackwall & Cubitt Town Ward. Pop – 12,769- Very poor air quality- Very high flood risk from rivers and sea- Very high surface water flood risk (and damage costs)- Low provision of cultural activity resources- Very low habitat provision and high urban heat island effect- Very low property values
Using the information gathered from the previous sections, we are able to identify wards that could benefit the most from increased or improved environmental infrastructure and
also what types of interventions are appropriate to meet those needs.
Landscape Target Area 1Isle of Dogs East + Peninsula
LOC
AL A
CT
ION
PR
OJE
CT
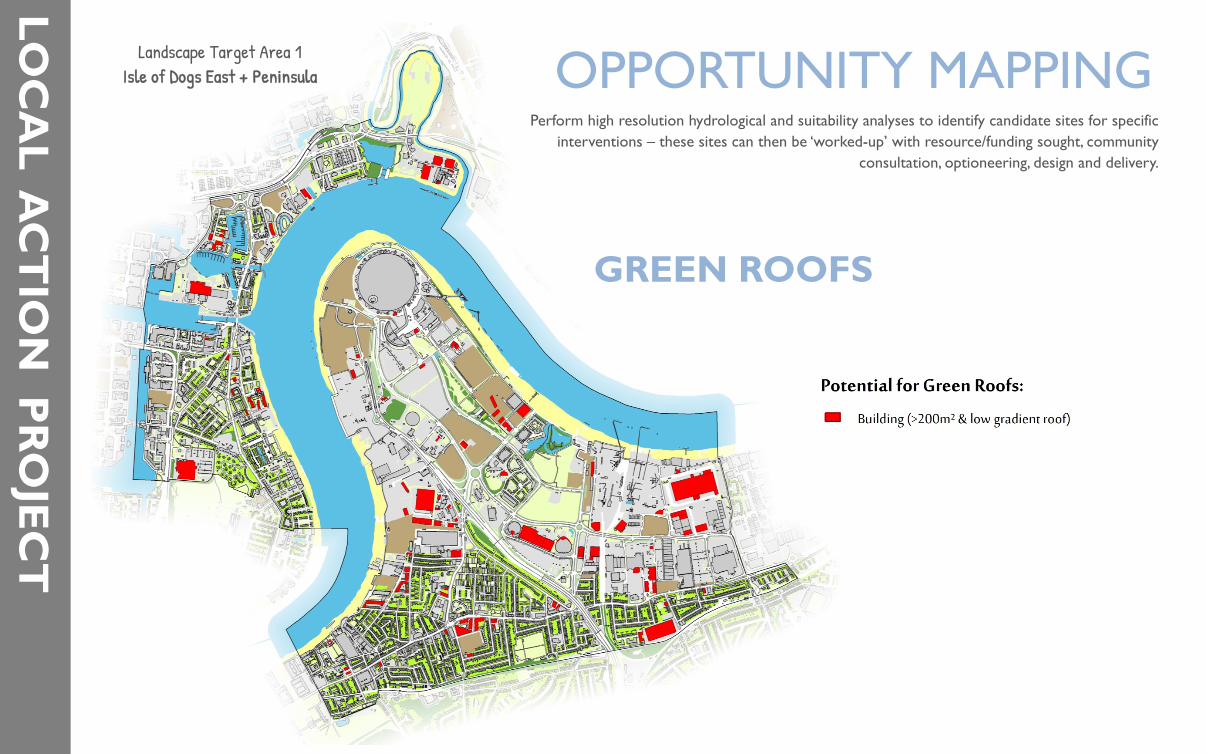
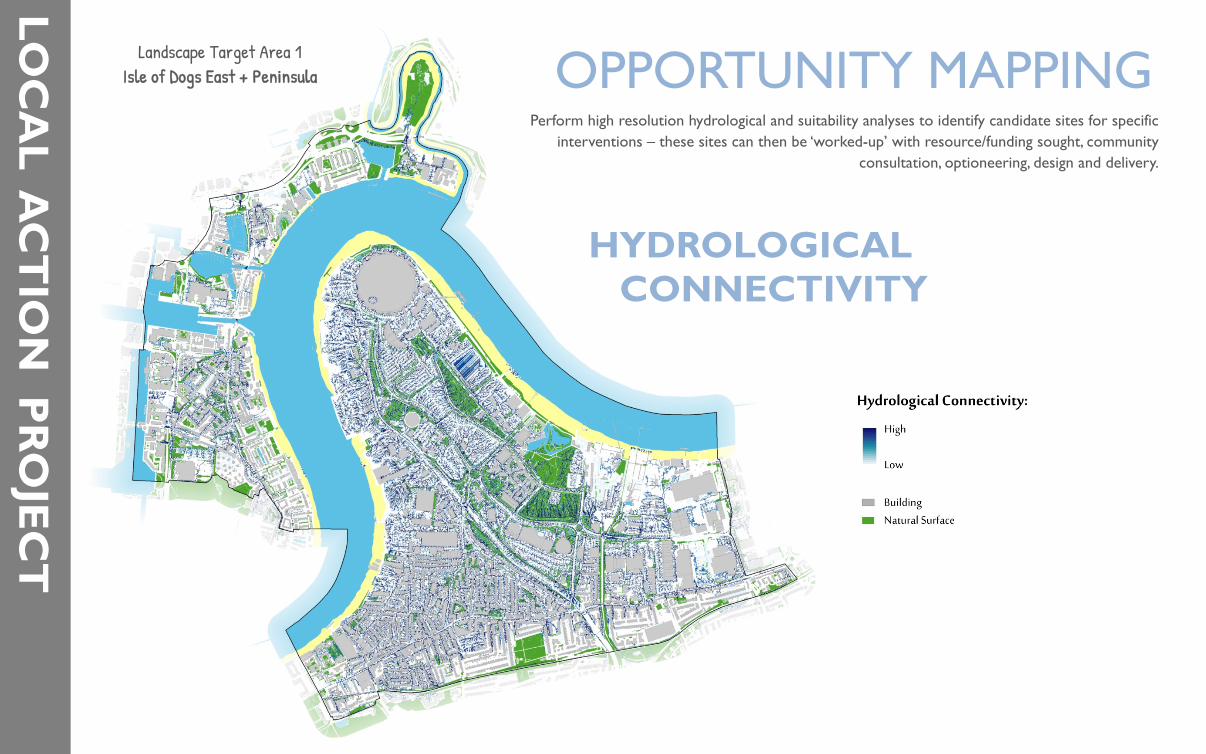
OPPORTUNITY MAPPINGPerform high resolution hydrological and suitability analyses to identify candidate sites for specific
interventions – these sites can then be ‘worked-up’ with resource/funding sought, community consultation, optioneering, design and delivery.
GREEN ROOFS
Landscape Target Area 1Isle of Dogs East + Peninsula

LOC
AL A
CT
ION
PR
OJE
CT
OPPORTUNITY MAPPINGPerform high resolution hydrological and suitability analyses to identify candidate sites for specific
interventions – these sites can then be ‘worked-up’ with resource/funding sought, community consultation, optioneering, design and delivery.
RIVER RESTORATION
Landscape Target Area 1Isle of Dogs East + Peninsula
LOC
AL A
CT
ION
PR
OJE
CT
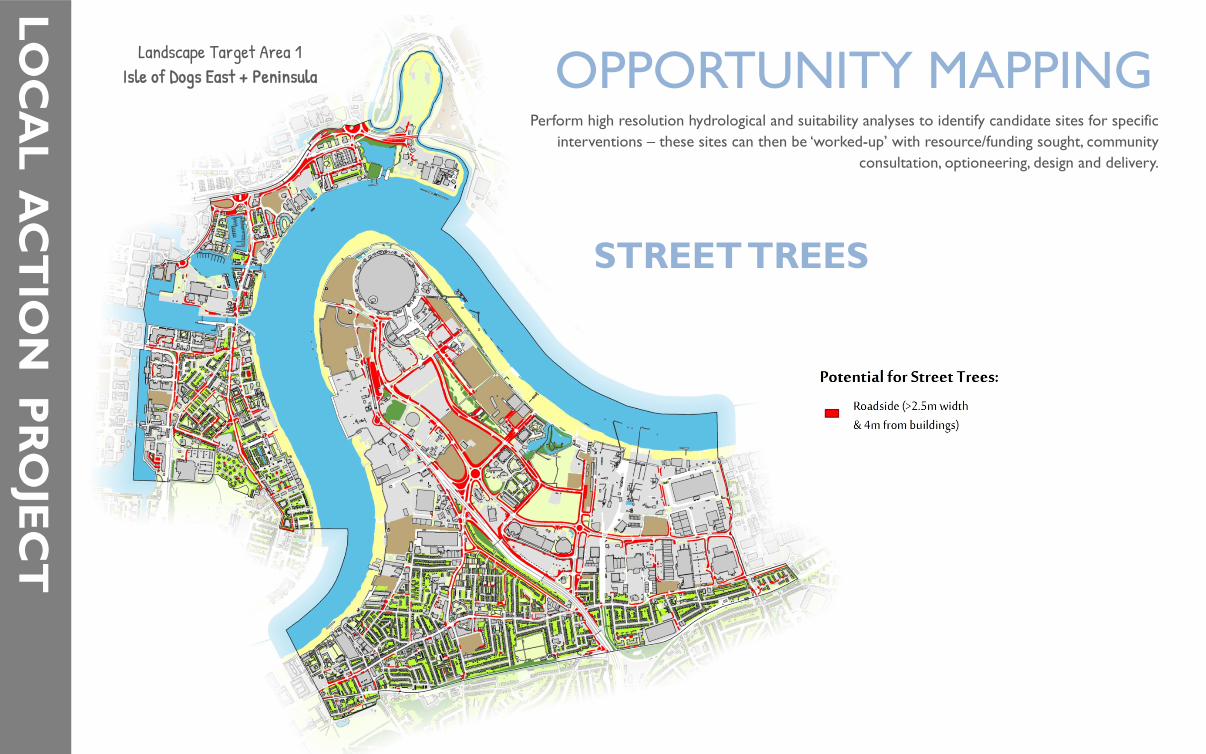
OPPORTUNITY MAPPINGPerform high resolution hydrological and suitability analyses to identify candidate sites for specific
interventions – these sites can then be ‘worked-up’ with resource/funding sought, community consultation, optioneering, design and delivery.
STREET TREES
Landscape Target Area 1Isle of Dogs East + Peninsula
LOC
AL A
CT
ION
PR
OJE
CT
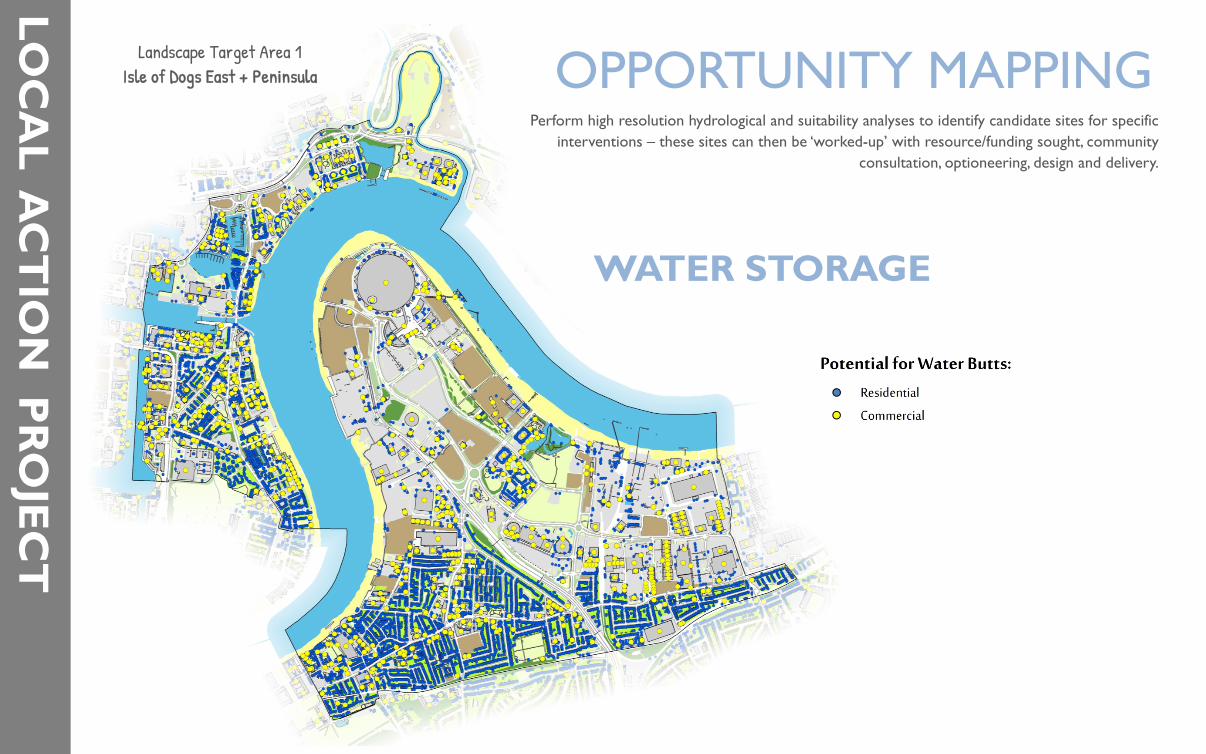
OPPORTUNITY MAPPINGPerform high resolution hydrological and suitability analyses to identify candidate sites for specific
interventions – these sites can then be ‘worked-up’ with resource/funding sought, community consultation, optioneering, design and delivery.
WATER STORAGE
Landscape Target Area 1Isle of Dogs East + Peninsula
LOC
AL A
CT
ION
PR
OJE
CT
OPPORTUNITY MAPPINGPerform high resolution hydrological and suitability analyses to identify candidate sites for specific
interventions – these sites can then be ‘worked-up’ with resource/funding sought, community consultation, optioneering, design and delivery.
HYDROLOGICALCONNECTIVITY
Landscape Target Area 1Isle of Dogs East + Peninsula
LOC
AL A
CT
ION
PR
OJE
CT
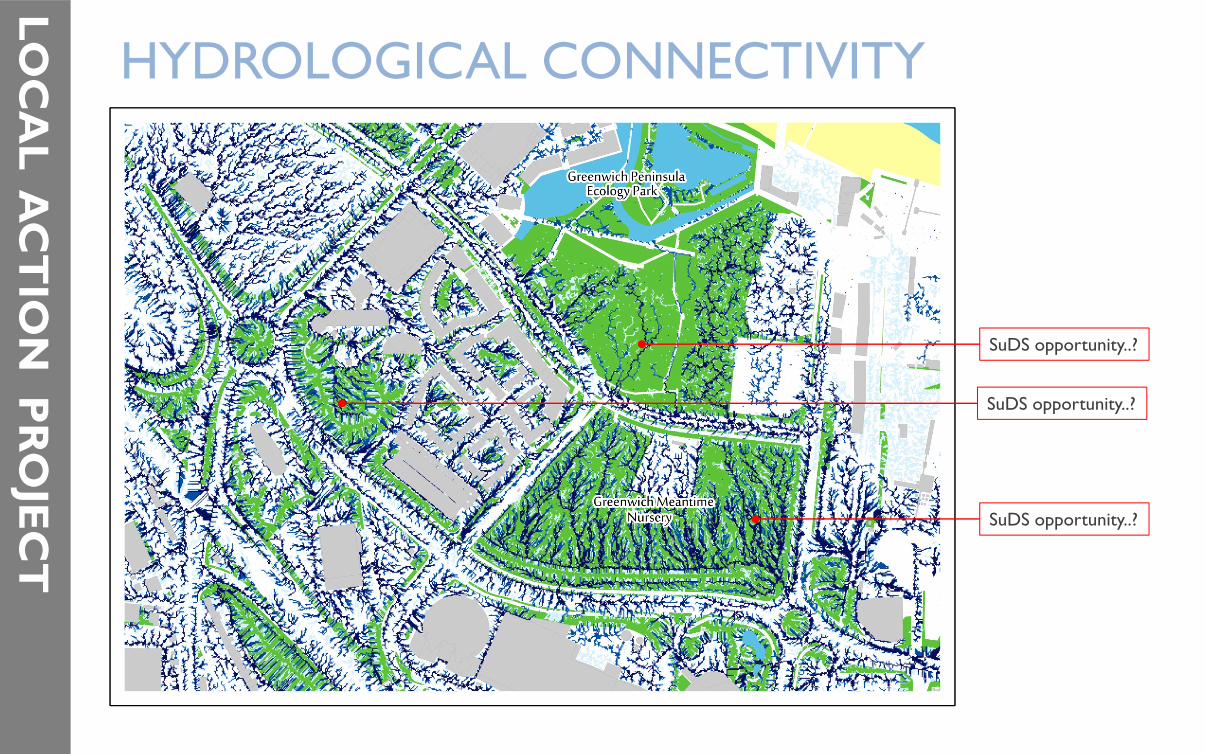
HYDROLOGICAL CONNECTIVITY
SuDS opportunity..?
SuDS opportunity..?
SuDS opportunity..?
LOC
AL A
CT
ION
PR
OJE
CT
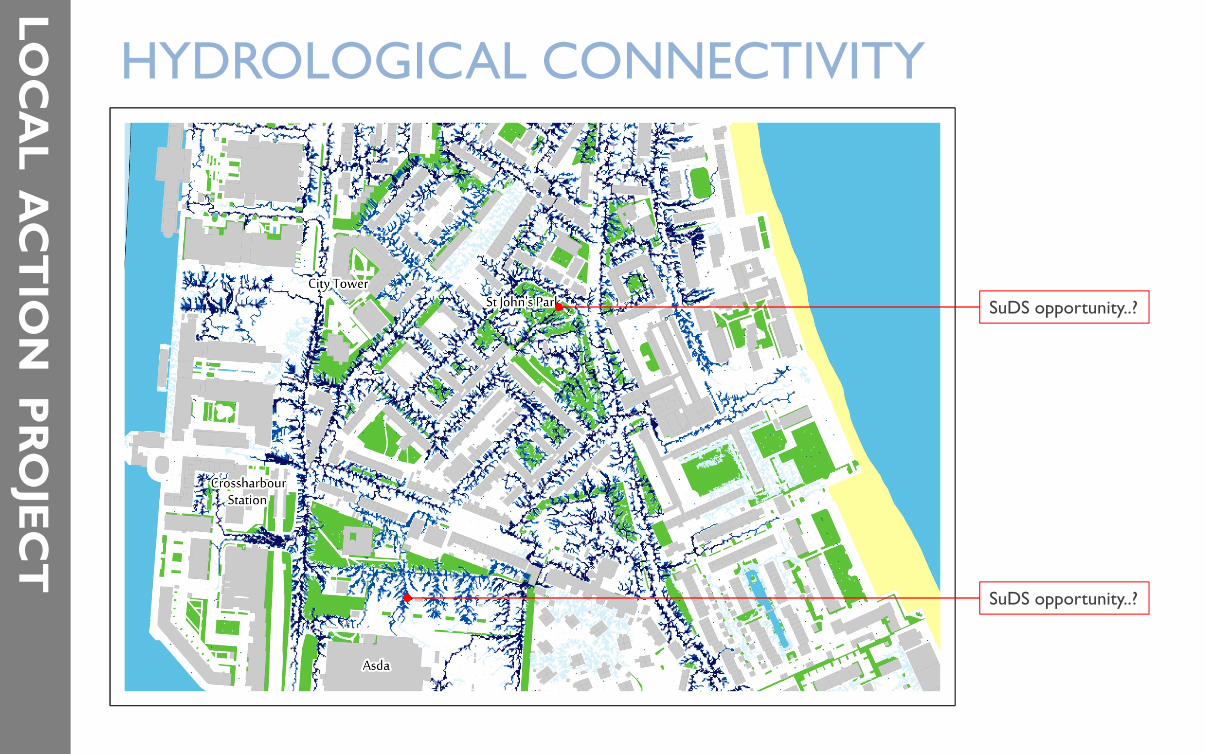
HYDROLOGICAL CONNECTIVITY
SuDS opportunity..?
SuDS opportunity..?
LOC
AL A
CT
ION
PR
OJE
CT
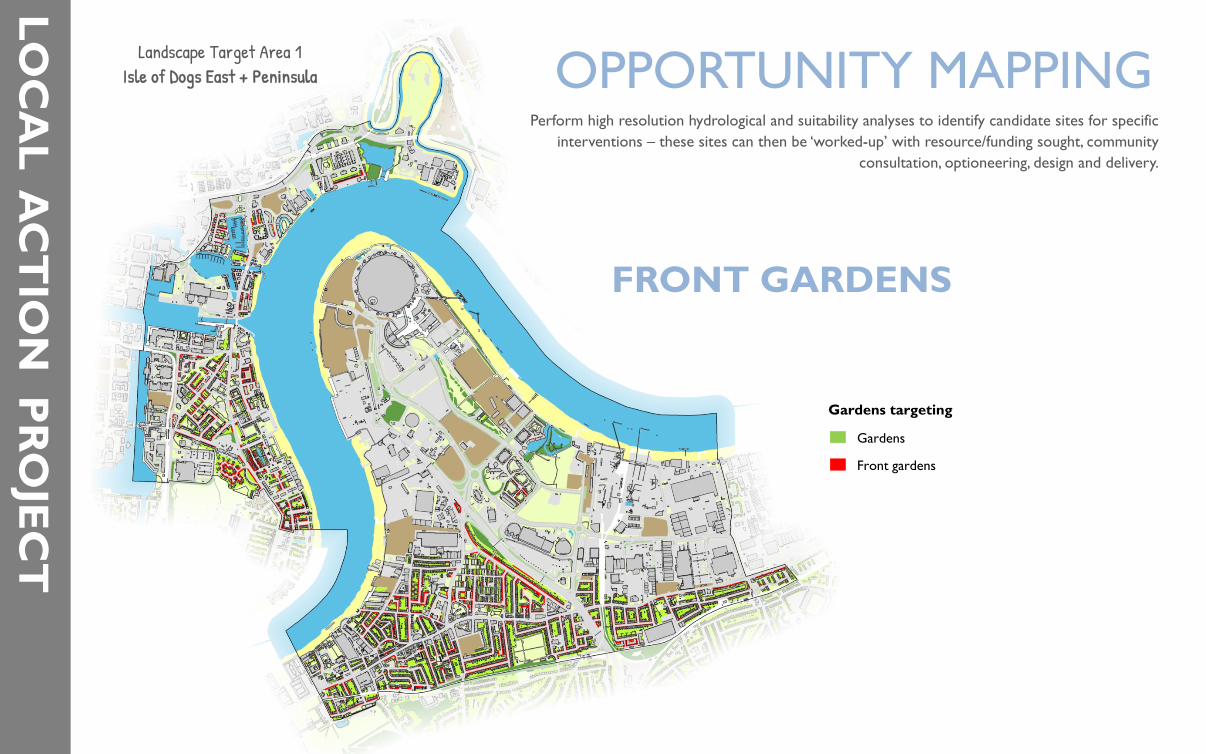
OPPORTUNITY MAPPINGPerform high resolution hydrological and suitability analyses to identify candidate sites for specific
interventions – these sites can then be ‘worked-up’ with resource/funding sought, community consultation, optioneering, design and delivery.
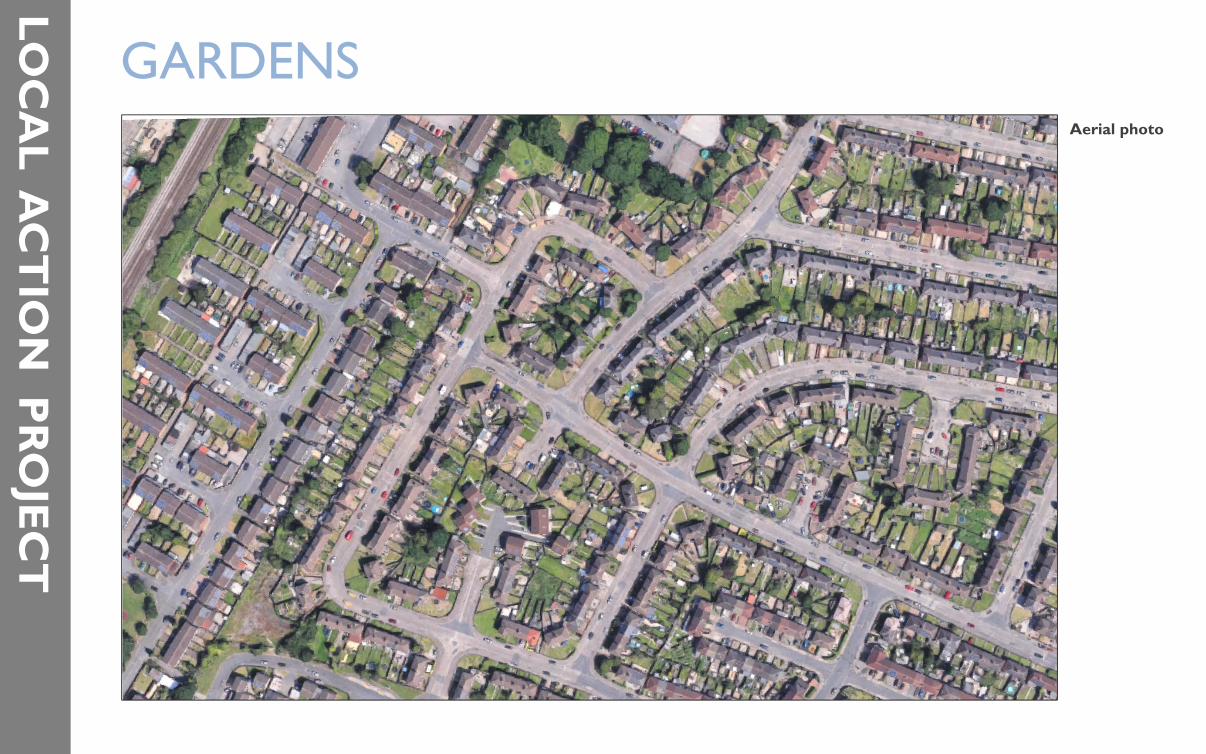
FRONT GARDENS
Landscape Target Area 1Isle of Dogs East + Peninsula
Gardens
Front gardens
Gardens targeting
LOC
AL A
CT
ION
PR
OJE
CT
GARDENSAerial photo
LOC
AL A
CT
ION
PR
OJE
CT
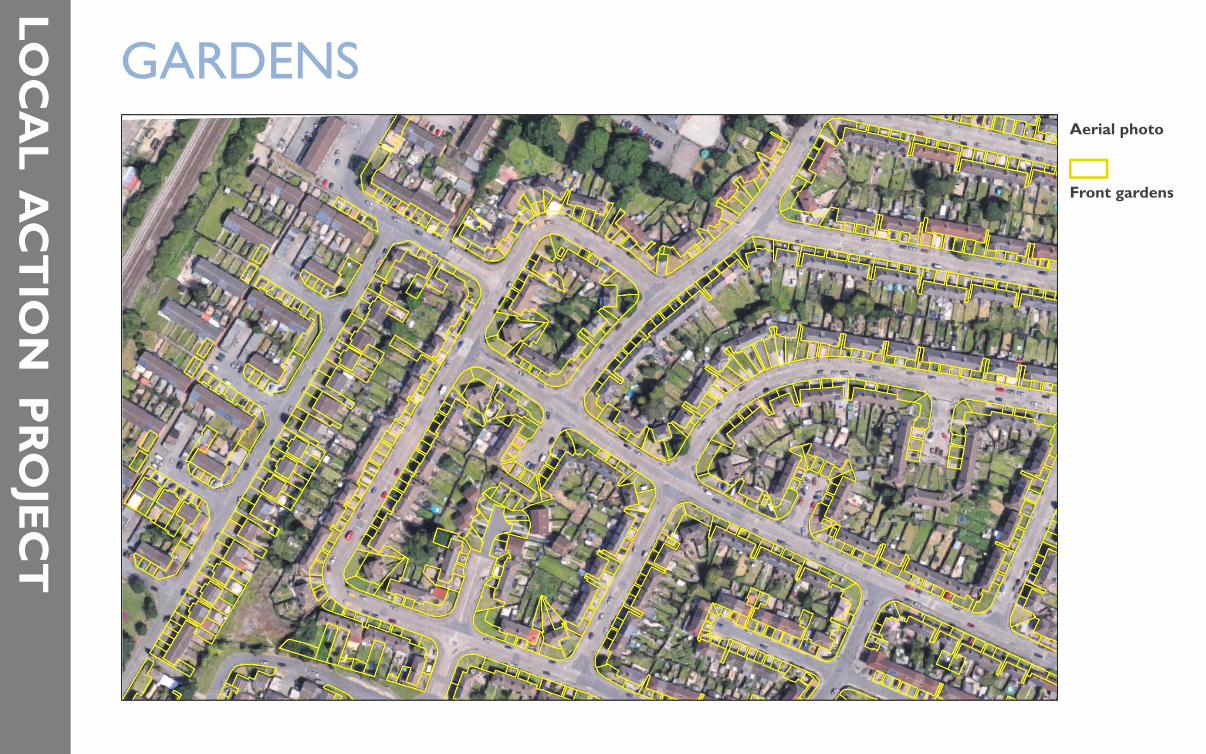
GARDENSAerial photo
Front gardens
LOC
AL A
CT
ION
PR
OJE
CT
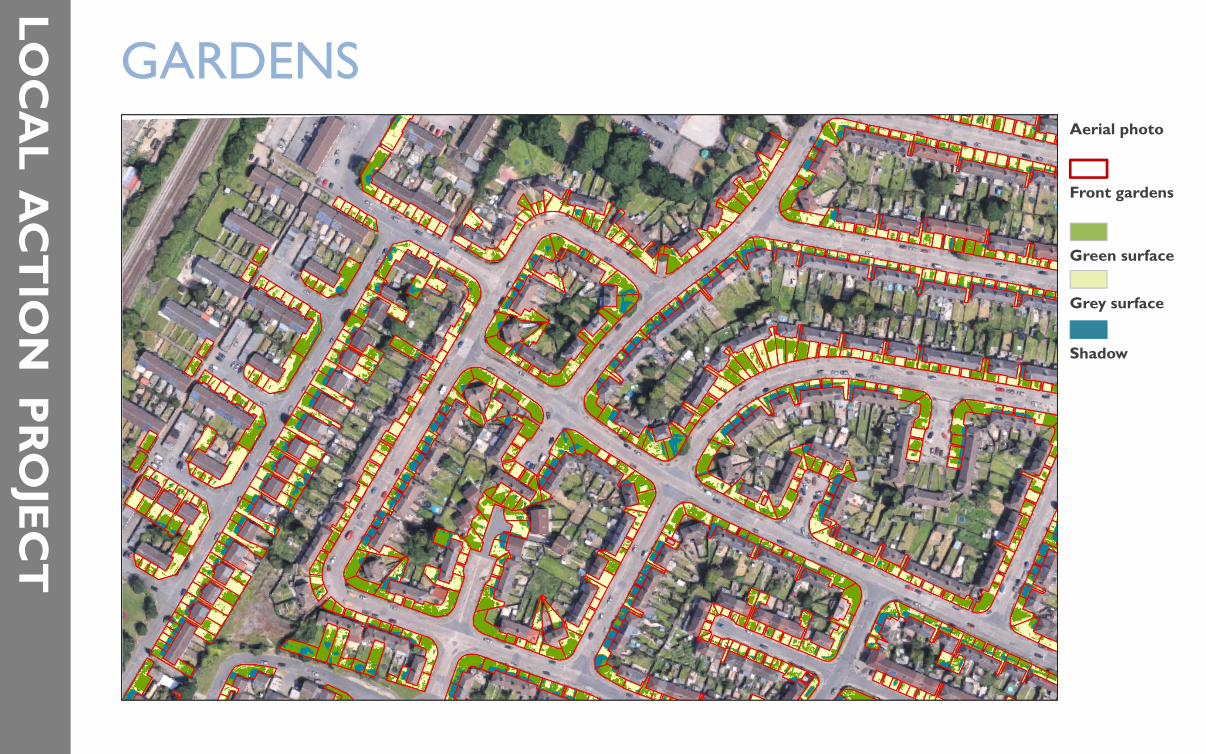
GARDENSAerial photo
Front gardens
Green surface
Grey surface
Shadow
LOC
AL A
CT
ION
PR
OJE
CT
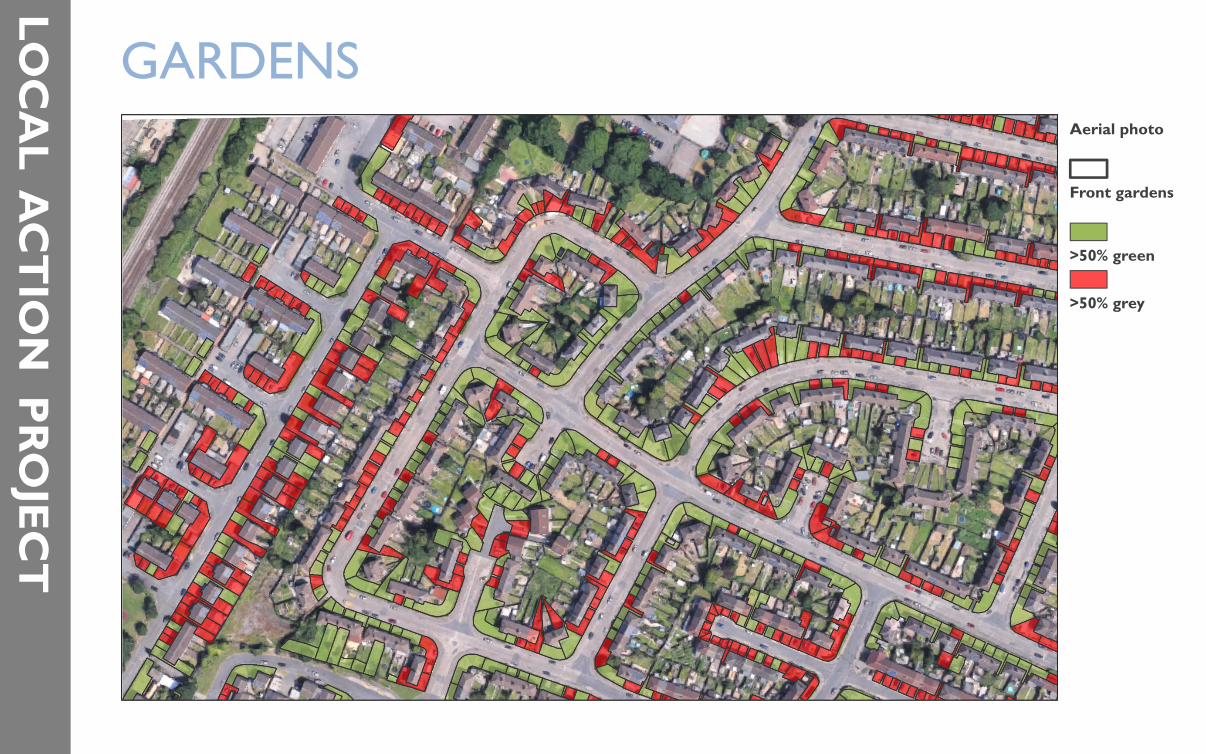
GARDENSAerial photo
Front gardens
>50% green
>50% grey

TARGETED
ACTIONINTERVENTIONS
DELIVER
FUNDING
TOOLBOX
OPPORTUNITY
BUY-IN
SUITABILITY
PARTNERSHIPCAPACITY SYNERGY
DESIGN
MEASURES
OPTIONEERINGCAPABILITY
STRATEGICSTRATEGIC
MANDATE
POLICY/LEGISLATION
MONETISED?ECONOMIC
SOCIAL
CULTURAL
ENVIRONMENTAL
BENEFITS
NATURAL CAPITAL
FUNCTION
VALUE
MULTI-FUNCTIONS
GREEN INFRASTRUCTURE
NATURAL ASSETSHABITATSFUNCTIONAL AREAS
SuDSOPEN SPACES
ECOSYSTEM SERVICES
SYNERGIES
PROTECTCONSERVE
MANAGE
ENHANCE
NO DETERIORATION
STOCK
NEED
PRIORITIESDRIVERS
STATUTORY
AMBITION
VISION
HUMAN IMPACTS
HIGH DEMAND FUNCTION
PROVISION
POLICY
LOC
AL A
CT
ION
PR
OJE
CT
LOC
AL A
CT
ION
PR
OJE
CT
LOCAL ACTION PROJECTLeicester | Manchester | Thames Estuary | Newton Abbot