TEXTO PARA DISCUSSÃO No 951
39
ISSN 1415-4765 TEXTO PARA DISCUSSÃO N o 951 RESIDENTIAL SEGREGATION AND SOCIAL EXCLUSION IN BRAZILIAN HOUSING MARKETS Maria da Piedade Morais Bruno de Oliveira Cruz Carlos Wagner de Albuquerque Oliveira Brasília, abril de 2003
Transcript of TEXTO PARA DISCUSSÃO No 951

ISSN 1415-4765
TEXTO PARA DISCUSSÃO No 951
RESIDENTIAL SEGREGATION AND
SOCIAL EXCLUSION IN BRAZILIAN
HOUSING MARKETS
Maria da Piedade Morais Bruno de Oliveira Cruz Carlos Wagner de Albuquerque Oliveira
Brasília, abril de 2003

ISSN 1415-4765
TEXTO PARA DISCUSSÃO No 951
RESIDENTIAL SEGREGATION AND
SOCIAL EXCLUSION IN BRAZILIAN
HOUSING MARKETS*
Maria da Piedade Morais ** Bruno de Oliveira Cruz *** Carlos Wagner de Albuquerque Oliveira****
Brasília, abril de 2003
* O presente texto, em língua Inglesa, não foi objeto de revisão editorial. O artigo corresponde a versão modificada de trabalho apresentado no VIII Encontro Nacional da Associação Portuguesa para o Desenvolvimento Regional (APDR), que se realizou em Vila Real, Portugal, de 29 de Junho a 1o de Julho de 2001.
** Da Diretoria de Estudos Regionais e Urbanos do Ipea. E-mail: [email protected]
*** Doutorando em Economia pela Université Catolique de Louvain (UCL), Bélgica − [email protected].
****Da Diretoria de Estudos Regionais e Urbanos do Ipea. E-mail: [email protected]
AGRADECIMENTOS: Os autores agradecem o apoio à pesquisa de Kleyne de Souza, Alexandre Paixão, Paula Renata Queiroga, Judson Carloni, Leonardo Góes, Leonardo Klüppel, Eulina Cruz e Rosemary do Nascimento, o auxílio no uso do SAS e SPSS de Radakian Lino e Rafael Osório e os valiosos comentários de Emmanuel Porto, Luiz Henrique Proença Soares, Claudio Hamilton Mattos dos Santos, Paul Irving Mandell e Mila Freire.


ISSN 1415-4765
Governo Federal
Ministério do Planejamento, Orçamento e Gestão
Ministro – Guido Mantega Secretário-Executivo – Nelson Machado Fundação pública vinculada ao Ministério
do Planejamento, Orçamento e Gestão, o Ipea
fornece suporte técnico e institucional às
ações governamentais – possibilitando a
formulação de inúmeras políticas públicas e
programas de desenvolvimento brasileiro –
e disponibiliza, para a sociedade, pesquisas e
estudos realizados por seus técnicos.
Presidente Glauco Antonio Truzzi Arbix
Chefe de Gabinete Persio Marco Antonio Davison
Diretor de Estudos Macroeconômicos Ricardo Varsano
Diretor de Estudos Regionais e Urbanos Gustavo Maia Gomes
Diretor de Administração e Finanças Celso dos Santos Fonseca
Diretor de Estudos Setoriais Mário Sérgio Salerno
Diretor de Cooperação e Desenvolvimento Maurício Otávio Mendonça Jorge
Diretor de Estudos Sociais Anna Maria T. Medeiros Peliano
TEXTO PARA DISCUSSÃO
Publicação cujo objetivo é divulgar resultados de
estudos direta ou indiretamente desenvolvidos pelo
Ipea, os quais, por sua relevância, levam informações
para profissionais especializados e estabelecem um
espaço para suge stões.
As opiniões emitidas nesta publicação são de
exclusiva e de inteira responsabilidade do (s) autor (es),
não exprimindo, necessariamente, o ponto de vista
do Instituto de Pesquisa Econômica Aplicada ou o
do Ministério do Planejamento, Orçamento e Gestão.
É permitida a reprodução deste texto e dos dados
nele contidos, desde que citada a fonte. Reproduções
para fins comerciais são proibidas.


SUMÁRIO
SINOPSE
ABSTRACT
1 INTRODUCTION 7
2 URBANIZATION TRENDS, SLUM FORMATION AND POVERTY PROFILE IN BRAZIL 8
3 SURVEY OF THE LITERATURE 12
4 THE DATA AND METHODOLOGY 16
5 THE LOGIT MODEL 20
6 MAIN RESULTS 21
7 CONCLUSIONS 24
BIBLIOGRAPHIC REFERENCES 26
APPENDIX 29


SINOPSE
Este artigo pretende analisar o conjunto de características que podem explicar o surgimento de favelas nas cidades brasileiras, a partir dos microdados da Pesquisa Nacional por Amostras de Domicílio (Pnad) do Instituto Brasileiro de Geografia e Estatística (IBGE) para o ano de 1999. O artigo está dividido em 2 partes principais. Na primeira parte, faz-se uma breve descrição das tendências da urbanização, do processo de formação de favelas e do perfil da pobreza no Brasil e apresenta-se uma resenha da literatura empírica sobre exclusão social e segregação espacial. Na segunda parte, estima-se uma função logit para testar hipóteses se atributos locais, regionais e pessoais como migração, nível de renda, tamanho da família, escolaridade, regime de propriedade, gênero, raça, idade, posição no mercado de trabalho, setor de atividade, tamanho de cidade e outros fatores locacionais são importantes para explicar o surgimento de favelas e a existência de segregação espacial e exclusão social no mercado habitacional das principais cidades brasileiras. Outra preocupação do artigo é esclarecer a natureza das relações existentes entre os mercados de trabalho e de habitação e o modo pelo qual a discriminação e a segmentação em ambos os mercados se reforçam mutuamente. Ao tentar elucidar as causas e a natureza da discriminação social e da segregação espacial enfrentadas pelos moradores das favelas brasileiras (“favelados”), este estudo pode ser útil no desenho de políticas de Desenvolvimento Regional e Urbano mais eficazes no combate à pobreza urbana, tanto no Brasil quanto em outros países em desenvolvimento.
ABSTRACT
This paper seeks to analyze the set of characteristics that can explain the existence of slums (favelas) in Brazilian cities, based upon microdata from the 1999 edition of the National Household Survey (Pnad), published by the Brazilian Institute of Geography and Statistics (IBGE). The paper is divided in 2 main parts. In the first part, we make a brief description of the urbanization trends, the process of slum formation and the poverty profile in Brazil and present a survey of the empirical literature on social exclusion and spatial segregation. The second part of the article describes a logit regression designed to test the hypothesis if local, regional and personal attributes such as immigration, income level, household size, schooling, tenure conditions, gender, race, age, labor market insertion, sector of activity, city size and other locational variables are important to explain the existence of slums and residential segregation in the housing markets of the major Brazilian cities. Other concern of the paper is the nature of the relationship established between labor and housing markets, and the way in which discrimination and segmentation in both markets reinforce each other. By shedding some light on the causes and the nature of social discrimination and spatial segregation faced by slum-dwellers in Brazil (favelados), this study can aid policy makers to design more efficient urban and regional development policies in order to fight urban poverty in Brazil and in other developing countries.


ipea texto para discussão | 948 | abr. 2003 7
1 INTRODUCTION
Urban problems in Developing Country Metropolises have been attracting more and more attention all around the world. The magnitude and the trends of the urbanization process in Brazil since the fourties pose several challenges to researchers and policy-makers keen on understanding their scope, causes and consequences, with special concern on the nature of the urban problems now faced by the major Brazilian cities.
Together with growing rates of urbanization, industrialization and concentration of economic activities over the space, one can observe an increase in urban poverty, both in relative and absolute terms, as well as the proliferation of slums (favelas) and illegal settlements, either in central cities or in the periphery of the metropolitan areas (MAs). Increased urban poverty, crime, social discrimination and spatial segregation within the cities, affect adversely the environmental quality and living conditions of the urban population, especially the poor, increase the need for adequate shelter and urban infrastructure services and call for more efficient and better-targeted urban development and social policies.
Despite increased acknowledgement of the importance of housing and urban services provision as poverty alleviation strategies, not much research is being done on this field in Brazil. The great majority of studies on poverty and social exclusion in the country, deals mainly with the effects of different levels of education over employment opportunities and income inequality. Recently, we have also observed a growing concern on gender and race inequality, although hardly anything has been established on the nature of the existing links between social exclusion and spatial segregation, taken from an economic point of view. Most of the studies dealing with informal housing and socioeconomic segmentation in the cities places great emphasis on the urban legislation aspects of the question, showing little concern for the quantification and understanding of the socioeconomic determinants of such a spatial segregation. This is precisely the main purpose of this paper, i.e., to shed some light onto the major determinants of slum formation in Brazil and to test hypotheses about the set of personal and locational characteristics that can affect the probability of becoming a slum-dweller (favelado). Another concern of the paper is the nature of the relationship established between labor and housing markets, and the way in which discrimination and segmentation in both markets reinforce each other.
The paper is divided into 5 sections, besides this introduction. In the second section we present a brief description of the urbanization trends, the process of slum formation and the nature of the poverty profile in Brazil, using census and household survey data for several years. In section 3 we present a survey of the empirical literature on social exclusion and spatial segregation and on studies that have applied logistic regressions to investigate unemployment, poverty and housing choice. Section 4 describes the data set as well as the housing, personal and living conditions in substandard residential areas, used here as a proxy for slums.1 Section 5 presents the variables used in the logit model to explain slum formation in Brazil, taking into
1. See the methodological notes on section 4.

8 texto para discussão | 948 | abr. 2003 ipea
account the personal characteristics of the household’s head, income level and locational attributes. Section 6 shows the results and the policy implications derived from the model. Finally, section 7 presents the main conclusions, as well as some new ideas for the research agenda on housing in Brazil.
2 URBANIZATION TRENDS, SLUM FORMATION AND POVERTY PROFILE IN BRAZIL
This section briefly portrays the urbanization process in Brazil, emphasizing some aspects that seem particularly important for the understanding of its current trends and the problems affecting the quality of life, spatial segregation and social exclusion in Brazilian cities, such as migration, poverty, unemployment and racial and gender discrimination.
Traditionally, Brazilian growth model has been characterized by the social exclusion of growing portions of the society, caused mainly by an unequal income distribution, where a small portion of the population has access to the bulk of income and wealth, including proper housing, urban infrastructure and other basic services like education and health, whereas the great majority of the population is deprived from the access to those minimum basic needs. In the past decades, the process of social exclusion in Brazil has been accompanied by growing urbanization rates and the spatial segregation of minorities and low-income population in slums and illegal settlements, located either in central cities or in the fringe of the major MAs.
The Urbanization Process in Brazil
Toward the end of the colonial period, the urban population accounted for less than 6,0% of the country’s total population. In the 20th century Brazil experienced a huge increase in urban population, from 10,7% in 1920 to 31,2% in 1940. From the fifties on, the population and economic activities have increasingly concentrated in the cities of the Southeastern region, mainly in São Paulo and Rio de Janeiro.
Urbanization rates have increased consistently since the fourties, and Brazil has first been viewed as an urban country in the seventies, when more than 52 million people (55,9%) were living in urban areas. The country experienced the most rapid population growth rate between 1960/70. Every IBGE Census since 1940 reveals a positive increase in urban population. Such vigorous growth paralleled the country’s industrialization, and had a profound effect on urban-rural and regional population patterns.
In the last six decades, the inter-regional migratory movements were complemented with strong intra-regional migrations, of rural-urban nature, in all the Brazilian areas, due to the attraction provoked by the industrial growth and improved access to urban services, as well as to the structural changes in the agriculture sector, resulting in faster urban growth, not only in the economically dynamic areas of the Southeast, but also in less developed regions, such as the North, where, despite the small demographic density per square Km, roughly 69,7% of the total population live in cities.

ipea texto para discussão | 948 | abr. 2003 9
From 1980 on, we can observe a decrease in rural population, both in absolute and relative terms. From 1991 to 2000, the rural population decreased at an average annual rate of 1,3%. In 2000, 81,2% of the Brazilian population lived in urban areas, and concentrated mainly in the Southeastern (42,6%) and Northeastern regions (28,1%). Urbanization rates are higher in the Southeast (90,5%) and the South (80,9%) of the country.
In the seventies and the eighties there has been an enormous population growth rate in the MAs, with an inversion in these trends since 1996, where the urban population is still growing at higher rates, but is concentrating mainly in medium-sized cities. Although MAs have grown at about the same rate, there are dramatic differences in the intra-metropolitan distribution of such growth, with the periphery of larger metropolitan areas growing faster than the central cities.
The process of Slum formation
Favela is the generic name given to the agglomerations of substandard housing, that have emerged initially in Rio de Janeiro. The term was then generalized, with some local variations, to define substandard housing in other Brazilian cities.2
Usually, slums or favelas are highly populated areas, encompassing agglomerations of degraded properties and other facilities, constructed without streets and public spaces planning and lacking essential public infra-structure services, such as water, sewerage and garbage collection and disposal. Slums are usually located in fallow lands, hillsides, seashore lands or flooding areas, in ill-divided plots destined to low-income population. Slum-dwellers endure both social exclusion and spatial segregation, because they have less access to health care, education, job opportunities and proper housing and urban services.
Historically, the phenomenon of slum formation (favelização) in Brazil seems to trace back to the beginning of the 20th Century, in Rio de Janeiro. The excluding nature of the urban reform and the excessive burden of municipal legislation implemented under Pereira Passos administration (1903), with the eradication of collective and rental housing inhabited by the poor in the inner city (cortiços, casas de cômodos and cabeças de porco), and the construction of cheap houses in the suburbs for the working class (vilas operárias), caused an increase in land values, either in central cities or in peripheral areas, with the eviction of the poor towards the suburbs and the empty hills near the city center, causing the emergence of slums. New slums appeared following the new sources of employment: industrial in the northern and services in the southern zones of the city. Slums were only officially recognized by the local Government in the fourties. According to Vaz (1998), the emergence of slums in Rio can be seen as a response of the population to the transformations caused by the urban modernization of the city, showing the need of the proximity between home and work places.
2. The word favela is more used to denominate substandard housing in Rio and São Paulo, while in the rest of Brazil there’s a wide variety of local names such as palafitas in the North, mocambos and alagados in the Northeast, invasões in Bahia and Federal District. However, the denomination favela is now widely used in the entire country.

10 texto para discussão | 948 | abr. 2003 ipea
During the fourties and the fifties the number of slums increased, due to migration from rural to urban areas. The phenomenon of spatial concentration of the Brazilian low-income population in slums was a by-product of the urbanization process and might be explained by the existing attraction and repulsion forces between rural and urban areas. Among the attraction factors we can point out the creation of an industrial pole in the Southeasthern region, which generated labor demand on industry, trade and services sectors, increasing wage differentials in favor of urban areas. Other important factors of attraction were the safety networks provided by the labor market legislation and social security systems, coupled with improved access to employment and urban, health and education services, which were concentrated in urban areas. After 1964, the large investments in public works and social housing, rendered an influx of people toward the cities, without the necessary planning and the provision of adequate housing and public services at reasonable prices, payment and credit conditions accessible to the urban poor (Grazia and Queiroz, 2001).
Sampaio (1998) states that slums are a relatively recent phenomenon in São Paulo, which have intensified in the seventies. Taschner (1998) points to the existence of an inflexion in the process of suburbanization in São Paulo during the eighties, with the deterioration of living conditions caused by an increase in unemployment rates and the progressive impoverishment of the population, where the process of slum formation is accompanied by a displacement towards the city’s central areas. The poor sanitation, environmental and access conditions among slum-dwellers in Rio de Janeiro and São Paulo are emphasized by Casé (1996) and Sampaio (1998).
Poverty Profile, Employment and Social Exclusion in Brazil
Brazil presents one of the highest income inequalities in international terms, with income inequality concentrated in the richest 10,0% stratum of the population. Income inequality was more intense in the sixties, decreased in the seventies and had an increase during the eighties, in face of a stagnant per capita income for the poor population, in increasingly complex labor markets.3 Despite the steady improvement in the poverty indicators in the nineties, methodological different led to disagreements over the actual number of poor. One can also observe the persistence of strong inequalities among Brazilian regions (Lopes, 1989, Morais and Lima, 2001).
Income Poverty indicators4 show a decrease in the proportion of poor households in Brazilian cities from 19,0% in 1993 to 11,0% in 1998. In urban areas, the proportion of poor women-headed households in 1998 (14,0%), despite being smaller than it used to be in 1993 (19,0%), is, however, larger than the man-headed
3. See Barros and Mendonça (1995), Rocha (1996) and Rocha (2000), for more details on the evolution of the poverty profile in Brazil.
4. This section is based mainly on Morais and Lima (2001) and uses data on poverty calculated by Ipea/Sônia Rocha, based on IBGE/Pnad microdata. A person or a household is considered to be poor when it has a monthly revenue below the poverty line. The poverty lines were based upon the observed consumption patterns of low-income population, according to the IBGE Research on Households Budget (POF), corrected by local price indexes.

ipea texto para discussão | 948 | abr. 2003 11
households in 1998 (11,0%), which might demonstrate the higher fragility of the living conditions of single women with children.
In spite of the decrease in poverty levels for the country as a whole, the poverty profile in Brazil has shown pronounced differences in its regional evolution, showing improvement in the Center West, as well as a sustained reduction of extreme poverty in rural areas and an increase in metropolitan poverty rates throughout the last decade, due to the urban employment restructuring process, which imposed adverse impacts over job market and employment levels, such as growing unemployment rates, and lower quality of employment, which is becoming increasingly informal. The percentage increase of self-employed and informal employed, reduces income returns for labor, causing a decrease in the average per capita earnings of labor income, and an increase in poverty ratios (Rocha, 2000).
The absolute number of poor in 1998 was 51,3 million people (33,4% of the Brazilian population). For the main MAs the poverty ratio (33,7%) was greater than for the country as a whole. Despite the high proportion of poor in rural areas (41,6%), the contribution of the rural poor to total poverty (23,9%) in Brazil is much smaller than the urban poor (76,1%) in 1998. The Brazilian poor live mainly in the Northeast (43,6%) and Southeast (35,0%). While in the Southeast, poverty is a metropolitan phenomenon (53,4%) in the Northeast poverty is concentrated among other urban areas (43,6%). The MAs of São Paulo, Rio de Janeiro and Recife account for 19,3% of the Brazilian poor.
Job market indicators for the Brazilian cities have shown an increase in the rate of women’s participation in the labor force. Despite their higher education levels, women have higher unemployment rates and lower salaries than men, thus showing the existence of gender discrimination in the country. We can also notice a racial discrimination in the labor market, where the non-white population has higher unemployment rates, less formal education, lower salaries and occupy mainly informal activities.5 The employment rate is positively related with the education level and negatively with age, affecting younger people more strongly. The unemployment rate increased from 1993 to 1998 and is more severe among women (14,4%), and non-whites, while unemployment rate among males is 9,2%. We also find lower tenure security among non-white women-headed households.
The heaviest burden imposed by poor living, housing and working conditions in low-income areas is inflicted on women with children. The most critical situation is found among single non-white women that are household’s heads. Being responsible for the healthcare, nutrition and education of children, adolescents and the elderly, women have their problems aggravated by the lack of proper urban services, less formal ownership ratios and lower housing quality.
Ramos (1994) investigates the effects of macroeconomic factors on the evolution of poverty and indigence in Brazil during the eighties, trying to identify the socioeconomic groups most acutely affected by poverty and penury. Using Pnad microdata for several years and decomposition analysis to assess the importance of
5. Soares (2000), using the 1998 Pnad microdata, showed that white women´s monthly income accounts to 79,0% of white male, while for black men and black women those figures are 46,0% and 40,0%, respectively.

12 texto para discussão | 948 | abr. 2003 ipea
different socioeconomic groups to total poverty, he showed that the chronically poverty-stricken groups in Brazil are: female-headed households, illiterates, young, Northeasthern region residents, people with no monetary earnings or informal employees, which are over-represented amongst the poor and are even more pronounced amongst indigents.
3 SURVEY OF THE LITERATURE
This section intends to review the literature on Social Exclusion, Spatial Segregation and on studies that have applied logistic regressions to study unemployment, poverty and housing tenure choice.
Literature on Spatial Segregation and Social Exclusion
Economic theory suggests that spatial segregation by race and ethnic groups can impact the economic performance of minorities both in negative and positive ways, although the great majority of the authors agrees that spatial segregation can be damaging because it curtails informational connections with the larger community or because the spatial concentration of the poor can prevent human capital accumulation and encourage crime. Wilson (1987) thinks that racial segregation can be positive, because it might ensure that minorities have middle-class role models and, thus, promote good outcomes in segregated areas.
In the USA, there is a long tradition of studies on spatial segregation of minorities, especially in what refers to the so-called ghettos, where there’s a predominance of certain ethnic groups. In Europe, the migrants' localization in certain neighborhoods also raises the subject of the spatial segregation and its interrelationship with poverty.
The literature on spatial segregation shows that, in the USA, the low-income population are typically black and that the residential patterns are highly segregated by race, with income and family structure alone explaining only a small portion of the existing spatial segregation. Suburbanization of housing and employment sources reduces the employment, housing and educational prospects for minority groups, who are concentrated in central cities. The incidence of poverty in many central city neighborhoods has increased over time, as higher income blacks move out of ghetto areas. Some studies from the sixties showed that blacks pay more for housing of the same quality while, for the seventies, empirical data showed that the housing prices in black neighborhoods were lower than housing of same attributes in white areas. One argument in favor of higher spatial integration is the importance of neighborhood effects on the quality of life and on individual’s behavior. A specific benefit generated by greater racial and spatial integration might be higher educational attainment by low achievers. However, the results of empirical studies on the importance of “peer-group” effects on educational achievement are mixed.
Piketty (2000) analyses the social mobility among several generations in the USA and Europe, and verified, that, in fact, this mobility is rather small, with the perpetuation of poverty over time. His empirical results confirm the low alteration in
ipea texto para discussão | 948 | abr. 2003 13
social structures. The persistence of inequality can be explained by spatial segregation, among other factors.
Although the sociological literature has pointed out the importance of the effects of the community's atmosphere on children and families’ educational development during several years, it was only recently that the economic literature has been interested in this theme. Benabou (1993) studies the impact of spatial segregation on the economic performance of minorities. The author argues that the existence of a more qualified neighborhood, with a larger formal education, would result in positive externalities for that community's residents, basically for three reasons: peer effects, social network and local public goods. The “Peer effect” is due to the fact that interacting with more educated people generates a positive impact on that community's residents' behavior. For instance, Crane (1991) shows, using longitudinal data for some American cities, that the probability of pregnancy in adolescence is larger in low-income neighborhoods and among children and adolescents of ghettos. Marry and Katz (1991) also show that the probabilities of criminal condemnation, drugs use, and engaging in criminal activities are also larger for people segregated in ghettos.
A second impact raised by Benabou (1993) is the existence of a “social network of contacts” that would allow the residents of a more qualified area to find employment more easily or higher qualification jobs. Finally, there are the impacts caused by access to local public goods. Neighborhoods or subnormal communities tend to have smaller capacity to finance local public goods, which generates a negative externality for its members. Such fact is particularly important in the USA, where basic education is financed through taxes collected directly from the beneficiary community. Given these externalities, the model proposed by Benabou (1993) assumes that the agents possess identical initial endowments and the same innate characteristics. These agents should decide which educational level they want (high, low or even stay out of the job market) and choose their place of residence. However, given the existence of externalities, an area where highly educated people predominate would imply in a reduction of educational costs for people with high or low educational levels. The externality is modeled as a reduction in the cost of achieving education: so that the “good neighbors” impacts would be the reduction in the private cost of obtaining education. The author shows that spatial segregation can be a result generated by the decentralized market mechanism and is not socially efficient. This result is obtained due to the fact that the agents that opt for the higher educational level, just consider the benefits of moving for a more qualified area, disregarding the costs they cause to society, that is, the elevation of the educational cost of the residents' of the less favored areas.
Several works extended this original model, like Benabou (1996), which showed that, in a dynamic model, it could be optimum to minimize the cost of accumulating human capital in the short term. However, in the long run the spatial segregation would be inefficient. Other authors introduced the hypothesis of financing the local public goods directly, and showed that the result of Benabou (1993) is just a specific case of the so-called “impact on the fiscal side”. The most important point of this line of research is that spatial segregation is inefficient even if we consider agents with the same initial endowments and without credit restrictions. Introducing distortions such

14 texto para discussão | 948 | abr. 2003 ipea
as credit market imperfections and unequal distribution of wealth, it seems clear that spatial segregation will be even more inefficient. It’s important to point out that these models just consider the aspect of economic efficiency, and that the agents' decentralized action generates a socially inefficient outcome. So, there is clearly a justification, from a theoretical point of view, for the Government to intervene in market results, in order to reduce spatial segregation, without using any argument in favor of justice and fairness.
Among the vast literature on spatial concentration of the metropolitan poverty in the USA, we can highlight Madden (1996). The author points out that the metropolitan poverty in the USA grew during the eighties, concentrating on the central areas of the great metropolises. In other words, there is a clear tendency in the spatial concentration of the poverty in the USA. The author raises some hypotheses and explanations for this concentration of the poverty in the USA: a) job market, with a growing differential among qualified and non-qualified workers; b) low economic growth in the USA during the eighties; c) spatial mismatch of employment; d) spatial segregation of wealth, with the wealthiest families choosing voluntarily to live in luxurious suburbs6 and e) demographic factors such as higher levels of single mothers, and women-headed households, among others. She tests this hypothesis to analyze poverty growth in the USA and its concentration in MAs and concludes that economic growth reduces poverty, whereas it doesn't reduce its spatial concentration. The metropolises with the largest rates of spatial concentration of the poor are those that possess a high spatial segregation of poverty. The creation of employment close to degraded areas or ghettos didn't have a significant impact in the reduction of the spatial concentration of the poor. The higher the rate of blacks and people below 65 years old the higher the spatial concentration of poverty. Finally, if the MA presents a job market with an unequal salary distribution it will have high poverty rates, but poverty will be less spatially concentrated in relative terms.
Jargowsky and Bane (1991) analyzed the socioeconomic characteristics of the households in US ghettos during the seventies and the eighties. Defining a poor area as the one where 40,0% or more of the residents are poor, they showed that 85,0% of the households living in ghettos are black or have Hispanic origin and 65,0% are comprised of single parents with children. In 1980, 68,7% of the American poor (18,8 million) lived in metropolitan areas, showing that poverty in the USA is clearly an urban phenomenon.
One of the main challenges in Urban Economics is the study of the locational decisions of the households, i.e., to explain the choice of the households regarding the residence and work places. This literature raises the question of the waste of time in commuting to work. It was observed that American households with higher purchasing power spent more time commuting to work, what seems to be irrational, once these families possess a larger opportunity cost. This discussion generated an intense research, in the sense of trying to explain such irrationality in household’s behavior. One of the possible explanations is that households with higher levels of formal education look for more specific type of employment that would probably be
6. Notice that this hypothesis agrees with Benabou (1993) results. Nevertheless, the reasons raised by Madden (1996) are a desire of the medium classes to live in more luxurious places.

ipea texto para discussão | 948 | abr. 2003 15
located away from their residence. Once residence changes have significant transaction and financial costs, the agents would choose to incur in higher commuting costs.
On the other hand, following the theoretical tradition of job search, it is suggested that higher income households have larger conditions of waiting for higher wage jobs, which would not be located necessarily close to their homes. Furthermore, there would be decreasing returns in job search away from places of residence, so that the families living in substandard areas would have to seek employment in areas close to their home.7 Crampton (1999) brings an excellent review of the literature relating job and housing markets.
Ley and Smith (2000) studied the relationships between immigration and urban deprivation in the Canadian cities of Toronto, Montreal and Vancouver using census data from 1971 and 1991. The authors found a positive, but modest, correlation between 5 indicators of deprivation (low educational levels, female-headed households, male unemployment, welfare dependency and low-income families) and immigrant characteristics, emphasizing the complex nature of such interactions and the heterogeneity among immigrants.
Cutler and Glaeser (1995) examined the effect of spatial segregation on African-Americans outcomes in schooling, employment and single parenthood and found that black people living in segregated areas are significantly worse off, particularly if they live in central cities. Cutler, Glaeser and Vigdor (1997) examined segregation in American cities from 1890 to 1990 and found a positive relation between urban population, urban densities and spatial segregation. The authors observed that segregation has varied over time, with segregation in the mid-20th Century caused by the collective action of whites, like creating legal barriers to enforce spatial segregation, while in the nineties whites are willing to pay more to live in predominantly white areas. Glaeser, Kahn and Rapport (2000), claim that the concentration of non-white population in central cities in the USA is caused by better access to public transportation systems and social benefits in these areas.
Logit and Probit Models Applied to Poverty, Labor and Housing Markets
The application of decomposition analysis associated with logistic regression techniques to labor market studies were first developed by Blinder (1973, 1976) and, since then, these tools have been applied in several housing markets studies to analyze the impacts of gender, race, schooling and other factors in households tenure conditions. Yates (2000) uses 1986 and 1996 censuses microdata and logistic regressions to explain the interactions among demographic, socioeconomic and labor market factors to study tenure choice in Australia. She stresses that increased female participation in the workforce, delay of marriage and child-bearing and the economic uncertainty associated with growing flexibility and spatial mobility in the labor markets decreases the willingness and the affordability of the households to make long-term economic commitments and, hence, make home ownership less attractive vis-à-vis renting. 7. There’s also the hypothesis of spatial mismatching of employment, what would imply in higher commuting time.
16 texto para discussão | 948 | abr. 2003 ipea
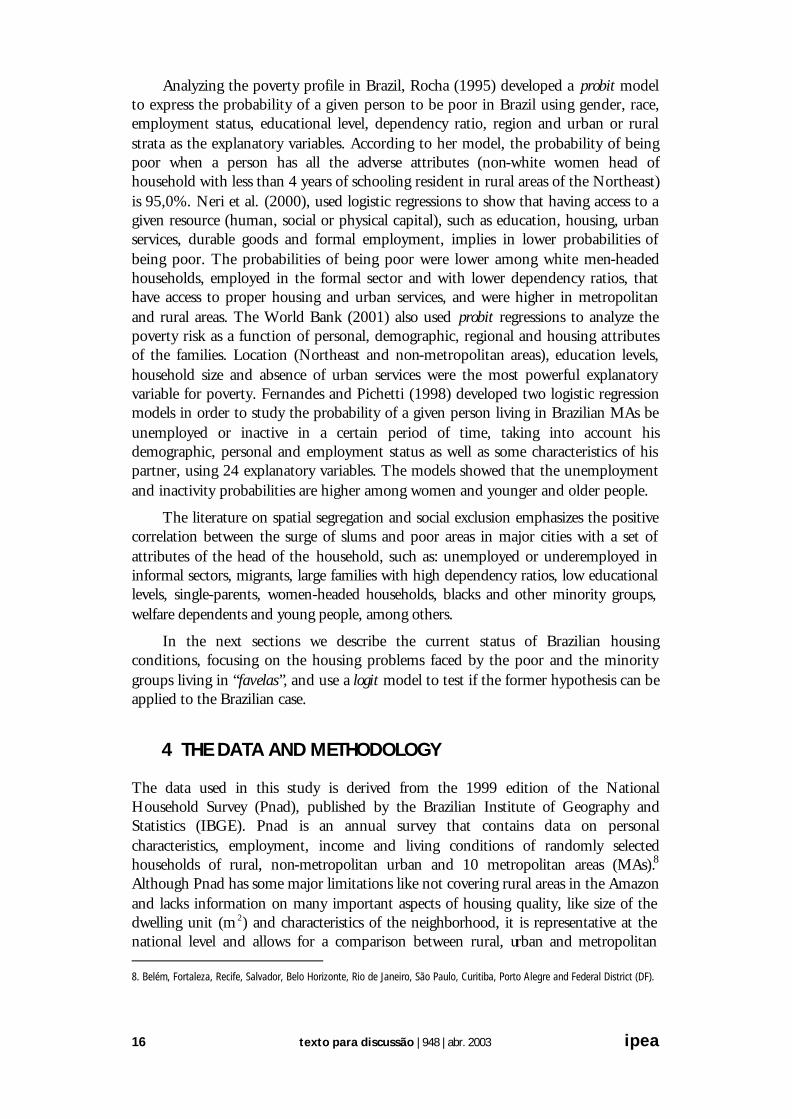
Analyzing the poverty profile in Brazil, Rocha (1995) developed a probit model to express the probability of a given person to be poor in Brazil using gender, race, employment status, educational level, dependency ratio, region and urban or rural strata as the explanatory variables. According to her model, the probability of being poor when a person has all the adverse attributes (non-white women head of household with less than 4 years of schooling resident in rural areas of the Northeast) is 95,0%. Neri et al. (2000), used logistic regressions to show that having access to a given resource (human, social or physical capital), such as education, housing, urban services, durable goods and formal employment, implies in lower probabilities of being poor. The probabilities of being poor were lower among white men-headed households, employed in the formal sector and with lower dependency ratios, that have access to proper housing and urban services, and were higher in metropolitan and rural areas. The World Bank (2001) also used probit regressions to analyze the poverty risk as a function of personal, demographic, regional and housing attributes of the families. Location (Northeast and non-metropolitan areas), education levels, household size and absence of urban services were the most powerful explanatory variable for poverty. Fernandes and Pichetti (1998) developed two logistic regression models in order to study the probability of a given person living in Brazilian MAs be unemployed or inactive in a certain period of time, taking into account his demographic, personal and employment status as well as some characteristics of his partner, using 24 explanatory variables. The models showed that the unemployment and inactivity probabilities are higher among women and younger and older people.
The literature on spatial segregation and social exclusion emphasizes the positive correlation between the surge of slums and poor areas in major cities with a set of attributes of the head of the household, such as: unemployed or underemployed in informal sectors, migrants, large families with high dependency ratios, low educational levels, single-parents, women-headed households, blacks and other minority groups, welfare dependents and young people, among others.
In the next sections we describe the current status of Brazilian housing conditions, focusing on the housing problems faced by the poor and the minority groups living in “favelas”, and use a logit model to test if the former hypothesis can be applied to the Brazilian case.
4 THE DATA AND METHODOLOGY
The data used in this study is derived from the 1999 edition of the National Household Survey (Pnad), published by the Brazilian Institute of Geography and Statistics (IBGE). Pnad is an annual survey that contains data on personal characteristics, employment, income and living conditions of randomly selected households of rural, non-metropolitan urban and 10 metropolitan areas (MAs).8 Although Pnad has some major limitations like not covering rural areas in the Amazon and lacks information on many important aspects of housing quality, like size of the dwelling unit (m 2) and characteristics of the neighborhood, it is representative at the national level and allows for a comparison between rural, urban and metropolitan 8. Belém, Fortaleza, Recife, Salvador, Belo Horizonte, Rio de Janeiro, São Paulo, Curitiba, Porto Alegre and Federal District (DF).

ipea texto para discussão | 948 | abr. 2003 17
housing markets, so that we can draw important conclusions for the formulation of urban development and poverty alleviation policies for the entire country.
Following other empirical studies and the IBGE definition of substandard sectors, we have used the dwelling units located in substandard housing sectors as a proxy to slum areas. The 1991 IBGE Census definition of substandard areas allows us to do so, as they classify substandard residential areas as: “a group of dwelling units (huts, houses, etc.), occupying or having occupied, until recently, lands belonging to other people (either public or private lands), generally disposed in a scattered and dense way and lacking essential public infrastructure services.” According to IBGE, which characterizes a substandard area is the disordered occupation and the fact that at the time of the settlement implantation there were no existing formal land and/or property title. A substandard area is also designated by IBGE as an informal settlement. Examples of substandard areas are the favelas, mocambos and alagados. In this sense, the informality of substandard areas is related not only to the absence of well-defined property rights over land and housing, but also to the non-conformity with the existing constructive patterns, building codes, zoning regulations and urban legislation.
Preteceille and Valladares (2000) also showed a huge correlation between substandard areas and slums, using data for the municipality of Rio de Janeiro, captured from the 1991 IBGE Demographic Census, disaggregated at the censitary sector level. However, housing informality in Brazil does not relate solely to slum areas. Informal housing may be observed from many points of view. Informal housing in Brazil has several dimensions: compliance with legal rules (formal versus informal property rights) and urban and land use regulation (compliance with building codes and urban legislation), living conditions within the house such as density, quality of the structure (adequacy criteria), etc. In strictly legal terms, informality refers to squatters, i.e., those people that own the house but not the land where the house is located. Slum areas refer to those housing units that do not comply with building codes and urban legislation, i.e., that have inferior physical characteristics of housing, quality, public space, minimum plots and higher densities compared to other areas.
Even though lack of formal property rights over the land is an indicator used by IBGE to describe substandard areas, there’s not a clear correlation between substandard areas and land invasions, with the number of dwelling units in substandard areas being smaller than the number of squatter’s housing, existing squatters in housing sectors inhabited by medium and high-income population. These facts can be accounted to the long existence of slums, as well as to several governmental programs of slum upgrading and land tenure regularization implemented in the past decades. They may also be attributed to a bias in the database, once the respondent has no motivation to report himself as an informal owner, for fear of being evicted. Furthermore, Pnad does not ask if the respondent who claimed to be the owner of the house has property or land title with formal recognition, but if he owns both the land and the construction or just the house. The substandard housing comprises 3,9% of the entire private housing stock, while squatters represented 5,7% of the housing units, with 606.724 dwelling units located outside substandard areas.

18 texto para discussão | 948 | abr. 2003 ipea
We can also observe that there is not a clear relation between poor households and slum-dwellers, despite the fact that slums have always been regarded as the visible face of an urban poverty ghetto underlying the Brazilian cities. Household income indicators based upon 1998 and 1999 Pnad microdata, show that slum-dwellers have lower average income than people residing elsewhere in the cities, with the household income distribution for slum-dwellers falling under the household distribution for the entire country, which suggests that slum residents are poorer than the rest of Brazilian population. Is this sense, the Brazilian favelas may be regarded as a locus of spatial segregation and social exclusion of the poor population. However, despite having lower average incomes, not all the people living in slums are poor, and many have moderate incomes, as suggested by Preteceille and Valladares (2000), who observed the existence of an internal socioeconomic differentiation among slum-dwellers in Rio.
The terms ghetto, and “slums” as used here, refer to an area within a city characterized by poverty and acute social problems, inhabited by members of a racial, ethnic or socio-economic group under conditions of involuntary segregation. The expressions “slums” and ghettos show that urban social and housing problems tend to be geographically concentrated, with the incidence of poverty being much higher and the level of access to basic services being smaller in slums than in other parts of the city, resulting in social exclusion and spatial segregation of slum-dwellers. The term “substandard housing” can be applied to degraded dwelling units that lack proper sanitation services like water, sewerage and garbage collection, have no private toilet, are overcrowded or present strong construction code and urban regulations violations.
Jargowsky and Bane (1991) affirm that the international literature presents 3 different lines for defining ghetto or substandard areas: 1. Measuring the probability of a poor black person having a poor neighbor; 2. Neighborhoods with more than 30,0% of poor people can be considered a ghetto; 3. A ghetto can be defined as an area that possesses several indicators such as the rate of participation of male in the labor force, percentage of adolescents with High School Diploma and percentage of single parents households below a standard deviation of the national average. However, those 2 authors argue that the results do not differ very much and, for simplicity, they defined a ghetto as a neighborhood where 40,0% or more of the residents are poor.
One of the major housing problems in Brazil is the concentration of substandard housing in slums located in the country’s major cities, inhabited by poor people and other minorities, that are trapped in inadequate housing because there’s no proper housing within their ability to pay. What constitutes “adequate housing” is a very subjective definition and there’s almost no agreement on how to measure what are proper housing and urban infrastructure services, once these definitions can change over time and place, due to increased standards of living and to cultural differences. For the United Nations Human Settlements Program − UN/Habitat, adequate housing should include, at least, piped water, proper sewerage and garbage collection, durable walls and roof, private bathroom, secure of tenure, as well as living in a neighborhood with suitable environmental quality and

ipea texto para discussão | 948 | abr. 2003 19
accessible location with regard to work and school, health and recreation facilities, available at an affordable cost.9
According to the 1999 Pnad there were 1.399.185 substandard dwelling units in Brazilian slums, 80,2% located in MAs and 19,8% in other urban areas, which suggests that slums in Brazil are clearly a metropolitan phenomenon, just like in the USA. In absolute terms, slums are concentrated in the Southeastern (59,3%) and in the Northeastern regions (24,3%) and in the states of São Paulo, Rio de Janeiro and Recife, accounting for more than 66,5% of the country’s total dwellings located in slum areas. The MAs of Recife and Belém present the highest rates of substandard housing in relative terms, while in absolute terms slums are concentrated in the MAs of Rio (23,9%), São Paulo (19,1%) and Recife (15,5%), whose contribution to poverty and slum-dwellers far exceeds their participation in the total housing units (see table 2).
Slum-dwellers are characterized as being younger and having higher densities per household, higher proportions of non-white occupancy, more women-headed households and smaller proportion of formal homeownership than other areas. Slums also have lower access to urban infrastructure services such as piped water, proper sewerage systems and phone connections, as compared to other formal areas. Income levels in substandard areas are 41,0% lower than the national average for urban areas. Low educational level, measured by years of schooling is another factor that characterizes the typical head of a household located in substandard areas, with slums falling behind other neighborhoods with a mean of 4,6 years of schooling for slum-dwellers against 5,5 years for the total Brazilian population (see table 4). The largest frequency occurs among those household’s head that are illiterate or have attended school for less than 4 years (functional illiteracy). The data shows that the residential patterns in Brazilian cities are segregated by race as it happens in the USA, as almost 58,0% of the total households in substandard areas are headed by a non-white, while this ratio is only 41,0% for all urban areas. This spatial segregation pattern can be explained by the lower income and education levels of the non-white population.
We are not able to assert that the typical slum-dweller is unemployed or doesn't earn monetary income, although those attributes are positively correlated with the individual's probability of living in a slum. Among the heads of the households living in substandard areas, 73,0% were employed and 99,9% received monetary salaries. Taking these aspects into account, one should investigate the quality of the employment available to people living in slums and the nature of the discrimination they suffer in the labor market, because, in average, slum-dwellers have higher unemployment ratios and are more engaged in low-skilled activities than the rest of the urban population. The quality of the employment and the salaries open to slum-dwellers are probably inferior because they have lower formal education and are typically engaged in services, commerce and civil construction activities. Not withstanding the importance of the favelados disadvantaged insertion in the labor market to explain their spatial segregation in slums, a more profound investigation into the nature and quality of their employment is beyond the scope of the present paper and should be the object of further analysis in the future. 9. See the Habitat Agenda, paragraph 60, for the UN/Habitat (1996) definition on adequate housing.

20 texto para discussão | 948 | abr. 2003 ipea
5 THE LOGIT MODEL
In order to study the determinants of spatial segregation in Brazil we have used a logit regression, where the dependent variable of the model is a dichotomous qualitative 0-1 dummy, equal to 1 when the house is located in a substandard area, and 0 in other cases. Some of the explanatory variables are quantitative and some are dummies and refer to the personal attributes of the household’s head, insertion in the labor market and locational variables, among others.
The logit model can be used to predict the likelihood that a person with a given set of attributes will live in a slum area. This model is based on a cumulative logistic function and can be specified as follow:
( ) ( ) ( )yiXiZi eeiXiFZiFPi
ββ
−− +=
+===
11
11
After some algebraic manipulations the logit can be rewritten as:
uiiXiPi
Pi+=
−β
1ln
Where
e is the base of the natural logarithms
Pi is the probability that a person will live in a slum, given his individual characteristics, i.e., Pi = prob (y =1/Xi)
(1-Pi) is the probability of living elsewhere in the city
− PiPi
1 are the odds ratio in favor of living in a substandard area
βi are the parameters
Xi represents the explanatory variables, i.e., the set of the individual attributes
Yi = 1, if the person lives in a slum
Yi = 0, otherwise
ui are the disturbances
The predicted value of the dependent variable can be interpreted as the probability of living in a slum area, given the values of the explanatory variables. The higher the logit, the higher the odds ratio and, therefore, the higher the probabilities of living in a slum area. The probabilities of living in slums can be derived indirectly from the logit model. The estimated coefficient βi of the logit doesn’t show directly the change in the probability of living in a slum (y=1) due to a unit change in independent variable, but they show the change in the odds ratio per unit change in the explanatory variables, ceteris paribus.
Our basics units of analysis in this study are individual observations derived from the 1999 Pnad/IBGE micro data. We have used a Maximum Likelihood (ML) estimation procedure to estimate the logit model, which yields consistent parameter estimators. To explain the existence of slums we have considered the following

ipea texto para discussão | 948 | abr. 2003 21
variables: personal attributes of the household’s head (age, race, sex, migration), educational level (years of schooling), income level, household size, employment status (unemployed, underemployment in informal activities and type of activity), property rights (formal owner versus other tenure conditions), inner city or peripheral location (measured by commuting time to work) and characteristics of the local housing markets (metropolitan and non-metropolitan urban and MA where the property is located). A gender dummy was included, to test the hypothesis whether or not women suffer from gender discrimination and women-headed households are more vulnerable from a socioeconomic point of view. After having weighted the observations, eliminated all the missings for the explanatory variables, we have obtained a total sample of 32.624.715 observations.
The estimation results, the standard errors, the odds ratio and the probabilities are displayed in table 3, in appendix, while table 4 shows the descriptive statistics of the variables used in the logit model.
6 MAIN RESULTS
According to the model, all the parameter estimates were significant at a 95,0% confidence level and presented the expected signs, except for informal insertion in the labor market. The main characteristic associated with slums is living in metropolitan areas. All the MAs dummies are statistically significant and influence positively the probability of becoming a slum-dweller, with the exception of the Federal District, that has a negative impact on this probability. The associated probabilities of the variables that identify the MAs are higher than 70,0%, except for Salvador, Curitiba and Porto Alegre. The model shows that slums are a typical metropolitan phenomenon, the single explanatory variable that mostly contributes to the existence of slums, given the individual characteristics. The process of slum formation occurs in a more intense way in the MAs of Recife and Belém, where a person with the sample average characteristics has the highest probabilities of becoming a slum-dweller. Aspects such as income, education, age, household size, race and labor market insertion also affect the individual's probability of becoming a slum-dweller, although not as intensely as living in a large urban center, especially in a metropolitan area. As we were expecting, the coefficients of the variables income, age and education appear with a negative sign, which means that a positive variation in those variables reduce the individual's probability of living in slums.
The coefficient associated with the household per capita income presented a negative sign, showing that the income-poor have higher probabilities of living in slums. Conversely, large household sizes imply high dependency ratios and affect the probability of becoming a slum-dweller in a positive manner. Non-whites and women-headed households, the unemployed, migrants, employed in activities such as building, commerce and services sectors and people working in self-construction have higher probabilities of living in a substandard area. Those results point out to the existence of race and gender discrimination, with the social exclusion of racial and other minorities (non-white, women, poor) and their segregation in slums and poverty ghettos of Brazilian cities.

22 texto para discussão | 948 | abr. 2003 ipea
Local markets characteristics have a great importance in explaining slum formation. The great majority of the explanatory variables of the model present probabilities larger than 0,5, what means that the individuals with the average characteristics of the sample present great chances of living in slums. The probabilities associated with the metropolitan areas show that slums in Brazil are a typical urban phenomenon. This outcome might be an indicator of pressure over urban land, as well as high housing deficit relative to total housing stock.
The ranking of the MAs obtained from the model, considering the probability of one person becoming a slum-dweller, makes sense, once Pará state presents the second highest average cost per square meter. Belém also boasts the highest housing deficit to total stock ratio (22,0%), as well as one of the largest population average annual growth rate (2,2%) and the highest population growth rate within the peripheral areas (6,4%). One possible explanation for this phenomenon could be the fact that Belém is almost totally comprised of marine areas, a protected area with special land use regulations, which might be causing land scarcity in the core municipality and causing the city to grow toward the periphery at vertiginous rates. People living in the Northern and Northeastern regions present a larger odds ratio of becoming a slum-dweller. Recife and Belém are the MAs where a person presents the greatest chances of living in slums. In the Northeast, the rural exodus can be an explanation for such results. A possible cause of the existence of slums in the Northeast could be the reduced dynamics of the economy of the states in this region (Galvão and Vasconcelos, 1999). In the North, these results can be associated to the failure of the Federal Colonization and development programs implemented in the seventies, with the distribution of land plots in the Amazon Frontier to the settlement of poor immigrants from the Northeasthern and the Southern regions. The population in the Amazon is now predominantly urban (69,7%), due to migrations of the rural populations into the local cities, without the expected provision of proper housing and urban infrastructure. Obviously, the phenomenon of the slums in the Northeast and in the North can be attributed to the high poverty ratios in these areas.
Another interesting result of this model is that the coefficient of the variable DF is negative, indicating an inverse relationship between living in Brasília and becoming a slum-dweller. A DF resident’s chance to live in a slum, given the other characteristics, is smaller than in any other metropolitan area. This phenomenon may be explained by the fact that Brasília, capital of DF, is subject to quite restrictive land use, building codes and urban regulations and undergoes more severe supervision than other places in Brazil. A quite important aspect in Brasília refers to the high land price and real estate speculation and the fact that many urban idle spaces belong to the local government, to the University of Brasília (UnB) or are environmentally protected areas, which generates an artificial pressure over land, resulting in the eviction of low-income people from the central city to the peripheral areas in DF (Cidades Satélite) and Goiás (Entorno), implying in smaller chances of living in substandard areas. The smaller probabilities of slum formation in DF can also be explained by: 1) the role of local Government in the eradication of spontaneous slums and the settlement of the low-income population in new satellite cities located at the periphery, with a minimum level of urban

ipea texto para discussão | 948 | abr. 2003 23
infrastructure; 2) the higher salaries and the more stable income streams faced by DF residents, once the main employers in Brasília are the Federal and Local Government, that are responsible for 34,3% of the total employment (Codeplan, 1997) and 3) for most of the employees of the public sector in DF, the Government, besides paying higher wages, used to provide lodging in state-owned housing (apartamentos funcionais), which was a common practice before the nineties. This fact renders people employed in the public sector with a quite substantial non-pecuniary subsidy, thus reducing their probabilities of living in substandard housing.
The higher unemployment rates and the lower quality of employment of slum-dwellers (usually associated to services, building and trade sectors), their lower schooling, higher household size, lower age and lower salaries comparing to the rest of the country’s population explain the positive sign of the coefficients of the variables household size, building construction, trade and services and the negative sign of the household income, education and age. Formal employment is directly correlated to the chances of living in slums. This unexpected result can be explained by the fact that even though slum-dwellers possess higher rate of formal employment, the quality of their jobs and their salaries are very low, due to the nature of their employment in non-qualified job positions.
Another interesting result of this study is that the provision of formal property rights over the housing unit and land implies in lower probabilities of living in slums, while working in self-construction is positively correlated to being a slum-dweller. These results demonstrate, to a certain level, that the low-income population had access to housing through self-construction in informal settlements.
The social exclusion of racial, ethnic and income minorities and race and gender discrimination becomes evident, once poor, non-white and women-headed households present larger probabilities of living in substandard areas. Contrary to what happens in commerce, services and building sectors, being an employee in the Public Sector reduces the chances of becoming a slum-dweller. This can be explained because Brazilian government, besides paying higher wages than the national average to workers of low educational levels, offers more stability and better social security systems than any other employment sector in the country, which guarantees larger permanent income for public servants and reduces their probability of living in substandard areas. The governmental salaries are even higher in Center-West Region, thanks to salaries in DF, where the High Federal Governmental bureaucracy lives (see tables 6 and 7, in appendix).
The model also shows that, besides being a typical big city phenomenon, especially frequent in metropolitan areas, slums are more closely associated with central cities than with peripheral areas, as longer commuting times imply is lower probabilities of residing in substandard areas. Given the nature of the employment in services, trade and building sectors, that is more concentrated in the core cities of the metropolitan areas (see table 5), one can agree with the results of Vaz (1998), among other authors, who stated that slums appeared as a consequence of a desire of the low-income population to live near their work places.

24 texto para discussão | 948 | abr. 2003 ipea
The results of this study can help policy-makers to design housing, sanitation, employment and education policies and programs that match the needs of the urban poor and reduce social exclusion and spatial segregation of minorities within Brazilian slums. These results are even more important once better targeting of the social spending is a necessary condition, considering that Brazil is going through a fiscal crisis in the context of macro adjustment policies and many local and state governments show incipient debt capacity to be elegible for federal funds.
7 CONCLUSIONS
This paper intended to explore the socioeconomic determinants of slum formation in Brazilian cities and main MAs, as a means to subsidize public policies in urban development. The results point out that slums are closely related to city size, especially metropolitan areas, income, education, age, race and gender of the household head. The great probabilities of living in slums falls over non-white, income-poor, single parents, women with children, larger households with high dependency ratio, young people, less educated, migrants, unemployed and people working in self-construction and living in central cities.
Another interesting result is the fact that residents in the MAs of Recife and Belém, with the average characteristics of the sample, presented the highest probabilities of becoming a slum-dweller. These results show the importance of local markets characteristics to determine the emergence of pockets of poverty and informal housing and increase spatial segregation and social exclusion in the Brazilian cities, which show the need for further research at the local level.
Despite its preliminary nature, this paper attempts to be an innovation in relation to the studies that have been produced in Brazil, by trying to assess the socioeconomic determinants of slum formation from an economic point of view. The study shows that poor housing quality and spatial segregation in slums mainly affect the poor, non-whites and other minorities and show the need for urban development and housing policies more integrated and better targeted to these vulnerable groups of society. It also demonstrates the existence of a fertile research agenda in Brazil in housing and urban economics, which are fields that are still practically unexplored.
By shedding some light on the causes and the nature of social discrimination and spatial segregation faced by Brazilian slum-dwellers, this study might aid policy makers in Brazil and other developing countries to design more efficient urban and regional development policies, in order to fight urban poverty and reduce social discrimination in the Developing World.
The focus of urban development policies should be to address the problems of poverty, informality and social exclusion in the cities, through the devisal of public policies that foster better living conditions and improved integration of minority groups in formal housing and job markets. This raises issues such as race and gender discrimination, urban violence in slums and metropolitan areas and the efficiency and efficacy of governmental antipoverty programs and policies. Urban poverty alleviation policies must include the improvement of the access of the low-income population to proper housing, sanitation, public transportation systems, as well as to
ipea texto para discussão | 948 | abr. 2003 25
better education and employment status. Those issues, in turn, raise other important questions, such as how to match economic growth with the reduction of income inequality and the improvement of living conditions and the employment status of the urban poor, women and non-white population and reduce spatial segregation and social exclusion in the Brazilian major cities. More integrated and better-targeted actions in the fields of employment, education, welfare, credit and housing policies and joint efforts of all levels of government, the private sector and local communities can increase the supply of low-cost proper housing for the urban poor, improving the quality of life in the so-called favelas, stimulating slum-dwellers integration with other city neighborhoods, thus decreasing the spatial segregation and social exclusion.
The Federal Government should act out to correct housing market failures and to improve the income-poor and other minorities’ living standards by increasing subsidies for the poor and other groups at risk, with better targeting of the government programs, with stronger involvement of the private sector and the society in these subsidized housing schemes, as well as by expanding the public social housing programs. Reviewing of the zoning, housing, building codes and development standards, improving public transportation systems so as to increase the accessibility of the poor to employment and other services and promoting slum-upgrading and microcredit programs may help to improve the supply of housing for the poor, generate income and employment opportunities and reduce poverty, spatial segregation and social exclusion of minorities, as well as improve the quality of life within the Brazilian cities.
The improvement of the mechanisms of social control over public investments, in order to match macroeconomic policies with social objectives and the promotion of more integrated and better targeted urban and regional development policies are the main challenges now faced by the 3 levels of Government (Federal, State and Local), in order to reach the goal of improving housing and living conditions of the country’s population and to reduce urban poverty and spatial segregation in Brazil.

26 texto para discussão | 948 | abr. 2003 ipea
BIBLIOGRAPHIC REFERENCES
BARROS, R. P.; MENDONÇA, R. S. P. Os determinantes da desigualdade no Brasil. Rio de Janeiro: Ipea, 1995. (Texto para Discussão, 377).
BENABOU, R. Workings of the city: location, education, production. Quarterly Journal of Economics, v. 108, 1993, p. 619-653.
______. Heterogeneity, stratification and growth: macroeconomic implications of community structure and school finance. American Economic Review, v. 86, p. 584-609, 1996.
BLINDER, A. Wage discrimination: reduced forms and structure estimates. Journal of Human Resources, n. 8, 1973, p. 438-455.
______. On dogmatism in human capital theory. Journal of Human Resources, v. 11, n. 1, 1976, p. 8-22.
CASÉ, P. Favela: uma exegese a partir da Mangueira. Rio de Janeiro: Relume-Dumará: Prefeitura, 1996.
COMPANHIA DO DESENVOLVIMENTO DO PLANALTO CENTRAL- Codeplan. Perfil sócio-econômico das famílias do Distrito Federal (Pisef). Brasília: Codeplan, 1997.
CRAMPTON, G. R. Urban labour markets. In: CHESHIRE, P.; MILLS, E. S., (eds.). Handbook of applied urban economics, v. 3, Chapter 39, 1999.
CRANE, J. Effects of neighborhoods on dropping out and teenage childbearing. In: JENCKS, C.; PETERSON, P. The urban under class. Brookings institution, p. 299-320, 1991.
CUTLER, D. M.; GLAESER, E. L. Are ghettos good or bad? Cambridge, MA: NBER, 1995 (NBER Working Paper Series, 5163).
CUTLER, D. M.; GLAESER, E. L.; VIGDOR, J. L. The rise and decline of American ghetto. Cambridge, MA: NBER, 1997 (NBER Working Papers Series, 5881).
FERNANDES, R.; PICHETTI, P. Uma análise da estrutura do desemprego e da inatividade no Brasil metropolitano. 1998, mimeo.
GALVÃO, A. C. F.; VASCONCELOS, R. R. V. Política regional à escala sub-regional: uma tipologia territorial como base para um fundo de apoio ao desenvolvimento regional Brasília: Ipea, 1999 (Texto para Discussão, 665).
GLAESER, E. L.; KAHN, M. E.; RAPPORT, J. Why do Poor Live in Cities? Cambridge, MA: NBER, 2000 (NBER Working Paper Series, 7636).
GRAZIA, G. de; QUEIROZ, L. L. R. F.. A sustentabilidade do modelo urbano brasileiro: um desafio. Rio de Janeiro: Fase/Ibase, 2001 (Série Cadernos Temáticos, 5).
INSTITUTO BRASILEIRO DE GEOGRAFIA E ESTATÍSTICA. Pesquisa Nacional por Amostra de Domicílios (Pnad). Rio de Janeiro: IBGE, 1999.
______. Anuário Estatístico do Brasil. Rio de Janeiro: IBGE, 1998.
______. Sinopse Preliminar do Censo Demográfico 2000. Rio de Janeiro: IBGE, 2001.
INSTITUTO DE PESQUISA ECONÔMICA APLICADA (Ipea/Disoc). Boletim de Políticas Sociais: acompanhamento e análise, n. 2. Brasília: Ipea, 2001.

ipea texto para discussão | 948 | abr. 2003 27
JARGOWSKY, P.; BANE, M. J. Ghetto Poverty in US, 1970-1980. In: JENCKS, C.; PETERSON, P. The Urban Under Class. Brookings Institution, p. 235-273, 1991.
LEY, D.; SMITH, H. Relations between deprivation and immigrant groups in large Canadian cities. Urban Studies, v. 37, n. 1, p. 37-62, 2000.
LOPES, J. R. B. Brasil: um estudo sócio-econômico da pobreza e da indigência urbanas. Núcleo de estudos de políticas públicas, n. 25. Campinas: Unicamp, 1989 (Caderno de Pesquisa).
MADDEN, J. F. Changes in the distribution of poverty across and within the US metropolitan areas, 1979-1989. Urban Studies, v. 33, n. 9, p. 1581-1600, 1996.
MARRY, A.; KATZ. L. The company you keep: the effects of family and neighborhood on disadvantaged youths. Cambridge: NBER, maio de 1991 (NBER, Working Paper Series, 3705).
MINISTÉRIO DO TRABALHO E DO EMPREGO-MTE. Relação Anual de Informações Sociais (Rais). Brasília: MTE, 1999.
MORAIS, M. P.; LIMA, R. A. Breves considerações sobre a natureza da pobreza brasileira: technical note. Brasília: Ipea, 2001, mimeo.
NERI, M. C. ; AMADEO, E. J.; CARVALHO, A. P.; NASCIMENTO, M. C. .. Assets, markets and poverty in Brazil. Rio de Janeiro: FGV/EPGE, 2000. (Ensaios Econômicos da EPGE, 374).
PIKETTY, T. Theories of persistent inequality and intergenerational mobility. In: ATKINSON, A.; BOURGUIGNON, F. (eds.). Handbook of income distribution. Elsevier science, 2000.
PRETECEILLE, E.; VALLADARES, L. A desigualdade entre os pobres − favela, favelas.. In: HENRIQUES, R. (org.). Desigualdade e pobreza no Brasil. Rio de Janeiro: Ipea, 2000.
RAMOS, L. Poverty in Brazil in the 80’s. Rio de Janeiro: Ipea, 1994 (Texto para Discussão, 361).
ROCHA, S. Governabilidade e pobreza: o desafio dos números. In: VALLADARES, L.; COELHO, M. P. (orgs.). Governabilidade e pobreza no Brasil. Rio de Janeiro: Civilização Brasileira, 1995.
_______. Poverty studies in Brazil: a review. Rio de Janeiro: Ipea, 1996 (Texto para Discussão, 398).
_______. Pobreza e desigualdade no Brasil: o esgotamento dos efeitos distributivos do Plano Real. Rio de Janeiro: Ipea, 2000 (Texto para Discussão, 721).
SAMPAIO, M. R. A. Vida na favela. In: SAMPAIO, M. R. A. (coord.). Habitação e cidade. São Paulo: FAU-USP/ Fapesp, 1998.
SOARES, S. S. D. O perfil da discriminação no mercado de trabalho: homens negros, mulheres brancas e mulheres negras. Brasília: Ipea, 2000 (Texto para Discussão, 769).
TASCHNER, S. P. São Paulo: moradia da pobreza e o redesenho da cidade. In: SAMPAIO, M. R. A. (coord.). Habitação e cidade. São Paulo: FAU-USP/ Fapesp, 1998.
THE WORLD BANK. Attacking Brazil Poverty: a poverty report with a focus on urban poverty reduction policies, v. 1 - 2. Washington: The World Bank Brazil Country Management Unit, 2001.

28 texto para discussão | 948 | abr. 2003 ipea
UNITED NATIONS HUMAN SETTLEMENTS PROGRAM-UN/HABITAT. The Habitat Agenda. Habitat II, Istambul, 1996.
VAZ. L. F. Do cortiço à favela: um lado obscuro da modernização da cidade do Rio de Janeiro. In: SAMPAIO, M. R. A. (coord.). Habitação e cidade. São Paulo: FAU-USP/ Fapesp, 1998.
WILSON, W. J. The truly disadvantaged: the inner city, the underclass and public policy. Chicaco: University of Chicago Press, p. 254, 1987.
YATES, J. Housing Implications of social, spatial and structural change. In: International Conference Held in Gävle. Sweden: ENHR, 2000.
ipea texto para discussão | 948 | abr. 2003 29
APPENDIX
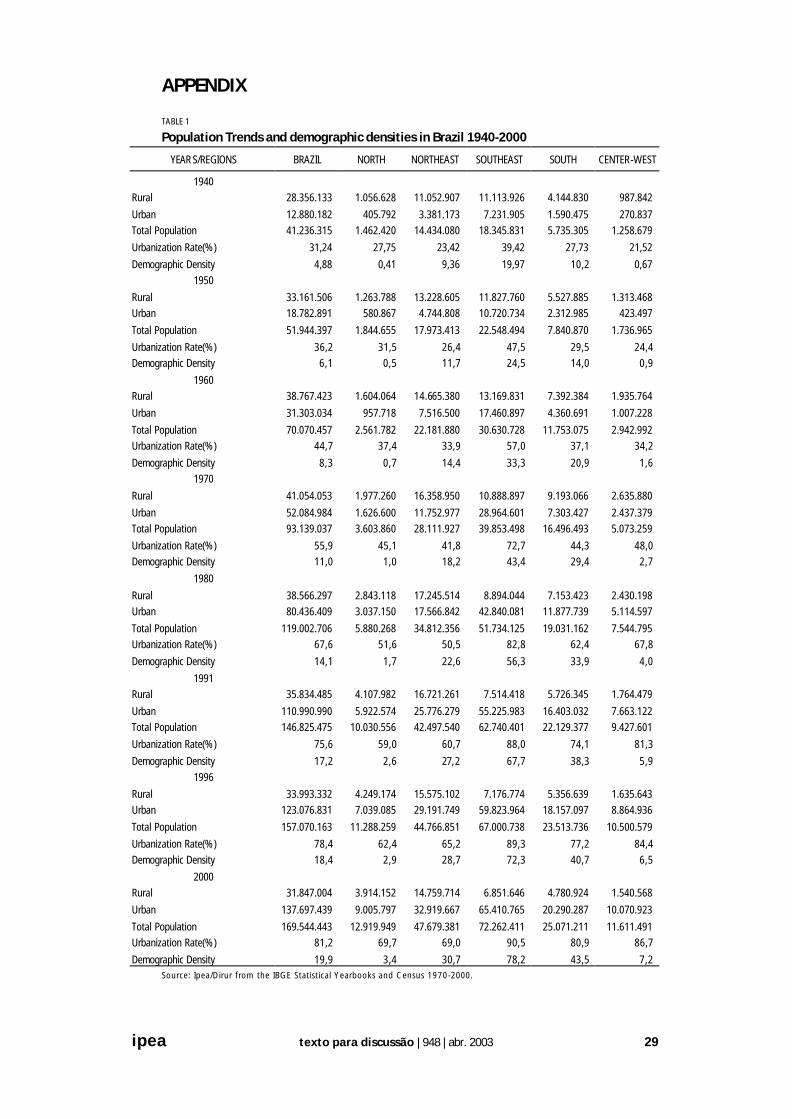
TABLE 1
Population Trends and demographic densities in Brazil 1940-2000
YEAR S/REGIONS BRAZIL NORTH NORTHEAST SOUTHEAST SOUTH CENTER-WEST
1940
Rural 28.356.133 1.056.628 11.052.907 11.113.926 4.144.830 987.842
Urban 12.880.182 405.792 3.381.173 7.231.905 1.590.475 270.837
Total Population 41.236.315 1.462.420 14.434.080 18.345.831 5.735.305 1.258.679
Urbanization Rate(%) 31,24 27,75 23,42 39,42 27,73 21,52
Demographic Density 4,88 0,41 9,36 19,97 10,2 0,67
1950
Rural 33.161.506 1.263.788 13.228.605 11.827.760 5.527.885 1.313.468
Urban 18.782.891 580.867 4.744.808 10.720.734 2.312.985 423.497
Total Population 51.944.397 1.844.655 17.973.413 22.548.494 7.840.870 1.736.965
Urbanization Rate(%) 36,2 31,5 26,4 47,5 29,5 24,4
Demographic Density 6,1 0,5 11,7 24,5 14,0 0,9
1960
Rural 38.767.423 1.604.064 14.665.380 13.169.831 7.392.384 1.935.764
Urban 31.303.034 957.718 7.516.500 17.460.897 4.360.691 1.007.228
Total Population 70.070.457 2.561.782 22.181.880 30.630.728 11.753.075 2.942.992
Urbanization Rate(%) 44,7 37,4 33,9 57,0 37,1 34,2
Demographic Density 8,3 0,7 14,4 33,3 20,9 1,6
1970
Rural 41.054.053 1.977.260 16.358.950 10.888.897 9.193.066 2.635.880
Urban 52.084.984 1.626.600 11.752.977 28.964.601 7.303.427 2.437.379
Total Population 93.139.037 3.603.860 28.111.927 39.853.498 16.496.493 5.073.259
Urbanization Rate(%) 55,9 45,1 41,8 72,7 44,3 48,0
Demographic Density 11,0 1,0 18,2 43,4 29,4 2,7
1980
Rural 38.566.297 2.843.118 17.245.514 8.894.044 7.153.423 2.430.198
Urban 80.436.409 3.037.150 17.566.842 42.840.081 11.877.739 5.114.597
Total Population 119.002.706 5.880.268 34.812.356 51.734.125 19.031.162 7.544.795
Urbanization Rate(%) 67,6 51,6 50,5 82,8 62,4 67,8
Demographic Density 14,1 1,7 22,6 56,3 33,9 4,0
1991
Rural 35.834.485 4.107.982 16.721.261 7.514.418 5.726.345 1.764.479
Urban 110.990.990 5.922.574 25.776.279 55.225.983 16.403.032 7.663.122
Total Population 146.825.475 10.030.556 42.497.540 62.740.401 22.129.377 9.427.601
Urbanization Rate(%) 75,6 59,0 60,7 88,0 74,1 81,3
Demographic Density 17,2 2,6 27,2 67,7 38,3 5,9
1996
Rural 33.993.332 4.249.174 15.575.102 7.176.774 5.356.639 1.635.643
Urban 123.076.831 7.039.085 29.191.749 59.823.964 18.157.097 8.864.936
Total Population 157.070.163 11.288.259 44.766.851 67.000.738 23.513.736 10.500.579
Urbanization Rate(%) 78,4 62,4 65,2 89,3 77,2 84,4
Demographic Density 18,4 2,9 28,7 72,3 40,7 6,5
2000
Rural 31.847.004 3.914.152 14.759.714 6.851.646 4.780.924 1.540.568
Urban 137.697.439 9.005.797 32.919.667 65.410.765 20.290.287 10.070.923
Total Population 169.544.443 12.919.949 47.679.381 72.262.411 25.071.211 11.611.491
Urbanization Rate(%) 81,2 69,7 69,0 90,5 80,9 86,7
Demographic Density 19,9 3,4 30,7 78,2 43,5 7,2 Source: Ipea/Dirur from the IBGE Statistical Yearbooks and Census 1970-2000.

30 texto para discussão | 948 | abr. 2003 ipea
TABLE 2
Brazil: Dwelling Units by Sector, Region and State − 1999 TYPE OF SECTOR
STATES, REGIONS AND MAS SUBSTANDARD
AREAS OTHER AREAS
TOTALDWELLING
UNITS
SUBSTANDARD
UNITS
%
CONTRIBUTION TO
TOTAL SUBSTANDARD
UNITS %
CONTRIBUTION TO
TOTAL DWELLING
UNITS %
NORTH 110.188 1.745.586 1.855.774 5,94 7,88 4,32
Pará 51.452 654.707 706.159 7,29 3,68 1,65
Belém MA 51.452 168.417 219.869 23,40 3,68 0,51
NORTHEAST 339.238 10.937.076 11.276.314 3,01 24,25 26,27
Ceará 89.019 1.612.913 1.701.932 5,23 6,36 3,96
Fortaleza MA 81.332 596.084 677.416 12,01 5,81 1,58
Pernambuco 217.215 1.680.322 1.897.537 11,45 15,52 4,42
Recife MA 217.215 603.796 821.011 26,46 15,52 1,91
Bahia 23.806 3.218.694 3.242.500 0,73 1,70 7,55
Salvador MA 23.806 717.096 740.902 3,21 1,70 1,73
SOUTHEAST 829.341 18.788.723 19.618.064 4,23 59,27 45,70
Minas Gerais 108.978 4.505.051 4.614.029 2,36 7,79 10,75
Belo Horizonte MA 81.240 996.105 1.077.345 7,54 5,81 2,51
Rio de Janeiro 354.247 3.831.188 4.185.435 8,46 25,32 9,75
Rio de Janeiro MA 334.444 2.873.399 3.207.843 10,43 23,90 7,47
São Paulo 359.554 9.654.422 10.013.976 3,59 25,70 23,33
São Paulo MA 266.834 4.519.404 4.786.238 5,58 19,07 11,15
SOUTH 96.675 6.960.484 7.057.159 1,37 6,91 16,44
Paraná 32.827 2.596.316 2.629.143 1,25 2,35 6,12
Curitiba MA 22.710 703.483 726.193 3,13 1,62 1,69
Rio Grande do Sul 60.359 2.937.995 2.998.354 2,01 4,31 6,99
Porto Alegre MA 36.013 1.005.443 1.041.456 3,46 2,57 2,43
CENTER-WEST 23.743 3.093.789 3.117.532 0,76 1,70 7,26
Federal District 7.666 522.560 530.226 1,45 0,55 1,24
Total 1.399.185 41.525.658 42.924.843 3,26 100,00 100,00
Source: Ipea/Dirur from the 1999 IBGE/Pnad microdata.

ipea texto para discussão | 948 | abr. 2003 31
TABLE 3
Logit Regression Model Number of Response Levels =2: slum y=1; other urban neighborhoods y=0.
EXPLANATORY VARIABLE ESTIMATE STANDARD ERROR CHI-SQUARE P-VALUE ODDS RATIO Pi
Intercept -3,8205 0.00653 342.737.622 <.0001 Metropolitan Areas or big cities 1,4802 0.00429 118.848.370 <.0001 4,39 0,81 Recife 2,7911 0.00365 584.810.970 <.0001 16,30 0,94 Belém 2,6956 0.00594 205.692.465 <.0001 14,81 0,94 Rio de Janeiro 1,9169 0.00312 377.060.803 <.0001 6,80 0,87 Fortaleza 1,5463 0.00456 114.859.803 <.0001 4,69 0,82 Belo Horizonte 1,3271 0.00450 867.851.874 <.0001 3,77 0,79 São Paulo 1,0960 0.00317 119.337.424 <.0001 2,99 0,75 Porto Alegre 0.6710 0.00599 125.421.552 <.0001 1,96 0,66 Curitiba 0.4861 0.00753 41.679.687 <.0001 1,63 0,62 Salvador 0.2561 0.00722 12.594.289 <.0001 1,29 0,56
Distrito Federal -0.4229 0.0119 12.708.469 <.0001 0,655 0,40 Non-White 0.2194 0.00198 122.253.639 <.0001 1,25 0,55 Migrant 0.1477 0.00210 49.542.346 <.0001 1,16 0,54 Women 0.0913 0.00238 14.782.659 <.0001 1,10 0,52 Age -0.0190 0.000082 537.772.389 <.0001 0,98 0,50 Household Size 0.0939 0.000511 337.218.246 <.0001 1,10 0,52 Schooling -0.1080 0.000310 121.151.560 <.0001 0,90 0,47 Household Income -0.00059 2,06E-03 820.585.978 <.0001 1,00 0,50 Formal Owner -0.3942 0.00197 398.889.234 <.0001 0,67 0,40 Unemployed 0.1213 0.00554 4.801.923 <.0001 1,13 0,53 House Maid -0.0171 0.00435 154.453 <.0001 0,98 0,50 Informal Employee -0.4437 0.00338 172.354.334 <.0001 0,64 0,39 Unpaid Worker -0.1460 0.0207 495.734 <.0001 0,86 0,46 Self Employed -0.1807 0.00263 47.073.892 <.0001 0,84 0,46
Self Consumption -0.2108 0.0139 2.302.697 <.0001 0,81 0,45 Self Construction 0.4344 0.0209 4.324.612 <.0001 1,54 0,61 Building Sector 0.2463 0.00341 52.183.920 <.0001 1,28 0,56 Commerce and Services 0.1492 0.00245 36.966.007 <.0001 1,16 0,54 Government Employee -0.5865 0.00705 69.272.610 <.0001 0,56 0,36 Time to Work 1 (up to 30') 0.1273 0.00265 23.099.206 <.0001 1,14 0,53 Time to Work 2 (more than 30' to 1 hour) 0.4048 0.00286 200.529.335 <.0001 1,50 0,60 Time to Work 3 (more than 1 to 2 hours) -0.0656 0.00409 2.573.394 <.0001 0,94 0,48 Time to Work 4 (more than 2 hours) -0.8127 0.0112 52.533.099 <.0001 0,44 0,31
Source: Dirur/Ipea from the 1999 IBGE/Pnad microdata.

32 texto para discussão | 948 | abr. 2003 ipea
TABLE 4
Descriptive Statistics – Mean Values for the Explanatory Variables Used in the Logit Regression EXPLANATORY VARIABLES SUBSTANDARD AREAS ALL URBAN AREAS
Household Size 3.9155 3.7352
Big cities 0.942 0.628
Formal owner 0.5765 0.6933
Belém 0.0368 0.0063
Fortaleza 0.0581 0.0190
Recife 0.1552 0.0221
Salvador 0.0170 0.0205
Belo Horizonte 0.0581 0.0280
Rio de Janeiro 0.2390 0.0911
São Paulo 0.1907 0.1356
Curitiba 0.0162 0.0192
Porto Alegre 0.025739 0.0284
Federal District 0.0055 0.0192
Women 0.2959 0.2545
Age 42.89 46.40
Schooling 4.5662 5.4492
Household Income 556.2683 1061.51
Migrant 0.6699 0.6202
Non-White 0.5766 0.4102
Unemployed 0.0336 0.0217
Construction Sector 0.1240 0.0847
Commerce and Services 0.3651 0.2673
Self-Consumption 0.0044 0.0115
Government Employee 0.0183 0.0499
Informal Employee 0.0943 0.1124
House Maid 0.067852 0.028917
Self employed 0.2135 0.2186
Unpaid Workers 0.0021 0.0031
Self Construction 0.0022 0.0013
Time to Work 1 (< 30 minutes) 0.3291 0.4089
Time to Work 2 (> 30 to 1 hour) 0.2329 0.142
Time to Work 3 (>1 to 2 hours) 0.0719 0.0496
Time to Work 4 (>2 hours) 0.0073 0.0126
Number of Housing Units 1399185 34927665
Source: Dirur/Ipea from the 1999 IBGE/Pnad microdata.

ipea texto para discussão | 948 | abr. 2003 33
TABLE 5
Contribution of Central Cities to the Total Population and Formal Employment of The Main Brazilian Metropolitan Areas − 1999
CORE MUNICIPALITY POPULATION % FORMAL EMPLOYMENT %
Salvador 2440886 81,0 545107 82,0 Fortaleza 2138234 75,0 401900 86,0
Belo Horizonte 2229697 53,0 909528 79,0
Belém 1279861 69,0 255325 89,0
Recife 1421947 43,0 425305 80,0
Curitiba 1586898 59,0 538069 80,0
Rio de Janeiro 5850544 54,0 1664965 79,0
Porto Alegre 1359932 39,0 518180 61,0
São Paulo 10406166 58,0 3080172 70,0
Source: Ipea/Dirur based on the 1999 MTE/Rais microdata.
TABLE 6
Salaries per Income Level in Formal Employment − 1999
INCOME IN MINIMUM WAGES ALLSECTORS(R$) GOVERNMENT
(R$)
ALLSECTORS
(%)
GOVERNMENT
(%)
Up to 2 7.170.388,00 1.360.405,00 29,1 22,6
2 to 7 14.645.981,00 3.687.140,00 59,5 61,1
More than 7 2.802.869,00 984.217,00 11,4 16,3
Total 24.619.238,00 6.031.762,00 100,0 100,0
Source: Ipea from the 1999 MTE/Rais.
TABLE 7
Brazil: Monthly Income (R$) by Region − 1999* CATEGORY BRAZIL CENTER-WEST NORTHEAST NORTH SOUTHEAST SOUTH
Total 477,23 522,25 263,62 408,94 603,44 502,51
Gender
Man 550,90 559,70 298,20 463,80 696,70 603,50
Women 359,44 393,40 206,20 321,20 456,80 348,70
Labor Market Insertion
Formal Employee 551,93 508,40 396,10 453,90 616,60 514,30
Self Employed 440,52 495,00 225,10 357,80 614,20 531,20
Entrepreneur 1717,34 1758,50 1313,80 1416,40 1898,10 1715,40
Government Staff 1734,87 2023,00 1719,20 1238,30 1710,70 1887,80
Informal Employee 360,25 391,20 234,10 361,90 425,80 402,60
Sector of Activity
Agriculture 184,45 324,60 98,90 236,00 288,20 219,30
Construction 402,11 408,90 248,10 351,60 475,90 437,70
Industry 551,11 460,40 294,30 377,10 666,50 509,10
Services 684,42 592,20 414,10 484,40 820,60 678,80
Other 564,45 706,30 376,20 448,90 648,20 615,60
Source: Ipea/Disoc − Boletim de Políticas Sociais no 2 (2001), based upon the 1999 IBGE/Pnad microdata.
* In R$ September 1999; september 1999 average exchange rate R$/US$ = 1,8981.


© Instituto de Pesquisa Econômica Aplicada – ipea 2003
EDITORIAL
Coordenação Luiz Cezar Loureiro de Azeredo
Produção
Supervisão
Silvânia de Araujo Carvalho
Revisão Marco Aurélio Dias Pires Ana Flávia Magalhães Pinto Fábio Marques Rezende (estagiário) Lilian Afonso Pereira (estagiária) Luciana Soares Sargio Renata Frassetto de Almeida
Editoração Iranilde Rego Aeromilson Mesquita Elidiane Bezerra Borges Roberto Astorino
Reprodução Gráfica Antônio Lucena de Oliveira Edilson Cedro Santos
Apoio Administrativo Tânia Oliveira de Freitas Wagner da Silva Oliveira
Divulgação
Supervisão
Dóris Magda Tavares Guerra
Equipe Edinaldo dos Santos Edineide Ramos Geraldo Nogueira Luiz José Carlos Tofetti Marcos Cristóvão Mauro Ferreira
Brasília SBS – Quadra 1 − Bloco J − Ed. BNDES, 10o andar – 70076-900 − Brasília – DF Fone: (61) 315-5336 Fax: (61) 315-5314 Correio eletrônico: [email protected]
Rio de Janeiro Av. Presidente Antônio Carlos, 51, 14o andar – 20020-010 − Rio de Janeiro – RJ Fone: (21) 3804-8118 Fax: (21) 2220-5533 Correio eletrônico: [email protected] URL: http://www.ipea.gov.br
ISSN 1415-4765
Tiragem: 130 exemplares