Testing the suitability of BITC’s indices for the sector Mark Warner Environmental Projects...
25
Testing the suitability of BITC’s indices for the sector Mark Warner Environmental Projects Manager Isabel Souza Business in the community
-
Upload
allison-wiggins -
Category
Documents
-
view
220 -
download
0
Transcript of Testing the suitability of BITC’s indices for the sector Mark Warner Environmental Projects...

Testing the suitability of BITC’s indices for the sector
Mark WarnerEnvironmental Projects ManagerIsabel SouzaBusiness in the community

Topics
How & why the project came about The indices explained (Isabela) Participation Analysis (Isabela) Participants feedback Findings Recommendations Promotion

How & why Question 1999 %
Score2004 % score
Improvement
Leadership 86 100 14
Policy 93 100 7
Objectives 50 90 40
Targets 71 79 8
Audit 21 71 50
Supplier 29 42 13
Employee 0 73 73
Stakeholder 3 84 45

Business in the Community © 2006 www.bitc.org.uk
INDICES BACKGROUND
» ENVIRONMENT INDEX– National Environment Index launched in 1996, Y&H followed in 1999 and
North West is piloting it in 2006
» CR Index– National CR Index launched in 2002
» Target Audiences– National Indices restricted participation to FTSE 350, Dow Jones Sector
Leaders and BITC member companies with significant economic presence
– Regional Indices focus in SMEs

Business in the Community © 2006 www.bitc.org.uk
INDICES’ MODEL
» ENVIRONMENT INDEX
» CR INDEX
Climate Change
Waste
Self-selected
Corporate Strategy (10%)
Integration(22.5%)
Management(22.5%)
Performanceand Impact (35%)
Community
Environment
Marketplace
Workplace
Assurance & Disclosure
(10%)
Social Impact
Env. Impact
Management(22.5%)
Performanceand Impact (35%)
Assurance & Disclosure
(10%)

Participation
Target was 30 institutions 30 represented at workshops 12 participants in total 6 institutions outside Yorkshire &
Humber 6 from Yorkshire & Humber 3 did the CR Index 6/13 have completed feedback forms

Business in the Community © 2006 www.bitc.org.uk
» OVERALL
– Average for HE Sector pilot is the lowest in the Index*
– HE sector average in the pilot is lower than in the Y&H Environment Index
» CONSIDERATIONS
– Publicity of rankings
– Continuous improvement of previous participants
* Source National Environment Index 2005
ENVIRONMENT INDEX PILOT PROJECT RESULTS
83%
77%
79%
82%
82%
83%
84%
85%
86%
94%
86%
62%
0% 20% 40% 60% 80% 100%
All Index Participants
Higher Education
Technology
Financials
Consumer Services
Professional Services
Industrials
Telecommunications
Consumer Goods
Basic Materials
Health Care
Utilities

Business in the Community © 2006 www.bitc.org.uk
» SECTION BREAKDOWN• Following the same trend as the all participants in the Environment Index, HE
Sector performs better in the management section than in the performance and impact section
• The greatest gap between HE Sector and all participants in the Environment Index is in terms of assurance ( 30% difference), whereas the smallest gap is in terms of willingness to disclose
ENVIRONMENT INDEX PILOT PROJECT RESULTS
0%
20%
40%
60%
80%
100%
Assurance processes Willingness to disclose
HE Sector
2005 Env. Index
64%
59%
86%
81%
0%
20%
40%
60%
80%
100%
Management Performance

Business in the Community © 2006 www.bitc.org.uk
MANAGEMENT SECTION (Part I)
0%
20%
40%
60%
80%
100%
Assurance processes Willingness to disclose
HE Sector
2005 Env. Index
ENVIRONMENT INDEX PILOT PROJECT RESULTS (Cont.)
• Key Issues Methodology
– Some universities do not have a formal risk assessment process to identify their key issues
• Leadership and Policies
– Top management assigned environmental responsibilities, but some do not discuss environmental issues regularly
– All universities have a policy in place, but some not reviewed regularly & not in the public domain
• Objectives and Targets
– Same trend as in the Environment Index: organisations are better in setting objectives than in setting targets
• Employee Programme
– Whereas some universities have programmes in place achieving 100% in this question, others perform poorly – dropping the sector average
77
%
69
%
88
%
64
%
59
%
74
%
99
%
88
% 97
%
95
%
91
%
93
%
0%
20%
40%
60%
80%
100%
Key Issues Leadership Policy Objectives Target EmployeeProgramme

Business in the Community © 2006 www.bitc.org.uk
MANAGEMENT SECTION (Part II)
ENVIRONMENT INDEX PILOT PROJECT RESULTS (Cont.)
• Stakeholder
– No large discrepancy between the HE Sector and Environment Index participants
• EMS and Audit
– 1/3 of universities in the project did not have an EMS in place or environmental audits
• Supply Chain
– Weakest area in the Environment Index
– Surprisingly HE Sector performs better in terms of their supply chain than EMS
• Stewardship
– HE Sector has difficulty in identifying its services/products and clients and how they influence them
0%
20%
40%
60%
80%
100%
Assurance processes Willingness to disclose
HE Sector
2005 Env. Index
70%
41% 53
%
49%
69%
86%
78% 84
%
72%
89%
0%
20%
40%
60%
80%
100%
StakeholderCommunications
EMS Environmental Audit Supply Chain Stew ardship

Business in the Community © 2006 www.bitc.org.uk
» PERFORMANCE AND IMPACT SECTION
• Climate Change– HE Sector performs similarly to all
participants in the Environment Index
– Potentially this is a result of good influence from the academic community giving weight to the issue
• Waste and Resource Use– Surprisingly, some universities do
not even measure their waste
– There are eco-efficiency opportunities and low hanging fruits waiting to be picked
ENVIRONMENT INDEX PILOT PROJECT RESULTS (Cont.)
0%
20%
40%
60%
80%
100%
Assurance processes Willingness to disclose
HE Sector
2005 Env. Index
84%
56%
53%
87%
69% 74
%
0%
20%
40%
60%
80%
100%
Climate Change(overall KPI)
Climate Change(individual KPIs)
Waste & ResourceManagement
Business in the Community © 2006 www.bitc.org.uk
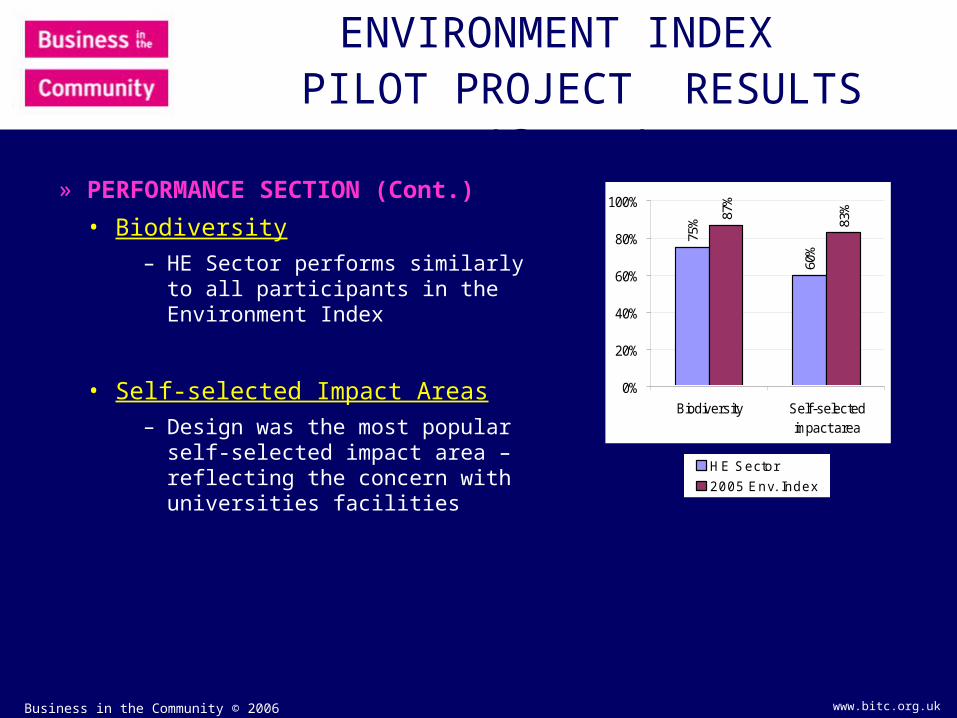
» PERFORMANCE SECTION (Cont.)
• Biodiversity
– HE Sector performs similarly to all participants in the Environment Index
• Self-selected Impact Areas
– Design was the most popular self-selected impact area – reflecting the concern with universities facilities
ENVIRONMENT INDEX PILOT PROJECT RESULTS (Cont.)
0%
20%
40%
60%
80%
100%
A s s uranc e proc es s es Willingnes s to d is c los e
H E S e cto r
2 0 0 5 En v. In d e x
75%
60%
87%
83%
0%
20%
40%
60%
80%
100%
Biodiversity Self-selectedimpact area
Business in the Community © 2006 www.bitc.org.uk
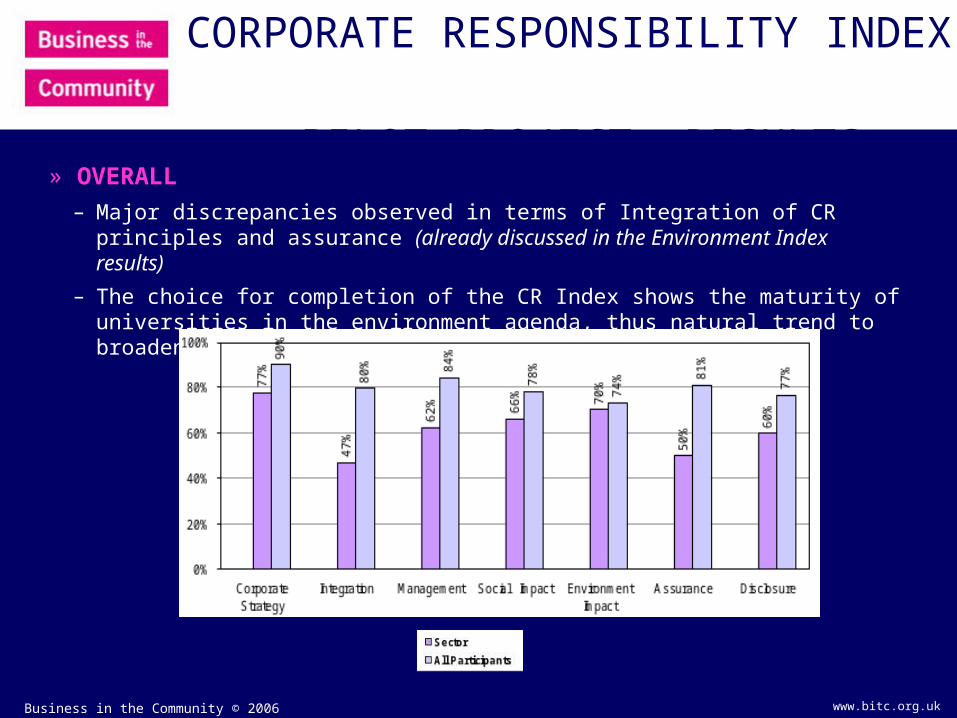
» OVERALL
– Major discrepancies observed in terms of Integration of CR principles and assurance (already discussed in the Environment Index results)
– The choice for completion of the CR Index shows the maturity of universities in the environment agenda, thus natural trend to broaden the scope of their submission
CORPORATE RESPONSIBILITY INDEX
PILOT PROJECT RESULTS
Business in the Community © 2006 www.bitc.org.uk
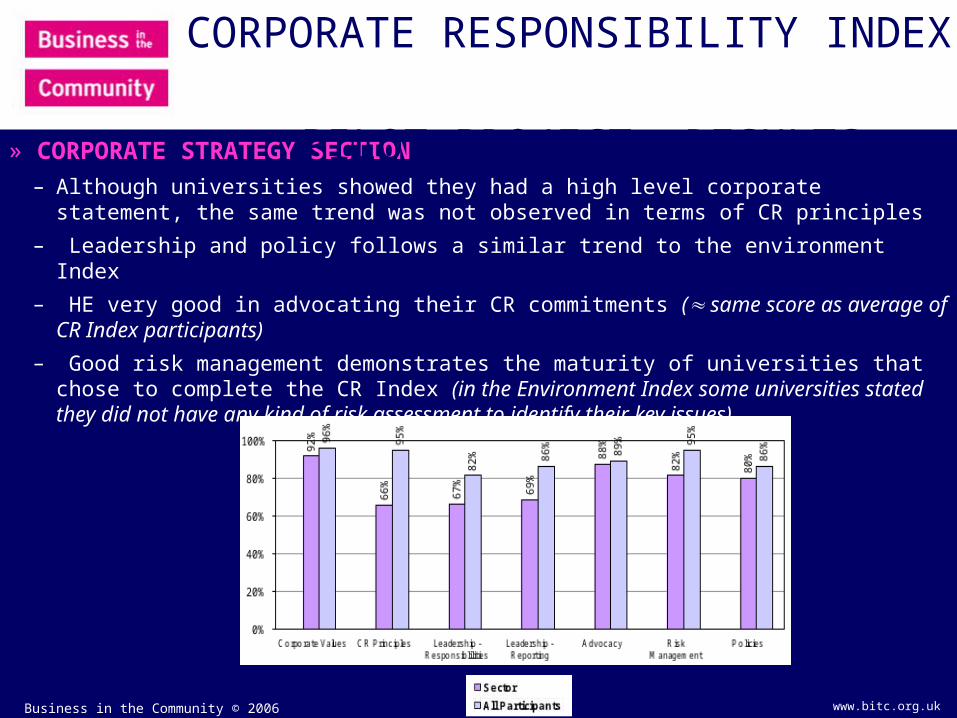
» CORPORATE STRATEGY SECTION
– Although universities showed they had a high level corporate statement, the same trend was not observed in terms of CR principles
– Leadership and policy follows a similar trend to the environment Index
– HE very good in advocating their CR commitments ( same score as average of CR Index participants)
– Good risk management demonstrates the maturity of universities that chose to complete the CR Index (in the Environment Index some universities stated they did not have any kind of risk assessment to identify their key issues)
CORPORATE RESPONSIBILITY INDEX
PILOT PROJECT RESULTS

Business in the Community © 2006 www.bitc.org.uk
» INTEGRATION SECTION
– Major discrepancy in terms of remuneration and bonus
– Other weak areas include CR principles integration, strategic decision-making, training and development and scope of reporting
– On the other hand, HE Sector average for business conduct was very close to the average of all the participants in the CR Index
CORPORATE RESPONSIBILITY INDEX
PILOT PROJECT RESULTS
CPI - Corporate Responsibility Principles IntegrationBC - Business ConductPM - Performance ManagementRB - Remuneration and BonusSD - Strategic Decision-makingTD - Training and DevelopmentSM/BM Senior Managers and Board member Training/BriefingSE - Stakeholder EngagementR - ReportingSR - Scope of reporting
Business in the Community © 2006 www.bitc.org.uk
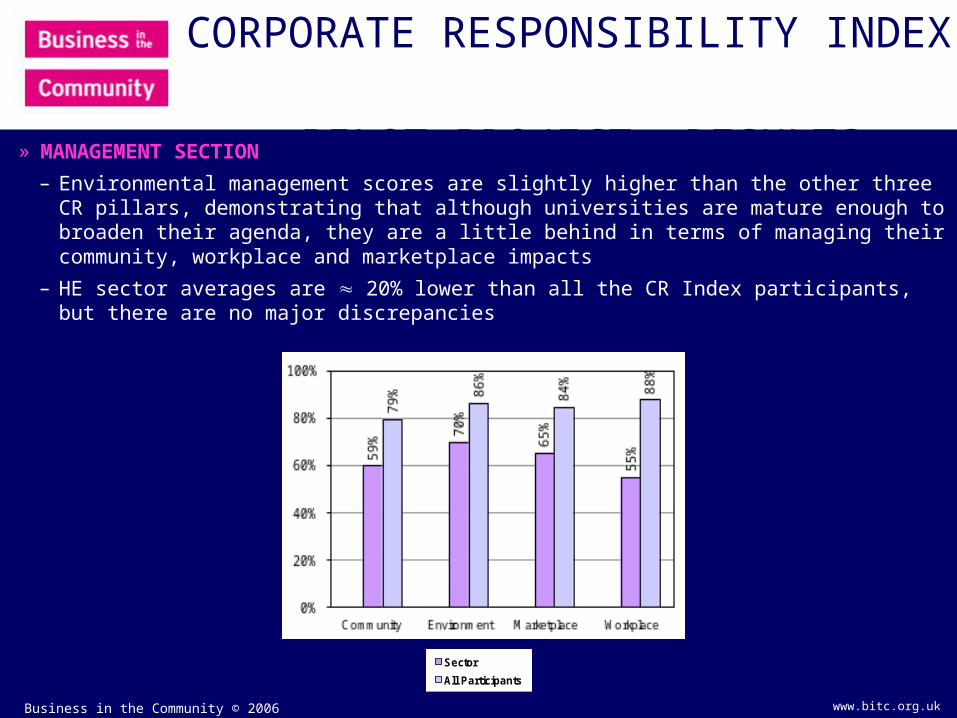
» MANAGEMENT SECTION
– Environmental management scores are slightly higher than the other three CR pillars, demonstrating that although universities are mature enough to broaden their agenda, they are a little behind in terms of managing their community, workplace and marketplace impacts
– HE sector averages are 20% lower than all the CR Index participants, but there are no major discrepancies
CORPORATE RESPONSIBILITY INDEX
PILOT PROJECT RESULTS
0%
20%
40%
60%
80%
100%
Corporate Values(Q1)
CR P rinciples(Q2)
Leadership -Responsiblilities
(Q3a)
Leadership -Reporting (Q3b)
Advocacy (Q4) RiskManagement
(Q5)
P olicies (Q6)
Sector
All Participants

Business in the Community © 2006 www.bitc.org.uk
» PERFORMANCE SECTION
• Environmental Performance– Covered in the Environment Index
• Social Performance– Flexibility to choose 3 out of 5 social impact options
– HE sector better than average of all participants in relation to Workplace Diversity
– Although universities chose to answer Community investment, their performance in this area is quite poor
– Similar observation in regards to Occupational Health and Safety, which includes requirements of public reporting on OHSMS KPIs and external certifications as OHSAS 18001
CORPORATE RESPONSIBILITY INDEX
PILOT PROJECT RESULTS (Cont.)
0%
20%
40%
60%
80%
100%
Corporate Values(Q1)
CR P rinciples(Q2)
Leadership -Responsiblilities
(Q3a)
Leadership -Reporting (Q3b)
Advocacy (Q4) RiskManagement
(Q5)
P olicies (Q6)
Sector
All Participants
PHS - Product Health & SafetyOHS - Occupational Health & SafetyLRSC - Labour Rights in the Supply ChainWD - Workplace DiversityCI - Community Investment

Business in the Community © 2006 www.bitc.org.uk
» CHOICE OF ENVIRONMENT INDEX versus CR INDEX
– Environment Index is preferred among universities (72%), whereas in the National Index, only 23% of companies opt to enter the Environment Index solely
» MOST COMMON REASON FOR NOT PARTICIPATING
– No time / resources
– Afraid of publicity of results
» OUTCOMES*
– Gap analysis and benchmarking provided to universities taking part of the Pilot Project
– Benchmark of HE sector against companies taking part in the National Indices
* Mark Warner will talk about the applicability of the Indices to the HE Sector
OVERALL PILOT PROJECT RESULTS

Participants feedback
Completing the survey, while taking longer than expected, has provided a focus for the consideration of the role of the University in terms of Corporate Responsibility (University of Manchester).
Provides clear evidence to senior management of areas requiring improvement (York St John University College).
Easy to complete and well-structured (University of Worcester).

Participants feedback (cont)
Support and sign off at strategic level makes a big difference (University of Leeds).
Highlighted need for dedicated Energy / Environment Management resource (University of Hull).
Brings together a broad range of specialists and generalists (Leeds Met).

Findings
Time, ease of use & trainingFuture participation Driver for change Raised board awarenessFlexible toolOther surveys

Findings (cont)
High profileSupportNetworkPriority areas & significant impactsKnowledge

Immediate recommendations
Treat as a process of continual improvement
Tweak terminology and questions Run another pilot with a larger group of
participants Run with environment index first Run regionally with one annual national
report

Future recommendations
Integrate Env index into HEFCE sustainable development strategy
HEFCE to allow index results to be submitted as Env KPI’s by institutions
HEFCE to establish formal partnership with BITC
Promotion
Participant reports Apr (public & private)
Recommendations to HEFCE Apr 06 Wider promotion Apr-May 06 via:
EAUC members, HE Academy, British Universities Directors of Finance Group, the Association of University Directors of Estates and through direct mailings to Vice-Chancellors, Guardian, Times Higher, IEMA.