Ten-year survival of patients with cancer of the digestive tract in Umbria, Italy
5
Introduction Cancer survival studies are commonly based on data derived from hospital or population cancer registries. In the first case survival analysis can be used to evaluate the efficacy of therapeutic protocols and diagnostic procedures. In the second the monitoring of survival trends in a population, possibly together with those of incidence and mortality, can also constitute an indicator of both the efficacy of the diagnostic and therapeutic procedures and efficiency of health structures in a certain geographic area. Compared to hospital data, population survival data give fewer details of biological and clinical charac- teristics, but the cases give a homogenous picture of the population under study [1]. In Umbria, a central Italian region with a popula- tion at the 1981 census of 807,552 inhabitants, iden- tification and registration of all cases of diagnosed tumours in the resident population started on 1.1.1994 and first survival data will be available in a number of years. During the period 1978–1982, in the Umbria region a population-based incidence survey was carried out, using the data for new cases of diseases obtained from the case records of the Hospitals in the region [2]. Starting from these nominative data, the authors are studying the survival rates. This paper presents an analysis of survival statis- tics, up to ten years, of 4135 incident cases from digestive system cancers. Subjects and methods The data included in the present study concerning 2383 males and 1752 females, were derived from an ad hoc survey carried out to collect data on the incident cancer cases in the Umbria region in the 1978–1982 period. To minimize the probability of under or over registration, data collection covers the period 1976–1986 [2]. The cases of diseases were obtained from the case records of all diagnostic and therapeutic services public and private hospitals in the region and those of main national oncological centers. The date of first diagnosis was that of histological or cytological verification or in its absence the date of hospital admission. The reliability of incident data was tested examining the proportion of cases with histological or cytological verifications (75.5% for all cancer sites) and the resulting mor- tality/incidence ratio (0.57 for all sites) was similar to those of the Varese cancer registries and of some foreign registries [3]. The percent variation ((max- min)/mean) in number of registered cases, within the five years, was 5.1%. From the clinical archives for each case, name and surname, age and sex, address, municipality of birth and residence, date of diagnosis, cancer site (ICD-9) [4] were recorded. The death certificate only (DCO) cases, in the original ad hoc survey, were no considered due to the short period of registration. The follow-up was carried out by examining the regional registry of mortality (RENCAM) and the European Journal of Epidemiology 13: 9–13 (January 1997) 1997 Kluwer Academic Publishers. Printed in the Netherlands. Ten-year survival of patients with cancer of the digestive tract in Umbria, Italy Francesco La Rosa, Anna Maria Petrinelli, Liliana Minelli & Vito Mastrandrea Department of Hygiene, Perugia University, Perugia, Italy Accepted in revised form 4 June 1996 Abstract. Survival statistics of 4135 incident cases of digestive system cancers in the Umbria region of Italy are reported. The original data are derived from an ad hoc survey carried out in the period 1978–1982. Observed and relative rates at 1, 5 and 10 years are presented separately by sex and age (< 60 and > 60 years). In both sexes there are very short survival rates for liver, bile duct and pancreas cancers, whereas about 50% of colon and rectum cancer patients survived at five years. About 20% Key words: Digestive cancer, Survival stomach cancer patients survived at the same time. In males the survival rate for oesophagus cancer is close to 10%. The rates at ten years confirm the trend. Comparisons between sexes show that there is no significant differences in age at first diagnosis. Survival values are higher in females only for rectum cancers. In both sexes, for stomach, colon and rectum sites younger patients had a significantly longer survival than older ones.
-
Upload
francesco-la-rosa -
Category
Documents
-
view
213 -
download
1
Transcript of Ten-year survival of patients with cancer of the digestive tract in Umbria, Italy
Introduction
Cancer survival studies are commonly based on dataderived from hospital or population cancer registries.In the first case survival analysis can be used toevaluate the efficacy of therapeutic protocols anddiagnostic procedures. In the second the monitoringof survival trends in a population, possibly togetherwith those of incidence and mortality, can alsoconstitute an indicator of both the efficacy of thediagnostic and therapeutic procedures and efficiencyof health structures in a certain geographic area.Compared to hospital data, population survival datagive fewer details of biological and clinical charac-teristics, but the cases give a homogenous picture ofthe population under study [1].
In Umbria, a central Italian region with a popula-tion at the 1981 census of 807,552 inhabitants, iden-tification and registration of all cases of diagnosedtumours in the resident population started on1.1.1994 and first survival data will be available ina number of years. During the period 1978–1982, inthe Umbria region a population-based incidencesurvey was carried out, using the data for new casesof diseases obtained from the case records of theHospitals in the region [2]. Starting from thesenominative data, the authors are studying the survivalrates.
This paper presents an analysis of survival statis-tics, up to ten years, of 4135 incident cases fromdigestive system cancers.
Subjects and methods
The data included in the present study concerning2383 males and 1752 females, were derived from an
ad hoc survey carried out to collect data on theincident cancer cases in the Umbria region in the1978–1982 period. To minimize the probability ofunder or over registration, data collection covers theperiod 1976–1986 [2]. The cases of diseases wereobtained from the case records of all diagnostic andtherapeutic services public and private hospitals inthe region and those of main national oncologicalcenters. The date of first diagnosis was that ofhistological or cytological verification or in itsabsence the date of hospital admission. The reliabilityof incident data was tested examining the proportionof cases with histological or cytological verifications(75.5% for all cancer sites) and the resulting mor-tality/incidence ratio (0.57 for all sites) was similarto those of the Varese cancer registries and of someforeign registries [3]. The percent variation ((max-min)/mean) in number of registered cases, within thefive years, was 5.1%. From the clinical archives foreach case, name and surname, age and sex, address,municipality of birth and residence, date of diagnosis,cancer site (ICD-9) [4] were recorded. The deathcertificate only (DCO) cases, in the original ad hocsurvey, were no considered due to the short periodof registration.
The follow-up was carried out by examining theregional registry of mortality (RENCAM) and the
European Journal of Epidemiology 13: 9–13 (January 1997) 1997 Kluwer Academic Publishers. Printed in the Netherlands.
Ten-year survival of patients with cancer of the digestive tract in Umbria, Italy
Francesco La Rosa, Anna Maria Petrinelli, Liliana Minelli & Vito MastrandreaDepartment of Hygiene, Perugia University, Perugia, Italy
Accepted in revised form 4 June 1996
Abstract. Survival statistics of 4135 incident casesof digestive system cancers in the Umbria region ofItaly are reported. The original data are derived froman ad hoc survey carried out in the period1978–1982. Observed and relative rates at 1, 5 and10 years are presented separately by sex and age(< 60 and
> 60 years). In both sexes there are veryshort survival rates for liver, bile duct and pancreascancers, whereas about 50% of colon and rectumcancer patients survived at five years. About 20%
Key words: Digestive cancer, Survival
stomach cancer patients survived at the same time.In males the survival rate for oesophagus cancer isclose to 10%. The rates at ten years confirm thetrend. Comparisons between sexes show that there isno significant differences in age at first diagnosis.Survival values are higher in females only for rectumcancers. In both sexes, for stomach, colon and rectumsites younger patients had a significantly longersurvival than older ones.

regional list of people covered by the National HealthService, which in Umbria region is six-monthlyupdated, and successively by direct verification at theRegistrar’s Offices of several municipalities. Migrantcases out of the region were disregarded and theoverall number of losts was very small (< 50). Caseswere divided into two groups: < 60 and > 60 yearsat first diagnosis.
The cancer sites considered were: oesophagus(150 ICD), only for males, stomach (151 ICD), colon(153 ICD), rectum (154 ICD), liver (155 ICD), gall-bladder and bile ducts (g-b.b.d. 156 ICD), andpancreas (157 ICD) for both sexes. The number ofnew cases and their mean age at first diagnosis arereported in Tables 1 and 2.
The differences between the means of incidenceage was tested using the t-Student test. Survivalanalysis was carried out by the Kaplan-Meier method[5, 6], and the significance of differences between
observed survival curves was tested by means of thelog-rank test [6, 7].
For computation of the relative survival rates, lifeexpectancy for age and sex was obtained fromUmbria 1981 lifetables, calculated by ourselves. Thisrelative rate was calculated relating the observed ratewith the expected one, that is the rate which corre-sponds to the mortality of general population [8].
Results
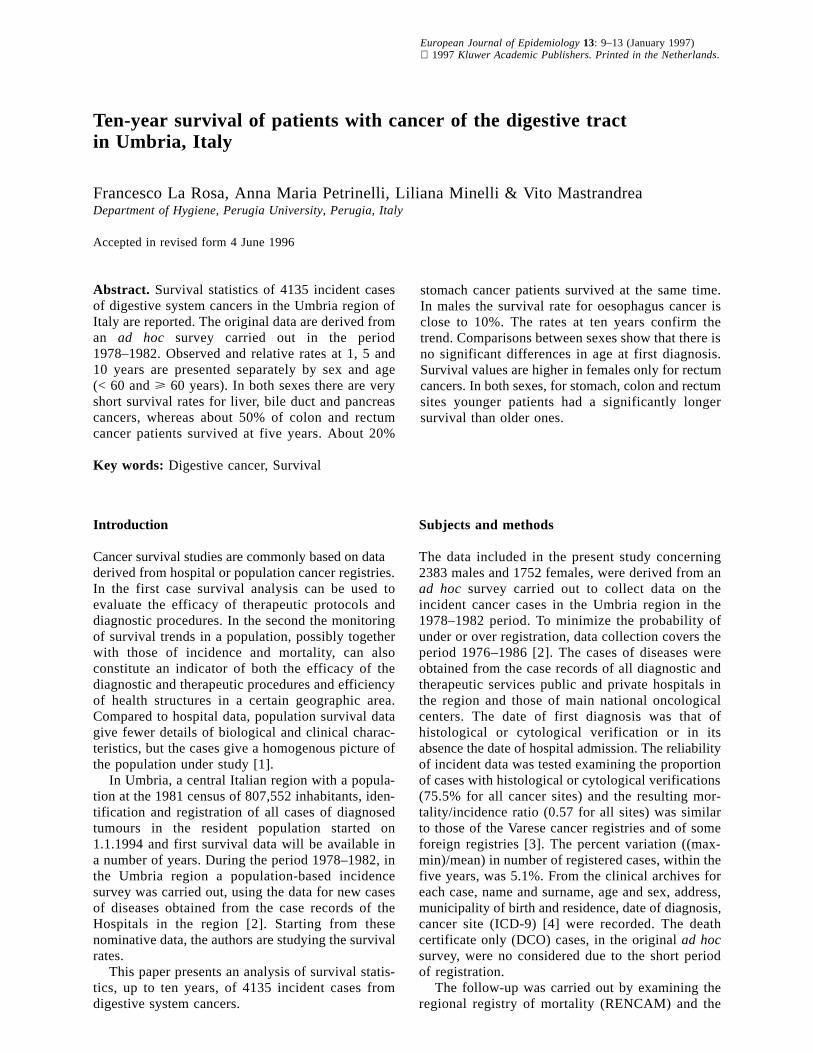
Tables 1 and 2 show the number of cases, the meanage at first diagnosis, and both observed and relativesurvival rates at 1, 5 and 10 years, for the examineddigestive cancer sites. Figure 1 shows the observedsurvival curves of cancer patients for each of sevencancer sites.
The differences between the means of age at
10
Table 1. Number of cases, mean age in years at first diagnosis observed (SE) and relative survival rates, males
Sites
Oesophagus Stomach Colon Rectum Liver G-b.b.d.a Panreas
No. of cases 88 913 486 419 205 70 202Mean age 65.4 065.7 066.7 067.3 065.9 67.6 064.9
P at 1 yearobserved 0.31 (0.05) 0.46 (0.02) 0.67 (0.02) 0.67 (0.02) 0.17 (0.03) 0.31 (0.06) 0.22 (0.03)relative 0.32 0.48 0.70 0.70 0.18 0.32 0.23
P at 5 yearsobserved 0.90 (0.03) 0.20 (0.01) 0.39 (0.02) 0.36 (0.02) 0.01 (0.01) 0.09 (0.03) 0.00 (0.00)relative 0.11 0.25 0.50 0.47 0.01 0.12 0.00
P at 10 yearsobserved 0.07 (0.03) 0.14 (0.01) 0.29 (0.02) 0.23 (0.02) 0.00 (0.00) 0.06 (0.03) 0.00 (0.00)relative 0.12 0.23 0.51 0.42 0.00 0.11 0.00
a Gall-bladder and bile ducts.
Table 2. Number of cases, mean age in years at first diagnosis observed (SE) and relative survival rates, females
Sites
Stomach Colon Rectum Liver G-b.b.d.a Pancreas
N. of cases 548 505 271 182 109 137Mean age 068.7 066.4 065.8 067.9 069.6 070.2
P at 1 yearobserved 0.47 (0.20) 0.68 (0.02) 0.76 (0.03) 0.19 (0.03) 0.28 (0.04) 0.29 (0.04)relative 0.49 0.70 0.78 0.20 0.29 0.30
P at 5 yearsobserved 0.23 (0.02) 0.46 (0.02) 0.48 (0.03) 0.00 (0.00) 0.06 (0.02) 0.01 (0.01)relative 0.28 0.55 0.56 0.00 0.07 0.01
P at 10 yearsobserved 0.18 (0.02) 0.35 (0.02) 0.37 (0.03) 0.00 (0.00) 0.06 (0.02) 0.00 (0.00)relative 0.29 0.52 0.53 0.00 0.09 0.00
a Gall-bladder and bile ducts.
incidence, in the two sexes, were never statisticallysignificant. As expected, liver, bile duct and pancreascancers have the shortest survival rates, in both malesand females. Of 387 liver cancer cases there were70 survivals at one year and 1 at five years.
Only the curves relating to rectum cancer presentsignificant differences between sexes (p < 0.001).This site, together with colon cancer, gives thehighest survival rates for both sexes. At 10 yearssurvival was 104/419 male patients and 103/271females. For colon cancer the number of survivorsat 10 years was 146/486 males and 186/505 females.In both sexes over 50% of stomach cancer patientsdied in the first year and about 18% survived at ten
years. 70% of males with oesophagus cancer died inthe first year. The relative survival rates at five andten years are similar for all sites examined and inboth sexes.
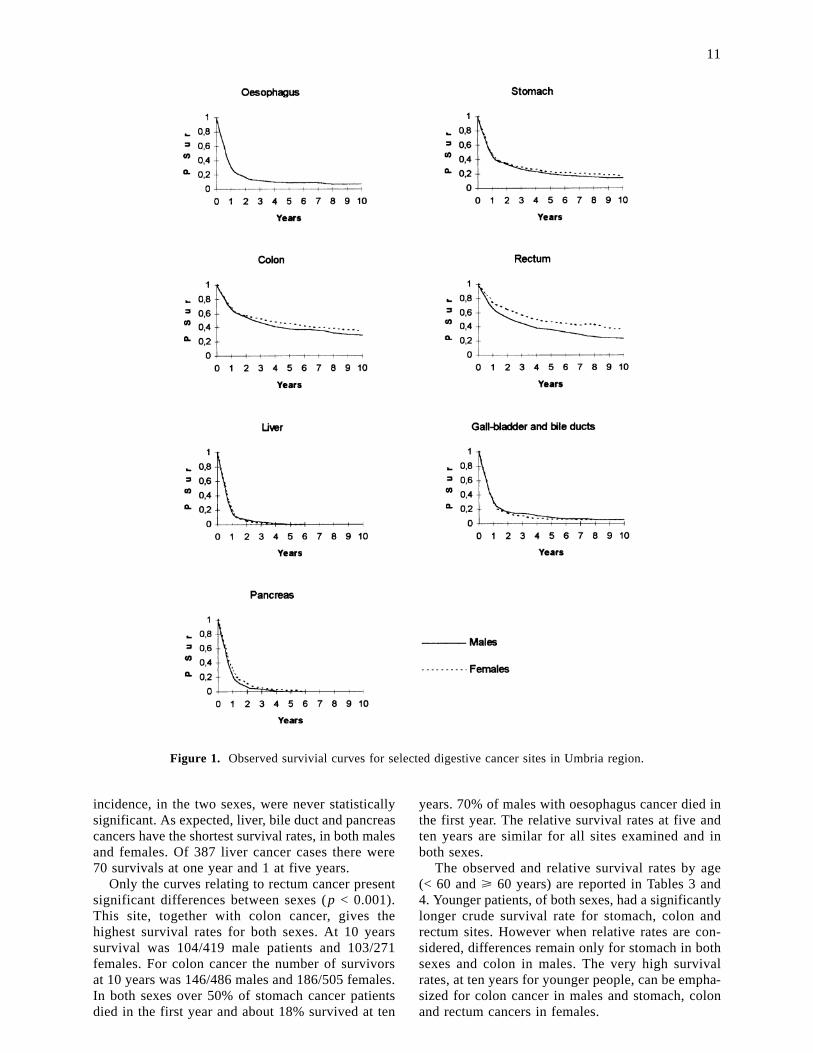
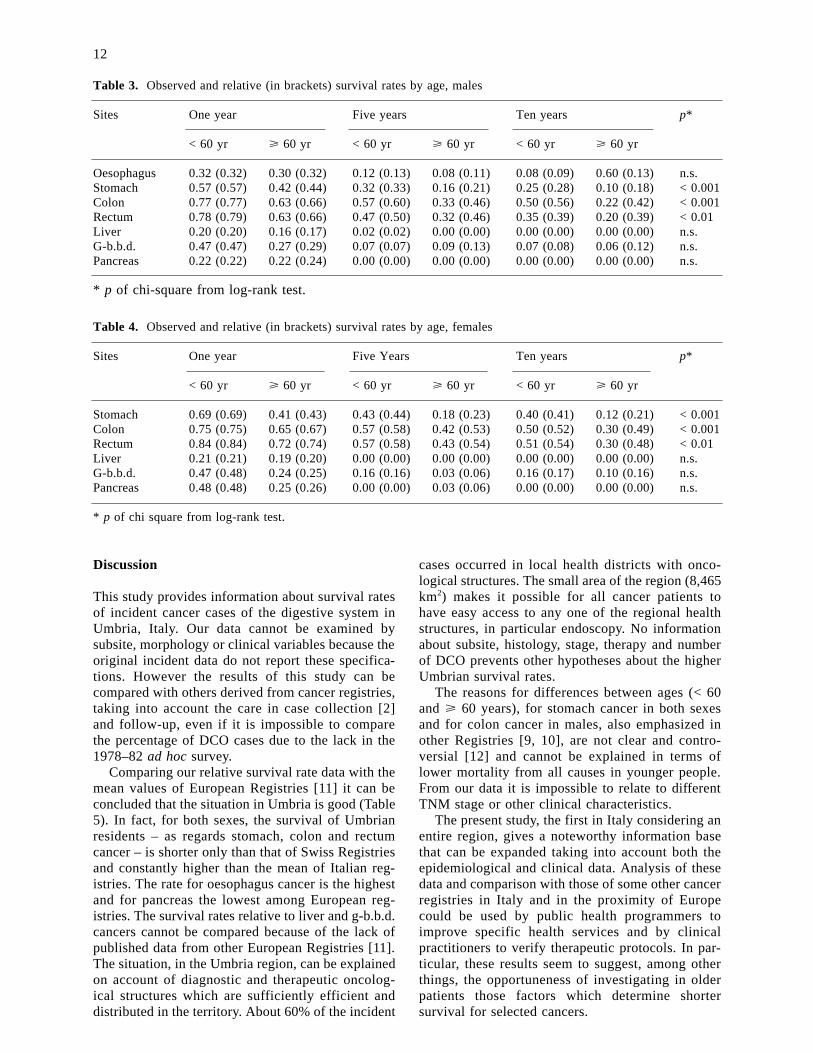
The observed and relative survival rates by age(< 60 and > 60 years) are reported in Tables 3 and4. Younger patients, of both sexes, had a significantlylonger crude survival rate for stomach, colon andrectum sites. However when relative rates are con-sidered, differences remain only for stomach in bothsexes and colon in males. The very high survivalrates, at ten years for younger people, can be empha-sized for colon cancer in males and stomach, colonand rectum cancers in females.
11
Figure 1. Observed survivial curves for selected digestive cancer sites in Umbria region.
Discussion
This study provides information about survival ratesof incident cancer cases of the digestive system inUmbria, Italy. Our data cannot be examined bysubsite, morphology or clinical variables because theoriginal incident data do not report these specifica-tions. However the results of this study can becompared with others derived from cancer registries,taking into account the care in case collection [2]and follow-up, even if it is impossible to comparethe percentage of DCO cases due to the lack in the1978–82 ad hoc survey.
Comparing our relative survival rate data with themean values of European Registries [11] it can beconcluded that the situation in Umbria is good (Table5). In fact, for both sexes, the survival of Umbrianresidents – as regards stomach, colon and rectumcancer – is shorter only than that of Swiss Registriesand constantly higher than the mean of Italian reg-istries. The rate for oesophagus cancer is the highestand for pancreas the lowest among European reg-istries. The survival rates relative to liver and g-b.b.d.cancers cannot be compared because of the lack ofpublished data from other European Registries [11].The situation, in the Umbria region, can be explainedon account of diagnostic and therapeutic oncolog-ical structures which are sufficiently efficient anddistributed in the territory. About 60% of the incident
cases occurred in local health districts with onco-logical structures. The small area of the region (8,465km2) makes it possible for all cancer patients tohave easy access to any one of the regional healthstructures, in particular endoscopy. No informationabout subsite, histology, stage, therapy and numberof DCO prevents other hypotheses about the higherUmbrian survival rates.
The reasons for differences between ages (< 60and > 60 years), for stomach cancer in both sexesand for colon cancer in males, also emphasized inother Registries [9, 10], are not clear and contro-versial [12] and cannot be explained in terms oflower mortality from all causes in younger people.From our data it is impossible to relate to differentTNM stage or other clinical characteristics.
The present study, the first in Italy considering anentire region, gives a noteworthy information basethat can be expanded taking into account both theepidemiological and clinical data. Analysis of thesedata and comparison with those of some other cancerregistries in Italy and in the proximity of Europecould be used by public health programmers toimprove specific health services and by clinicalpractitioners to verify therapeutic protocols. In par-ticular, these results seem to suggest, among otherthings, the opportuneness of investigating in olderpatients those factors which determine shortersurvival for selected cancers.
12
Table 3. Observed and relative (in brackets) survival rates by age, males
Sites One year Five years Ten years p*
< 60 yr > 60 yr < 60 yr > 60 yr < 60 yr > 60 yr
Oesophagus 0.32 (0.32) 0.30 (0.32) 0.12 (0.13) 0.08 (0.11) 0.08 (0.09) 0.60 (0.13) n.s.Stomach 0.57 (0.57) 0.42 (0.44) 0.32 (0.33) 0.16 (0.21) 0.25 (0.28) 0.10 (0.18) < 0.001Colon 0.77 (0.77) 0.63 (0.66) 0.57 (0.60) 0.33 (0.46) 0.50 (0.56) 0.22 (0.42) < 0.001Rectum 0.78 (0.79) 0.63 (0.66) 0.47 (0.50) 0.32 (0.46) 0.35 (0.39) 0.20 (0.39) < 0.01Liver 0.20 (0.20) 0.16 (0.17) 0.02 (0.02) 0.00 (0.00) 0.00 (0.00) 0.00 (0.00) n.s.G-b.b.d. 0.47 (0.47) 0.27 (0.29) 0.07 (0.07) 0.09 (0.13) 0.07 (0.08) 0.06 (0.12) n.s.Pancreas 0.22 (0.22) 0.22 (0.24) 0.00 (0.00) 0.00 (0.00) 0.00 (0.00) 0.00 (0.00) n.s.
* p of chi-square from log-rank test.
Table 4. Observed and relative (in brackets) survival rates by age, females
Sites One year Five Years Ten years p*
< 60 yr > 60 yr < 60 yr > 60 yr < 60 yr > 60 yr
Stomach 0.69 (0.69) 0.41 (0.43) 0.43 (0.44) 0.18 (0.23) 0.40 (0.41) 0.12 (0.21) < 0.001Colon 0.75 (0.75) 0.65 (0.67) 0.57 (0.58) 0.42 (0.53) 0.50 (0.52) 0.30 (0.49) < 0.001Rectum 0.84 (0.84) 0.72 (0.74) 0.57 (0.58) 0.43 (0.54) 0.51 (0.54) 0.30 (0.48) < 0.01Liver 0.21 (0.21) 0.19 (0.20) 0.00 (0.00) 0.00 (0.00) 0.00 (0.00) 0.00 (0.00) n.s.G-b.b.d. 0.47 (0.48) 0.24 (0.25) 0.16 (0.16) 0.03 (0.06) 0.16 (0.17) 0.10 (0.16) n.s.Pancreas 0.48 (0.48) 0.25 (0.26) 0.00 (0.00) 0.03 (0.06) 0.00 (0.00) 0.00 (0.00) n.s.
* p of chi square from log-rank test.

Acknowledgment
This work was supported by the Ministry ofUniversity and Scientific-Technological Research(National project, ‘Epidemiology of non-infectiousdisease’).
References
01. Micheli A, Baldasseroni A, Bruzzi P, et al. La soprav-vivenza per tumori dell’apparato respiratorio: datiitaliani su base di popolazione e confronti inter-nazionali. Ann Ist Sup Sanit 1992; 28: 71–90.
02. Mastrandrea V, Vitali R, La Rosa F, Petrinelli AM.Incidenza e mortalità per tumori maligni in Umbria(1978-1982). Regione dell’Umbria, Perugia, 1988.
03. Waterhouse J, Muir C, Shanmugaratnam K, PowellJ. Cancer incidence in five continents. Lyon: WHO,1982.
04. WHO Manual of the international statistical classifi-cation of diseases, injuries and causes of death. NinthRevision, Geneva: WHO, 1977 (Vol. 1.).
05. Kaplan EL, Meier P. Nonparametric estimation fromincomplete observation. J Am Statist Ass 1958; 53:457–481.
06. La Rosa F, Saltalamacchia G. SURVIVAL: un pro-gramma in BASIC per il calcolo ed il confronto di
curve di sopravvivenza. Quad Oncol 1992; 2: 315–319.
07. Mantel N. Evaluation of survival data and two newtank order statistics arising in its consideration. CancerChemother Rep 1968; 50: 163–170.
08. Estève J, Benhamou E, Raymond L. Méthodesstatistiques en épidémiologie descriptive. Pans: Ed.INSERM, 1993.
09. Conti EMS, Ramazzotti V, Romagnoli L, et al. Lasopravvivenza per tumore maligno rilevata dalRegistro tumori di popolazione della provincia diLatina. Progetto salute 1992; 8: 6–20.
10. Gafà L, Amendola P, Dardanoni D, Dardanoni L.Survival of patients with cancer of the stomach, colonand rectum, lung and breast in Ragusa, Italy. Tumori1991; 77: 7–11.
11. Berrino f, Sant M, Verdecchia a, et al. Survival ofcancer patients in Europe. The EUROCARE Study.IARC sc. Publ. No. 132. Lyon: WHO, 1995.
12. De Leon P, Sant M, Micheli A, et al. Clinical andpathologic prognostic indicators in colorectal cancer.Cancer 1992; 69: 626–635.
Address for correspondence: Prof. Francesco La Rosa,Department of Hygiene, Perugia University, via delGiochetto, I-06126 Perugia, ItalyFax: +39 75 5853317
13
Table 5. Relative survival rates, at five years, in Umbria region and in European registries*
Registries Period of Oesophagus Stomach Colon Rectum Pancreasdiagnosis
M M F M F M F M F
Umbria 1978–82 0.11 0.25 0.29 0.50 0.55 0.47 0.56 0.00 0.01Italian registries 1978–85 0.04 0.19 0.21 0.42 0.45 0.35 0.36 0.01 0.08Denmark 1978–84 0.05 0.13 0.15 0.38 0.40 0.37 0.41 0.02 0.01Dutch registries 1978–85 0.07 0.21 0.21 0.50 0.49 0.41 0.47 0.05 0.06English registries 1978–84 0.05 0.09 0.09 0.35 0.34 0.36 0.36 0.02 0.02Estonia 1978–84 0.03 0.18 0.17 0.40 0.36 0.30 0.39 0.01 0.02Finland 1978–84 0.07 0.19 0.18 0.49 0.47 0.43 0.46 0.02 0.02French registries 1978–85 0.05 0.20 0.21 0.45 0.46 0.39 0.45 0.03 0.06German registries 1978–84 0.07 0.23 0.22 0.48 0.42 0.40 0.42 0.06 0.04Polish registries 1978–84 0.00 0.09 0.17 0.21 0.23 0.15 0.26 0.07 0.06Scotland 1978–82 0.05 0.08 0.09 0.38 0.34 0.31 0.3 0.04 0.04Spanish registries 1980–85 – 0.15 0.22 0.46 0.43 0.35 0.36 – –Swiss registries 1978–84 0.06 0.26 0.24 0.51 0.57 0.50 0.57 0.03 0.02European registries 1978–85 0.05 0.17 0.19 0.43 0.41 0.36 0.40 0.03 0.05
* From Berrino et al. [11].