TEMPORAL SOCIAL NETWORK ANALYSIS FOR HISTORIANS A … · network based on graph theory. In...
11
TEMPORAL SOCIAL NETWORK ANALYSIS FOR HISTORIANS A Case Study John Haggerty and Sheryllynne Haggerty* School of Computing, Science & Engineering, University of Salford, Salford, Greater Manchester, M5 4WT, U.K. *School of History, University of Nottingham, University Park, Nottingham, NG7 2RD, U.K. Keywords: Social network analysis, Information visualisation, Case study. Abstract: Social network analysis has received much attention across disciplines. Recently, historians have begun to complicate their understanding of networks and are increasingly using visualisation to elucidate tangible and intangible information in their data sets. Current approaches make use of static social network analysis and whilst they provide a number of tools to explore a social network, they are unable to provide temporal analysis. This paper presents Matrixify, a practical visual application for the exploratory temporal analysis of social networks for historians and others not familiar with visual representations of data. This approach aims to deconstruct the complexity of social networks to provide a temporal analysis to answer a key problem in historical studies, that of ‘analysis of change over time’. In this way, historians are able to identify real relationships in their data sets; actors in contact at a particular point in time and shown over time. The case study presented in this paper demonstrates the applicability of the approach in inter- disciplinary studies. 1 INTRODUCTION Social networks and their visual analysis have received much attention across disciplines. Much of this interest is due to the explosion of social network services and the adoption of sociological concepts in the arts. Therefore, particular disciplines, such as History, have become increasingly interested in the results that can be obtained by performing social network analysis on their data. A social network is a group of actors that are defined by their relationships to each other and the network itself. These relationships are forged through endogenous and exogenous events affecting the network. These events may provide or be supported by qualitative data to elucidate how these events affect the dynamics of the group, and in turn, the network’s reactions to such events. Social networks are complex as they represent both tangible information (i.e. events within the network, time of event, etc.) and intangible information (i.e. relationships between actors, actors’ involvement within the network, etc.). As Churchill and Halverson (2005) note, much social network analysis is relational rather than attribute based. In addition, networks may be present in many forms, for example, online communities, business networks or social contacts. Moreover, an actor will have a presence in a variety of networks representing different facets of their social existence. Many historical studies have presented a benign view of networks based on familial, ethnic and religious networks to reduce moral hazard (see for example, Hamilton, 2005; Mathias, 2000; Walvin, 1997). More recently however, historians have started to complicate their conceptions of networks and have begun to look at more formal and civic arenas especially within an urban environment. Studies, such as Lipp (2005), Carlos et al (2008) and Haggerty and Haggerty (2010), have visualised and measured networks in an attempt to understand their dynamics. These studies use static network analysis tools i.e. node-link visualisations. Such applications focus on quantitative analysis by deriving statistics, extracting or fitting models and calculating metrics. However, an important question in historical studies, that of ‘analysis of change over time’, is not sufficiently answered using such applications. Therefore, this discipline has a requirement to visualise and explore social network data beyond this static representation. This paper presents Matrixify, a practical visual 207 Haggerty J. and Haggerty S.. TEMPORAL SOCIAL NETWORK ANALYSIS FOR HISTORIANS - A Case Study. DOI: 10.5220/0003315802070217 In Proceedings of the International Conference on Imaging Theory and Applications and International Conference on Information Visualization Theory and Applications (IVAPP-2011), pages 207-217 ISBN: 978-989-8425-46-1 Copyright c 2011 SCITEPRESS (Science and Technology Publications, Lda.)
Transcript of TEMPORAL SOCIAL NETWORK ANALYSIS FOR HISTORIANS A … · network based on graph theory. In...

TEMPORAL SOCIAL NETWORK ANALYSIS FOR HISTORIANS A Case Study
John Haggerty and Sheryllynne Haggerty* School of Computing, Science & Engineering, University of Salford, Salford, Greater Manchester, M5 4WT, U.K.
*School of History, University of Nottingham, University Park, Nottingham, NG7 2RD, U.K.
Keywords: Social network analysis, Information visualisation, Case study.
Abstract: Social network analysis has received much attention across disciplines. Recently, historians have begun to complicate their understanding of networks and are increasingly using visualisation to elucidate tangible and intangible information in their data sets. Current approaches make use of static social network analysis and whilst they provide a number of tools to explore a social network, they are unable to provide temporal analysis. This paper presents Matrixify, a practical visual application for the exploratory temporal analysis of social networks for historians and others not familiar with visual representations of data. This approach aims to deconstruct the complexity of social networks to provide a temporal analysis to answer a key problem in historical studies, that of ‘analysis of change over time’. In this way, historians are able to identify real relationships in their data sets; actors in contact at a particular point in time and shown over time. The case study presented in this paper demonstrates the applicability of the approach in inter-disciplinary studies.
1 INTRODUCTION
Social networks and their visual analysis have received much attention across disciplines. Much of this interest is due to the explosion of social network services and the adoption of sociological concepts in the arts. Therefore, particular disciplines, such as History, have become increasingly interested in the results that can be obtained by performing social network analysis on their data.
A social network is a group of actors that are defined by their relationships to each other and the network itself. These relationships are forged through endogenous and exogenous events affecting the network. These events may provide or be supported by qualitative data to elucidate how these events affect the dynamics of the group, and in turn, the network’s reactions to such events. Social networks are complex as they represent both tangible information (i.e. events within the network, time of event, etc.) and intangible information (i.e. relationships between actors, actors’ involvement within the network, etc.). As Churchill and Halverson (2005) note, much social network analysis is relational rather than attribute based. In addition, networks may be present in many forms,
for example, online communities, business networks or social contacts. Moreover, an actor will have a presence in a variety of networks representing different facets of their social existence.
Many historical studies have presented a benign view of networks based on familial, ethnic and religious networks to reduce moral hazard (see for example, Hamilton, 2005; Mathias, 2000; Walvin, 1997). More recently however, historians have started to complicate their conceptions of networks and have begun to look at more formal and civic arenas especially within an urban environment. Studies, such as Lipp (2005), Carlos et al (2008) and Haggerty and Haggerty (2010), have visualised and measured networks in an attempt to understand their dynamics. These studies use static network analysis tools i.e. node-link visualisations. Such applications focus on quantitative analysis by deriving statistics, extracting or fitting models and calculating metrics. However, an important question in historical studies, that of ‘analysis of change over time’, is not sufficiently answered using such applications. Therefore, this discipline has a requirement to visualise and explore social network data beyond this static representation.
This paper presents Matrixify, a practical visual
207Haggerty J. and Haggerty S..TEMPORAL SOCIAL NETWORK ANALYSIS FOR HISTORIANS - A Case Study.DOI: 10.5220/0003315802070217In Proceedings of the International Conference on Imaging Theory and Applications and International Conference on Information Visualization Theoryand Applications (IVAPP-2011), pages 207-217ISBN: 978-989-8425-46-1Copyright c 2011 SCITEPRESS (Science and Technology Publications, Lda.)

application for the exploratory temporal analysis of social networks for historians. Matrixify aims to answer the needs of historians and their requirement to analyse change over time by highlighting ‘real’ relationships; actors in contact at a particular point in time and shown over a period of time. It provides an interactive visualisation of time-varying (social) network data for users to interact with. This interaction can provide new questions for historians. Importantly, it identifies macro trends in larger networks to meet the shortcomings of static social network analysis tools. It therefore aims to visualise and provide an interface for exploratory analysis of both tangible and intangible information, as opposed to being a ‘measurement’ tool. Matrixify has been designed from an interdisciplinary perspective, keeping the literature and discipline problems of historians, social scientists and computer scientists in mind. In order to demonstrate the applicability of the approach, the case study (Membership of the Company of Merchants Trading to Africa from Liverpool) presents the questions raised by an historian using Matrixify. These issues were not identifiable in a previous study of this historical data set which used a static social network analysis approach (Haggerty and Haggerty, forthcoming).
This paper is organised as follows. Section 2 discusses related work in the disciplines of social science, history and computer science. Section 3 presents an overview of Matrixify. Section 4 discusses historical data sets and their issues for computer scientists. Section 5 presents a case study using Matrixify for the exploratory analysis of an historical social network and the new questions raised by an historian using this approach. Finally, we make our conclusions and discuss further work.
2 RELATED WORK
The interaction and dynamics of social networks has for a long time been of interest in inter-disciplinary research, and in particular, the social sciences. For example, Granovetter (1973) highlights the strength of weak ties in which these relationships provide new and better opportunities within a network. Freeman (1978/79) suggests that an understanding of centrality within social networks may provide social science researchers with an understanding of the dynamics of those groups under investigation. Research conducted by Lawler and Yoon (1996) focuses on commitment and power in exchange relationships. This research attempts to predict how and when people in an exchange become committed
to their relationship. Therefore, there is a rich literature from which other disciplines may learn and incorporate into their own research.
Historians have been using networks as an analytical tool for some time. This is a worthwhile exercise because contemporaries also realised the value of networks, even if they called their contacts ‘friends’ or ‘correspondents’ (Hancock, 2005). However, it is only recently that this community have started to use visualisation combined with statistical analysis. For example, Carlos et al (2008) used social network visualisation tools to analyse 16th Century Jewish merchants’ networks. Haggerty and Haggerty (2010) visualise an 18th Century Jamaican merchant’s account book to identify investment groups within Liverpool, UK, and measured the relationships using graph theory to highlight key actors. Erikson and Bearman (2006) highlighted the role of East Indian Company employees in the extension of business networks in Asia. The use of information visualisation for analysis is set to expand within this discipline over the coming years.
Current tools for social network analysis often provide static visualisations. Applications such as Pajek (Vlado, 2010) or SocNetV (Kalamaras, 2010) visualise network information via the connection of vertices through arcs and edges. Once produced, the network and the relationships between actors may be viewed. These applications provide various tools for measuring networks. For example, SocNetV provides a number of measures and layouts for analysing actors’ power and centrality within the network based on graph theory. In addition, weighting may be applied to network edges to represent strength of ties. The use of weighting (for example by value or frequency) provides a deeper analysis (Perer and Schneiderman, 2009). Due to scalability issues in these visualisations where large graphs soon become counter-intuitive, other approaches to network visual representation have been proposed. For example, Lee et al (2006) propose TreePlus, a tree layout approach to explore social networks. These trees can be expanded or reduced to provide a more intuitive view of larger networks.
The common issue with static social network visualisations is that obviously they do not represent temporal changes in the network, including an individual actor’s engagement. As discussed above, this is a key concern for historians. Abello and Korn (2002) suggest MGV, a system for the analysis of large data sets. This approach takes underlying data and represents it in a variety of ways, such as
IVAPP 2011 - International Conference on Information Visualization Theory and Applications
208

location-based graph sketch, needle grid view and multicomb view. Falkowski et al (2006) suggest an approach for analysis of subgroup evolution in social networks. This approach uses a number of views to facilitate analysis, and displays the network in a graph, such as those used in static approaches, but laid out along a temporal plain. Hu and Gong (2010) present a visualisation of individuals’ spatial-temporal social networks through three-dimensional graphs. Belingerio et al (2010) use three-dimensional graphs combined with hierarchical trees to identify eras in social networks.
A common issue with these approaches is that their visualisation of the network may require an understanding of how they should be read which is difficult for users not familiar with visual representations of data. Therefore, Matrixify aims to simplify the visualisation so that historians may focus on elucidating and interpreting the information that they require. This is achieved using a matrix view of the data. Matrices for analysis of social networks have been proposed previously. For example, Snasel et al (2009) propose the use of Galois lattices for social network analysis. However, their experiment analyses only a small-scale network comprising 18 actors over 14 social events and the visualisation is unable to track single actor involvement, their role within the network or provide exploratory tools for further analysis. GeneaQuilts (Bezerianos et al, 2010) is a system for exploring large genealogical data sets presenting information in a sophisticated matrix visualisation. Alternatively, NodeTrix (Henry et al, 2007) combines matrices with node-link graphs. However, both these approaches focus on identifying communities, actors and roles rather than network involvement, development and change over time, a key requirement of historians. Telea and Voinea (2009) use a matrix-style visualisation on time-series data. However, this approach focuses on software maintenance decisions and project management rather than social network development.
3 MATRIXIFY
This section presents an overview of Matrixify. First, we discuss the design goals, particularly in relation to historians’ requirements. We then present the application and its key features.
A social network comprises a set or sets of actors that are defined by their relationships. As Wasserman and Faust (1994) note, it is these relationships that are the defining feature of a
network. However, it is the events in the network that create these relationships and affect actor behaviour. These events ensure that networks are not static (Lawler and Yoon, 1996). Burt (2004) has also suggested that bridges or brokers in networks have the potential to best synthesize information and thereby have good ideas. Networks are also instrumental and people engage with them for different purposes and at different times of their life cycle or career path (Renzulli et al, 2000). Therefore, static network analysis visualisations do not meet historians’ requirements to address the issue of change over time.
Social networks are complex due to the interplay between actors, events, content and relationships. Matrixify attempts to deconstruct this complexity to present a simplified view of the network, i.e. a visualisation of dynamic data, for historians to explore. The design goals of the application have been derived from discussions with historians and the findings of previous work by the authors. They are as follows:
Visualise temporal events in a network. In this way, the key issue of change over time can be addressed.
Aid exploratory visual analysis of historical data. Matrixify is designed to produce an interface for exploratory analysis rather than presentation or measurement.
No scripting. Historians with a basic computer literacy, for example, the ability to use a spreadsheet to format data, should be able to use this application.
Sophisticated network analysis with a simple interface. Simple data representation aids the analysis process as users unfamiliar with visual approaches are able to focus on this activity rather than trying to interpret the visualisation.
Assess individuals or groups of actors and their pattern of network membership. Historians often want to highlight the role of individuals or groups of individuals within a network. This identification of their actors of interest aids their assessment of actors’ role(s) in the wider network.
Visual clues to identify global network trends. Use visual representations of data to provide a global view of the network.
View network events and their impact on the network. Historians have a wide range of cases that would constitute a network event and the software should be able to adapt to their needs.
TEMPORAL SOCIAL NETWORK ANALYSIS FOR HISTORIANS - A Case Study
209
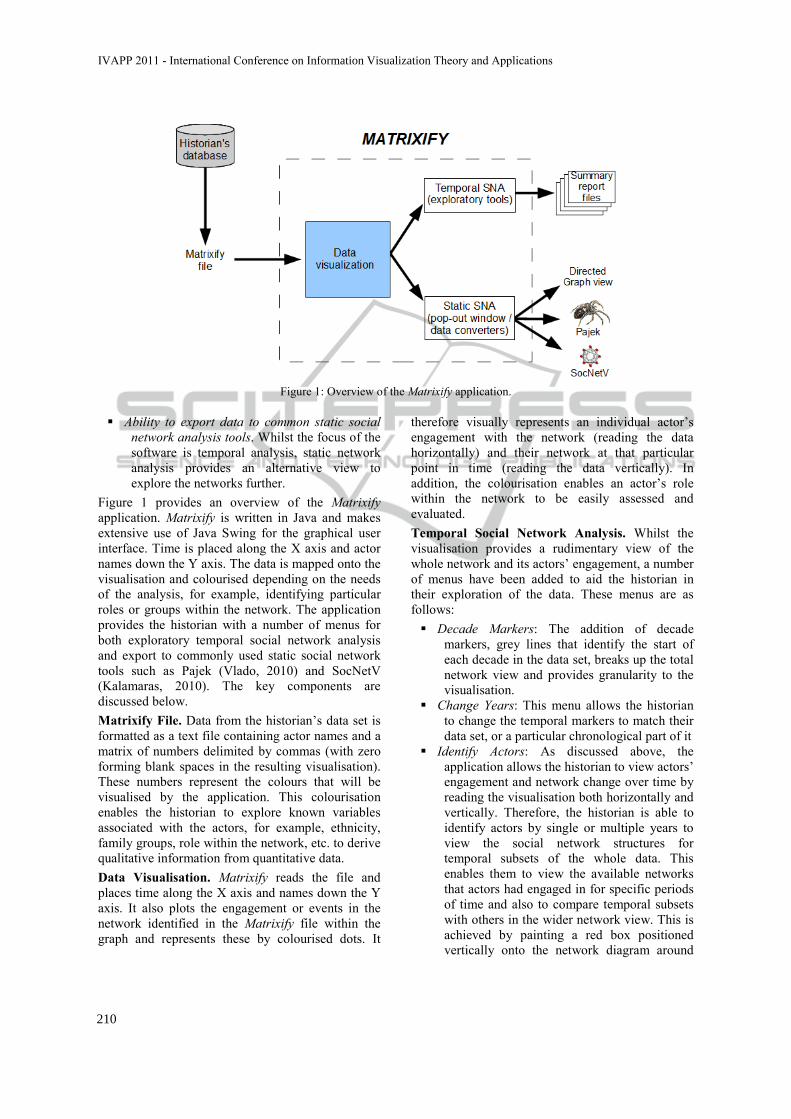
Figure 1: Overview of the Matrixify application.
Ability to export data to common static social network analysis tools. Whilst the focus of the software is temporal analysis, static network analysis provides an alternative view to explore the networks further.
Figure 1 provides an overview of the Matrixify application. Matrixify is written in Java and makes extensive use of Java Swing for the graphical user interface. Time is placed along the X axis and actor names down the Y axis. The data is mapped onto the visualisation and colourised depending on the needs of the analysis, for example, identifying particular roles or groups within the network. The application provides the historian with a number of menus for both exploratory temporal social network analysis and export to commonly used static social network tools such as Pajek (Vlado, 2010) and SocNetV (Kalamaras, 2010). The key components are discussed below. Matrixify File. Data from the historian’s data set is formatted as a text file containing actor names and a matrix of numbers delimited by commas (with zero forming blank spaces in the resulting visualisation). These numbers represent the colours that will be visualised by the application. This colourisation enables the historian to explore known variables associated with the actors, for example, ethnicity, family groups, role within the network, etc. to derive qualitative information from quantitative data. Data Visualisation. Matrixify reads the file and places time along the X axis and names down the Y axis. It also plots the engagement or events in the network identified in the Matrixify file within the graph and represents these by colourised dots. It
therefore visually represents an individual actor’s engagement with the network (reading the data horizontally) and their network at that particular point in time (reading the data vertically). In addition, the colourisation enables an actor’s role within the network to be easily assessed and evaluated. Temporal Social Network Analysis. Whilst the visualisation provides a rudimentary view of the whole network and its actors’ engagement, a number of menus have been added to aid the historian in their exploration of the data. These menus are as follows:
Decade Markers: The addition of decade markers, grey lines that identify the start of each decade in the data set, breaks up the total network view and provides granularity to the visualisation.
Change Years: This menu allows the historian to change the temporal markers to match their data set, or a particular chronological part of it
Identify Actors: As discussed above, the application allows the historian to view actors’ engagement and network change over time by reading the visualisation both horizontally and vertically. Therefore, the historian is able to identify actors by single or multiple years to view the social network structures for temporal subsets of the whole data. This enables them to view the available networks that actors had engaged in for specific periods of time and also to compare temporal subsets with others in the wider network view. This is achieved by painting a red box positioned vertically onto the network diagram around
IVAPP 2011 - International Conference on Information Visualization Theory and Applications
210

the temporal subset. However, the historian may also wish to analyse actors’ roles developing or changing in the network. Therefore, they are able to highlight individual or multiple actors. This is achieved by placing a red box positioned horizontally by selected actors across the network diagram.
List Actors: The historian may wish to view all the names of actors engaged within the network during temporal subsets to identify actors of interest. Data is read vertically and corresponding names are output to a pop out window. This can be viewed by year or multiple years.
Actor Totals: In some cases, the historian may wish to view the total number of actors engaging within the network during temporal subsets. Therefore, data is again read vertically to count the total actors engaged within the network during each year. This is then output to a pop out window showing totals by year. Historians can view either a single year or multiple years.
Pop-out Directed Graph view: The historian may wish to view a subset of the data in a node-link representation as used in static social network applications. The historian can select the subset that they wish to view in this way and Matrixify provides a pop-out window visualising the network subset. When an actor is selected in this view, their individual links within the network are highlighted.
Static Social Network Analysis. Whilst the aim of Matrixify is to assist historians in their temporal social network analysis, it is recognised that they may also wish to conduct static social network analysis. In this way, they are able to measure the network using tools commonly associated with these approaches, such as viewing centrality measures. Therefore, a menu is available that enables the historian to convert the data viewed in Matrixify to common static social network analysis tools, such as Pajek (Vlado, 2010) and SocNetV (Kalamaras, 2010). This menu produces the files required for network visualisation in these tools automatically, thus reducing the need for historians to learn how to produce these bespoke scripts. Summary Report Files. Whilst the aim of Matrixify is to provide an interface to visually explore data, it is recognised that historians may wish to export some summary findings for use in other applications. Therefore, they are able to export actor totals and actors by single and multiple years to text files.
Figure 2 illustrates the Matrixify view of part of a network. An actor’s involvement with the network is visualised by dots within the visual matrix. Figure 2 demonstrates the data visualisation without any analysis tools applied apart from colourisation by an actor’s role, i.e. the data as it is imported into the application. This data set and colourisation of it will be discussed later in this paper.
Figure 3 demonstrates the use of the analysis tools made available by the application. Decade markers are painted on to the visualisation in grey. Actors have been highlighted in two ways. First, individual actors of interest are highlighted by horizontal red boxes to demonstrate their engagement within the network. Second, the years 1762 to 1768 have been highlighted by a vertical red box to identify the actors involved in the network during this temporal subset.
Figure 4 demonstrates the pop-out window containing the directed graph view of data subsets. As illustrated, more than one pop-out window containing different subsets can be viewed at the same time facilitating comparison between graphs, in this case the years 1750-1753 (background) and 1760-1763 (foreground), both subsets of the data presented in section 5. The graph view shows the number of actors in the network subset visualised and the number of relationships between them. As demonstrated, an actor, once selected, changes colour to red and their direct links with other actors are also highlighted in red. In this way, the historian may explore the connections between actors of interest within the graph.
This section has presented an overview of Matrixify, a temporal social network analysis tool designed for historians and their data. In particular, this tool visualises data for historians to explore. In the next two sections, we discuss historical data sets and present details of our case study.
4 HISTORICAL DATA SETS
It is worth briefly discussing historical data sets to an audience outside this discipline. Historians rely on both quantitative and qualitative data for their studies. Matrixify attempts to provide qualitative information through quantitative data sources, especially useful where qualitative data does not exist. It achieves this by visualising network information, for example, actor relationships or engagement within the network over time. In addition, it identifies network trends in the whole network over time. Current static social network
TEMPORAL SOCIAL NETWORK ANALYSIS FOR HISTORIANS - A Case Study
211

Figure 2: Matrixify raw data visualisation.
Figure 3: Matrixify using analytical tools.
IVAPP 2011 - International Conference on Information Visualization Theory and Applications
212

Figure 4: Matrixify directed graph pop-out window.
analysis tools are unable to meet these requirements With a few exceptions, such as oral, art or media
history projects, most of the data that historians analyse is from contemporary written or printed documents. These documents are stored in archives, and the period of history under study will determine the amount of data available. For example, those studying modern history may have a variety of primary sources and many in easy-to-read, printed form. Those studying medieval history will have far fewer documents, mostly from religious sources and often written in Latin. Thus, many historians collect their data by transcription in archives or through photographs for later transcription or reference. Historians often use common software such as databases or spreadsheets to store their data. These applications allow easy export of existing data to text format to be visualised in Matrixify. However, there is no standardisation in the way data is collected and it is often down to the historian as to what is collected and in which format. Moreover, data sets vary in size, from a few to hundreds of actors. The data set used for the case study in the next section represents a large data set for historians. This leads to a number of issues that must be accounted for by those outside this discipline. First, data is either extant or not. Historical records have been lost through time and historians can only work with the data that has survived. Therefore, they focus on the data itself rather than the algorithms for analysing that data. Second, historical data was created for a particular purpose at a particular point in time in order to meet the social or political
requirements of the day. It therefore has a variety of inherent biases. Furthermore, many data sets that may have been useful to historians were therefore never collected at all. Third, due to the extant data problem, data is finite, therefore mitigating issues of scalability of visualisation approaches that would be encountered in studies of modern social networks such as those identified through electronic means. At the same time, actors cannot be interrogated in order to compensate for lacking data. Finally, data collection is error prone due to a variety of reasons, including: unfamiliar and/or difficult to read handwriting which must be interpreted and collected manually; errors in the translation of languages; printed documents that are unsuitable for scanning; manual errors in transcription or database entry; a lack of ability to check for anomalies in the data, for example, in our case study family members with the same name using (or losing) junior or senior for identification of an individual.
5 CASE STUDY
This section presents a case study using Matrixify for visualisation and analysis of social networks identified in historical data sets. In particular, the questions and issues raised later in this section are posited by an historian applying the Matrixify approach to data they have collected as part of their research into eighteenth-century business networks. These new questions are of real significance to this
TEMPORAL SOCIAL NETWORK ANALYSIS FOR HISTORIANS - A Case Study
213

Figure 5: Static social network analysis of the African Company data in Pajek.
community. The aim of using temporal analysis is to visually
explore the data in order to provide a more nuanced and sophisticated view of the network and identify change over time. It does not aim to answer questions; but to raise questions around the data not evident in other forms. These questions can then, for example, guide the historian to relevant sources of further study or challenge existing hypotheses and theories.
The data we use in this case study is a subset from a larger study of metropolitan business networks in Liverpool between 1750 and 1810 (Haggerty and Haggerty, forthcoming). This study uses static social network analysis tools and techniques to visualise and measure the relationships between actors and networks identified by trade, cultural, political and social institutional membership during this period. This approach highlighted a number of issues which provides the motivation for the development of Matrixify. Moreover, the questions posited by the historian by using the Matrixify approach were not identifiable when using static social network analysis tools in previous work (Haggerty and Haggerty, 2010; Haggerty and Haggerty, forthcoming).
The data that forms the case study is membership of the Company of African Merchants Trading from Liverpool, hereafter referred to as the African Company (Company, 1750-1810). Members’ names were collected from the original historical records for the period and their attendance at meetings was recorded in a spreadsheet. This spreadsheet therefore
represents those actors engaging with that network on an annual basis.
Figure 5 demonstrates the limitations of static network visualisation for the analysis of network membership over time, a key concern for historians. The network is laid out using Kamada-Kawai fixing first and last actors. As can be seen, whilst the network is represented and key actors highlighted, it is difficult to visualise how actors engaged in the network, to what extent they engaged and how this changed over time. In addition, network trends, such as changes to the overall network structure or individual actor engagement over time cannot be ascertained.
Figure 6 visualises the same data using Matrixify. The years are placed on the X axis and actors that engaged with the network during this time are represented on the Y axis by name. Their involvement and role in the network is indicated by coloured dots. Thus, individual engagement with the network is represented horizontally and the networks that were active on a yearly basis are viewed vertically. Decade markers are included to aid reference later in this section.
The African Company was a formal trade association in Liverpool with links to similar societies in London and Bristol. Set up in 1750, it was run by merchants, and represented one of the important trades of the town, the trade to Africa, and in particular the Atlantic slave trade. Whilst it was dominated by slave traders, membership was not exclusive to just those in this trade. Figure 6 illustrates the membership of this trade association.
IVAPP 2011 - International Conference on Information Visualization Theory and Applications
214
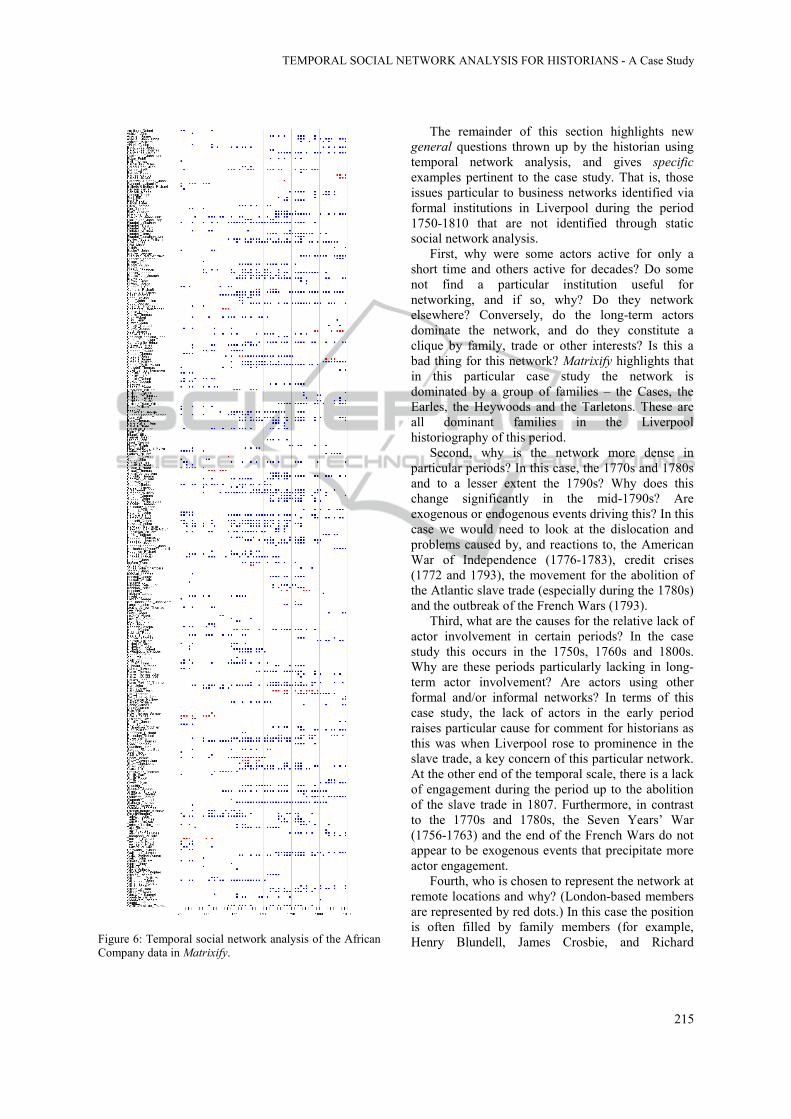
Figure 6: Temporal social network analysis of the African Company data in Matrixify.
The remainder of this section highlights new general questions thrown up by the historian using temporal network analysis, and gives specific examples pertinent to the case study. That is, those issues particular to business networks identified via formal institutions in Liverpool during the period 1750-1810 that are not identified through static social network analysis.
First, why were some actors active for only a short time and others active for decades? Do some not find a particular institution useful for networking, and if so, why? Do they network elsewhere? Conversely, do the long-term actors dominate the network, and do they constitute a clique by family, trade or other interests? Is this a bad thing for this network? Matrixify highlights that in this particular case study the network is dominated by a group of families – the Cases, the Earles, the Heywoods and the Tarletons. These are all dominant families in the Liverpool historiography of this period.
Second, why is the network more dense in particular periods? In this case, the 1770s and 1780s and to a lesser extent the 1790s? Why does this change significantly in the mid-1790s? Are exogenous or endogenous events driving this? In this case we would need to look at the dislocation and problems caused by, and reactions to, the American War of Independence (1776-1783), credit crises (1772 and 1793), the movement for the abolition of the Atlantic slave trade (especially during the 1780s) and the outbreak of the French Wars (1793).
Third, what are the causes for the relative lack of actor involvement in certain periods? In the case study this occurs in the 1750s, 1760s and 1800s. Why are these periods particularly lacking in long-term actor involvement? Are actors using other formal and/or informal networks? In terms of this case study, the lack of actors in the early period raises particular cause for comment for historians as this was when Liverpool rose to prominence in the slave trade, a key concern of this particular network. At the other end of the temporal scale, there is a lack of engagement during the period up to the abolition of the slave trade in 1807. Furthermore, in contrast to the 1770s and 1780s, the Seven Years’ War (1756-1763) and the end of the French Wars do not appear to be exogenous events that precipitate more actor engagement.
Fourth, who is chosen to represent the network at remote locations and why? (London-based members are represented by red dots.) In this case the position is often filled by family members (for example, Henry Blundell, James Crosbie, and Richard
TEMPORAL SOCIAL NETWORK ANALYSIS FOR HISTORIANS - A Case Study
215

Gildart). Therefore, were familial connections deemed more trustworthy over non-familial, and perhaps more influential, contacts? Were these strategies successful? And was one more so than the other?
Fifth, how does shifting actor engagement impact on access to information, capital and the ability to react to exogenous events? In this case, how did the finance and networks of slave trade networks change over time and did this affect their strategy and ability to react to credit crises, dislocation caused by war and abolition of the slave trade?
These questions highlighted by the Matrixify visualisation point to a need to conduct research in further areas or themes and particular sources. This is particularly important where there is a lack of qualitative data about a network itself. In this case the historian would want to conduct further research on: the histories of the key families and their networks (through secondary literature, family and business papers); the changing responses to exogenous conditions (through petitions to Parliament, the records of similar associations in London, House of Commons Sessional Papers and Parliamentary Papers); the business networks of the members (through business letters and accounts in Liverpool, London and elsewhere); other institutional membership (other clubs in Liverpool, Town Council, etc.).
Matrixify therefore provides an exploratory tool which highlights actor engagement and key trends in a network. The questions raised by the historian using such an analysis also point to avenues for further research which may provide answers to these questions. This is especially useful where qualitative data is lacking for a particular network; a common issue for historians.
6 CONCLUSIONS & FURTHER WORK
Social network analysis has received much attention across disciplines. The visualisation of networks comprising both tangible and intangible information has enabled researchers to understand how actors use their relationships in their social lives. Recently, historians have started to complicate their understanding of networks in order to analyse their data sets. This paper has presented Matrixify, a temporal social network visualisation approach designed to provide historians with a nuanced and sophisticated view of their networks over time and
by individual actor. It deconstructs the complexity of the network to present a simplified view for historians to explore. In addition, it provides information and raises questions that would not be seen when using static social network analysis.
Further work aims to enhance the exploratory tools available in Matrixify. In particular, further statistical tools and layouts, such as measures of centrality, will be included in both the temporal and directed graph visualisations. In addition, the questions raised by the case study are currently being explored by historians to form part of a wider project in the analysis of eighteenth-century business networks. Matrixify has demonstrated that a simple social network view can provide a wealth of information for the historian to enhance their understanding of the actors identified in their data sets.
REFERENCES
Abello, J., Korn, J., 2002. MGV: A System for Visualizing Massive Multigraphs. In IEEE Transactions on Visualization and Computer Graphics 8(1) pp. 21-38.
Bezerianos, A., Dragicevic, P., Fekete, J.-D., Juhee Bae, Watson, B., 2010. In IEEE Transactions on Visualization and Computer Graphics, 16(6) pp. 1073-1081.
Burt, R. D., 2004. Structural Holes and Good Ideas. In American Journal of Sociology, 10(2) pp. 349-399.
Carlos, A. M., Maguire, K., Neal, L., 2008. ‘A Knavish People…’: London Jewry and the Stock Market During the South Sea Bubble. In Business History 50(6) pp. 728-748.
Churchill, E. F., Halverson, C. A., 2005. Social Networks and Social Networking. In IEEE Internet Computing Sep/Oct 2005 pp. 14-19.
Company, 1750-1810. Minute Book of the African Merchants Trading from Liverpool, unpublished, Liverpool Record Office 352/MD1.
Erikson, E., Bearman, P., 2006. Malfeasance and the Foundations for Global Trade: The Structure of English Trade in the East Indies, 1601-1833. In American Journal of Sociology 112(1) pp. 195-230.
Falkowski, T., Bartelheimer, J., Spiliopoulou, M., 2006. Mining and Visualizing the Evolution of Subgroups in Social Networks. In Proceedings of the International Conference on Web Intelligence, Hong Kong, pp. 52-58.
Freeman, L. C., 1978/79. Centrality in Social Networks. In Social Networks 1 pp. 215-239.
Granovetter, M. S., 1973. The Strength of Weak Ties. In American Journal of Sociology 78(6) pp. 1360-1380.
Haggerty, J., Haggerty, S., 2010. Visual Analytics of an Eighteenth-Century Business Network. In Enterprise and Society 11(1) pp. 1-25.
IVAPP 2011 - International Conference on Information Visualization Theory and Applications
216
Haggerty, J., Haggerty, S., forthcoming. Life Cycle of a Metropolitan Business Network: Liverpool 1750-1810. To appear in Explorations in Economic History.
Hamilton, D. J., 2005. Scotland, the Caribbean and the Atlantic World, 1750-1820, Manchester University Press, Manchester.
Hancock, D., 2005. The Trouble with Networks: Managing the Scots’ Madeira Trade. In Business History Review 79 pp. 467-491.
Henry, N., Fekete, J.-D., McGuffin, M. J., 2007. NodeTrix: A Hybrid Visualization of Social Networks. In IEEE Transactions on Visualization and Computer Graphics, 13(6) pp. 1302-1309.
Hu, B., Gong, J., 2010. Modeling Individual-Based Social Network with Spatial-Temporal Information. In Proceedings of the International Conference on Management and Service Science, Wuhan, China, pp. 1-4.
Kalamaras, D. B., SocNetV. http://socnetv.sourceforge. net, accessed October 2010.
Lawler, E. J., Yoon, J., 1996. Commitment in Exchange Relations: Test of a Theory of Relational Cohesion. In American Sociological Review 61 pp. 89-108.
Lee, B., Parr, C. S., Plaisant, C., Bederson, B. B., Veksler, V. D., Gray, W. D., Kotfila, C., 2006. TreePlus: Interactive Exploration of Networks with Enhanced Tree Layouts. In IEEE Transactions on Visualization and Computer Graphics 12(6) pp. 1414-1426.
Lipp, C., 2005, Kinship Networks, Local Government, and Elections in a Town in Southwest Germany, 1800-1850. In Journal of Family History, 30, pp. 347-365.
Mathias, P., 2000. Risk, Credit and Kinship in Early Modern Enterprise. In McCusker, J.J. and Morgan, K. (eds.) The Early Modern Atlantic Economy, Cambridge University Press, Cambridge.
Perer, A., Schneiderman, B., 2009. Integrating Statistics and Visualization for Exploratory Power: From Long-Term Case Studies to Design Guidelines. In IEEE Computer Graphics and Applications May/Jun pp. 39-51.
Renzulli, L. A., Aldrich, H., Moody, J., 2000. Family Matters: Gender, Networks and Entrepreneurial Outcomes. In Social Forces 79(2) pp. 523-546.
Snasel, V., Horak, Z., Kocibova, J., Abraham, A., 2009. Reducing Social Network Dimensions Using Matrix Factorization Methods. In Proceedings of Advances in Social Network Analysis and Mining, Athens, Greece, pp. 348-351.
Telea, A., Voinea, L., 2009. Case Study: Visual Analytics in Software Product Assessments. In Proceedings of the 5th IEEE International Workshop on Visualizing Software for Understanding and Analysis, Edmonton, Canada, pp. 65-72.
Vlado, A., Pajek. http://vlado.fmf.uni-lj.si/networks/pajek, accessed October 2010.
Walvin, J., 1997. The Quakers: Money and Morals, John Murray, London.
Wasserman, S., Faust, K., 1994. Social Network Analysis: Methods and Applications, Cambridge University Press, Cambridge.
TEMPORAL SOCIAL NETWORK ANALYSIS FOR HISTORIANS - A Case Study
217