
Fish Weighting System
11
Machine Vision-Based Automatic Raw Fish Handling and Weighing System of Taiwan Tilapia Yu-Teng Liang 1,2 and Yih-Chih Chiou 1 1 Institute of Engineering Science, Chung-Hua University, No. 707, Sec.2, WuFu Rd., Hsinchu, 300, Taiwan [email protected] 2 Department of Automation Engineering, Ta Hwa Institute of Technology, No.1, Da-Hua Rd., Qiong-Lin, Hsinchu 30740, Taiwan [email protected] Abstract. This study proposes a vision-based automatic raw fish handling system to speed up fish cleaning and weighing. The proposed fish weighing system used a camera to capture projected images of fishes. Applying image processing techniques, physical properties of fishes, such as length, width, perimeter and area were obtained. Followed by regression analysis, weight- length, weight-height, weight-perimeter and weight-area relationships were derived. Analysis results of fifty tilapias show that coefficient of determination of the regression equation relating weight and area is 0.9303. The high value suggests that a tilapia’s weight is highly correlated with its projected area. Therefore, use a tilapia’s area to estimate its weight is justifiable. Keywords: Machine Vision, Raw Fish Handling, Fish Weighing, Regression Analysis, Tilapia. 1 Introduction For some years now, there have been both an increased demand for, and value attributed to higher quality of Taiwan tilapia. Tilapia of the 21 st century is a valuable food fish. Typical demands include high economic worth and high protein content; it becomes a major source of animal proteins for human being. In view of that, the food and agriculture organization of the united nation is currently promoting the farming of tilapia intensively. Thus, we can foresee that farmed tilapia will play an important role in food fishes. Machine vision, an important technique for inspection, measurement, sorting, remote sensing, surveillance, etc., has been extensively used in manufacturing and food industries. In addition, machine vision technique also has been used in agriculture and fishery industries for sizing, counting, weighing, grading, recognition, classification, and monitoring [1-3]. During biology study physical properties, such as length, width, thickness, area, weight, volume, perimeter, compactness and circularity are commonly used as a basis for sizing [4-7], weighing [8-10], grading [11, 13], or classification [14-16]. Martinez presents new low-cost systems for the automation of some fish farm operations. Particularly, computer vision is applied to non-contact fish
-
Upload
sachinvasudev -
Category
Documents
-
view
20 -
download
0
Transcript of Fish Weighting System

5/17/2018 Fish Weighting System - slidepdf.com
http://slidepdf.com/reader/full/fish-weighting-system 1/10
B.-C. Chien et al. (Eds.): IEA/AIE 2009, LNAI 5579, pp. 711–720, 2009.© Springer-Verlag Berlin Heidelberg 2009
Machine Vision-Based Automatic Raw Fish Handling
and Weighing System of Taiwan Tilapia
Yu-Teng Liang1,2 and Yih-Chih Chiou1
1 Institute of Engineering Science, Chung-Hua University,
No. 707, Sec.2, WuFu Rd., Hsinchu, 300, Taiwan
[email protected] Department of Automation Engineering, Ta Hwa Institute of Technology,
No.1, Da-Hua Rd., Qiong-Lin, Hsinchu 30740, Taiwan
Abstract. This study proposes a vision-based automatic raw fish handling
system to speed up fish cleaning and weighing. The proposed fish weighing
system used a camera to capture projected images of fishes. Applying image
processing techniques, physical properties of fishes, such as length, width,
perimeter and area were obtained. Followed by regression analysis, weight-
length, weight-height, weight-perimeter and weight-area relationships were
derived. Analysis results of fifty tilapias show that coefficient of determination
of the regression equation relating weight and area is 0.9303. The high value
suggests that a tilapia’s weight is highly correlated with its projected area.Therefore, use a tilapia’s area to estimate its weight is justifiable.
Keywords: Machine Vision, Raw Fish Handling, Fish Weighing, Regression
Analysis, Tilapia.
1 Introduction
For some years now, there have been both an increased demand for, and valueattributed to higher quality of Taiwan tilapia. Tilapia of the 21st century is a valuablefood fish. Typical demands include high economic worth and high protein content; itbecomes a major source of animal proteins for human being. In view of that, the foodand agriculture organization of the united nation is currently promoting the farming of tilapia intensively. Thus, we can foresee that farmed tilapia will play an important rolein food fishes.
Machine vision, an important technique for inspection, measurement, sorting,remote sensing, surveillance, etc., has been extensively used in manufacturing andfood industries. In addition, machine vision technique also has been used in
agriculture and fishery industries for sizing, counting, weighing, grading, recognition,classification, and monitoring [1-3]. During biology study physical properties, such aslength, width, thickness, area, weight, volume, perimeter, compactness and circularityare commonly used as a basis for sizing [4-7], weighing [8-10], grading [11, 13], orclassification [14-16]. Martinez presents new low-cost systems for the automation of some fish farm operations. Particularly, computer vision is applied to non-contact fish
5/17/2018 Fish Weighting System - slidepdf.com
http://slidepdf.com/reader/full/fish-weighting-system 2/10
712 Y.-T. Liang and Y.-C. Chiou
weight estimation. White Trials of a computer vision machine (The Catch Meter) foridentifying and measuring different species of fish. Shieh and Petrell adoptedstereographic video technique to size salmons. Buckingham used machine visiontechnique to cut fish head off.
Tilapias are sold by their weights; as a result, it is necessary to develop a quick andaccurate weighing method. Currently fish weighting is carried out manually using aweighing scale. Manual weighing is indeed an accurate means, but it is manual andtime-consuming. To automate fish weighing, Mathiassen describe a proof-of-conceptprototype of an automated system for weight and quality grading of pelagic fish usinga multi-modal machine vision system combined with robotized sorting. Omar presentsan optimal portion control technique for food processing which is being developeddepends on fast on-line measurement of the weight distribution of each incoming fooditem. Line developed three models to estimate fish mass using truss lengths. Although
much work has been done on examining the weight-length relationship of salmons,little attention has been devoted to explore the weight-area relationship. Moreimportantly, tilapia is the most popular fish of cultivating kind in Taiwan. Therefore,the purpose of the study was to investigate the relationship between weight and areaof tilapias using regression analysis and then use the derived relationship to establisha quick and accurate vision-based fish weighing system.
2 Materials and Methods
2.1 Fish and Fish Sampling
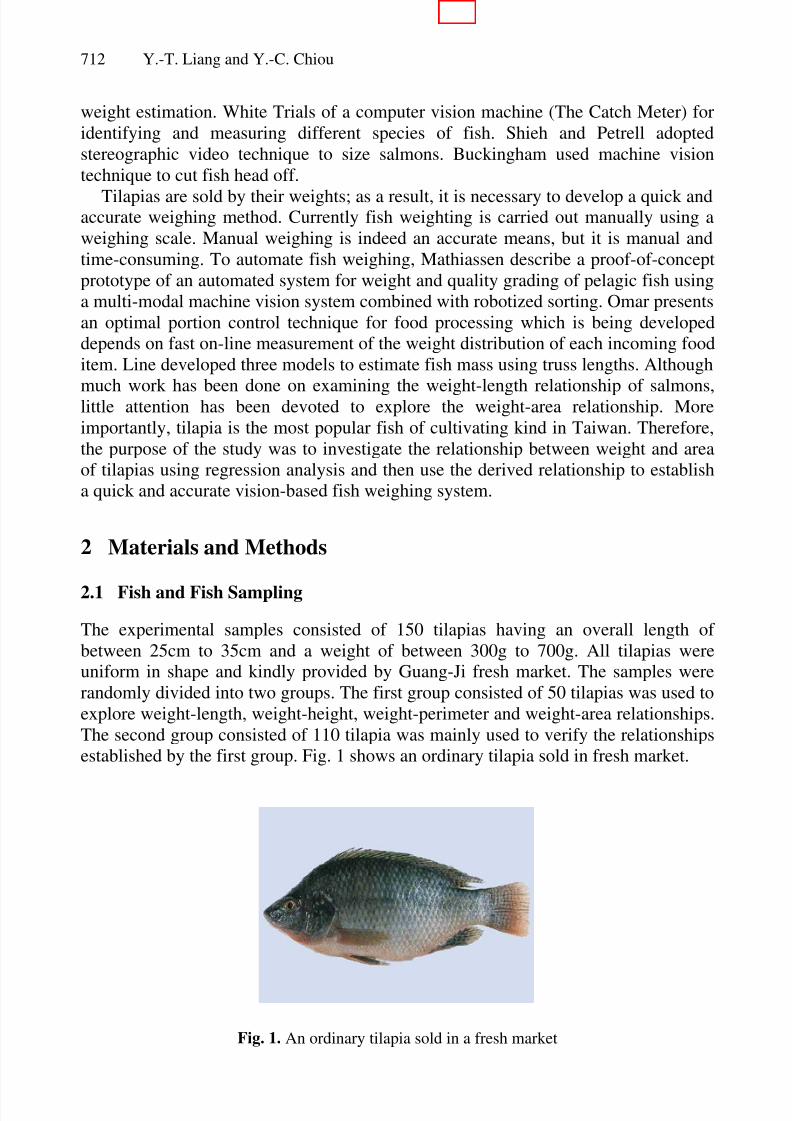
The experimental samples consisted of 150 tilapias having an overall length of between 25cm to 35cm and a weight of between 300g to 700g. All tilapias wereuniform in shape and kindly provided by Guang-Ji fresh market. The samples wererandomly divided into two groups. The first group consisted of 50 tilapias was used toexplore weight-length, weight-height, weight-perimeter and weight-area relationships.The second group consisted of 110 tilapia was mainly used to verify the relationshipsestablished by the first group. Fig. 1 shows an ordinary tilapia sold in fresh market.
Fig. 1. An ordinary tilapia sold in a fresh market

5/17/2018 Fish Weighting System - slidepdf.com
http://slidepdf.com/reader/full/fish-weighting-system 3/10
Machine Vision-Based Automatic Raw Fish Handling and Weighing System 713
2.2 Hardware and Software
Fig. 2 shows the schematic diagram of the proposed automatic fish handling system.Although the system consists of two major sub-systems: raw fish cleaning system
(consists of a input slot①
, a processing platform②
, a output slot③
, a group of fishscaler
④
, a group of conveyer belts⑤
, a rotating knife⑥
Machine structure⑦
, a
Cistern ⑧ .) and machine vision-based weighing system. The fluorescent illuminatorhas a back lighting through which the camera can acquire image for measuring thephysical properties of the fish. The physical properties used in the study include body-length, height, perimeter, area, weight and relationships among these; however, wewill devote our discussion mainly to the research and development of the machinevision-based weighing system. Here, a computer vision algorithm was designed toextract the geometrical features of tilapia.
Fig. 2. Schematic diagram of the automatic raw fish handling system
2.3 Raw Fish Cleaning System
The major functions of the raw fish cleaning system include scaling, gutting, andrinsing. Scaling is a process to scrape the scales off the tilapias by using a fish scaler.Gutting is a process to open tilapia’s belly using a sharp rotating knife and then pull out
its innards (take out viscera). The rinsing process is to wash tilapias, knife, and platformusing a large amount of water. As can be seen, the system was controlled by a PLCconsisting of a CPU, an input module, and an output module. The input module isresponsible for monitoring the signals from proximity sensors, optical sensors, orlimit switches. The output module is responsible for turning on the conveyor, fishscaler, rotating knife and drain valves.
At the beginning, a raw fish is manually put into the sliding slot. Then the fishslides into the processing platform by its own weight. Immediately after optical sensordetects the presence of the fish, the system starts automatically. During its
transportation by means of a conveyor, the fish is scaled off by a descale mechanism.After that, the fish is further transported by a set of transportation wheels. While thefish is transporting, a rotating knife cuts a slit from its anal opening to the gillopenings and the viscera are pulled out. As the fish moves on, another optical sensoris triggered and a water spraying system is actuated subsequently to flush the knifeand the platform. Finally, the fish slides down through the output slot to the vision-

5/17/2018 Fish Weighting System - slidepdf.com
http://slidepdf.com/reader/full/fish-weighting-system 4/10
714 Y.-T. Liang and Y.-C. Chiou
based weighing system. While the fish is sliding, it is thoroughly flushed by anotherwater spraying system; Fig. 3 shows the processing flow of the automatic raw fishhandling system.
Processing ProcedureProximity
Switches
Photoelectric
Sensors
Limit
Switches
Start
Conveyor
Fish Scaler
Rotating Knife
Drain Valve
Sensors Fish CleaningPLC Controller
CPUInput
Module
Output
Module
Power Supply
Machine Vision System
Find Fish
Capture Image
Segmented Image
Morphological
Edge detection
Determine fish area
Fish Weighing
Programming Device
Fig. 3. Processing flow of the raw fish handling system
2.4 Vision-Based Weighing System
Referring to Fig.2, the vision-based weighing system was installed right after the rawfish cleaning system. The machine vision system consists of a CMOS camera, a lens,a fluorescent ring light, and a light controller. The 1280×1024 USB2.0 color CMOS
camera from ARTRAY Japan was used to capture tilapias’ grayscale image of size512×480. The FCL-30D fluorescent ring light was used for illumination. The ringlight has a diameter of 29 mm and provides a maximum lumen of 1400 Lm. The colortemperature is 6200K. The light controller was used to adjust the intensity of the ringlight. In the research, a USAF glass slide resolution target from Edmund Optics was
used in calibration to derive the scale factor (μm/pixel, mm/pixel, cm/pixel, etc) of thevision system. The functioning of a general machine vision-based weighing systemcan subdivide into several steps, as presented in Fig 4.
Fig. 4. Model of a typical machine vision-based weighing system: part 1 - image processing
steps; part 2 - estimate weight steps
2.5 Experimental Method
The experiment is carried out in three phases: In the first phase, the tilapias in bothgroups were measured manually to obtain their weights, lengths, heights, perimeters

5/17/2018 Fish Weighting System - slidepdf.com
http://slidepdf.com/reader/full/fish-weighting-system 5/10
Machine Vision-Based Automatic Raw Fish Handling and Weighing System 715
and areas. Then data from the first group were analyzed using linear regressiontechniques to build the relationships between weight and physical properties. Theobjective of the first phase is to see which relationship is better correlated. In thesecond phase, we used the vision-based weighing system to obtain the weights of the
tilapias in the first group. More specifically, we applied machine vision techniques toacquire the physical properties of each tilapia in the first group and used these data toestimate fish weights. Finally, the weights obtained by the two methods werecompared to reveal the performance of the vision-based weighing system.
Acquire Physical Properties of Tilapias. The physical properties used in the studyinclude length, height, perimeter, area and weight. Both width and height weremeasured using a vernier caliper. In the study, we used a weighing scale to obtain atilapia’s weight. A fish’s area and perimeter was placed on a regular graph paper andits profile was drawn. Then the fish’s area was obtained by accumulating the areaenclosed by the profile of the fish. Here, we defined the length of a tilapia as thehorizontal distance between the tip of its mouth and the farthest point on the caudalfin. The height of a tilapia is defined as the vertical distance between the highest pointof the dorsal fin and lowest point of the ventral fin. Table 1 shows only the areas andthe weights of the 50 tilapias in the first group.
Table 1. Manually measured weights (W) and areas (A) of the 50 tilapias in the first group
No. W(g) A(cm2) No. W(g) A(cm2) No. W(g) A(cm2) No. W(g) A(cm2)
1 388 230.30 14 570 274.25 27 490 242.90 40 638 296.002 428 234.06 15 492 253.58 28 480 252.60 41 602 273.703 352 220.60 16 496 244.89 29 512 255.20 42 600 266.004 374 227.70 17 462 248.10 30 460 233.91 43 616 273.305 450 251.07 18 436 237.16 31 484 248.40 44 584 285.306 462 245.40 19 432 231.26 32 528 254.20 45 482 251.357 332 214.10 20 464 250.66 33 498 2420 46 454 240.088 338 208.20 21 418 235.76 34 442 239.9 47 484 242.999 444 238.35 22 442 234.70 35 610 292.10 48 484 246.30
10 388 231.8 23 408 224.60 36 746 309.80 49 440 230.10
11 408 216.77 24 428 232.06 37 678 296.20 50 388 224.2912 388 231.08 25 558 270.70 38 574 265.9513 360 214.10 26 512 268.30 39 684 308.10
Establish Regression Models. Once required data are carefully measured, the nextstep is to use data of the first group to establish the relationships between weightphysical properties. In the study, we assumed that there are linear relationshipsbetween weight and length, height, perimeters and area. The relationships aregoverned by the following equation:
bmx y += (1)
where x represents the length, the height, the perimeter or the area of a tilapia; y denotes the weight of the tilapia; m and b are the slope and the y-intercept of the best-fit straight line, respectively.

5/17/2018 Fish Weighting System - slidepdf.com
http://slidepdf.com/reader/full/fish-weighting-system 6/10
716 Y.-T. Liang and Y.-C. Chiou
(a) The Relationship between Weight and Length. The relationship between weightand length can be derived by using a scatter diagram. It can be seen from Fig. 5 thatthere exists a positive correlation between tilapia weight (W ) and tilapia length ( L).Through regression analysis, we can identify the exact relationship. As we assume
that the relationship between weight and length is linear, the best-fit linear regressionequation is shown in Eq. (2). It is clear that a tilapia’s weight increases with its overalllength. The symbol R2 is Coefficient of Determination (abbreviated as CoD).Actually, the value of CoD provides us a measure of the strength of the linearrelationship between weight and length of tilapias.
1305.3*59.056 −= LW (2)
Scatter plot of weight versus length
W = 59.056*L - 1305.3
R2 = 0.7851
300400
500600700
26.5 28.5 30.5 32.5
Length (cm)
W e i g h t ( g )
Fig. 5. The linear relationship between the weight (W) and the length (L) of tilapias
(b) The Relationship between Weight and Height. Similarly from the linearregression analysis results of the data collected from the first group, we found thatthere is a positive correlation between the weight (W) and height (H) of a tilapia.Fig. 6 shows the scatter plot of the 40 tilapia and the derived linear regression line.The linear regression equation relating weight and height is shown in Eq. (3). The R2 value is 0.791. As you can see from the plot, a tilapia’s weight also increases linearlywith its height.
538.26*86.995 −= H W (3)
Scatter plot of weight versus height
W = 86.995*H - 538.26
R2 = 0.791
300400500
600700
9.5 10.5 11.5 12.5 13.5
Height (cm)
W e i g h t ( g )
Fig. 6. The linear relationship between the weight (W) and the height (H) of tilapias
(c) The Relationship between Weight and Perimeter. The relationship betweenweight and perimeter can be derived by using a scatter diagram. It can be seen fromFig. 7 that there exists a positive correlation between tilapia weight (W ) and tilapiaperimeter (P). Through regression analysis, we can identify the exact relationship. As

5/17/2018 Fish Weighting System - slidepdf.com
http://slidepdf.com/reader/full/fish-weighting-system 7/10
Machine Vision-Based Automatic Raw Fish Handling and Weighing System 717
we assume that the relationship between weight and perimeter is linear, the best-fitlinear regression equation is shown in Eq. (4). The R2 value is 0.8216.
4.1351*663.21 −= PW (4)
Scatter plot of weight versus perimeter
W = 21.663*P - 1351.4
R2 = 0.8216
300
400500
600
700
70 80 90 100
Perimeter (cm)
W e i g h t ( g )
Fig. 7. The linear relationship between the weight (W) and the perimeter (P) of tilapias
(d) The Relationship between Weight and Area. Based on the linear regressionanalysis result, we found that there is a positive correlation between the weight (W )and the area ( A) of a tilapia. Fig. 8 shows the plot of tilapia weight versus tilapia area.The linear regression equation relating weight and area is shown in Eq. (5).
438.66*3.7074 += AW (5)
It is evident that the weight of a tilapia increases with its area. The R2 value is
0.9722 indicating that 97.22% of the variation in the weight of a tilapia may beexplained by its area. Since CoD is very close to one, it indicates that an excellentlinear reliability exists between the weight and the area of a tilapia.
Scatter plot of weight versus area
W = 3.7074*A - 438.66
R2 = 0.9303
300400500
600700
200 220 240 260 280 300
Area (cm^2)
W e i g h t ( g )
Fig. 8. The linear relationship between the weight (W) and the area (A) of tilapias
(e) Choose a Regression Model for Weighing Tilapias. From the results as shownin Figs. (5) - (8), we found that a tilapia’s weight is linear correlated with its length,height, perimeter and area. However, a tilapia’s area has a greater influence on itsweight. In other words, a tilapia’s weight is more closely related to its area than its
perimeter, length or height. As a result, we decided to use the relation between weightand area to weigh tilapias. In summary, a tilapia’s weight was estimated by pluggingthe area acquired by the machine vision-based weighing system into Eq. (5). Of course, a tilapia’s area will be determined by image processing techniques that will bedescribed in detail in the following section.

5/17/2018 Fish Weighting System - slidepdf.com
http://slidepdf.com/reader/full/fish-weighting-system 8/10
718 Y.-T. Liang and Y.-C. Chiou
3 Results and Discussions
3.1 Weigh by Machine Vision
The object of the current step is to collect area of the individual tilapias in the secondgroup. Once each tilapia’s projected area has been obtained using the vision-basedweighing system, we then made use of the regression equation as shown in Eq.(5) toevaluate its weight. For ease of understanding, the processing flow is divided into thefollowing four steps:
(1) Segment the fish image as shown in Fig. 9a using Otsu’s thresholding method toobtain the resulting binary image shown in Fig. 9b.
(2) Apply morphological closing operation to the binary image to fill small holes andsmooth the profile of the fish. Fig. 9c shows the resulting image.
(3) Determine fish area using blob analysis technique.(4) Plugging a tilapia’s area into Eq. (5) to determine its estimated weight.
(a) (b) (c)
Fig. 9. Image processing steps for the weighing of raw fishes: (a) grabbed image of a tilapiausing a backlighting illumination; (b) Segmented image using Otsu’s thresholding method; (c)Resulting fish image after morphological closing operation
3.2 Comparison Results and Weighing Error Analysis
The system is capable of processing 15 to 20 tilapias per minute. To verify the
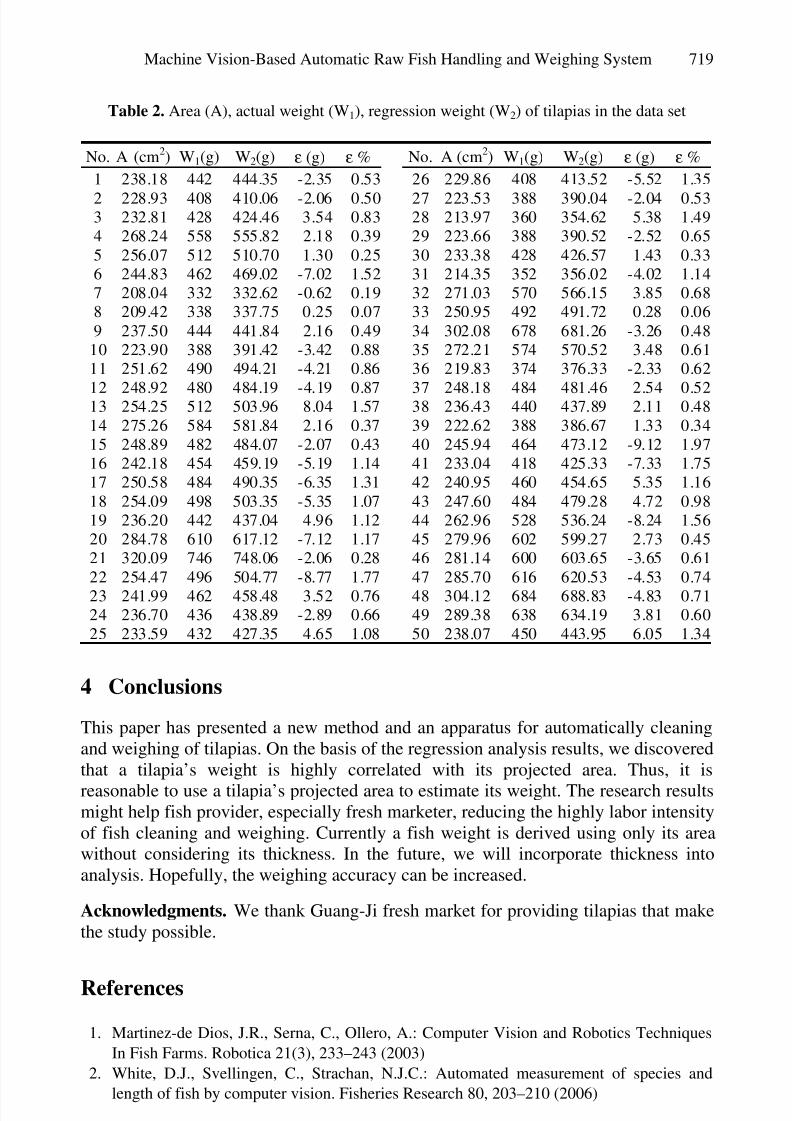
accuracy of the vision-based weighing system, the weighing results of the secondgroup derived in Sections Acquire Physical Properties of Tilapias and Weigh bymachine vision respectively were compared. Table 2 shows a partial list of thecomparison results, where A is the area determined by vision system, W 1 is the weightobtained manually using a weigh scale, W 2 is the weight evaluated by the regression
equation shown in Eq. (5), and ε is the difference between the regressed fish weightand the actual fish weight. For simplicity, let W 1 be the actual fish weight; W 2 be the
regressed fish weight; and ε be the weighing error. Thus ε = W 1 - W 2.As can be seen from Table 2, the maximum weighing error, mean weighing error,
and standard deviation of the weighing error are 9.12g, 1.77g, and 2.21g, respectively.Moreover, the percentage of the maximum error and mean error of the weighing is1.97% and 0.83%, respectively. It is worth mentioning that the low weighting errorsindicate that we can estimate a tilapia’s weight by its area with a maximum error of 1.97% of its actual weight.
5/17/2018 Fish Weighting System - slidepdf.com
http://slidepdf.com/reader/full/fish-weighting-system 9/10
Machine Vision-Based Automatic Raw Fish Handling and Weighing System 719
Table 2. Area (A), actual weight (W1), regression weight (W2) of tilapias in the data set
No. A (cm2) W1(g) W2(g) ε (g) ε % No. A (cm2) W1(g) W2(g) ε (g) ε %
1 238.18 442 444.35 -2.35 0.53 26 229.86 408 413.52 -5.52 1.35
2 228.93 408 410.06 -2.06 0.50 27 223.53 388 390.04 -2.04 0.533 232.81 428 424.46 3.54 0.83 28 213.97 360 354.62 5.38 1.494 268.24 558 555.82 2.18 0.39 29 223.66 388 390.52 -2.52 0.655 256.07 512 510.70 1.30 0.25 30 233.38 428 426.57 1.43 0.336 244.83 462 469.02 -7.02 1.52 31 214.35 352 356.02 -4.02 1.147 208.04 332 332.62 -0.62 0.19 32 271.03 570 566.15 3.85 0.688 209.42 338 337.75 0.25 0.07 33 250.95 492 491.72 0.28 0.069 237.50 444 441.84 2.16 0.49 34 302.08 678 681.26 -3.26 0.48
10 223.90 388 391.42 -3.42 0.88 35 272.21 574 570.52 3.48 0.6111 251.62 490 494.21 -4.21 0.86 36 219.83 374 376.33 -2.33 0.62
12 248.92 480 484.19 -4.19 0.87 37 248.18 484 481.46 2.54 0.5213 254.25 512 503.96 8.04 1.57 38 236.43 440 437.89 2.11 0.4814 275.26 584 581.84 2.16 0.37 39 222.62 388 386.67 1.33 0.3415 248.89 482 484.07 -2.07 0.43 40 245.94 464 473.12 -9.12 1.9716 242.18 454 459.19 -5.19 1.14 41 233.04 418 425.33 -7.33 1.7517 250.58 484 490.35 -6.35 1.31 42 240.95 460 454.65 5.35 1.1618 254.09 498 503.35 -5.35 1.07 43 247.60 484 479.28 4.72 0.9819 236.20 442 437.04 4.96 1.12 44 262.96 528 536.24 -8.24 1.5620 284.78 610 617.12 -7.12 1.17 45 279.96 602 599.27 2.73 0.4521 320.09 746 748.06 -2.06 0.28 46 281.14 600 603.65 -3.65 0.6122 254.47 496 504.77 -8.77 1.77 47 285.70 616 620.53 -4.53 0.7423 241.99 462 458.48 3.52 0.76 48 304.12 684 688.83 -4.83 0.7124 236.70 436 438.89 -2.89 0.66 49 289.38 638 634.19 3.81 0.6025 233.59 432 427.35 4.65 1.08 50 238.07 450 443.95 6.05 1.34
4 Conclusions
This paper has presented a new method and an apparatus for automatically cleaningand weighing of tilapias. On the basis of the regression analysis results, we discoveredthat a tilapia’s weight is highly correlated with its projected area. Thus, it isreasonable to use a tilapia’s projected area to estimate its weight. The research resultsmight help fish provider, especially fresh marketer, reducing the highly labor intensityof fish cleaning and weighing. Currently a fish weight is derived using only its areawithout considering its thickness. In the future, we will incorporate thickness intoanalysis. Hopefully, the weighing accuracy can be increased.
Acknowledgments. We thank Guang-Ji fresh market for providing tilapias that makethe study possible.
References
1. Martinez-de Dios, J.R., Serna, C., Ollero, A.: Computer Vision and Robotics Techniques
In Fish Farms. Robotica 21(3), 233–243 (2003)
2. White, D.J., Svellingen, C., Strachan, N.J.C.: Automated measurement of species and
length of fish by computer vision. Fisheries Research 80, 203–210 (2006)

5/17/2018 Fish Weighting System - slidepdf.com
http://slidepdf.com/reader/full/fish-weighting-system 10/10
720 Y.-T. Liang and Y.-C. Chiou
3. Misimi, E., Mathiassen, J.R., Erikson, U.: Computer Vision-Based Sorting of Atlantic
Salmon (Salmo salar) Fillets According to Their Color Level. Journal of Food
Science 72(1), s30–s35 (2007)
4. Naiberg, A., Petrell, R.J., Savage, C.R., Neufeld, T.P.: Stereo Video Technique to Size
Fish in Sea Cage and Tanks. Aquaculture Engineering, 393–402 (1993)5. Petrell, R.J., Shi, X., Ward, R.K., Naiberg, A., Savage, C.R.: Determining Fish Size and
Swimming Speed in Cages and Tanks Using Simple Video Techniques. Aquaculture
Engineering 16, 63–83 (1997)
6. Shieh, A.C.R., Petrell, R.J.: Measurement of Fish Size in Atlantic Salmon (salmo salar 1.)
Cages Using Stereographic Video Techniques. Aquaculture Engineering 17, 29–43 (1998)
7. Misimi, E., Mathiassen, J.R., Erikson, U., Skavhaug, A.: Computer vision based sorting of
Atlantic salmon (Salmo salar) according to shape and size. In: Proceedings of VISAPP
International Conference on Computer Vision Theory and Applications, Setubal, Portugal,
pp. 265–270 (2006)
8. Omar, F., Silva, C.W.D.: High-speed model-based weight sensing of complex objects withapplication in industrial processes. Measurement 33, 23–33 (2003)
9. Lines, J.A., Tillett, R.D., Ross, L.G., Chan, D., Hockaday, S., McFarlane, N.J.B.: An
Automatic Image-Based System for Estimating the Mass of Free-Swimming Fish.
Computers and Electronics in Agriculture 31, 151–168 (2001)
10. Bailey, D.G., et al.: Three-dimensional Vision for Real time Produce Grading. In: Harding,
K.G., Miller, J.W.V. (eds.) Proceedings of SPIE, Machine Vision and Three-Dimensional
Imaging Systems for Inspection and Metrology II, vol. 4567, pp. 171–178 (2002)
11. Mathiassen, J.R., Jansson, S., Veliyulin, E., Njaa, T., Lonseth, M., Bondo, M., Østvik,
S.O., Risdal, J., Skavhaug, A.: Automatic Weight And Quality Grading Of Whole Pelagic
Fish. In: NFTC 2006 Nor-Fishing Technology Conference, Trondheim, Norway, pp. 1–8
(2006)
12. Croft, E.A., de Silva, C.W., Kurnianto, S.: Sensor Technology Integration in An Intelligent
Machine for Herringroe Grading. IEEE/ASME Transactions on Mechatronics 1(3), 204–
215 (1996)
13. Brosnan, T., Sun, D.W.: Inspection and grading of agricultural and food products by
computer vision systems – a review. Computers and electronics in agriculture 36(2-3),
193–213 (2002)
14. Hu, B.G., Gosine, R.G., Cao, L.X., de Silva, C.W.: Application of a Fuzzy Classification
Technique in Computer Grading of Fish products. IEEE Transactions on FuzzySystems 6(1), 144–152 (1998)
15. Zion, B., Shklyar, A., Karplus, I.: Sorting Fish by Computer Vision. Computers and
Electronics in Agriculture 23(3), 175–187 (1999)
16. Fafioye, O.O., Oluajo, O.A.: Length-weight relationships of five fish species in Epe
lagoon, Nigeria. African Journal of Biotechnology 4(7), 749–751 (2005)