Technoeconomics and Sustainability of Renewable Methanol ... · PDF fileTechnoeconomics and...
12
Research Article Open Access Matzen et al., J Adv Chem Eng 2015, 5:3 DOI: 10.4172/2090-4568.1000128 Volume 5 • Issue 3 • 1000128 J Adv Chem Eng ISSN: 2090-4568 ACE an open access journal Technoeconomics and Sustainability of Renewable Methanol and Ammonia Productions Using Wind Power-based Hydrogen Michael Matzen, Mahdi Alhajji and Yaşar Demirel* Department of Chemical and Biomolecular Engineering, University of Nebraska Lincoln, Lincoln NE 68588, USA Keywords: Electrolytic hydrogen production; Methanol production; Ammonia production; Technoeconomic analysis; Sustainability metrics; Multi-criteria decision matrix Introduction Electrolytic hydrogen using wind power may serve as a feedstock for hydrogenation processes and hence chemical storage for renewable electricity [1-5]. Hydrogen is a clean fuel; its burning causes no harmful emissions; however the cost to produce, store, compress, and transport of the hydrogen is still high [6-12]. Methanol may be used as a fuel and a valuable feedstock for producing methyl t-butyl ether, dimethyl ether, dimethyl carbonate, formaldehyde, acetic acid and other chemical secondary intermediates which are used in producing plywood, particleboard, foams, resins and plastics [13-21]. Methanol production using fossil fuels, mainly from natural gas and coal, is a mature technology [13]. Renewable hydrogen-based methanol as an alternative fuel is widely investigated by researchers worldwide [1,2,13,22-24]. CO 2 may come from flue gas, gasification of biomass, or ethanol plants [1,13,25]. Energy analysis of recycling CO 2 and reaction mechanisms of hydrogenation of CO 2 are some of the efforts toward non-fossil fuel-based methanol as a renewable energy storage and carrier [26-32]. Rihko-Struckmann et al. [33] carried out an energetic evaluation in order to assess the overall efficiency of methanol and hydrogen-based storage systems for renewable electric energy; the efficiency of the system using hydrogen is higher compared with that of using methanol as the storage medium; however, storage and handling of methanol as chemical storage is favorable when compared with H 2 [18-20,33-36]. e utilization of CO 2 as carbon source for chemical synthesis could have a positive but only marginal impact on the global carbon balance [1,14]. Because, we add 3500 million mt CO 2 /year worldwide, while we use only 110 million mt CO 2 /year to produce other chemicals Abstract This study analyzes and compares the economics and sustainability aspects of two hydrogenation processes for producing renewable methanol and ammonia by using wind-power based electrolytic hydrogen. Carbon dioxide from an ethanol plant is used for producing methanol, while the nitrogen is supplied by an Air Separation Unit (ASU) for producing ammonia. The capacities are 99.96 mt/day methanol and 1202.55 mt/day anhydrous ammonia. The methanol plant requires 138.37 mt CO 2 /day and 19.08 mt H 2 /day. The ammonia is synthesized by using 217.72 mt H 2 /day and 1009.15 mt N 2 /day. The production costs and the carbon equivalent emissions (CO 2 e) associated with the methanol and ammonia processes, electrolytic hydrogen production, carbon capture and compression, and ASU are estimated. The integral facilities of both the methanol and ammonia productions are evaluated by introducing a multi-criteria decision matrix containing economics and sustainability metrics. Discounted cash flow diagrams are established to estimate the economic constraints, unit product costs, and unit costs of hydrogen. The hydrogen cost is the largest contributor to the economics of the plants. For the methanol, the values of emissions are -0.85 kg CO 2 e/kg methanol as a chemical feedstock and +0.53 kg CO 2 e/kg methanol as a fuel with complete combustion. For the ammonia, the value of emission is around 0.97 kg CO 2 e/kg ammonia. The electrolytic hydrogen from wind power helps reduce the emissions; however, the cost of hydrogen at the current level adversely affects the feasibility of the plants. A multi-criteria decision matrix shows that renewable methanol and ammonia with wind power-based hydrogen may be feasible compared with the nonrenewable ones and the renewable methanol may be more favorable than the ammonia. *Corresponding author: Yaşar Demirel, Department of Chemical and Biomolecular Engineering, University of Nebraska Lincoln, Lincoln 68588, NE, USA, Tel: +1-402- 472-2745; E-mail: [email protected] Received June 22, 2015; Accepted June 29, 2015; Published July 06, 2015 Citation: Matzen M, Alhajji M, Demirel Y (2015) Technoeconomics and Sustainability of Renewable Methanol and Ammonia Productions Using Wind Power-based Hydrogen. J Adv Chem Eng 5: 128. doi:10.4172/2090-4568.1000128 Copyright: © 2015 Matzen M, et al. This is an open-access article distributed under the terms of the Creative Commons Attribution License, which permits unrestricted use, distribution, and reproduction in any medium, provided the original author and source are credited. (mainly urea); this is only around 3% usage of the CO 2 as feedstock [1,2,14,20,30]. On the other hand, the utilization of CO 2 in the fuel production or as a chemical storage of energy, such as methanol, could make a significantly larger impact, as only 16.8% of the world oil consumption was used in 2007 for non-energy purposes [14,17,36]. Like methanol, ammonia is a feedstock for manufacturing fertilizers such as urea, and may be considered as a chemical storage medium of renewable electricity [37-42]. Pure nitrogen for ammonia synthesis is produced using an air separation unit. In the U. S., about 98% of ammonia is produced by catalytic steam reforming of natural gas, while about 77% of world ammonia capacity is based on natural gas. e total energy consumption for the production of ammonia in a modern steam reforming plant is 40-50% above the thermodynamic minimum [40-42]. is study evaluates and compares the economics and sustainability aspects of the hydrogenation processes for renewable methanol and ammonia productions. A multi-criteria decision matrix is introduced in the feasibility evaluations of these productions. e cost and emissions for hydrogen, nitrogen, and CO 2 feeds used in these productions are estimated and the renewable hydrogen, methanol and ammonia economics are reassessed. Journal of Advanced Chemical Engineering J o u r n a l o f A d v a n c e d C he m i c a l E n g i n e e r i n g ISSN: 2090-4568
Transcript of Technoeconomics and Sustainability of Renewable Methanol ... · PDF fileTechnoeconomics and...

Research Article Open Access
Matzen et al., J Adv Chem Eng 2015, 5:3 DOI: 10.4172/2090-4568.1000128
Volume 5 • Issue 3 • 1000128J Adv Chem EngISSN: 2090-4568 ACE an open access journal
Technoeconomics and Sustainability of Renewable Methanol and Ammonia Productions Using Wind Power-based HydrogenMichael Matzen, Mahdi Alhajji and Yaşar Demirel*Department of Chemical and Biomolecular Engineering, University of Nebraska Lincoln, Lincoln NE 68588, USA
Keywords: Electrolytic hydrogen production; Methanol production; Ammonia production; Technoeconomic analysis; Sustainability metrics; Multi-criteria decision matrix
IntroductionElectrolytic hydrogen using wind power may serve as a feedstock
for hydrogenation processes and hence chemical storage for renewable electricity [1-5]. Hydrogen is a clean fuel; its burning causes no harmful emissions; however the cost to produce, store, compress, and transport of the hydrogen is still high [6-12]. Methanol may be used as a fuel and a valuable feedstock for producing methyl t-butyl ether, dimethyl ether, dimethyl carbonate, formaldehyde, acetic acid and other chemical secondary intermediates which are used in producing plywood, particleboard, foams, resins and plastics [13-21].
Methanol production using fossil fuels, mainly from natural gas and coal, is a mature technology [13]. Renewable hydrogen-based methanol as an alternative fuel is widely investigated by researchers worldwide [1,2,13,22-24]. CO2 may come from flue gas, gasification of biomass, or ethanol plants [1,13,25]. Energy analysis of recycling CO2 and reaction mechanisms of hydrogenation of CO2 are some of the efforts toward non-fossil fuel-based methanol as a renewable energy storage and carrier [26-32]. Rihko-Struckmann et al. [33] carried out an energetic evaluation in order to assess the overall efficiency of methanol and hydrogen-based storage systems for renewable electric energy; the efficiency of the system using hydrogen is higher compared with that of using methanol as the storage medium; however, storage and handling of methanol as chemical storage is favorable when compared with H2 [18-20,33-36].
The utilization of CO2 as carbon source for chemical synthesis could have a positive but only marginal impact on the global carbon balance [1,14]. Because, we add 3500 million mt CO2/year worldwide, while we use only 110 million mt CO2/year to produce other chemicals
Abstract
This study analyzes and compares the economics and sustainability aspects of two hydrogenation processes for producing renewable methanol and ammonia by using wind-power based electrolytic hydrogen. Carbon dioxide from an ethanol plant is used for producing methanol, while the nitrogen is supplied by an Air Separation Unit (ASU) for producing ammonia. The capacities are 99.96 mt/day methanol and 1202.55 mt/day anhydrous ammonia. The methanol plant requires 138.37 mt CO2/day and 19.08 mt H2/day. The ammonia is synthesized by using 217.72 mt H2/day and 1009.15 mt N2/day. The production costs and the carbon equivalent emissions (CO2e) associated with the methanol and ammonia processes, electrolytic hydrogen production, carbon capture and compression, and ASU are estimated. The integral facilities of both the methanol and ammonia productions are evaluated by introducing a multi-criteria decision matrix containing economics and sustainability metrics. Discounted cash flow diagrams are established to estimate the economic constraints, unit product costs, and unit costs of hydrogen. The hydrogen cost is the largest contributor to the economics of the plants. For the methanol, the values of emissions are -0.85 kg CO2e/kg methanol as a chemical feedstock and +0.53 kg CO2e/kg methanol as a fuel with complete combustion. For the ammonia, the value of emission is around 0.97 kg CO2e/kg ammonia. The electrolytic hydrogen from wind power helps reduce the emissions; however, the cost of hydrogen at the current level adversely affects the feasibility of the plants. A multi-criteria decision matrix shows that renewable methanol and ammonia with wind power-based hydrogen may be feasible compared with the nonrenewable ones and the renewable methanol may be more favorable than the ammonia.
*Corresponding author: Yaşar Demirel, Department of Chemical and Biomolecular Engineering, University of Nebraska Lincoln, Lincoln 68588, NE, USA, Tel: +1-402-472-2745; E-mail: [email protected]
Received June 22, 2015; Accepted June 29, 2015; Published July 06, 2015
Citation: Matzen M, Alhajji M, Demirel Y (2015) Technoeconomics andSustainability of Renewable Methanol and Ammonia Productions Using WindPower-based Hydrogen. J Adv Chem Eng 5: 128. doi:10.4172/2090-4568.1000128
Copyright: © 2015 Matzen M, et al. This is an open-access article distributed under the terms of the Creative Commons Attribution License, which permits unrestricted use, distribution, and reproduction in any medium, provided the original author and source are credited.
(mainly urea); this is only around 3% usage of the CO2 as feedstock [1,2,14,20,30]. On the other hand, the utilization of CO2 in the fuel production or as a chemical storage of energy, such as methanol, could make a significantly larger impact, as only 16.8% of the world oil consumption was used in 2007 for non-energy purposes [14,17,36].
Like methanol, ammonia is a feedstock for manufacturing fertilizers such as urea, and may be considered as a chemical storage medium of renewable electricity [37-42]. Pure nitrogen for ammonia synthesis is produced using an air separation unit. In the U. S., about 98% of ammonia is produced by catalytic steam reforming of natural gas, while about 77% of world ammonia capacity is based on natural gas. The total energy consumption for the production of ammonia in a modern steam reforming plant is 40-50% above the thermodynamic minimum [40-42].
This study evaluates and compares the economics and sustainability aspects of the hydrogenation processes for renewable methanol and ammonia productions. A multi-criteria decision matrix is introduced in the feasibility evaluations of these productions. The cost and emissions for hydrogen, nitrogen, and CO2 feeds used in these productions are estimated and the renewable hydrogen, methanol and ammonia economics are reassessed.
Journal of Advanced Chemical EngineeringJo
urna
l of A
dvanced Chemical Engineering
ISSN: 2090-4568

Citation: Matzen M, Alhajji M, Demirel Y (2015) Technoeconomics and Sustainability of Renewable Methanol and Ammonia Productions Using Wind Power-based Hydrogen. J Adv Chem Eng 5: 128. doi:10.4172/2090-4568.1000128
Page 2 of 12
Volume 5 • Issue 3 • 1000128J Adv Chem EngISSN: 2090-4568 ACE an open access journal
Sustainability in Chemical Processes and Energy Technology
The following sustainability metrics are applicable to specific chemical processes and energy systems [43-46]:
• Material intensity (nonrenewable resources of raw materials, solvents/unit mass of products)
• Energy intensity (nonrenewable energy/unit mass of products)
• Potential environmental impact (pollutants and emissions/unit mass of products)
• Potential chemical risk (toxic emissions/unit mass of products)
This study uses a comparative assessment of the renewable methanol and ammonia plants with the sustainability metrics of material intensity, ‘energy intensity’ and ‘potential environmental impact’ as emissions of CO2e by using the ‘Carbon Tracking’ and the ‘Global Warming Potential’ options of Aspen Plus [47]. The costs/unit mass of products are also considered in these metrics.
Table 1 shows the U.S. average Levelized Costs of Electricity (LCE) for generating technologies entering service in 2019 projected in the Annual Energy Outlook 2014 [2]. LCEs are estimated in 2012 $/MWh and measures of the overall competitiveness of different generating technologies over an assumed financial life and duty cycle. The cost of Carbon Capture and Storage (CCS) accounts for 21% of the total LCE in Integrated Gasification of Combined Cycle (IGCC). For natural gas-based advanced combined cycle, the cost of CCS accounts for 29% of the total LCE. Wind-based electricity is becoming comparable with the hydropower, IGCC with CCS, and natural gas-based advanced combined cycle with CCS, although the cost of offshore-based wind power still remains high [2,12,48-50].
This study employs the CO2e emission factor data source of US-EPA-Rule-E9-5711 and the fuel source of natural gas [47,51,52]. Carbon equivalent emission, CO2e, indicates the global warming potential of GHGs; this study uses US-EPA with a predetermined cost for CO2 fee/tax of $/mt CO2e.
Hydrogen Production Currently, 96% of H2 is produced directly from fossil fuels and
about 4% is produced indirectly by using electricity generated through fossil fuels [53]. The conventional technologies are steam reforming of natural gas, coal gasification, and partial oxidation of hydrocarbons such as biomass. Renewable hydrogen comes from the electrolysis of water using hydropower, wind power, and solar photovoltaic power [54-56].
Hydrogen Production from SyngasCommercial processes for H2 production are based on syngas
feedstock produced from natural gas steam reforming (Figure 1) and coal (or biomass) gasification (Figure 2) with carbon capture and storage. These processes are complex, sensitive to the feedstock quality, and require large investments for larger units. The generated CO can also be used in the water-gas shift reaction to yield more hydrogen. In these processes, however, at least 20% of the energy of the fossil fuel is lost as waste heat.
Energy efficiency for biomass-based H2 production is around 60% and likely become competitive in the future [55]. A representative
gasification reaction of biomass is CaHb + O2 → H2 + CO + CO2 + H2O. Here the biomass reacts with oxygen supplied by an air separation unit (ASU) at 1150°C-1400°C and 400-1200 psig. Most modern plants purify the crude H2 to 99.99-wt% by removing methane, CO2, N2, and CO using multi-bed pressure swing adsorption [53-59].
Current production of H2 from natural gas and coal accounts for 48% and 18% of the total production, respectively. The emission of CO2 varies between 7.33 kg CO2/kg H2 and 29.33 kg CO2/kg H2 using conventional fuels at about 75% energy efficiency. CO2 emission (beside SOx and NOx) associated with producing H2 from coal is about two-three times higher than that of the H2 produced from natural gas [2,5-8,11,12].
Hydrogen Production from Water ElectrolysisRenewable option is electro-chemical conversion by water
electrolysis using electricity from renewable sources or nuclear power [49,50,53-58]. Figure 3 shows the schematic of wind power-based hydrogen production. Alkaline electrolysis technologies are the most mature commercial systems. The electrolyzer units use process water for electrolysis, and cooling water for cooling. KOH is needed for the electrolyte in the system. The system includes the following equipment: transformer, thyristor, electrolyzer unit, feed water demineralizer, hydrogen scrubber, gas holder, two compressor units to 30 bar, deoxidizer, twin tower dryer (Figure 3) [5,49]. These electrolyzers have the energy efficiencies (57%-75%) based on higher heating value- HHV and 50-60% based on the lower heating value-LHV. The typical current density is 100-300 mA/cm2 [12,49].
The amount of total water used is 26.7 kg/kg H2; electrolysis uses approximately 45%, while manufacturing the wind turbines and the hydrogen storage consume around 38% and 17% of the total water used, respectively. The total greenhouse gas emission is 0.97 kg CO2e/kg H2, which is distributed as 0.757 kg CO2e/kg H2 (78%) for the wind turbine production and operation (because of steel and concrete used in its construction), 0.043 kg CO2e/kg H2 (4.4%) for the electrolyzer construction and operation, and 0.17 kg CO2e/kg H2 (17.6%) for the
Cleaning
Naturalgas
ZnO
Syngas
Steam
CO+H2O H2 +CO2
Water Gas Shift
Water
CarbonCapture
CO2
HeatRecovery
Hydrogen
Reforming Purification
ZnS
Emission: 7-29 kg CO2/kg H2; Energy efficiency: 75%Energy cost of distributed H2 prod.: $16-29/GJ; Distributed/Centralized H2 cost: ~3
Figure 1: Hydrogen production by steam reforming of natural gas [53-58].
Water-gas shift
Air
CO+H2O H2 +CO2
GasificationOxygen
Nitrogen
Gas CleaningPre-treated coal/
Biomass H2 Separation Hydrogen
H2
Steam
AirSeparation
Cost: ~$1.9/kg H2; Emission: 14-60 kg CO2/kg H2
Figure 2: Hydrogen production by gasification of coal [53-58].

Citation: Matzen M, Alhajji M, Demirel Y (2015) Technoeconomics and Sustainability of Renewable Methanol and Ammonia Productions Using Wind Power-based Hydrogen. J Adv Chem Eng 5: 128. doi:10.4172/2090-4568.1000128
Page 3 of 12
Volume 5 • Issue 3 • 1000128J Adv Chem EngISSN: 2090-4568 ACE an open access journal
electrolyzer increases considerably as the wind farms’ availability and electrolyzer capacity decrease.
Integration with low-cost renewables and the flexibility to produce H2 from the grid electricity during off-peak periods may help lower the production cost of H2. A large alkaline (bipolar design) electrolyzer unit is the Norsk Hydro Atmospheric Type No. 5040, which can produce 1046 kg H2/day (381,790 kg H2/year) by using approximately 2.3 MW of electricity. Small systems however, are often built around Polymer Electrode Membrane (PEM) electrolyzer cell technology. Table 4 shows the streams of the Norsk hydro atmospheric type electrolyzer unit. The levelized cost is $6.63/kg H2 (2007$) and the purchased electrolyzer system cost: $489/kW (2014$) [5-10]. Economic analysis shows that final production cost is around $4.97/kg H2, which is much higher compared with the cost of $1.91/kg H2 from coal gasification [9,10].
The gas output streams from the electrolyzer are assumed to be 100% pure (typical real outputs are 99.9 to 99.9998% for H2 and 99.2 to 99.9993% for O2). Electricity cost is typically 70 to 80% of the total cost of H2 production. Table 5 shows the typical energy usage by the Norsk electrolyzer. The system energy requirement includes compression to bring the gas output to 33 bar (480 psi) [7,8]. The minimum power conversion system would require rectification of the variable ac output from the wind turbines to dc output for the electrolyzer cells. Future energy requirements are targeted at 50 kWh/kg H2 [9,10,57-59].
Hydrogen production costs change approximately from $1.75/kg H2 to $4.6/kg H2 as the electricity prices change from $0.02/kWh to $0.08/kWh, for an advanced electrolyzer technology at 76% efficiency, and capital cost of $250/kW (current state of technology is 56%-75% efficiency and $700/kW) [12,49]. These costs represent distributed hydrogen production and include compression, storage, and delivery. The electrolyzer has a capacity factor of 70% to adjust for seasonal and weekend/weekday fluctuations in demand and a 97% availability of the equipment.
Production of H2 is an energy-consuming process, and may not be environmentally friendly [18,56]. In addition, the low density and extremely low boiling point of H2 increase the energy costs of compression or liquefaction and the investment costs of storage and delivery. Distributed electrolysis case may play a role in the transition to the hydrogen economy when there is little delivery infrastructure for hydrogen [12]. Underground gas storage of hydrogen and oxygen in connection with the electrolysis may enable the electrolyzer to accommodate the variations in the power produced by renewable resources. The output-input efficiency cannot be much above 30%, while the advanced batteries have a cycle efficiency of above 80%. Even the most efficient fuel cells may not recover these losses [56,58-61].
Methanol Production Methanol synthesis needs carbon-rich feedstock (natural gas, coal
or biomass), hydrogen, and a catalyst, mainly Cu/ZnO/Al2O3 [26-34]. Methanol is produced almost exclusively by the ICI, the Lurgi, and the Mitsubishi processes. These processes differ mainly in their reactor designs and the way in which the produced heat is removed from the reactor. To improve their catalytic performance, the CuO/ZnO catalysts have been modified with various metals, such as chromium, zirconium, vanadium, cerium, titanium, and palladium [30-33,62]. The long-term stability of the catalysts may be improved by adding a small amount of silica to the catalysts at reaction conditions of 5 MPa, 523 K [63]. A high catalyst activity is related to a high copper surface area or small crystallite size combined with intimate contact with the zinc promoter. Table 6 shows some of the experimental reactor operating
hydrogen compression and storage (mainly due to the production of steel used in the storage tanks) [59].
M-Langer et al. [54] evaluated hydrogen production processes based on natural gas steam reforming, coal and biomass gasification, and water electrolysis. H2 production cost is around $65/GJ using wind electricity, $30/GJ using nuclear power, and $600/GJ using photovoltaic electricity based on 2007 $. Large-scale processes, using natural gas and coal, are the most economical processes while biomass gasification still needs technological improvements. The operating cost of an electrolyzer is driven by the energy efficiency and the cost of electricity. Energy efficiency needs to be increased to 76% from the current average of about 62%. The capital costs of wind-based H2 are $2086/kW (2011) and $2067/kW (2012) for 50000 kg H2/day for a centralized production plant. New classes of materials could be designed at the nanoscale to produce catalysts that are more selective, less prone to poisoning, and able to operate at lower temperatures [5-9]. High-temperature solid oxide electrolysis can use lower cost energy (in the form of steam) for water-splitting to decrease electricity consumption [12,49].
Economics of Wind Power-Based HydrogenWind power-based electrolysis production cost estimates are
limited geographically and the base cost of H2 ranges from $3.74/kg H2 to $5.86/kg H2. Capacities of H2 productions range from 1,000 to 50,000 kg H2/day [2-5]. Other factors such as large-scale storage, compression, pipeline transport, and dispensing economics need separate analyses [49]. Currently, the production of H2 by electrolysis using renewable electricity is not competitive with chemical production methods based on fossil fuels. However, using the off-peak power could increase plant load factor and improve the economics [49,53]. Electrolytic H2 may be more attractive for regions without access to natural gas or if H2 is used as an energy storage medium [33,49].
The current capital equipment cost for advanced electrolysis is between $600/kW and $700/kW. This cost needs to be reduced to $200/kW to achieve $2.75/GGE (untaxed gasoline gallon equivalent) by 2015 [49,50]. This shows around 60% of the improvement needed. Table 2 shows some electrolyzer types with their efficiencies. Higher efficiencies are possible with Polymer Electrolyte Membrane (PEM) and Solid Oxide Electrolytic Cell (SOEC) electrolyzers, which are still under development. Table 3 shows a typical sensitivity analysis to determine how the availability of wind farms and the capacity of electrolyzer affect the electricity needed for the production of H2 [53-56]. Capital cost of
Transformer/Thyristor
Electricity
Dionizer
Water
Hydrogen
DeoxidizerElectrolyzer
O2/KOHGas Separator
Dryer
KOH
OxygenWind Turbine
H2/KOHGas Separator
KOH
CompressionStorageDelivery
WindEnergy
Production 72%, CSD 28% of total costElectrolyzer efficiency: ~62%; target: 76% (LHV)Target cost: $0.3/kg H2 = gasoline of $2.5/GJ; Cost: $3.74-5.86/kg H2
9 kg/h 1 kg/h
A
B
C
0.97 kg CO2-eq/kg H2: A: 78%; B: 4.4%; C; 17.6%
Figure 3: Schematic for alkaline electrolysis of water for hydrogen production with compression, storage, and delivery [5-10,12,49,59].

Citation: Matzen M, Alhajji M, Demirel Y (2015) Technoeconomics and Sustainability of Renewable Methanol and Ammonia Productions Using Wind Power-based Hydrogen. J Adv Chem Eng 5: 128. doi:10.4172/2090-4568.1000128
Page 4 of 12
Volume 5 • Issue 3 • 1000128J Adv Chem EngISSN: 2090-4568 ACE an open access journal
temperatures and pressures with the catalyst Cu/ZnO/Al2O3. During the synthesis these following reactions occur [63-69]
CO2 + 3H2 = CH3OH + H2O ∆H°(298 K) = − 49.4 kJ/mol (1)
CO + 2H2 = CH3OH ∆H°(298 K) = − 90.55 kJ/mole (2)
CO2 + H2 = H2O + CO ∆H°(298 K) = + 41.12 kJ/mole (3)
Only two of these reactions are linearly independent and two reaction rate equations can describe the kinetics of the all reactions.
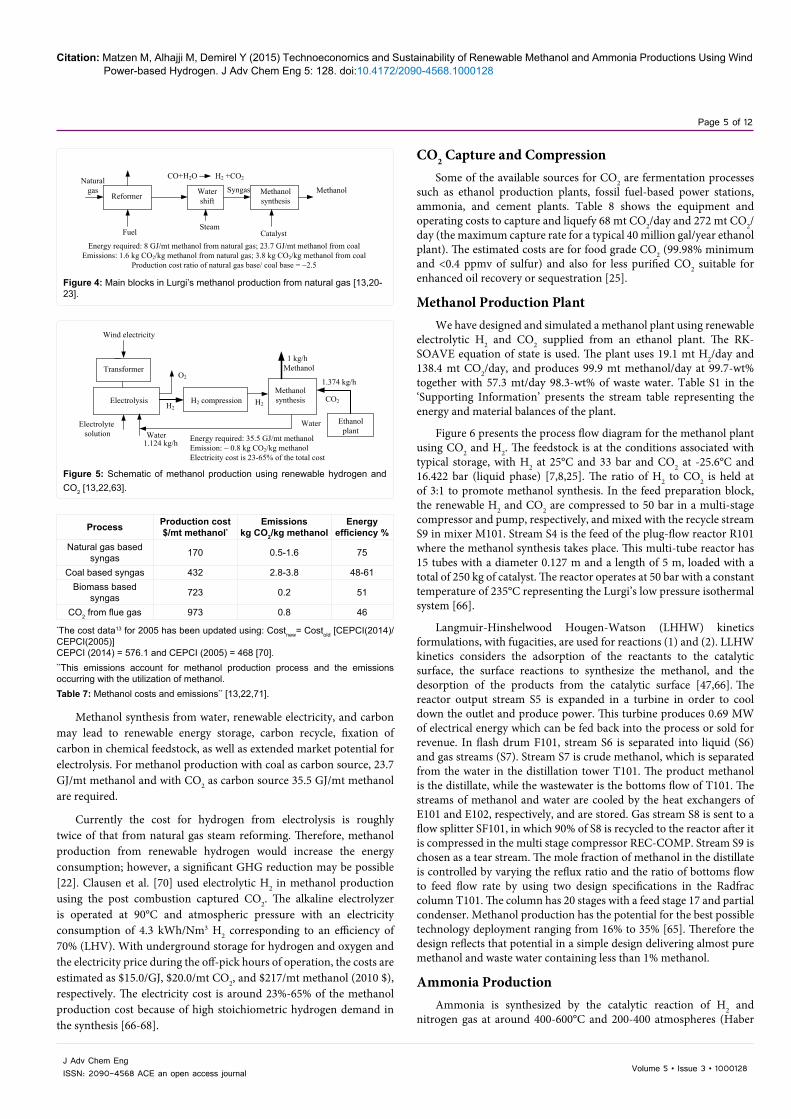
Methanol from Natural GasFigure 4 shows the main blocks of natural gas-based methanol
production. Three fundamental steps are: (i) natural gas reforming to produce syngas with an optimal ratio of [(H2 CO2)/(CO + CO2)] = 2, (ii) conversion of syngas into crude methanol, and (iii) distillation of crude methanol. Methanol synthesis from natural gas has a typical energy efficiency of 75% and emits around 1.6 kg CO2/kg methanol [13]. Specific energy consumption for natural gas-based methanol is around 8.0 GJ/mt methanol [22]. Captured CO2 is commonly reused internally in ammonia and some methanol plants.
Table 7 compares the cost of methanol production and emissions from fossil fuel resources. Coal-based syngas process has the highest emission of GHGs, which is around 2.8-3.8 kg CO2/kg methanol. The typical energy efficiency for the coal-based methanol is in the range of 48% to 61% [13,22]. Technical and economic analyses of methanol production from biomass-based syngas show that overall energy efficiency is around 55% based on HHV. The level of emission is around 0.2 kg CO2/kg methanol, which is mainly from biomass growing, harvesting, and transportation. Methanol from biomass or flue gas CO2 is at least 2-3 times more expensive than the fossil-fuel based methanol [13,64-70].
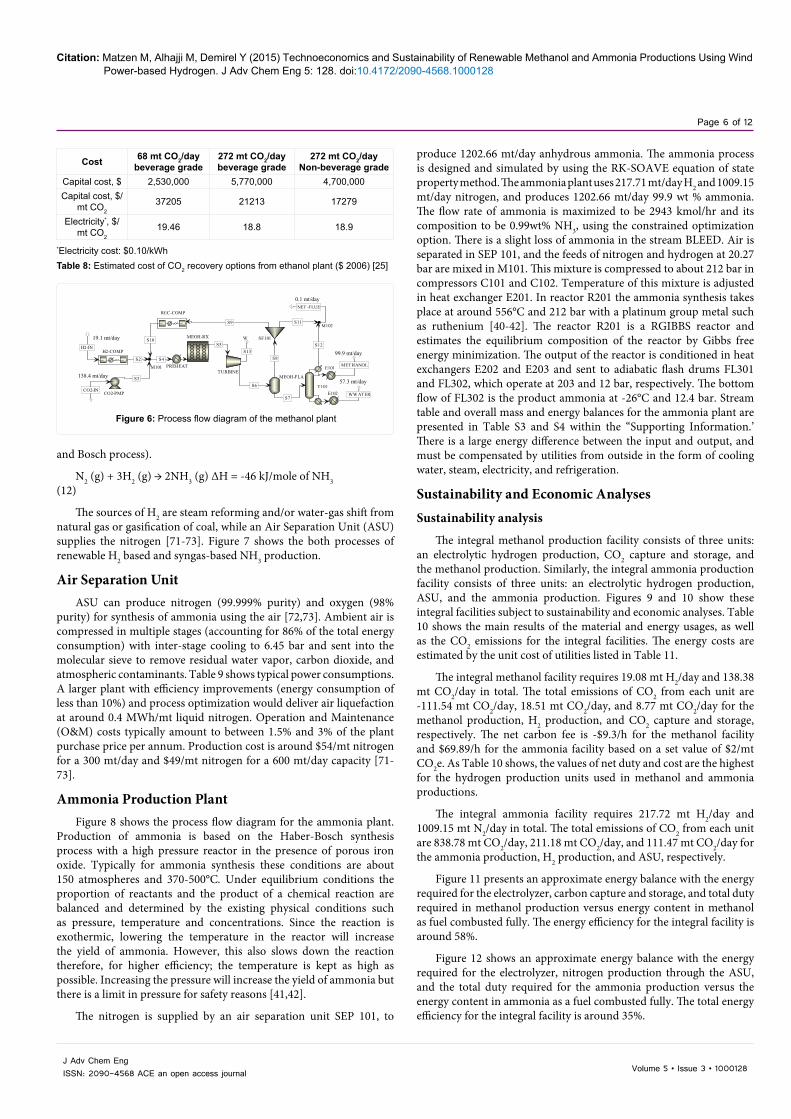
Methanol from CO2 and H2
Converting CO2 into chemicals is thermodynamically challenging, and inherently carries costs for the energy and hydrogen supply [22]. The conversions of reactions (1) to (3) with catalyst of Cu/ZnO/Al2O3 are limited by the chemical equilibrium of the system. The temperature rise must be minimized in order to operate at good equilibrium values. However selectivity for methanol is high with a value of 99.7% at 5 MPa and 523 K with a H2/CO2 ratio of 2.82 [63]. The energy efficiency for the concentrated CO2 and hydrogen based methanol is around 46%. Figure 5 shows a schematic of renewable hydrogen production.
Plant type Capacity factor (%) LCE O&Mwith fuel
Transmission investment Total LCE Emission*
mt CO2e/MWh
IGCC* 85 76.1 31.7 1.2 115.9 0.94-0.98IGCC with CCS 85 97.8 38.6 1.2 147.4 0.94-0.98
NG-CC 87 15.7 45.5 1.2 64.4 0.55NG-CC with CCS 87 30.3 55.6 1.2 91.3 0.55
Biomass 83 47.4 39.5 1.2 102.6Wind 35 64.1 3.2 80.3
Wind-Offshore 37 175.4 5.8 204.1Solar PV 25 114.5 4.1 130.0
Solar thermal 20 195.0 6.0 243.1Hydro 53 72.0 6.0 2.0 84.5
*Steam-electric generators in 2012 for calculating the amount of CO2 produced per kWhr2; IGCC: Integrated gasification combined cycle; O&M: Operations and Maintenance cost; CCS: Carbon capture and storage; NG: Natural gas; PV: PhotovoltaicTable 1: Estimated U.S. average levelized cost of electricity (LCE) 2012 $/MWh for advanced generation resources entering service in 2019 [2].
Electrolyzer Capacity (kW) Efficiency % (HHV) Efficiency % (LHV)Alkaline 1-2,300 72 61
PEM 1-130 60 51Solid Oxide Pilot scale only 82 69
*Norsk Hydro’s 30,000 Nm3/hr (~ 150 MW) connected to a hydroelectric power plant, generating about 70,000 kg H2/day.The higher heating values for hydrogen: HHV= 39.42 kWhr/kg and the lower heating value LHV= 33.31 kWhr/kg.100% HHV efficiency translates into 84.5% efficiency based on LHV.Table 2: Electrolyzer types* [9-11].
Wind turbine capital cost ($/kW) 1654 2067 2481Electrolyzer energy use (kWh/kg H2) 47.5 50 60
Electrolyzer capital cost ($/kW) 326 408 489Wind farm availability (%) 90 88 86
Electrolyzer capacity factor (%) 99.5 98 96
Table 3: Sensitivity analysis changing the unit cost of H2 with the production efficiency and electricity cost [9,10,55-57].
Water Hydrogen Oxygen Waterkg/hr kmole/hr kg/hr kmole/hr kg/hr kmole/hr kg/hr kmole/hr485 26.9 43.59 21.6 346.51 10.8 94.82 5.3
Table 4: Stream table of the norsk hydro atmospheric type electrolyzer unit [9,10].
System energy required(includes compression)
Hydrogen production
Electrolyzer energy
required
System power
requiredkWh/(Nm3) kWh/kg H2 kg/h kmole/hr kWh/(Nm3) kW
4.8 53.5 43.59 21.6 4.3 2330
Table 5: Energy usage for the Norsk electrolyzer [9,10].
Reactions T, °C P, barBased on all three reactions (1-3) [63] 250 50Based on all three reactions (1-3) [65] 200-244 15-50Based on reaction (1) and (2) [66] 215-270 50Based on reaction (1) and (3) [67] 187-277 30-90Based on reaction (1) and (3) [68] 180-280 51Based on reaction (1) and (3) [69] 220-300 50-100
Table 6: Experimental conditions of methanol synthesis with the catalyst Cu/ZnO/Al2O3
Citation: Matzen M, Alhajji M, Demirel Y (2015) Technoeconomics and Sustainability of Renewable Methanol and Ammonia Productions Using Wind Power-based Hydrogen. J Adv Chem Eng 5: 128. doi:10.4172/2090-4568.1000128
Page 5 of 12
Volume 5 • Issue 3 • 1000128J Adv Chem EngISSN: 2090-4568 ACE an open access journal
Methanol synthesis from water, renewable electricity, and carbon may lead to renewable energy storage, carbon recycle, fixation of carbon in chemical feedstock, as well as extended market potential for electrolysis. For methanol production with coal as carbon source, 23.7 GJ/mt methanol and with CO2 as carbon source 35.5 GJ/mt methanol are required.
Currently the cost for hydrogen from electrolysis is roughly twice of that from natural gas steam reforming. Therefore, methanol production from renewable hydrogen would increase the energy consumption; however, a significant GHG reduction may be possible [22]. Clausen et al. [70] used electrolytic H2 in methanol production using the post combustion captured CO2. The alkaline electrolyzer is operated at 90°C and atmospheric pressure with an electricity consumption of 4.3 kWh/Nm3 H2 corresponding to an efficiency of 70% (LHV). With underground storage for hydrogen and oxygen and the electricity price during the off-pick hours of operation, the costs are estimated as $15.0/GJ, $20.0/mt CO2, and $217/mt methanol (2010 $), respectively. The electricity cost is around 23%-65% of the methanol production cost because of high stoichiometric hydrogen demand in the synthesis [66-68].
CO2 Capture and CompressionSome of the available sources for CO2 are fermentation processes
such as ethanol production plants, fossil fuel-based power stations, ammonia, and cement plants. Table 8 shows the equipment and operating costs to capture and liquefy 68 mt CO2/day and 272 mt CO2/day (the maximum capture rate for a typical 40 million gal/year ethanol plant). The estimated costs are for food grade CO2 (99.98% minimum and <0.4 ppmv of sulfur) and also for less purified CO2 suitable for enhanced oil recovery or sequestration [25].
Methanol Production PlantWe have designed and simulated a methanol plant using renewable
electrolytic H2 and CO2 supplied from an ethanol plant. The RK-SOAVE equation of state is used. The plant uses 19.1 mt H2/day and 138.4 mt CO2/day, and produces 99.9 mt methanol/day at 99.7-wt% together with 57.3 mt/day 98.3-wt% of waste water. Table S1 in the ‘Supporting Information’ presents the stream table representing the energy and material balances of the plant.
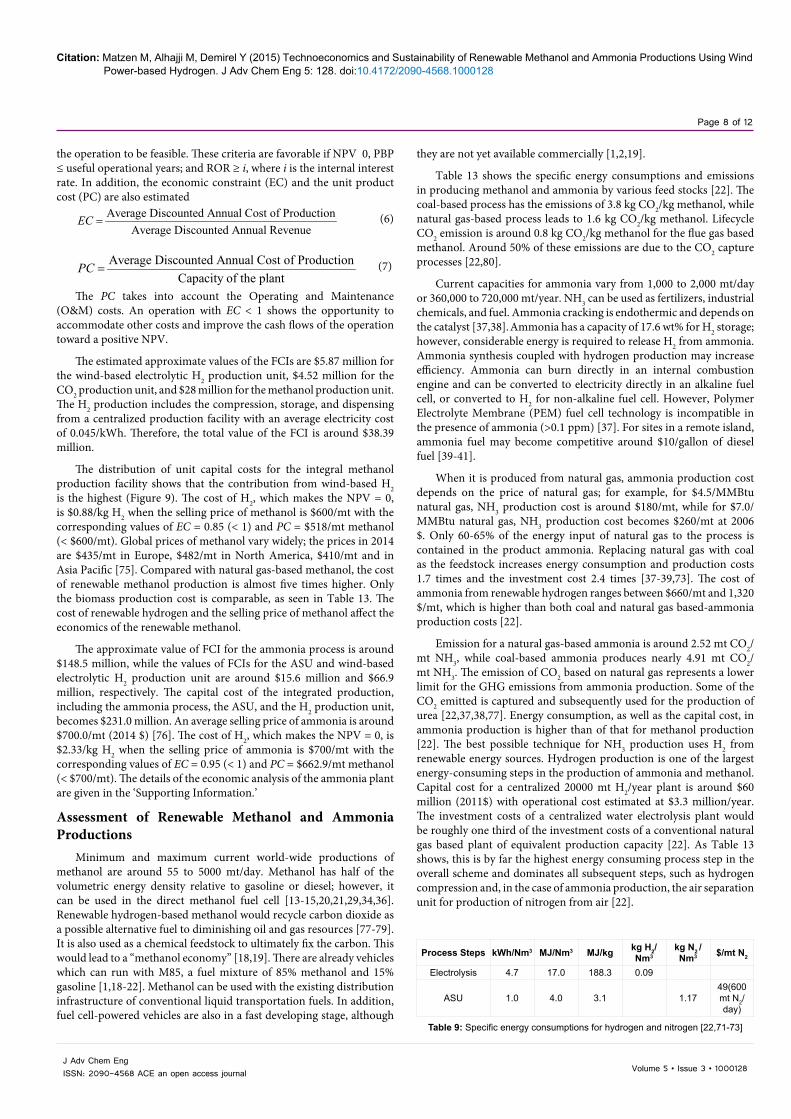
Figure 6 presents the process flow diagram for the methanol plant using CO2 and H2. The feedstock is at the conditions associated with typical storage, with H2 at 25°C and 33 bar and CO2 at -25.6°C and 16.422 bar (liquid phase) [7,8,25]. The ratio of H2 to CO2 is held at of 3:1 to promote methanol synthesis. In the feed preparation block, the renewable H2 and CO2 are compressed to 50 bar in a multi-stage compressor and pump, respectively, and mixed with the recycle stream S9 in mixer M101. Stream S4 is the feed of the plug-flow reactor R101 where the methanol synthesis takes place. This multi-tube reactor has 15 tubes with a diameter 0.127 m and a length of 5 m, loaded with a total of 250 kg of catalyst. The reactor operates at 50 bar with a constant temperature of 235°C representing the Lurgi’s low pressure isothermal system [66].
Langmuir-Hinshelwood Hougen-Watson (LHHW) kinetics formulations, with fugacities, are used for reactions (1) and (2). LLHW kinetics considers the adsorption of the reactants to the catalytic surface, the surface reactions to synthesize the methanol, and the desorption of the products from the catalytic surface [47,66]. The reactor output stream S5 is expanded in a turbine in order to cool down the outlet and produce power. This turbine produces 0.69 MW of electrical energy which can be fed back into the process or sold for revenue. In flash drum F101, stream S6 is separated into liquid (S6) and gas streams (S7). Stream S7 is crude methanol, which is separated from the water in the distillation tower T101. The product methanol is the distillate, while the wastewater is the bottoms flow of T101. The streams of methanol and water are cooled by the heat exchangers of E101 and E102, respectively, and are stored. Gas stream S8 is sent to a flow splitter SF101, in which 90% of S8 is recycled to the reactor after it is compressed in the multi stage compressor REC-COMP. Stream S9 is chosen as a tear stream. The mole fraction of methanol in the distillate is controlled by varying the reflux ratio and the ratio of bottoms flow to feed flow rate by using two design specifications in the Radfrac column T101. The column has 20 stages with a feed stage 17 and partial condenser. Methanol production has the potential for the best possible technology deployment ranging from 16% to 35% [65]. Therefore the design reflects that potential in a simple design delivering almost pure methanol and waste water containing less than 1% methanol.
Ammonia ProductionAmmonia is synthesized by the catalytic reaction of H2 and
nitrogen gas at around 400-600°C and 200-400 atmospheres (Haber
CO2H2
Transformer
Methanol synthesisElectrolysis H2 compression
Water
Wind electricity
Electrolyte solution
O2
H2
Methanol
Water
1 kg/h
1.124 kg/h
1.374 kg/h
Energy required: 35.5 GJ/mt methanolEmission: ~ 0.8 kg CO2/kg methanolElectricity cost is 23-65% of the total cost
Ethanol plant
Figure 5: Schematic of methanol production using renewable hydrogen and CO2 [13,22,63].
Reformer
Naturalgas
Fuel
Syngas
Steam
Methanolsynthesis
CO+H2O H2 +CO2
Water shift
Methanol
CatalystEnergy required: 8 GJ/mt methanol from natural gas; 23.7 GJ/mt methanol from coal
Emissions: 1.6 kg CO2/kg methanol from natural gas; 3.8 kg CO2/kg methanol from coalProduction cost ratio of natural gas base/ coal base = ~2.5
Figure 4: Main blocks in Lurgi’s methanol production from natural gas [13,20-23].
Process Production cost$/mt methanol*
Emissionskg CO2/kg methanol
Energyefficiency %
Natural gas based syngas 170 0.5-1.6 75
Coal based syngas 432 2.8-3.8 48-61Biomass based
syngas 723 0.2 51
CO2 from flue gas 973 0.8 46*The cost data13 for 2005 has been updated using: Costnew= Costold [CEPCI(2014)/CEPCI(2005)]CEPCI (2014) = 576.1 and CEPCI (2005) = 468 [70].**This emissions account for methanol production process and the emissions occurring with the utilization of methanol.Table 7: Methanol costs and emissions** [13,22,71].
Citation: Matzen M, Alhajji M, Demirel Y (2015) Technoeconomics and Sustainability of Renewable Methanol and Ammonia Productions Using Wind Power-based Hydrogen. J Adv Chem Eng 5: 128. doi:10.4172/2090-4568.1000128
Page 6 of 12
Volume 5 • Issue 3 • 1000128J Adv Chem EngISSN: 2090-4568 ACE an open access journal
produce 1202.66 mt/day anhydrous ammonia. The ammonia process is designed and simulated by using the RK-SOAVE equation of state property method. The ammonia plant uses 217.71 mt/day H2 and 1009.15 mt/day nitrogen, and produces 1202.66 mt/day 99.9 wt % ammonia. The flow rate of ammonia is maximized to be 2943 kmol/hr and its composition to be 0.99wt% NH3, using the constrained optimization option. There is a slight loss of ammonia in the stream BLEED. Air is separated in SEP 101, and the feeds of nitrogen and hydrogen at 20.27 bar are mixed in M101. This mixture is compressed to about 212 bar in compressors C101 and C102. Temperature of this mixture is adjusted in heat exchanger E201. In reactor R201 the ammonia synthesis takes place at around 556°C and 212 bar with a platinum group metal such as ruthenium [40-42]. The reactor R201 is a RGIBBS reactor and estimates the equilibrium composition of the reactor by Gibbs free energy minimization. The output of the reactor is conditioned in heat exchangers E202 and E203 and sent to adiabatic flash drums FL301 and FL302, which operate at 203 and 12 bar, respectively. The bottom flow of FL302 is the product ammonia at -26°C and 12.4 bar. Stream table and overall mass and energy balances for the ammonia plant are presented in Table S3 and S4 within the “Supporting Information.’ There is a large energy difference between the input and output, and must be compensated by utilities from outside in the form of cooling water, steam, electricity, and refrigeration.
Sustainability and Economic AnalysesSustainability analysis
The integral methanol production facility consists of three units: an electrolytic hydrogen production, CO2 capture and storage, and the methanol production. Similarly, the integral ammonia production facility consists of three units: an electrolytic hydrogen production, ASU, and the ammonia production. Figures 9 and 10 show these integral facilities subject to sustainability and economic analyses. Table 10 shows the main results of the material and energy usages, as well as the CO2 emissions for the integral facilities. The energy costs are estimated by the unit cost of utilities listed in Table 11.
The integral methanol facility requires 19.08 mt H2/day and 138.38 mt CO2/day in total. The total emissions of CO2 from each unit are -111.54 mt CO2/day, 18.51 mt CO2/day, and 8.77 mt CO2/day for the methanol production, H2 production, and CO2 capture and storage, respectively. The net carbon fee is -$9.3/h for the methanol facility and $69.89/h for the ammonia facility based on a set value of $2/mt CO2e. As Table 10 shows, the values of net duty and cost are the highest for the hydrogen production units used in methanol and ammonia productions.
The integral ammonia facility requires 217.72 mt H2/day and 1009.15 mt N2/day in total. The total emissions of CO2 from each unit are 838.78 mt CO2/day, 211.18 mt CO2/day, and 111.47 mt CO2/day for the ammonia production, H2 production, and ASU, respectively.
Figure 11 presents an approximate energy balance with the energy required for the electrolyzer, carbon capture and storage, and total duty required in methanol production versus energy content in methanol as fuel combusted fully. The energy efficiency for the integral facility is around 58%.
Figure 12 shows an approximate energy balance with the energy required for the electrolyzer, nitrogen production through the ASU, and the total duty required for the ammonia production versus the energy content in ammonia as a fuel combusted fully. The total energy efficiency for the integral facility is around 35%.
Cost 68 mt CO2/day beverage grade
272 mt CO2/day beverage grade
272 mt CO2/day Non-beverage grade
Capital cost, $ 2,530,000 5,770,000 4,700,000Capital cost, $/
mt CO237205 21213 17279
Electricity*, $/mt CO2
19.46 18.8 18.9
*Electricity cost: $0.10/kWhTable 8: Estimated cost of CO2 recovery options from ethanol plant ($ 2006) [25]
MEOH-RX
MEOH-FLA
T101
M102
M101TURBINE
SF101
H2-COMP
REC-COMP
E101
E102CO2-PMP
PREHEAT
S5
S4 S8
S7
S12
NET -FLUE
S2
CO2-IN
H2-IN
S6
S9 S11
S10
S3
WW ATER
METHANOL
19.1 mt/day
138.4 mt/day
99.9 mt/day
57.3 mt/day
0.1 mt/day
S13
W
Figure 6: Process flow diagram of the methanol plant
and Bosch process).
N2 (g) + 3H2 (g) → 2NH3 (g) ΔH = -46 kJ/mole of NH3 (12)
The sources of H2 are steam reforming and/or water-gas shift from natural gas or gasification of coal, while an Air Separation Unit (ASU) supplies the nitrogen [71-73]. Figure 7 shows the both processes of renewable H2 based and syngas-based NH3 production.
Air Separation UnitASU can produce nitrogen (99.999% purity) and oxygen (98%
purity) for synthesis of ammonia using the air [72,73]. Ambient air is compressed in multiple stages (accounting for 86% of the total energy consumption) with inter-stage cooling to 6.45 bar and sent into the molecular sieve to remove residual water vapor, carbon dioxide, and atmospheric contaminants. Table 9 shows typical power consumptions. A larger plant with efficiency improvements (energy consumption of less than 10%) and process optimization would deliver air liquefaction at around 0.4 MWh/mt liquid nitrogen. Operation and Maintenance (O&M) costs typically amount to between 1.5% and 3% of the plant purchase price per annum. Production cost is around $54/mt nitrogen for a 300 mt/day and $49/mt nitrogen for a 600 mt/day capacity [71-73].
Ammonia Production PlantFigure 8 shows the process flow diagram for the ammonia plant.
Production of ammonia is based on the Haber-Bosch synthesis process with a high pressure reactor in the presence of porous iron oxide. Typically for ammonia synthesis these conditions are about 150 atmospheres and 370-500°C. Under equilibrium conditions the proportion of reactants and the product of a chemical reaction are balanced and determined by the existing physical conditions such as pressure, temperature and concentrations. Since the reaction is exothermic, lowering the temperature in the reactor will increase the yield of ammonia. However, this also slows down the reaction therefore, for higher efficiency; the temperature is kept as high as possible. Increasing the pressure will increase the yield of ammonia but there is a limit in pressure for safety reasons [41,42].
The nitrogen is supplied by an air separation unit SEP 101, to

Citation: Matzen M, Alhajji M, Demirel Y (2015) Technoeconomics and Sustainability of Renewable Methanol and Ammonia Productions Using Wind Power-based Hydrogen. J Adv Chem Eng 5: 128. doi:10.4172/2090-4568.1000128
Page 7 of 12
Volume 5 • Issue 3 • 1000128J Adv Chem EngISSN: 2090-4568 ACE an open access journal
Table 12 presents the following sustainability metrics that are estimated for the integral methanol and ammonia facilities:
• Material intensity (nonrenewable energy/unit mass of product)
• Energy intensity (nonrenewable energy/unit mass of product)
• Potential environmental impact (pollutants and emissions/unit mass of product)
The overall facility emissions of CO2 are normalized with respect to methanol and ammonia capacities. The material intensity metrics show that the methanol facility requires 1.39 mt CO2/mt methanol. The environmental impact metrics shows that the integral methanol facility reduces -0.84 kg CO2/kg methanol when utilizing it as a chemical feedstock, and recycles 0.53 kg CO2/kg methanol after its complete combustion, as seen in Figure 9. On the other hand, the environmental impact metrics for the integral ammonia facility is 1.03 kg CO2/kg ammonia, as seen in Figure 10. The duty (heating-cooling) becomes negative due to excessive cooling required in the ammonia facility.
Economic analysis
The economics analyses of the integral methanol and ammonia plants are based on the Discounted Cash Flow Diagrams (DCFD) prepared for a ten-year of operation using the current economic data. Based on the equipment list from the process flow diagrams (Figures 6 and 8), bare module costs are estimated and used as Fixed Capital Investments (FCI). Chemical Engineering Plant Cost Index [48] (CEPCI-2014) (=576.1) is used to estimate and update the costs and capacity to the present date by
New NewNew New
Old OldCost Cost
xCEPCI CapacityCEPCI Capacity
=
(5)
Where x is the factor, which is usually assumed to be 0.6. Working capital is 20% of the FCI. Depreciation method is the Maximum Accelerated Cost Recovery System (MACRS) with a 7-year recovery period [74]. After estimating the revenue and the cost of production, DCFDs are prepared. The details can be found within the ‘Supporting Information.’ DCFDs generate the three economic feasibility criteria that are Net Present Value (NPV), Payback Period (PBP), and Rate of Return (ROR). At least two out of three criteria should be favorable for
ReformerFeed
Fuel
Syngas
Catalyst
Separator
CO+H2O H2 +CO2
Water shift H2 +CO2
CO2
Ammonia
Nitrogen
H2
Air
Transformer
ASUAmmonia synthesis
Nitrogen
Electrolysis H2 compressionWater
Wind electricity
Electrolyte solution
O2
Ammonia
Ammonia synthesis
Steam
Catalyst
O2
O2
Energy required to produce liquid nitrogen: 0.55 MWh/mt N2Energy required by electrolysis: 188.3 MJ/kg H2Emissions: 2.52 kg CO2/kg NH3 from natural gas; 4.91 kg CO22/kg NH3 from coal
~$50/mt N2
Figure 7: Schematic of processes of renewable H2 based and syngas-based NH3 productions [37-42].
19.1 mt/day Wind-H2 production
192.2 GJ/mt H23667.2 GJ/day
138.4 mt/day CO2 0.84 GJ/mt CO2
116.2 GJ/day
Net duty (hot-cold)1.45 GJ/mt Methanol
143.4 GJ/day
99.6 mt/day Methanol 22.7 GJ (HHV)/mt
methanol
Total in: ~3926.4 GJ/day~ 39.4 GJ/mt methanol
Out:~2261.8 GJ/day
Figure 11: Overall energy balance for the integral methanol production facility
217.7 mt/day Wind-H2production
192.2 GJ/mt H241844.8 GJ/day
1009.2 mt/day N21.98 GJ/mt N21994.5 GJ/day
Net duty (hot-cold)32.2 GJ/mt Ammonia
32478.8 GJ/day
Total in: ~76318.1 GJ/day~63.5 GJ/mt Ammonia Out: ~27057.4 GJ/day
1202.6 mt/day Ammonia22.5 GJ (HHV)/mt
Ammonia
Figure 12: Overall energy balance for the integral ammonia production facility
R201
M10 1
M20 1
FS201
E2 03
E1 01
E2 01
E2 02
FL301
FL302
C201
C101
C102
SEP10 1
S7 S8
H2FEED S1 6
N2FEED
S2
S5
S1 3
S6
S1 1
BLEED
S1 2
S9
S1 0
S3S4
S1 4
PRODUCT
AIRO2OUT
217.7 mt/day
1315.6 mt/day 1009.1 mt/day1202.5 mt/day
Figure 8: Process flow diagram for the ammonia plant
CH3OH +3/2O2 CO2 + 2H2O
Methanol as fuel
Methanol production: 99.64 mt/day
Cap. cost: $280280/mt methanol
-1.12 kg CO2/kg methanolMethanol as
chemical feedstock
Integrated Methanol Production FacilityCO2 Capture & storage: 138.37 mt/day
~Cap. cost: $32658/ mt CO2;0.06 kg CO2/mt
Wind-H2 production: 19.08 mt/day Cap. cost: 307329/mt H2; 0.97 kg CO2/mt
-0.84 kg CO2/kg methanol
0.54 kg CO2/kg methanolWind power
Biomass
Figure 9: Economic and sustainability indicators in the integral methanol production facility.
Ammonia production: 1202.55 mt/day
Cap. cost.$123076/mt NH30.70 kg CO2/ kg NH3
Ammonia as chemical feedstock
Integrated Ammonia Production Facility
ASU: 1009.15 mt/day~Cap. cost:$15552/mt; 0.06 kg CO2/kg N2
Wind-H2 production: 217.72 mt/day~Cap. cost:$308011/mt; 0.97 kg CO2/kg H2
1.03 kg CO2/kg NH3
Air
Wind power
Figure 10: Economic and sustainability indicators in the integral ammonia production facility; ASU: Air Separation Unit.
Citation: Matzen M, Alhajji M, Demirel Y (2015) Technoeconomics and Sustainability of Renewable Methanol and Ammonia Productions Using Wind Power-based Hydrogen. J Adv Chem Eng 5: 128. doi:10.4172/2090-4568.1000128
Page 8 of 12
Volume 5 • Issue 3 • 1000128J Adv Chem EngISSN: 2090-4568 ACE an open access journal
the operation to be feasible. These criteria are favorable if NPV 0, PBP ≤ useful operational years; and ROR ≥ i, where i is the internal interest rate. In addition, the economic constraint (EC) and the unit product cost (PC) are also estimated
Average Discounted Annual Cost of ProductionAverage Discounted Annual Revenue
EC = (6)
Average Discounted Annual Cost of ProductionCapacity of the plant
PC =
(7)
The PC takes into account the Operating and Maintenance (O&M) costs. An operation with EC < 1 shows the opportunity to accommodate other costs and improve the cash flows of the operation toward a positive NPV.
The estimated approximate values of the FCIs are $5.87 million for the wind-based electrolytic H2 production unit, $4.52 million for the CO2 production unit, and $28 million for the methanol production unit. The H2 production includes the compression, storage, and dispensing from a centralized production facility with an average electricity cost of 0.045/kWh. Therefore, the total value of the FCI is around $38.39 million.
The distribution of unit capital costs for the integral methanol production facility shows that the contribution from wind-based H2 is the highest (Figure 9). The cost of H2, which makes the NPV = 0, is $0.88/kg H2 when the selling price of methanol is $600/mt with the corresponding values of EC = 0.85 (< 1) and PC = $518/mt methanol (< $600/mt). Global prices of methanol vary widely; the prices in 2014 are $435/mt in Europe, $482/mt in North America, $410/mt and in Asia Pacific [75]. Compared with natural gas-based methanol, the cost of renewable methanol production is almost five times higher. Only the biomass production cost is comparable, as seen in Table 13. The cost of renewable hydrogen and the selling price of methanol affect the economics of the renewable methanol.
The approximate value of FCI for the ammonia process is around $148.5 million, while the values of FCIs for the ASU and wind-based electrolytic H2 production unit are around $15.6 million and $66.9 million, respectively. The capital cost of the integrated production, including the ammonia process, the ASU, and the H2 production unit, becomes $231.0 million. An average selling price of ammonia is around $700.0/mt (2014 $) [76]. The cost of H2, which makes the NPV = 0, is $2.33/kg H2 when the selling price of ammonia is $700/mt with the corresponding values of EC = 0.95 (< 1) and PC = $662.9/mt methanol (< $700/mt). The details of the economic analysis of the ammonia plant are given in the ‘Supporting Information.’
Assessment of Renewable Methanol and Ammonia Productions
Minimum and maximum current world-wide productions of methanol are around 55 to 5000 mt/day. Methanol has half of the volumetric energy density relative to gasoline or diesel; however, it can be used in the direct methanol fuel cell [13-15,20,21,29,34,36]. Renewable hydrogen-based methanol would recycle carbon dioxide as a possible alternative fuel to diminishing oil and gas resources [77-79]. It is also used as a chemical feedstock to ultimately fix the carbon. This would lead to a “methanol economy” [18,19]. There are already vehicles which can run with M85, a fuel mixture of 85% methanol and 15% gasoline [1,18-22]. Methanol can be used with the existing distribution infrastructure of conventional liquid transportation fuels. In addition, fuel cell-powered vehicles are also in a fast developing stage, although
they are not yet available commercially [1,2,19].
Table 13 shows the specific energy consumptions and emissions in producing methanol and ammonia by various feed stocks [22]. The coal-based process has the emissions of 3.8 kg CO2/kg methanol, while natural gas-based process leads to 1.6 kg CO2/kg methanol. Lifecycle CO2 emission is around 0.8 kg CO2/kg methanol for the flue gas based methanol. Around 50% of these emissions are due to the CO2 capture processes [22,80].
Current capacities for ammonia vary from 1,000 to 2,000 mt/day or 360,000 to 720,000 mt/year. NH3 can be used as fertilizers, industrial chemicals, and fuel. Ammonia cracking is endothermic and depends on the catalyst [37,38]. Ammonia has a capacity of 17.6 wt% for H2 storage; however, considerable energy is required to release H2 from ammonia. Ammonia synthesis coupled with hydrogen production may increase efficiency. Ammonia can burn directly in an internal combustion engine and can be converted to electricity directly in an alkaline fuel cell, or converted to H2 for non-alkaline fuel cell. However, Polymer Electrolyte Membrane (PEM) fuel cell technology is incompatible in the presence of ammonia (>0.1 ppm) [37]. For sites in a remote island, ammonia fuel may become competitive around $10/gallon of diesel fuel [39-41].
When it is produced from natural gas, ammonia production cost depends on the price of natural gas; for example, for $4.5/MMBtu natural gas, NH3 production cost is around $180/mt, while for $7.0/MMBtu natural gas, NH3 production cost becomes $260/mt at 2006 $. Only 60-65% of the energy input of natural gas to the process is contained in the product ammonia. Replacing natural gas with coal as the feedstock increases energy consumption and production costs 1.7 times and the investment cost 2.4 times [37-39,73]. The cost of ammonia from renewable hydrogen ranges between $660/mt and 1,320 $/mt, which is higher than both coal and natural gas based-ammonia production costs [22].
Emission for a natural gas-based ammonia is around 2.52 mt CO2/mt NH3, while coal-based ammonia produces nearly 4.91 mt CO2/mt NH3. The emission of CO2 based on natural gas represents a lower limit for the GHG emissions from ammonia production. Some of the CO2 emitted is captured and subsequently used for the production of urea [22,37,38,77]. Energy consumption, as well as the capital cost, in ammonia production is higher than of that for methanol production [22]. The best possible technique for NH3 production uses H2 from renewable energy sources. Hydrogen production is one of the largest energy-consuming steps in the production of ammonia and methanol. Capital cost for a centralized 20000 mt H2/year plant is around $60 million (2011$) with operational cost estimated at $3.3 million/year. The investment costs of a centralized water electrolysis plant would be roughly one third of the investment costs of a conventional natural gas based plant of equivalent production capacity [22]. As Table 13 shows, this is by far the highest energy consuming process step in the overall scheme and dominates all subsequent steps, such as hydrogen compression and, in the case of ammonia production, the air separation unit for production of nitrogen from air [22].
Process Steps kWh/Nm3 MJ/Nm3 MJ/kg kg H2/Nm3
kg N2 /Nm3 $/mt N2
Electrolysis 4.7 17.0 188.3 0.09
ASU 1.0 4.0 3.1 1.1749(600 mt N2/day)
Table 9: Specific energy consumptions for hydrogen and nitrogen [22,71-73]

Citation: Matzen M, Alhajji M, Demirel Y (2015) Technoeconomics and Sustainability of Renewable Methanol and Ammonia Productions Using Wind Power-based Hydrogen. J Adv Chem Eng 5: 128. doi:10.4172/2090-4568.1000128
Page 9 of 12
Volume 5 • Issue 3 • 1000128J Adv Chem EngISSN: 2090-4568 ACE an open access journal
Integral methanol production Integral ammonia production
Material metrics Methanolproduction
H2prod. CO2 C&S NH3
prod.H2
prod. ASU
CO2 Input, mt/day 138.37H2 Input, mt/day 19.08 217.72N2 Input, mt/day 1009.2
Methanol production, mt/day 99.66Ammonia production, mt/day 1202.6
Energy intensity metricsTotal heating duty, MW 4.60 42.49 1.05 103.54 484.89 23.08Total cooling duty, MW 2.93 0.12 0.03 162.32 1.40 0
Net duty (heating - cooling), MW 1.67 42.37 1.02 -58.78 483.49 23.08Total heating cost flow, $/h 59.18 3292.83 81.31 2648.9 37579 1789Total cooling cost flow, $/h 2.24 0.09 0.02 1236 4.85
Net cost (heating + cooling), $/h 61.42 3292.92 81.33 3885 37584.08 1789.04Environmental impact metrics
Net stream CO2e, mt/day -138.37 0 0 0 0 0Utility CO2e, mt/day 26.83 18.51 8.77 838.78 211.18 111.47Total CO2e, mt/day -111.53 18.51 8.77 838.78 211.18 111.47Net carbon fee, $/h -9.29 1.54 0.73 69.89 17.60 9.29
*US-EPA-Rule-E9-5711; natural gas; carbon fee: $2/mt. Table 10: Sustainability indicators for the methanol and ammonia plants*
Utilities Energy price, $/MJ Tin oC Tout
oC Factor* U** kW/m2 KElectricity $0.0775/kW h 0.58
Cooling Water $0.09/mt 20 25 1 3.75Medium Pressure Steam 2.2 × 10⁻³ 175 174 0.85 6.00
High Pressure Steam 2.5 × 10⁻³ 250 249 0.85 6.00Refrigeration 3.3 × 10⁻³ -39 -40 -1 1.30
*CO2 energy source efficiency factor; ** Utility side film coefficient for energy analysis.Table 11: Unit energy cost for various utilities with energy source of natural gas for 2014 [47].
Metrics Integral methanol plant Integral ammonia plant
Material metricsCO2 used/Unit product 1.39N2 used/Unit product 0.84H2 used/Unit product 0.19 0.18
Energy intensity metricsNet duty/unit product, MWh/mt 9.55 -1.17
Net cost/Unit product, $/mt 828.67 863.33Environmental impact metrics
Total CO2e/Unit product -0.85 1.03Net carbon fee/Unit product, $/mt -1.70 2.07
Table 12: Sustainability metrics for the integral methanol and ammonia plants
Process kg H2/kg prod.
H2 prod./comp.
Averageprod. BPT Theor
min.Average
kg CO2/kg prod.Methanol from CO2 0.189 37.06
Syngas-coal methanol 0.126 24.20 24.0 20.1 5.1 2.83Syngas-NG methanol 13.9 9.0-10 5.1 0.52
Ammonia 0.178 35.57syngas-NG Ammonia 15.4 7.2-9.0 5.8 2.52Syngas-coal Ammonia 27.9 22.0 8.1 4.91
SEC: Specific energy consumption that includes fuel, steam and electricity for the process.BPT: Best possible technology; GHG: greenhouse gas emissions as CO2 equivalent per ton of product; CO2e includes CO2, CH4, and NOx.Table 13: Specific energy consumptions and emissions for ammonia and methanol productions [22]

Citation: Matzen M, Alhajji M, Demirel Y (2015) Technoeconomics and Sustainability of Renewable Methanol and Ammonia Productions Using Wind Power-based Hydrogen. J Adv Chem Eng 5: 128. doi:10.4172/2090-4568.1000128
Page 10 of 12
Volume 5 • Issue 3 • 1000128J Adv Chem EngISSN: 2090-4568 ACE an open access journal
Economics andsustainability indicators
Weighting factor:0-1
Fossil- methanol
Non-fossil- methanol
Fossil-ammonia
Non-fossil-ammonia
Economic indicatorsNet present value NPV 1 + − + −Payback period PBP 0.8 + − + −Rate of return ROR 0.8 + − + −
Economic constraint EC 0.9 + − + −Impact on employment 1 + + + +Impact on customers 1 + + + +Impact on economy 1 + + + +
Impact on utility 0.7 − + − +Sustainability indicators
Material intensity 0.7 − + − +Energy intensity 0.8 + − + −
Environmental impactGHG in production 0.8 − + − +
Environmental impactGHG in utilization 0.8 − − + +
Toxic/waste material emissionsProcess safety and Public safety 1 − + − −
Potential for technologicalimprovements and cost reduction 0.8 − + − +
Security/reliability 0.9 − + − +Political stability and legitimacy 0.8 − + − +
Quality of life 0.8 − + − +Total positive score 8 11 9 11Total minus score 9 −6 −8 −6
Net score (positive-minus) −1 +5 +1 +5Weighted total score +0.2 +5.4 +2 +4
Table 14: Multi-criteria decision matrix for feasibility evaluation of chemical processes and energy systems
Tallaksen and Reese [38] compared the renewable and with fossil-based ammonia productions in terms of energy use and carbon emissions using the Life Cycle Assessment (LCA) methods. Renewable ammonia production requires around 60 GJ of electricity/mt ammonia. This is considerably more total energy than conventional fossil fuel based produced ammonia, however it requires less fossil energy and results in less GHG emissions. The boundary of LCA for the wind to ammonia contains wind power, water electrolysis, hydrogen compression, nitrogen separation and compression, ammonia production and ammonia storage. LCA is more focused on environmental issues rather than raw material depletion [38].
Main chemical storage of electricity involves the production of hydrogen, synthetic natural gas, and chemicals, which are mainly methanol and ammonia. Combination of several storage applications together may help electricity storage to be more feasible. The initial investment requires a cost per unit of power ($/kW) and a cost per unit of energy capacity ($/kWh), which are technology dependent [77]. The economics of electricity storage are influenced by the type of storage technology, electricity price, the frequency of charging and discharging cycles, and the system in which the storage facility is located. Besides, one needs to consider direct and localized impacts of the technology and the generation source used [77].
Assessment of Chemical Processes by a Multi-Criteria Decision Matrix
Beside the economics analysis, sustainability metrics should also be used to evaluate the feasibility of chemical processes [81-84]. Table 14 shows a Pugh decision matrix [85] developed using ‘+’ and ‘- ‘for the ratings to assess the methanol and ammonia production plants. Four scores generated show the number of plus scores, minus scores, the overall total, and the weighted total. The weighted total adds up the
scores times their respective weighting factors. The totals are guidance only for decision making. If the two top scores are very close or very similar, then they should be examined more closely to make a more informed decision. Renewable energy-based systems may require the combined use of scenario building and participatory multi-criteria analysis for sustainability assessment [84].
Table 14 indicates the weighted decision matrix to compare the plants producing methanol and ammonia from fossil and non-fossil resources. The weight factor can be adjusted with respect the location, energy policies, and energy costs and security. With the weight factors and the combined economic and sustainability indicators, the decision matrix has estimated the highest weighted scores for the renewable methanol and ammonia production facilities. The positive weighted score for the renewable methanol (+5.4) is slightly better than the renewable ammonia production (+ 4). These scores indicate the overall impact of sustainability indicators beside the economics.
ConclusionRenewable hydrogen, methanol, and ammonia productions
may lead to renewable electricity storage and reduce the carbon emissions either by recycling and/or fixation of the carbon. The cost of hydrogen production plays an important role within the economics of the renewable methanol and ammonia productions and determines the scope of improvements necessary for feasible operations. The economic analysis shows that the cost of electrolytic hydrogen is critical in the economics of renewable methanol and ammonia plants at the capacities assumed in this study and using the currently available technologies. Despite its poor overall efficiency and high up-front capital costs, chemical storage may provide the large-scale and long-term storage requirements of a mixed renewable power generation. Multi-criteria decision matrix, containing the sustainability indicators,

Citation: Matzen M, Alhajji M, Demirel Y (2015) Technoeconomics and Sustainability of Renewable Methanol and Ammonia Productions Using Wind Power-based Hydrogen. J Adv Chem Eng 5: 128. doi:10.4172/2090-4568.1000128
Page 11 of 12
Volume 5 • Issue 3 • 1000128J Adv Chem EngISSN: 2090-4568 ACE an open access journal
show that chemical processes that use non-fossil fuels may achieve better overall weighted scores. This helps accounting the cost of environmental damage from using fossil fuels in the overall assessment of feasibility for chemical process and energy systems. This is in line with the need for the development of low-carbon chemical processes and energy technologies in order to address the global challenges of energy security, climate change, and economic growth. Acknowledgement
The authors acknowledge the partial financial support (4200001187) by the Nebraska Public Power District (NPPD) Columbus, Nebraska 68602-1740.
References
1. Demirel Y (2012) Energy: Production, Conversion, Storage, Conservation, and Coupling. Springer-Verlag London, London.
2. U.S. Energy Information Administration (2014): Annual Energy Outlook.
3. Parsons B, Milligan M, Zavadil B, Brooks D, Kirby B, et al. (2004) Grid Impacts of Wind Power. A Summary of Recent Studies in the United States. Wind Energy 7: 87-108.
4. Wiser R, Ryan H, Bolinger M (2011) Wind Technologies: Market Report. Golden, CO: NREL.
5. Solar and Wind Technologies for Hydrogen Production (2005) ESECS EE-3060.
6. Esmaili P, Dincer I, Naterer GF (2012) Energy and exergy analyses of electrolytic hydrogen production with molybdenum-oxo catalysts. Int J Hydrogen Energy 37: 7365-7372.
7. Turner J, Sverdrup G, Mann MK, Maness PC, Kroposki B, et al. (2008) Renewable hydrogen production. Int J Energy Research 32: 379-407.
8. Dincer I, Ratlamwala TAH (2013) Development of novel renewable energy based hydrogen production systems: a comparative study. Int J Hydrogen Energy 72: 77-87.
9. Dingizian A, Hansson J, Persson T, Ekberg HS, Tuna PA (2007) Feasibility Study on Integrated Hydrogen Production Presented to Norsk Hydro ASA Norway.
10. Norsk Electrolyzer.
11. U.S. Department of Energy (2007) Hydrogen, Fuel Cells & Infrastructure Technologies Program, Safety Planning Guidance for Hydrogen Projects.
12. James BD, Moton JM, Whitney G, Colella WG (2013) Guidance for Filling out a Detailed H2A Production Case Study. EERE, US.
13. Galindo CP, Badr O (2007) Renewable hydrogen utilization for the production of methanol. Energy Convers Manag 48: 519-527.
14. Olah GA, Goeppert A, Prakash GKS (2009) Chemical recycling of carbon dioxide to methanol and dimethyl ether from greenhouse gas to renewable environmentally carbon neutral fuels and synthetic hydrocarbons. J Org Chem 74: 487-498.
15. Demirel Y, Matzen M, Winters C, Gao X (2015) Capturing and using CO2 as feedstock with chemical-looping and hydrothermal technologies and sustainability metrics. Int J Energy Research 39: 1011-1047.
16. Nguyen N, Demirel Y (2013) Biodiesel-glycerol carbonate production plant by glycerolysis. J Sustainable Bioenergy Systems 3: 209-216.
17. Jiang Z, Xiao T, Kuznetsov VL, Edwards PP (2010) Turning carbon dioxide into fuel. Phil Trans R Soc A 368: 3343-3364.
18. Olah GA, Goeppert A, Prakash GKS (2011) Beyond Oil and Gas: The Methanol Economy. 2nd edition, Wiley, New York, USA.
19. European Parliamentary Research Service (2014) Methanol: a future transport fuel based on hydrogen and carbon dioxide. Economic viability and policy options, Science and Technology Options Assessment.
20. Specht M, Staiss F, Bandi A, Weimer T (1997) Comparison of the renewable transportation fuels, liquid hydrogen and methanol, with gasoline: energetic and economic aspects. Int J Hydrogen Energy 23: 387-396.
21. EPA (2002) Clean alternative fuels: Methanol. Technical Report-420-F-00-040. Washington DC, USA.
22. IEA (2013)Energy and GHG reductions in the chemical industry via catalytic processes: Annexes, Dechema/, ICCA.
23. Hugill JA, Overbeek JP, Spoelstra SA (2001) Comparison of the eco-efficiency of two production routes for methanol: Report ECN-I-01-003. Energy Research Centre of the Netherlands, Netherlands.
24. US Department of Energy (2003) Commercial-scale demonstration of the liquid phase methanol (LPMEOH) process: Report No-DOE/NETL-2004/1199. Washington DC, USA.
25. Finley R (2006) Illinois State Geological Survey: Evaluation of CO2 Capture Options from Ethanol Plants.
26. Martin O, Perez-Ramírez J (2013) New and revisited insights into the promotion of methanol synthesis catalysts by CO2. Catal Sci Technol 3: 3343-3352.
27. Kansha Y, Ishizuka M, Tsutsumi A (2013) Development of innovative methanol synthesis process based on self-heat recuperation. Chem Eng Transac 35: 37-42.
28. Bandose A, Urukawa A (2014) Towards full one-pass conversion of carbon dioxide to methanol and methanol-derived products. J Catalysis 309: 66-70.
29. Hoekman SK, Broch A, Robbins C, Purcell R (2010) CO2 recycling by reaction with renewably-generated hydrogen. Int J Greenhouse Gas Control 4: 44-50.
30. Wang W, Wang S, Ma X, Gong J (2011) Recent advances in catalytic hydrogenation of carbon dioxide. Chem Soc Rev 40: 3703-3727.
31. Lim HW, Park MJ, Kang SH, Chae HJ, Bae JW, et al. (2009) Modeling of the kinetics for methanol synthesis using Cu/ZnO/Al2O3/ZrO2 catalyst: Influence of carbon dioxide during hydrogenation. Ind Eng Chem Res 48: 10448-10455.
32. Studt F, Sharafutdinov I, Abild-Pedersen F, Elkjaer CF, Hummelshoj JS, et al. (2014) Discovery of a Ni-Ga catalyst for carbon dioxide reduction to methanol.
Nature Chem 6: 320-324.
33. Rihko-Struckmann LK, Peschel A, Hanke-Rauschenbach R, Sundmacher K (2010) Assessment of methanol synthesis utilizing exhaust CO2 for chemical storage of electrical energy. Ind Eng Chem Res 49: 11073-11078.
34. Kauw M (2012) Recycling of CO2, the perfect biofuel. Master report, University of Groningen, Netherlands.
35. National Energy Technology Laboratory (2013) Carbon dioxide transport and storage costs in NETL studies.
36. Yang CJ, Jackson RB (2012) China’s growing methanol economy and its implications for energy and the environment. Energy Policy 41: 878-884.
37. Thomas G, Parks G (2006) Potential roles of ammonia in a hydrogen economy. US Department of Energy.
38. Tallaksen J, Reese M (2013) Ammonia production using wind energy: An early calculation of life cycle carbon emissions and fossil energy consumption. Tenth Annual NH3 Fuel Conference, University of Minnesota, West Central Research and Outreach Center.
39. Morgan E, Manwell J, McGowan J (2014) Wind-powered ammonia fuel production for remote islands: A case study. Renew Energy 72: 51-61.
40. European Fertilizer manufacturer Association (2000) Production of Ammonia: Belgium.
41. LeBlanc JR, Knez SA (1998) Ammonia production with enriched air reforming and nitrogen injection into synthesis loop. US5736116 A.
42. Whitlock DR (1999) Method for ammonia production. US5968232 A.
43. Martins AA, Mata TM, Costa CAV, Sikdar SK (2007) Framework for sustainability metrics. Ind Eng Chem Res 46: 2962-2973.
44. Sikdar SK (2003) Sustainable development and sustainability metrics. AIChE J 49: 1928-1932.
45. Center for Waste Reduction Technologies (2004) Focus Area: Sustainability Metrics.
46. IChemE (2004) Sustainable development progress metrics recommended for use in the process industries.
47. Aspen Technology Inc. Burlington, MA, USA.
48. Chemical Engineering (2015) June: 80.
http://ivem.eldoc.ub.rug.nl/FILES/ivempubs/dvrapp/EES-2012/EES-2012-139M/EES-2012-139M_MarcoKauw.pdf

Citation: Matzen M, Alhajji M, Demirel Y (2015) Technoeconomics and Sustainability of Renewable Methanol and Ammonia Productions Using Wind Power-based Hydrogen. J Adv Chem Eng 5: 128. doi:10.4172/2090-4568.1000128
Page 12 of 12
Volume 5 • Issue 3 • 1000128J Adv Chem EngISSN: 2090-4568 ACE an open access journal
49. Wind-To-Hydrogen Project (2008) Electrolyzer Capital Cost Study. NREL, Technical Report NREL/TP-550-44103.
50. Saur G, Ainscough C, Harrison K, Ramsden T (2013) Hour-by-Hour Cost Modeling of Optimized Central Wind-Based Water Electrolysis Production. National Renewable Energy Laboratory.
51. European Commission Decision (2007) 2007/589/EC: Official Journal of the European Commission, L229 1-4.
52. EPA Rule E9-5711 (2009) Federal Register, Proposed Rules 74: 16639-16641.
53. Kothari R, Buddhi D, Sawhney RIL (2008) Comparison of environmental and economic aspects of various hydrogen production methods. Renewable Sustainable Energy Reviews 12: 553-563.
54. Mueller-Langera F, Tzimas E, Kaltschmitt M, Peteves S (2007) Techno-economic assessment of hydrogen production processes for the hydrogen economy for the short and medium term. Int J Hydrogen Energy 32: 3797-3810.
55. Barranon DCC (2006) Methanol and hydrogen production: energy and cost analysis. Lulea University of Technology, Lulea, Sweden.
56. Committee on Alternatives and Strategies for Future Hydrogen Production and Use (2004) The Hydrogen Economy: Opportunities, Costs, Barriers, and R&D Needs 99.
57. Dodds PE, McDowall W (2012) A review of hydrogen production technologies for energy system models, UCL Energy Institute, University College London.
58. Holladay JD, Hu J, King DL, Wang Y (2009) An over view of hydrogen production technologies. Catal Today 139: 244-260.
59. Spath PL, Mann MK (2004) Life Cycle Assessment of Renewable Hydrogen Production via Wind/Electrolysis. Milestone Completion Report-NREL/MP-560-35404.
60. International Energy Agency (2006) Hydrogen Production and Storage. R&D Priorities and Gaps.
61. Penev M (2013) Hybrid hydrogen energy storage. NREL, All-Energy, Aberdeen, UK.
62. National Academy of Science (2004) The Hydrogen Economy: Opportunities, Costs, Barriers, and R&D Needs. National Academies Press, Washington DC, USA.
63. Toyir J, Miloua R, Elkadri NE, Nawdali M, Toufik H, et al. (2009) Sustainable process for the production of methanol from CO2 and H2 using Cu/ZnO-based multicomponent catalyst. Physics Procedia 2: 1075-1079.
64. Machado CFR, de Medeiros JL, Araujo OFQ, Alves RMB (2014) A comparative analysis of methanol production routes: synthesis gas versus CO2 hydrogenation. Proceedings of the 2014 International Conference on Industrial Engineering and Operations Management Bali, Indonesia 7-9.
65. Graaf GH, Stamhuis EJ, Beenackers AACM (1988) Kinetics of low pressure methanol synthesis. Chem Eng Sci 43: 3185-3195.
66. Weiduan S, Junli Z, Bingchen Z, Honfshi W, Dingye F, et al. (1998) Kinetics of methanol sysnthesis in the presence of C301 Cu-based catalyst (I) intrinsic and global kinetics. J Chem Ind Eng 39: 401-409.
67. Skrzypek J, Lachowska M, Moroz H (1991) Kinetics of methanol synthesis over commercial copper/zinc oxide/alumina catalysts. Chem Eng Sci 46: 2809-2813.
68. Bussche KMV, Froment GF (1996) A steady-state kinetic model for methanol synthesis and the water gas shift reaction on a commercial Cu/ZnO/Al2O3 catalyst. J Catalysis 161: 1-10.
69. Aksgaard TS, Norskov JK, Ovesen CV, Stoltze P (1995) A kinetic model of methanol synthesis. J Catalysis 156: 229-242.
70. Clausen LR, Houbak N, Elmegaard B (2010) Technoeconomic analysis of a methanol plant based on gasification of biomass and electrolysis of water. Energy 35: 2338-2346.
71. Nielsen SE (2007) Latest developments in ammonia production technology. FAI International Conference in Fertiliser Technology, New Delhi, India 12-13.
72. Yan L, Yu Y, Li Y, Zhang Z (2010) Energy Saving Opportunities in an Air Separation Process; International Refrigeration and Air Conditioning Conference, Lafayette, Indiana, USA.
73. Liquid Air Energy Network (2013)Liquid air production and cost.
74. Turton R, Bailie RC, Whiting WB, Shaeiwitz JA, Bhattacharya D (2012) Analysis, Synthesis, and Design of Chemical Processes. 4th edition, Upper Saddle River, Prentice Hall.
75. Methanex (2014) Methanol Price.
76. Knorr B (2014) Weekly Fertilizer Review.
77. Electricity Storage Association (2009) Power Quality, Power Supply.
78. Ting LH, Man LH, Yee NW, Yihan J, Fung LK (2012) Techno-economic analysis of distributed hydrogen production from natural gas. Chinese J Chem Eng 20: 489-496.
79. Zoulias EI, Lymberopoulos N (2007) Techno-economic analysis of the integration of hydrogen energy technologies in renewable energy-based stand-alone power systems. Renewable Energy 32: 680-696.
80. Arons JDS, Kooi HVD, Sankaranarayanan K (2004) Efficiency and Sustainability in the Energy and Chemical Industries. CRC Press, New York, USA.
81. Dincer I, Rosen MA (2007) Exergy: Energy, Environment and Sustainable Development. Burlington, Elsevier.
82. Patel AD, Meesters K, den Uil H, de Jong E, Blok K, et al. (2012) Sustainability assessment of novel chemical processes at early stage: application to biobased processes. Energy Environ Sci 5: 8430-8444.
83. Demirel Y (2013) Sustainable Operations for Distillation Columns. Chem Eng Process Techniq 1005: 1-15.
84. Kowalski K, Stagl S, Madlener R, Oman I (2009) Sustainable energy futures: Methodological challenges in combining scenarios and participatory multi-criteria analysis. Europ J Operat Res197: 1063-1074.
85. Pugh S (1981) Concept selection, a method that works. In: Hubka V (ed) Review of design methodology. Proceedings international conference on engineering design, Rome, Zürich: Heurista 497-506.