Techniques for Feature Extraction From EMG Signal
4
© 2011, IJARCSSE All Rights Reserved Volume 2, Issue 1, January 2012 ISSN: 2277 128X International Journal of Advanced Research in Computer Science and Software Engineering Research Paper Available online at: www.ijarcsse.com Techniques for Feature Extraction from EMG Signal Sachin Sharma 1 , Gaurav Kumar 2 , Sandeep Kumar 3 , Debasis Mohapatra 4 Department of Instrument and Control Engineering, NIT Jalandhar Abstract — The myoelectric signal (MES) is one of the biosignals utilized in helping humans to control equipments. For this we required to recognize the hand movement. In this direction the first step is feature extraction. The optimal feature is i mportant for the achievement in EMG analysis and control. By this extracted feature we reduce the computational cost of a multifunction myoelectric control system. The goal of this paper is to define the methods and approaches which are most suited for extracting the features from EMG signal. The techniques discussed here are spectral approaches like STFT, Thompson transform etc, wavelet based analysis, fuzzy based feature extracter and temporal approaches. Keywords: Feature Extraction, STFT, Wavelet, Thompson Transform. I. INTRODUCTION The Electromyography (EMG) signal, also referred to as the myoelectric signal (MES), acquired from the forearm skin surface provides valuable information about neuromuscular activities. Electromyography (EMG) signals have the properties of non-stationary, nonlinear, complexity, and large variation. These lead to difficulty in analyzing EMG signals. To make a system based on the EMG first we need to extract the features of the acquired EMG signal based on which it can be further classified for various hand movements. This technique is also called as pattern classification. In case of EMG signal a pattern is represented by the temporal signal given in fig. 1. Normally the temporal signals are of limited (shorter) duration and are sampled and converted into digital format. In such situation it is more appropriate to represent a pattern as a finite time sequence s[0], s[1],..., s[ N -1] . Presenting this sequence directly to a classifier is impractical due to the large number of inputs and due to the randomness of the signal. Therefore, the sequence s[n] must be mapped into a smaller-dimension vector X = (x 1 , x 2 ,...,x D ), D<< N , called feature vector , which best characterizes the pattern. The MES is a complicated signal controlled by the central nervous system (CNS). It is affected by anatomical and physiological properties of muscles, the control scheme of the peripheral nervous system, and the characteristics of the instrumentation used to detect and measure the signal[1-2]. There is a wide area of research in the development of the control system based on pattern recognition of EMG signals. One of the control strategies being extensively researched is known as myoelectric control strategy. In this prosthetic arm is controlled by utilizing pattern recognition to classify the EMG patterns. The limitations on these control system is the huge amount of data extracted from the myoelectric signal required to be processed. This limitation can be removed by utilizing the feature extraction techniques which converts the large amount of data into smaller dimension data. The aim of this paper is present various techniques [3-6] which can be used to extract the features from the recorded EMG signal. All approaches have been used in classification of EMG patterns. There are various approaches and methods[7-9] for feature extraction. All approaches have been used in classification of EMG patterns. The goal of this work is to present methods some of existing and successful feature extraction methods. Fig.1. Recorded Row EMG signal II. FEATURE EXTRACTION METHODS There are various methods which can be used to extract the features from the acquired EMG data. These methods are different from the classical approaches like spectral analysis of the EMG signal. A. Wavelet Analysis Wavelet Transform (WT) is a time-frequency analysis method that is successful in the analysis of non-stationary signals including the EMG signal. However, the WT yields a high-dimensional feature vector [10]. But high dimensionality of a feature vector causes an increase in the learning parameters of a classifier [11]. This leads to the requirement of dimensionality reduction method which can increase the speed as well as the accuracy of the classifier [11-13]. For this reason, in wavelet analysis, selection of an optimal dimensionality reduction method is essential before applying the feature vector to a classifier. Feature projection, Principal component analysis are some famous techniques for dimension reduction. The main benefit of the WT is
-
Upload
sachin-sharma -
Category
Documents
-
view
230 -
download
0
Transcript of Techniques for Feature Extraction From EMG Signal
8/3/2019 Techniques for Feature Extraction From EMG Signal
http://slidepdf.com/reader/full/techniques-for-feature-extraction-from-emg-signal 1/4
© 2011, IJARCSSE All Rights Reserved
Volume 2, Issue 1, January 2012 ISSN: 2277 128X
International Journal of Advanced Research in
Computer Science and Software EngineeringResearch Paper
Available online at: www.ijarcsse.com
Techniques for Feature Extraction from EMGSignal
Sachin Sharma1, Gaurav Kumar2, Sandeep Kumar3, Debasis Mohapatra4
Department of Instrument and Control Engineering, NIT Jalandhar
Abstract — The myoelectric signal (MES) is one of the biosignals utilized in helping humans to control equipments. For this we
required to recognize the hand movement. In this direction the first step is feature extraction. The optimal feature is important for the
achievement in EMG analysis and control. By this extracted feature we reduce the computational cost of a multifunction myoelectric
control system. The goal of this paper is to define the methods and approaches which are most suited for extracting the features from
EMG signal. The techniques discussed here are spectral approaches like STFT, Thompson transform etc, wavelet based analysis,
fuzzy based feature extracter and temporal approaches.
Keywords: Feature Extraction, STFT, Wavelet, Thompson Transform.
I. INTRODUCTION
The Electromyography (EMG) signal, also referred to as
the myoelectric signal (MES), acquired from the forearm skin
surface provides valuable information about neuromuscular
activities. Electromyography (EMG) signals have theproperties of non-stationary, nonlinear, complexity, and large
variation. These lead to difficulty in analyzing EMG signals.
To make a system based on the EMG first we need to extract
the features of the acquired EMG signal based on which it can
be further classified for various hand movements. This
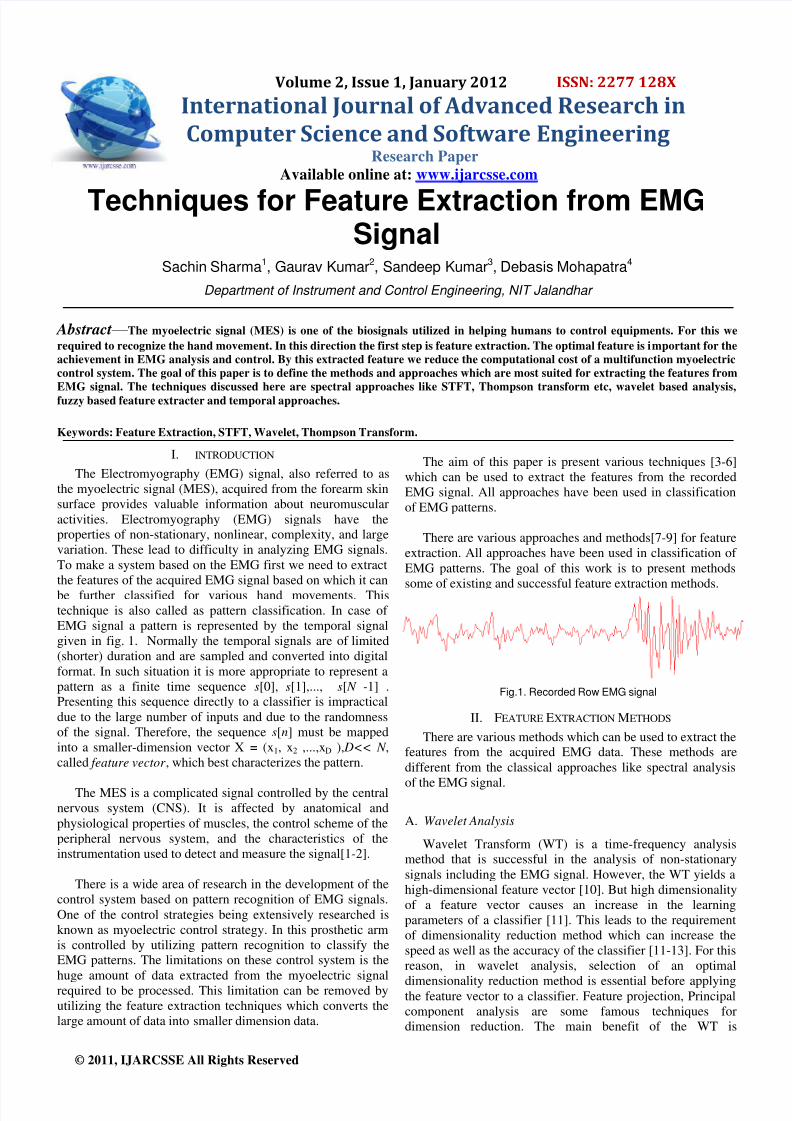
technique is also called as pattern classification. In case of
EMG signal a pattern is represented by the temporal signal
given in fig. 1. Normally the temporal signals are of limited
(shorter) duration and are sampled and converted into digital
format. In such situation it is more appropriate to represent a
pattern as a finite time sequence s[0], s[1],..., s[ N -1] .Presenting this sequence directly to a classifier is impractical
due to the large number of inputs and due to the randomness
of the signal. Therefore, the sequence s[n] must be mapped
into a smaller-dimension vector X = (x1, x2 ,...,xD ), D<< N ,
called feature vector , which best characterizes the pattern.
The MES is a complicated signal controlled by the central
nervous system (CNS). It is affected by anatomical and
physiological properties of muscles, the control scheme of the
peripheral nervous system, and the characteristics of the
instrumentation used to detect and measure the signal[1-2].
There is a wide area of research in the development of the
control system based on pattern recognition of EMG signals.
One of the control strategies being extensively researched is
known as myoelectric control strategy. In this prosthetic arm
is controlled by utilizing pattern recognition to classify theEMG patterns. The limitations on these control system is the
huge amount of data extracted from the myoelectric signal
required to be processed. This limitation can be removed by
utilizing the feature extraction techniques which converts the
large amount of data into smaller dimension data.
The aim of this paper is present various techniques [3-6]
which can be used to extract the features from the recorded
EMG signal. All approaches have been used in classification
of EMG patterns.
There are various approaches and methods[7-9] for feature
extraction. All approaches have been used in classification of
EMG patterns. The goal of this work is to present methods
some of existing and successful feature extraction methods.
Fig.1. Recorded Row EMG signal
II. FEATURE EXTRACTION METHODS
There are various methods which can be used to extract thefeatures from the acquired EMG data. These methods are
different from the classical approaches like spectral analysis
of the EMG signal.
A. Wavelet Analysis
Wavelet Transform (WT) is a time-frequency analysismethod that is successful in the analysis of non-stationary
signals including the EMG signal. However, the WT yields a
high-dimensional feature vector [10]. But high dimensionality
of a feature vector causes an increase in the learning
parameters of a classifier [11]. This leads to the requirement
of dimensionality reduction method which can increase the
speed as well as the accuracy of the classifier [11-13]. For this
reason, in wavelet analysis, selection of an optimal
dimensionality reduction method is essential before applyingthe feature vector to a classifier. Feature projection, Principal
component analysis are some famous techniques fordimension reduction. The main benefit of the WT is

8/3/2019 Techniques for Feature Extraction From EMG Signal
http://slidepdf.com/reader/full/techniques-for-feature-extraction-from-emg-signal 2/4
Volume 2, issue 1, January 2012 www.ijarcsse.com
© 2011, IJARCSSE All Rights Reserved
generation of the useful subset of the frequency components
or scales of the interested signal.
Fig.2: Procedure of extraction of the EMG features
Wavelet transform method is divided into two types:
discrete wavelets transform (DWT) and continuous Wavelettransform (CWT). Generally DWT is used for the analysis of
discretised EMG data [14-15]. The DWT transforms the EMG
signal with a suitable wavelet basis function (WF). In this theoriginal EMG signal is passed through a low-pass filter and a
high-pass filter (coefficients of filters depend on WF type) to
obtain an approximation coefficient subset (CA1) and a detail
coefficient subset (CD1) at the first level. In order to obtain
the multiple-resolution subsets, repetitious transformation is
done. This process is repeated until the desired final level isobtained. In the EMG analysis, four levels of wavelet
decomposition show better performance [16-18]. These
coefficients works as the features of the EMG signal.
However some good wavelet functions that are suitable forEMG signal analysis are shown in paper [18].
B. Auto Regressive Analysis
The Auto Regressive modelling has been used effectively
in order to process the EMG signal and to get the feature
vector out of it. The AR parameter a, reflection coefficient k
can be used as the feature vector for the classification of theEMG signal.
In the AR model (also called linear prediction model),
each sample x(n) of the SEMG is described as a linear
combination of previous samples plus an error term e(n)
which is independent of past samples[]
Where
x(n) Samples of the modelled signal.
ak AR coefficients
e(n) Residual of error sequence
p Model‘s order
The model can be interpreted as a linear system with e(n)
as its input and x(n) its output. e(n) is white noise and x(n) is
the SMEG. The transfer function of the system is given by:
represents the AR filter. H(z) contains poles only. Thus, the
model can work only for signals with a well-defined peaky
spectrum like speech [19] and EEG [20], and can be fitted alsoto SEMG, as will be shown below. The spectrum off the
sequence x(n) can be estimated from the model.
It was assumed that the spectrum of e(n) satisfies |E(w)| =1,
i.e., for the appropriate p it approaches a white noise sequence.
The AR coefficients (ai) are calculated by an algorithm []
that minimizes the residual energy ) .
From the 256 samples in each block, the following parameters
are calculated:
Ai, i= 1,2,…..p The AR coefficients.
Ki, i=1,2,…...p The reflection coefficients [21]
Pi, i=1,2,…..P The poles of the AR filter H(z).
These parameter of the AR analysis are than used the
feature vector for the SEMG signal and can be further used for
analysis e.g. classification.
III. FREQUENCY DOMAIN APPROACHES
There are various techniques in the frequency domain bywhich we can extract the feature from EMG signals
A. Power Spectral Density
This is the very easy and traditional way to characterize the
spectral properties of a time sequence. Power Spectral Density
(PSD) can be obtained from the signal by the formula given
below.
In order to decrease the spectral leakage caused bytruncation, the sequence is multiplied by the sometime
windowing function, e.g. Hamming window, Black Mann
window etc.
B. Spectral Magnitude Averages
Spectral Magnitude Averages is defined as the someaveraged values of power spectral density. It is given by the
following equation:
These averages help to reduce the effect of a considerable
variance of power spectral density.

8/3/2019 Techniques for Feature Extraction From EMG Signal
http://slidepdf.com/reader/full/techniques-for-feature-extraction-from-emg-signal 3/4
Volume 2, issue 1, January 2012 www.ijarcsse.com
© 2011, IJARCSSE All Rights Reserved
C. Thompson Transform
For the short time sequences the PDF becomes ineffective
due to increased bias and variance. The discrete Fourier
transform of the truncated sequence can be written as:
The sum of the right hand side is known as Dirichlet kernel
function.
By substitution we can get:
This equation shows that the estimated spectrum is
convoluted version of the true spectrum due to truncation of
the time sequence. In order to make best estimate of the true
spectrum, the integral, the integral equation has to be solved,
which is an ill-posed inversion problem.
Thompson has offered a solution which is based on the
spectral decomposition of the Dirichlet Kernel function. The
Thompson estimator of PSD can be summarized as follows:
Where λ k and vk [22] are eigenvalues and associated
orthonormal eigenvectors of the Dirichlet-Toeplitz D with
elements:
The sequences vk are called discrete prolate spheroidal
sequences (DPSS). Both vk and λ k depend on parameters N
and W.
D. Short Time Fourier Transform
The short time Fourier transform has been used by Hanaford
etal [23] to study the rapid head and wrist movement, and to
show that the spectrum changes with time. by using awindowing function STFT can be expressed as:
Often phase unwrapping is employed along either or boththe time axis T and frequency axis, w, to surpress any jump
discontinuity of the phase result of the STFT.
The time Index T is normally considered to be ‗slow‘ timeand usually not expressed in as high resolution as time t.
IV. CONCLUSION
The goal of this paper was to present the various methodslike wavelet approaches, auto regressive methods in the field
of feature extraction of EMG signals. This paper alsopresented the various spectral approaches that can be used in
order to extract the feature vector from the surface EMG
signals. There are also various spatial or time domain
approaches which can also be used for the feature extraction
from EMG signals. There is lot of work done in spatial
domain by using zero crossing and methods based on
amplitude of the EMG signal. In the future there can be
various algorithms which will use fuzzy logic, neural
networks in order to extract the features from EMG signals.
V. REFERENCES [1]. C.J.De Luca, ― Physiology and mathematics of myoelectr ic
signals,‖ IEEE Transactions on Biomedical Engineering, vol.BME-26, pp. 313-325, 1979.
[2]. R. Merletti and P. Parker, ― Electromyography physiology,
Engineering, and noninvasive applications,‖ IEEE PressEngineering in Medicine and Biology Society., 2004.
[3]. A. Phinyomark, C. Limsakul, P. Phukpattaranont, ― Application of Wavelet analysis in EMG Feature Extraction for Pattern
Classification‖, Measurement Science Review, Volume 11, No. 2,2011.
[4]. Rami N. Khushaba, Adel Al-Jumaily, ―Fuzzy Wavelet Packetbased Feature Extraction Method for Multifunction Myoelectric
Control‖, world academy of science, Engineering and Technology
13, 2006.[5]. Omry Paiss and Gideon F. Inbar, ―Autoregressive Modeling of
Surface EMG and Its Spectrum with Application to Fatigue‖,IEEE Transaction on Biomedical Engineering, Vol. BME-34, No.10, October 1987.
[6]. A. Phinyomark, S. Hirunviriya, C. Limsakul, P. Phukpattaranount,
―Evaluation of EMG Feature Extraction for Hand MovementRecognition Based on Euclidean Distance and Standard
Deviation,‖ Department of Electrical Engineering, Faculty of
Engineering, 2010.[7]. M.I. Vuskovic, A.L. Pozos and R. Pozos: ― Classification of Grasp
Modes Based on Electromyographic Patterns of Preshaping
Motions,‖ Proc. Of the Internet, Conference on systems, Man andCybernetics, Vancouver, B.C., Canada, October 22-25, pp. 89-95,
1995.[8]. M. Vuskovic, J. Schmit, B. Dundon and C. Konopka:
― Hierachical Discrimination of Grasp Modes Using Surface
EMGs,‖ Internet. IEEE Conference on Robotics and Automation,
Minneapolis, Minnesota, pp. 2477-2483, April 22-28, 1996.[9]. M. Vuskovic and Sijiang, Du: ―Classification of EMG Patterns
with Simplified Fuzzy ART Networks,‖ Proc. Of the 2001International Joint Conference on neural Networks, Honolulu, HI,
May 12-17, 2002.
[10]. Wang. G, Wang. Z., Chen. W., Zhuang J., ―Classification of surface EMG signals using optimal wavelet packet method based
on Davies-Bouldin criterion.‖ Med. Biol. Eng. Comput., 44(4),
865-872.[11]. Englehart. K., hudgins G., Parker P.A., ― A wavelet -based
continuous classification scheme for multifunction myoelectric
control. IEEE Trans. Biomed. Eng., 48(3), 302-311, 2001.[12]. Chu J.U., Moon I., Mun M.S., ― A real-time EMG pattern
recognition system based on linear nonlinear feature projection for
a multifunction myoelectric control.‖ IEEE TransactionBiomedical Eng. 53, 2232-2239, 2006.
[13]. Chu J.U., Moon I., Lee Y.J., Kim S.K., Mun M.S., ― Asupervised feature-projection-based real-time EMG pattern
recognition for multifunction myoelectric hand control.‖IEEE/ASME Transaction Mechatron., 12, 282-290, 2007.
[14]. Canal M.R., ―Comparison of wavelet and short time Fourier Transform methods in the analysis of EMG signals.‖ J. Med. Syst,.34(1), 91-94, 2010.
[15]. Oskoei M.A., Hu H., ― Myoelectric control systems – a survey.‖Biomedical Signal Processing Control, 2(4), 275-294, 2007.
[16]. Yang G.Y., Luo Z.Z., ― Surface electromyography disposal based
on the method of wavelet de-noising and power spectrum.‖International Conference on Intelligent Mechatronics and
Automation, August 2004. Chengdu, China, 896-900, 2004.
[17]. Buranachai C., Thanvarungkul P., Kanatharanaa P., meglinski I.,―Application of wavelet analysis in optical coherence tomography
for obscured pattern recognition. Laser Physics Lett., 6(12), 892-
895, 2009.[18]. Phinyomark A., Limsakul C., Phukpattaranont P., ―Optimal
wavelet functions in wavelet denoising for multifunction
myoelectric control.‖ ECTI Transacion on Electrical Eng.Electronics, and Communications, 8(1), 43-52, 2010.
8/3/2019 Techniques for Feature Extraction From EMG Signal
http://slidepdf.com/reader/full/techniques-for-feature-extraction-from-emg-signal 4/4
Volume 2, issue 1, January 2012 www.ijarcsse.com
© 2011, IJARCSSE All Rights Reserved
[19]. J. D. Markel and A. H. Gray, ― Linear Prediction of Speech.‖Berlin: Springer-Verlag. 1976.
[20]. W. Gersch, ― Spectral analysis of EEG‘s by autoregressivedecomposition of time series,‖ Math. Biosci. Vol. 7 p.p. 205 -222,
1970.
[21]. J. makhoul, ― Linear prediction: A tutorial Review,‖ Proc. IEEE,vol. 63, pp. 561-579, 1975.
[22]. Slepian, ―Prolate Spherodial Wave Functions, Fourier Analysis,
and Unertainty-V: The Discrete Case,‖ The Bell System Technical
journal, Vol 57, No. 5, May-June 1978.[23]. B. Hannaford, S. Lehman, ―Short Time Fourier Analysis of the
Electromyogram: Fast Movements and Constant Contraction,‖
IEEE Transactions on biomedical Engineering, vol. BME-33,
pp.1173-1181, Dec. 1986.
Authors
Sachin Sharma was born at Dadri, UttarPradesh, India on 5 July, 1987. Currently, Heis pursuing his M.tech degree inInstrumentation and Control Engineeringfrom NIT Jalandhar. He did his B.tech inElectronics and Communication Engineeringfrom GLA Institute of Technology &Management, Mathura. He has publishedseveral papers in International conferences
and International journals on robotics andautonomous systems. His area of researchinterest includes signal processing, neuralnetworks, embedded systems, system
designing, biomedical application and artificial intelligence.
Gaurav Kumar was born at Jalalpur village,Aligarh, U.P., India on 20 May, 1989. He ispursuing his M.tech degree inInstrumentation and Control Engineeringfrom NIT Jalandhar. He did his B.tech inElectronics and Instrumentation Engineeringfrom Hindustan College of Science andTechnology, Mathura. He has publishedmany papers in International Journals andConferences. His area of interest includes
control and automation.
Debasis Mohapatra was born at Bhubaneswar,India on 10th May 1986. Currently he ispursuing his M.tech degree in Instrumentation& Control Engineering from NIT Jalandhar. Hedid his B.tech in Applied Electronics andInstrumentation from SIT Bhubaneswar. He haspublished several papers on process control. Hisarea of research interest includes Processcontrol and biometrics.