
TECHNICAL UNIVERSITY OF MOLDOVA - UTM · 2019. 4. 9. · technical university of moldova

Technical University of Denmark
Center for Information and Communication Technologies
NETWORK INFRASTRUCTURE TO SUPPORT RESEARCH AND EDUCATION NETWORK IN GHANA
(Master Thesis)
Barfi-Adomako Owusu, Student ID: s031452
Supervisors: Reza Tadayoni Jakob Buron
January 2007 Lyngby, Denmark

ii
Acknowledgement I am grateful to Reza Tadayoni and Jakob Buron for their supervision, feedback and helpful suggestions throughout the project. Specially thanks to Professor Knud Erik Skouby and the entire staff of CICT for their support during my stay in Denmark. I would like to dedicate this thesis to my wife Grace and my children in Ghana for supporting me all the time.

iii
Abstract This project examines and evaluates the campus-wide networks of five selected universities and two research institutions in Ghana. The nationwide backbone that would be needed to run these networks is also covered. Three of such backbones are identified as VRA Integrated fiber-optic backbone, New National backbone and Ghana Telecom country-wide networks. The Dwivedi and Wagner traffic model provides estimates of traffic demands based on published data on Ghana and selected educational nodes using 2005 as a reference year. Further traffic projections are given from 2005 to 2010 using results from the traffic model. The separation of the traffic into voice, transaction data and internet traffic shows that, the Internet traffic will constitute about 45%, Voice (50%) and transaction data (5%) of the total traffic demand in Ghana by the end of the period under review. Dimensioning of the traffic using WDM Guru Software gives estimates of network cost and the equipment required to build the network. This enables different network topologies for Research and Education Networks in Ghana to be evaluated under various network protection schemes. The dimension results indicates that a pair of fiber cable would be required to build the backbone when Wavelength Division Multiplexing (WDM) and grooming techniques are deployed in the design of the network. The cost model, ownership options and organization structure suitable for the design and the implementation of the network in Ghana are covered in the report.

iv
ACKNOWLEDGEMENT.............................................................................................................................II ABSTRACT................................................................................................................................................. III CHAPTER 1 - INTRODUCTION .................................................................................................................1
1.1 OVERVIEW .....................................................................................................................................1 1.2 MOTIVATION ..................................................................................................................................2 1.3 OBJECTIVES OF THE STUDY..............................................................................................................2 1.4 EXPECTED RESULTS........................................................................................................................3 1.5 RESEARCH METHODOLOGY.............................................................................................................3 1.6 LIMITATIONS AND SCOPE OF STUDY .................................................................................................4 1.7 ORGANIZATION OF THE STUDY ........................................................................................................4
CHAPTER TWO -EXISTING NETWORK INFRASTRUCTURE IN GHANA .........................................6 2.1 OVERVIEW .....................................................................................................................................6 2.2 GHANA...........................................................................................................................................6 2.3 INFORMATION AND COMMUNICATION TECHNOLOGY IN GHANA........................................................7 2.4 TELECOMMUNICATION INDICATORS IN GHANA ................................................................................8 2.4.1 FIXED LINE AND MOBILE SUBSCRIBERS ...........................................................................................8 2.5 TELECOMMUNICATION OPERATORS UNDER CONSIDERATION ...........................................................9 2.5.1 VRA INTEGRATED FIBER-OPTIC NETWORK.....................................................................................9 2.5.2 THE NEW NATIONAL FIBER OPTIC BACKBONE ..............................................................................11 2.6 GHANA TELECOMMUNICATION COMPANY .....................................................................................11 2.6.1 GT DATA COMMUNICATION NETWORKS .......................................................................................12 2.7 EDUCATIONAL SYSTEM IN GHANA.................................................................................................14 2.7.1 BASIC SCHOOL SYSTEM ................................................................................................................14 2.7.2 SECONDARY EDUCATION SYSTEM .................................................................................................14 2.7.3 TERTIARY EDUCATION SYSTEM.....................................................................................................14 2.7.4 NATIONAL COUNCIL FOR TERTIARY EDUCATION (NCTE) AND NAB..............................................15 2.7.5 GHANA EDUCATION TRUST FUND (GETFUND) ..............................................................................15 2.8 SELECTED TERTIARY INSTITUTION AND THEIR NETWORK INFRASTRUCTURE ...................................15 2.9 KWAME NKRUMAH UNIVERSITY OF SCIENCE AND TECHNOLOGY, KUMASI .....................................15 2.9.1 KNUST NETWORK INFRASTRUCTURE ...........................................................................................16 2.10 UNIVERSITY OF GHANA, LEGON....................................................................................................17 2.10.1 UNIVERSITY OF GHANA ICT INFRASTRUCTURE .........................................................................18 2.11 UNIVERSITY OF EDUCATION WINNEBA ..........................................................................................19 2.11.1 NETWORK INFRASTRUCTURE AT UEW, WINNEBA .....................................................................19 2.12 UNIVERSITY OF CAPE COAST (UCC) .............................................................................................20 2.12.1 NETWORK TOPOLOGY AND INFRASTRUCTURE ..........................................................................20 2.13 UNIVERSITY FOR DEVELOPMENT STUDIES, TAMALE ......................................................................21 2.13.1 ICT SITUATION AT UDS...........................................................................................................22 2.14 RESEARCH INSTITUTIONS IN GHANA..............................................................................................22 2.14.1 COCOA RESEARCH INSTITUTE (CRIG) OF GHANA .....................................................................22 2.14.2 GHANA ATOMIC ENERGY COMMISSION.....................................................................................22 2.14.3 CENTER FOR SCIENTIFIC AND INDUSTRIAL RESEARCH (CSIR)....................................................23 2.14.4 CSIR WIDE AREA NETWORK....................................................................................................24
CHAPTER 3- NETWORKING TRANSMISSION TECHNOLOGIES .....................................................26 OPTICAL COMMUNICATION NETWORKS..........................................................................................26
3.1 BASIC FEATURES OF FIBER OPTIC CABLE.......................................................................................26 3.2 TYPES OF FIBER ............................................................................................................................26 3.3 FIBER OPTIC CABLE......................................................................................................................27 3.3.1. LOOSE TUBE CABLES....................................................................................................................28 3.3.2. ARMORED CABLES........................................................................................................................28 3.3.3. OPTICAL GROUND WIRE (OPGW).................................................................................................28 3.4 TRANSMISSION LIMITATIONS ........................................................................................................29 3.4.1. ATTENUATION ..............................................................................................................................29 3.4.2. CHROMATIC DISPERSION...............................................................................................................30 3.5 OVERCOMING LIMITATIONS ..........................................................................................................30 3.5.1. OPTICAL AMPLIFICATION..............................................................................................................31

v
3.5.2. NONDISPERSION-SHIFTED FIBER (ITU-T G.652) ............................................................................31 3.6 GROOMING AND MULTIPLEXING, ...................................................................................................31 3.7 SDH AND SONET ........................................................................................................................32 3.7.1. BENEFITS OF SDH-SONET ...........................................................................................................32 3.7.2. SONET AND SDH HIERARCHY .....................................................................................................33 3.7.3. ELEMENTS OF SONET/SDH INFRASTRUCTURE..............................................................................34 3.7.4. ADD AND DROP MULTIPLEXER (ADM)..........................................................................................34 3.8 WAVELENGTH DIVISION MULTIPLEXING (WDM) ..........................................................................34 3.8.1. TYPES OF WDM ...........................................................................................................................35 3.8.2. OPTICAL NETWORK ELEMENTS .....................................................................................................36 3.8.3. OPTICAL LINE TERMINAL (OLT) ...................................................................................................36 3.8.4. OPTICAL ADD AND DROP MULTIPLEXERS ......................................................................................37 3.8.5. OPTICAL CROSS CONNECTS (OXC)...............................................................................................38 3.8.6. TYPES OF OXC .............................................................................................................................38 3.9 REGENERATION NODES.................................................................................................................40 3.10 NETWORK SURVIVABILITY............................................................................................................40 3.11 TYPES OF NETWORK SURVIVABILITY.............................................................................................41 3.12 PROTECTION.................................................................................................................................41 3.12.1. AUTOMATIC PROTECTION SWITCHING (APS) ............................................................................41 3.12.2. SELF HEALING RINGS (SHR) ....................................................................................................42 3.13 NETWORK PROTECTION IN WDM DOMAIN ....................................................................................43 3.13.1. DEDICATED PROTECTION RING ..................................................................................................43 3.13.2. SHARED PROTECTION RINGS......................................................................................................43 3.14 RESTORATION...............................................................................................................................44
WIRELESS COMMUNICATION TECHNOLOGY, .................................................................................44 3.15 WLAN 802.11 STANDARDS ..........................................................................................................44 3.15.1. IEEE 802.1X AND IEEE 802.11I STANDARDS............................................................................45 3.15.2. COMPARISON ON WLAN STANDARDS.......................................................................................46 3.15.3. COMPONENTS OF 802.11 LANS ................................................................................................46 3.15.4. TYPES OF NETWORKS ...............................................................................................................46 3.16 WIMAX ......................................................................................................................................47 3.16.1. ELEMENTS OF WIMAX ............................................................................................................47 3.16.2. FLAVORS AND TYPES OF WIMAX.............................................................................................48
VSAT TECHNOLOGY,...............................................................................................................................49 CHAPTER 4: NETWORK DESIGN AND SIMULATION OF NREN BACKBONE................................50
OVERVIEW .................................................................................................................................................50 4.1 NETWORK TOPOLOGIES ................................................................................................................50 4.1.1 MAJOR CITIES AND TOWNS IN GHANA...........................................................................................50 4.1.2 SOUTHERN LOOP (VRA � INTEGRATED NETWORK) .......................................................................51 4.1.3 NEW NATIONAL FIBER-OPTICS BACKBONE....................................................................................51 4.1.4 PROPOSED NREN NODES..............................................................................................................52 4.2 TRAFFIC MODELS DESCRIPTION ....................................................................................................53 4.2.1 COMPUTING CONSTANTS KV, KT AND KI...........................................................................................53 4.2.2 TRAFFIC GROWTH.........................................................................................................................54 4.3 TRAFFIC ESTIMATION FOR GHANA.................................................................................................54 4.3.1 TRAFFIC VOLUMES .......................................................................................................................54 4.3.2 KV, KT AND KI VALUES FOR GHANA...............................................................................................55 4.4 TRAFFIC DEMAND AND GROWTH IN EDUCATIONAL INSTITUTIONS ...................................................57 4.5 VOICE TRAFFIC MATRIX FOR GHANA ............................................................................................58 4.6 TRAFFIC MATRIX FOR EDUCATIONAL INSTITUTIONS IN GHANA ......................................................59 4.7 WDM GURU SOFTWARE...............................................................................................................60 4.7.1 LAYERS IN WDM GURU ...............................................................................................................60 4.7.2 NETWORK PROPERTIES..................................................................................................................61 4.7.3 AVAILABILITY SETTINGS...............................................................................................................61 4.8 NETWORK TOPOLOGY ON VRA BACKBONE...................................................................................61 4.8.1 NETWORK COST AND AVAILABILITY ON VRA BACKBONE..............................................................62 4.8.2 LINK UTILIZATION ........................................................................................................................63 4.8.3 FAILURE ANALYSIS (UNPROTECTED AND PROTECTED GROOMING) ...................................................64

vi
4.9 EXPANDED GARNET TOPOLOGY .................................................................................................64 4.9.1 INTERPRETATION OF RESULTS .......................................................................................................65 4.10 GENERAL OBSERVATION ON THE TWO TOPOLOGIES ........................................................................66
CHAPTER 5 - IMPLEMENTATION ISSUES, FINDINGS AND RECOMMENDATIONS ....................67 OVERVIEW .................................................................................................................................................67 5.1 BRIEF BACKGROUND TO THE DEVELOPMENT OF NREN IN GHANA..................................................67 5.1.1 IFLA/DANIDA PROJECT IN GHANA .............................................................................................67 5.1.2 GHANA NATIONAL COMMITTEE ON INTERNET CONNECTIVITY........................................................68 5.1.3 GHANA ACADEMIC AND RESEARCH NETWORK (GARNET)............................................................69 5.1.4 RECONSTITUTED GARNET...........................................................................................................69 5.2 NATIONAL RESEARCH AND EDUCATION NETWORK TRANSPORT INFRASTRUCTURE (D14, 2003) ......70 5.3 IMPLEMENTATION STRUCTURES AND OPTIONS FOR GARNET ........................................................71 5.3.1 ORGANIZATION OPTIONS ..............................................................................................................71 5.3.2 MANAGEMENT AND ADMINISTRATIVE STRUCTURE .......................................................................72 5.3.3 OWNERSHIP OPTIONS....................................................................................................................73 5.3.4 COST MODEL................................................................................................................................74 5.4 NETWORK PLANNING PROCEDURES...............................................................................................76 5.5 RESEARCH FINDINGS ....................................................................................................................77 5.6 RECOMMENDATIONS.....................................................................................................................79
CONCLUSIONS ..........................................................................................................................................82 REFERENCES.............................................................................................................................................84 ACRONYMS AND ABBREVIATIONS......................................................................................................85 LIST OF FIGURES......................................................................................................................................86 LIST OF TABLES........................................................................................................................................87 APPENDIX...................................................................................................................................................88 APPENDIX A: COMPUTATION OF VOLUME OF TRAFFIC BASED ON TABLE 7...........................88 APPENDIX B: VOLUME OF TRAFFIC IN MBPS BETWEEN REGIONAL NODES...........................88 APPENDIX C: AIRLINE DISTANCE BETWEEN CITIES IN GHANA..................................................89 APPENDIX D:TRAFFIC MATRIX BETWEEN KUMASI, ACCRA AND OTHER MAJOR CITIES IN GHANA ........................................................................................................................................................89 APPENDIX E: OVERALL EDUCATION TRAFFIC DISTRIBUTION ...................................................90 APPENDIX F: INTER-CITY DISTANCE IN KILOMETERS..................................................................90 APPENDIX G: SECOND CYCLE SCHOOLS: STUDENT AND STAFF POPULATION BY REGION 91 APPENDIX H: 1+1 PROTECTION PATH ON NEW BACKBONE .........................................................92

Chapter 1 - Introduction
1.1 Overview Research and Education Networks (REN) provide connectivity and services to users in research establishments and institutions of higher education. They also offer very large network capacities and various advanced services that are not generally available on the Internet1.
National Research and Education Networks (NREN) enable geographical disperse research and academic institutions to interact remotely with their fellows within a country or across the globe. These networks have brought about significant development in telecommunication since they are often used as testbed for new services and products before they are brought to the public domain. NREN provides the platform for students and the academic community to share and disseminate information through video conferencing and distance learning as well as sharing of computing and network resources through project like GRID computing. GRID computing for example allows advanced software and scientific resources to be shared by remote institutions without having to equip their own networks with dedicated computing powers which are often associated with GRID2.
In Ghana, universities, polytechnics and research institutions had over the years tried different networking technologies with the aim of establishing connectivity amongst these entities. Some of the technologies used at various stages were dial-up modems, HF radio, VHF radio and fiber optics as the network platform. These were achieved through institutions own initiatives and donor funded projects like Fidonet (IDRC3), InterLending and Document Delivery ILL/DD (DANIDA), and Ghana National Committee for Internet Connectivity (GNCIC). The closest that they have come to establish a true National Research and Education Network was the formation of Ghana Academic and Research Network (GARNET) which had membership from some of the institutions mentioned. However, the project collapsed due to some administrative and technical bottlenecks; which would be discussed in this report. Today, all the universities, polytechnics and research institutions run their own campus-wide networks without direct interconnectivity. Their gateways to the internet are mostly through VSAT4 that are offered by different service providers in Ghana or elsewhere. The monthly subscriptions fees run to a few thousands of dollars with limited bandwidth capacity between 3Mbits to 9Mbits downlink. The uplink is much lower than this in some of the institutions. These have been identified as a problem since they do not bring about effective resources sharing and dissemination of information which is very important for teaching and learning. This situation often leads to duplication of efforts in terms of databases, management information system (MIS) and bibliographic records in the libraries. There has been a significant improvement in telecommunication networking infrastructure in Ghana in recent times. The Government of Ghana has also initiated the expansion of the
1 http://www.serenate.org/publications/d21-serenate.pdf ( Cited on 2nd October 2006) 2 http://www.dante.net/server/show/nav.9 ( Cited on 2nd October 2006) 3 http://www.idrc.ca ( Cited on 2nd October 2006) 4 VSAT- very small aperture terminal

2
660km Volta River Authority (VRA)�s integrated fiber-optic backbone to cover most part of the country. It is therefore imperative to undertake a study that would be able to identify resources that could be used to accelerate the implementation of NREN in Ghana. The current scenarios and positive initiatives that had been taken by the universities and other institutions to reconstitute GARNET are seen as commitment on the part of university administrators as well as stakeholders in the educational sector to create a common educational network. This will facilitate the early implementation of NREN in Ghana. The Association of African Universities (AAU) has also given backing to the universities in Ghana and its member institutions in Africa to establishment REN through out Africa. This was demonstrated during the recent workshop on NREN organized by AAU in Accra that resulted in the re-launching of GARNET by the public universities.
1.2 Motivation The project was motivated by the following factors:
• The availability of fiber optic backbone and other networking infrastructure in Ghana that can be used to build research and educational networks.
• The Government of Ghana�s initiative to expand the VRA fiber-optic backbone to cover the northern part of the country as well as the liberalized telecommunication regulatory regime in Ghana that create the enabling environment for the development of such networks
• The author�s research interest in optical networking, wireless and broadband networking in general.
• The need for the establishment of National Research and Education Network to support research, teaching and learning in Ghana
• The willingness of tertiary institutions and other stakeholders in education to participate in this network
• The initiative by the Association of African Universities (AAU) to assists member institutions in African to develop both their NREN and ultimate integrations of these national NREN to support collective action, especially in relation to increased access to cheaper connectivity and also raise awareness to institutional leaders and policy-makers in this direction5.
1.3 Objectives of the study • The aim of the project (Thesis) is to investigate the network infrastructure that would
be needed to create Research and Education Network in Ghana. • Which backbone networking methods would be ideal for NREN in Ghana? Particular
emphasis on VRA Integrated fiber backbone, Ghana Telecom backbone and VSAT technologies for the backbone. For the access network and last mile solutions campus-wide networks, Wireless LAN and WiMAX will be investigated.
• Identify networking related problems facing the existing network infrastructures and suggest solution in a form of recommendations.
5 http://www.aau.org/renu/index.htm (Cited 15th November 2006)
3
• How to implement these networks, to harness resource-sharing among the universities and research institutions
1.4 Expected Results • To identify the basic network resources, traffic demands, network cost (draft budget
based on the price list obtained for this research) of undertaking such a project • To come out with recommendations based on the findings of the project to act as
catalyst for the early implementation of NREN in Ghana • To identify the organizational, ownership and cost model options that will serve as
guideline for the future implementation of NREN in Ghana. The cost model for example may give an indication on how to source funding from the participating institutions, Government of Ghana and other funding Agencies
• Suggest appropriate network topologies, network planning and protection strategies for GARNET.
1.5 Research Methodology The research methods used in the study has been outlined in this section. Three procedures (methods) were used for data and information gathering � literature review, interviews and historical data sources for traffic estimation and projection. Interviews were conducted with key ICT personnel in the universities and research institutions, major telecom operators (Ghana Telecom and Volta River Authority) and other service providers in Ghana during the author�s field trip to Ghana in August 2006. The outlined questionnaire which was an abridged form of TERENA compendium6 was answered by each of the interviewee in a predefined format. Supplementary data provided by institutions, government officials and agencies which were not visited during the period were obtained through phone calls, fax messages and electronic mail. Contact persons in Ghana were also used to follow up with some of the questionnaires and data collections which were found to be delaying. The literature review covers a wide range of topics in the area of national research and educational networks (NREN), network transmission technologies, traffic modeling and simulation of optical networks. European Union funded projects� reports and deliverables on NREN served as important sources of reference to research networks development. Subsequently, different EU projects and SERENATE7 deliverables were reviewed. Institute of Electrical and Electronics Engineers (IEEE) and Optical Networks Magazines publications and articles were sources for optical networks technologies and more especially development of WDM technologies and network protection strategies. Authors of some of the publications were contacted personally by e-mail for explanations on specific portions of their articles which were not initially clear to the author. They responded positively to this request. Some detailed computational procedures were also obtained through the same means. Again, certain publications which were not available through CICT and DTV libraries were provided by authors when contacted. Chapter 3 -The technology of choice; made used of textbooks on
6 http://www.terena.org/activities/compendium/ (Cited on November 2006) 7 http://www.serenate.org/ (Cited on 15th November 2006)

4
optical networks, WiMAX and wireless LAN. They have been referenced in 8, (Gast, 2005) and (Pareek, 2006). Published and historical data from International Telecommunication Union (ITU), Ghana Education Service (GES), Ghana Telecom, Universities in Ghana, National Council for Tertiary Education, the World Bank, International Monetary Fund (IMF), National Communication Authority (NCA), other government agencies in Ghana and other sources were collected for traffic modeling. The Dwivedi and Wagner traffic model9 was used to analyze traffic pattern in Ghana and educational institutions in particular. The results served as an input to the WDM simulation software that was used to perform design, costing and traffic demand on these networks.
1.6 Limitations and scope of study Three distinct entities of Research and Education Network are users, network and services. The study will be focused on the networking infrastructure that would be needed to create the backbone for this network. To this end the scope of the study will be limited to campus-wide networking facilities in five selected public universities, Center for Scientific and Industrial Research and Ghana Atomic Energy Commission. The backbone networks of some selected service providers that have nationwide coverage would be investigated.
The services aspect of NREN that would be run on this network would not be treated in detail but references would be made to those innovations when the need arises. However the user requirements and services which were captured during the interviews and questionnaire would be used as an input to the simulation and the network design phase of the project.
1.7 Organization of the study Chapter 2 gives a complete overview of the network infrastructure at both national and institution level in Ghana. The current campus-wide networks in University of Ghana, University of Cape Coast; University for Development Studies, Kwame Nkrumah University of Science and Technology, University of Education Winneba are covered. The research institutions which were studied are Ghana Atomic Commission and Center for Scientific and Industrial Research. The development of ICT in Ghana and some selected network service providers were traced.
Chapter 3 constitutes the theoretical framework of the report. Three networking technologies - optical networking, wireless technologies (WLAN and WiMAX) and VSAT have been chosen for discussion. The chapter also looks at different network protection and survivability techniques. Traffic models and estimation procedures used to analysis traffic demand and growth rates in Ghana using data obtained from different sources are covered in chapter 4. WDM Guru Software was used to perform network design, simulation and analysis. Network availability and expected failure analysis obtained are used in network forecasting and capacity
8 Ramaswami, R.; et al , (2000) , Optical Networks: A Practical Perspective ,2nd edition; The Morgan Kaufmann Series in Networking 9 A. Dwivedi, R. E. Wagner: �Traffic model for USA long-distance optical network.� OFC 2000, Baltimore, March 2000, pp. 156-158

5
utilization. Conclusions to the chapter will show various network scenarios that would be suitable for Research and Education Network in Ghana. Chapter 5 traces the development of NREN in Ghana by outlining some of the projects and initiatives that had been carried by educational institutions that led to the formation of GARNET. Some of the problems that contributed to the collapse of GARNET are given in this chapter. The reconstituted GARNET by the Universities in Ghana and their objective and membership scope are also outlined. The implementation of GARNET based on the project findings in terms of ownership options, organization and cost model are also described.
Two cases (Danish and Swiss Research and Education Networks) were reviewed in the form of organization and funding strategies that will be applicable to GARNET. The research findings and recommendations constitute the last part of the chapter. Chapter 6 provides general conclusions based on discussions in all the chapters.
6
Chapter Two -Existing Network Infrastructure in Ghana 2.1 Overview There has been a significant improvement in Information and Communication Technology (ICT) infrastructure in Ghana in the past few years. This has been the results of Government of Ghana initiatives and policies, as well as reforms in the Telecommunication sector. Other agencies and donor support in various forms has also been a catalyst to this development. The educational and research institutions had also seen major improvement in their ICT infrastructure as results of massive investments made in this direction. These institutions had developed ICT strategies and utilize resources more efficiently by sourcing funding from the Government and other funding agencies. The internally generated funds such as student users� fees have been used to setup ICT centers were computers and other ICT related accessories are made available for both staff and students use. The setting up of ICT Directorate and Centers in most institutions to manage various networks and ICT supporting facilities show the level of improvement in the use of ICT to support teaching and learning. Having said that, there is still more work to be done to improve on the level of access to students and the research community. A well defined and efficient network infrastructure is needed to create the enabling environment to help in the delivery of high quality of service. This can be achieved through the formation of Research and Education Network in Ghana. This will enable resource sharing and make an efficient use of funds by eliminating duplication of system and efforts in the institutions under review. This chapter is divided into six main sections. Section one gives brief introduction on Ghana, the second part present an overview of ICT in Ghana, part three discusses the telecommunication indicators in Ghana based on data published by International Telecommunication Union (ITU) and National Communication Authority (NCA). Two telecommunication operators � Ghana Telecom and VRA Voltacom networking infrastructure are covered. The fourth section deals with the educational system in Ghana. Tertiary institutions and their current ICT facilities constitute section five. The final section in this chapter deals with three selected research institutions and their backbone networks. 2.2 Ghana Ghana is a relatively a small country in West Africa with a population of approximately 22 million. It share borders with Cote d'Ivoire, Togo and Burkina Faso as shown in figure 1 below. The total surface area is 239,460 sq km which is made up of 230,940 sq km (Land) and 8,520 sq km of water. Ghana is one of the most populous countries in Western Africa, second only to Nigeria10. Ghana is rich in minerals like gold, diamond, bauxite and manganese. Cocoa is one of its main exports earning and it is the world�s number two producer of cocoa beans. The premium quality of Ghana�s cocoa beans ranks top on the international market. The world's largest artificial lake - Lake Volta, is in Ghana. It is mainly used for transportation, irrigation and the production of hydroelectric power. The some of the power transmission lines are being
10 http://www.census.gov/ipc/prod/ib96_01.pdf (Cited on 9th November 2006)

7
considered for the national fiber-optic backbone to support information and communication technology in Ghana11.
Figure 1 : Map of Ghana
There are ten administrative regions and 110 districts in Ghana. These are Ashanti, Brong Ahafo, Central, Eastern, Western, Northern, Greater Accra, Northern, Upper East, Upper West and Volta. The capital city �Accra is located in the Greater Accra region with a population of nearly 1.7 million. Other cities are Kumasi, Takoradi, Tamale, Cape Coast and Tema as shown on the map above. The highest concentration of people is in the Accra-Kumasi-Takoradi triangle, largely due to the economic productivity of the region. All mining centres, timber-producing deciduous forests and cocoa growing lands lie to the south12. 2.3 Information and Communication Technology in Ghana The broad ICT sector in Ghana is relatively small, but it is dynamic and growing quickly, driven by a combination of factors. The growing use of ICT can be attributed to the increased levels of investment in telecommunications and other key parastatal and government service providers, government policies and private participation in the ICT sector in general. The Government of Ghana has been pursuing policies and reforms to improve on the development of ICT in Ghana. The liberalization of the telecom sector in Ghana started in the 1990s allowing private participation to complement the activities of the then Post and Telecommunication Corporation. It further opened up the telecom market to allow the sale and installation of terminal equipment13. The National Telecommunication Policy of 200514 further seeks to promote private participation and ownership of public telecommunication infrastructure and services. Through this initiatives there are plans far advanced to privatize government�s shares in Ghana Telecom, Westel Telecom and VRA Voltacom networks.
11 https://www.cia.gov/cia/publications/factbook/geos/gh.html (Cited on 9th November 2006) 12 http://www.wesgro.org.za/publications/publications.asp (Cited on 9th November 2006) 13 Frempong, GK (2004), Restructuring of the Telecoms Sector in Ghana: Experiences and Policy Implications, Unpublished PhD Thesis, University of Ghana, Accra 14 National Ghana Telecommunication Policy, 2005

8
Some of the objectives of the Government are as documented in the policy are: to provide universal access to telecommunication by the year 2010 with the expected tele-density of 25%. Provide connectivity to all schools, hospitals and government agencies. 2.4 Telecommunication Indicators in Ghana The summary of both telecommunication operators and Service Providers is shown in table 1. There are 2 fixed network operators, four mobile cellular providers, 128 Internet Data service providers, 106 VSAT Data Operators and 61 Public Corporate networks. Most Internet connection backbones are based on VSAT with few Internet broadband services using ADSL and wireless LAN technologies. Service provider install their own private networks due to lack of national and intercity backbone which is needed to interconnect them to encourage resource sharing and bring down service costs. The Ghana Telecom company is one of few providers using the SAT-3 terminal in Accra for its International voice calls and data communications services. SAT-3 is an under sea fiber optic cable linking Portugal and Spain to South Africa, with connections to several West African countries along its route. It terminates in Ghana in Accra.
Table 1: Summary of Operators and Service Providers as at January 200615
No. Category Licensed/Authorized Operators
1. National Fixed Network Operators 2
2. National Mobile Cellular Network 4 4. Internet Data Service Providers 128
5. VSAT Data Operators 106 6. Public/Corporate Data Operators 61
. 2.4.1 Fixed Line and Mobile Subscribers According to ITU indicators, the total number of telephone subscribers in Ghana in the year 2005 was a little over three million, representing the sum of main telephone lines and cellular phones. The subscribers per 100 inhabitants for main telephone lines were 1.45; whereas the figure for mobile was 12.85. Between the year 2000 and 2005; the growth rate were 8.6% and 85.6% for main telephone line and mobile subscribers respectively. The number of Internet users was also estimated to be 401,300. The number of personal computers in use has also risen dramatically from around 40,000 in 1998 to over 112,000 during the same period16.
15 Source: National Communications Authority 2006 16 http://www.itu.int/ (Cited on 12th November 2006)

9
0500
1000150020002500300035004000
2001 2002 2003 2004 2005 2006
Years
Fixed Line and Mobile Subscription in '000
Fixed Lines Mobile
Areeba57%TiGO
20%
Kasapa4%
Onetouch19%
Figure 2a
Figure 2b: Mobile Companies Market Shares
Figure 2: Telecommunication Subscribers in Ghana
Figure 2 depicts the current telecommunication situation in Ghana in the fixed line and mobile sector as published by the National Communication Authority. The growth in the telecommunication sector (fixed line and mobile subscription) has been very significant. The number of subscribers had grown from 75,214 in 1996 to 4,162,246 by the middle of 2006. The cellular boom is more pinpointing as has been in the case in most African countries. In the year 2002 the number of mobile subscribers in Ghana out numbered that of fixed line. Since then the gap had widen and at the end of June 2006 out of a total of 4,162,246 subscribers; 3,798,096 (92%) were using mobile and 359,992 (8%) for fixed lines. The market share for the four mobile operators is shown in figure 2b. Areeba top the list with 57%, TIGO 20%, Onetouch 19% and Kasapa the remaining 5%17. At a combined teledensitiy of little more than 15% and an Internet user penetration of less than 2%, enormous further potential exists18. 2.5 Telecommunication Operators Under Consideration The Ghana Telecommunication Company and Volta communication Integrated network have chosen for discussion because of their national coverage as well as the resources they can provide to support research and education network in Ghana 2.5.1 VRA Integrated Fiber-Optic Network The Volta River Authority (VRA) is a power transmission company responsible for the provision, generation and distribution of electric power in Ghana. It has a reputation for an efficient internal telecommunication system linking its offices located in different part of the country. It has over the years built a fiber optics backbone along it transmission lines in the southern part of the country. There are 15 nodes on the network; covering a total distance of 882
17 National Communication Authority (2006) 18 Ghana - Telecoms Market Statistics and Forecasts http://www.budde.com.au/Reports/Contents (Cited 12th November 2006)
10
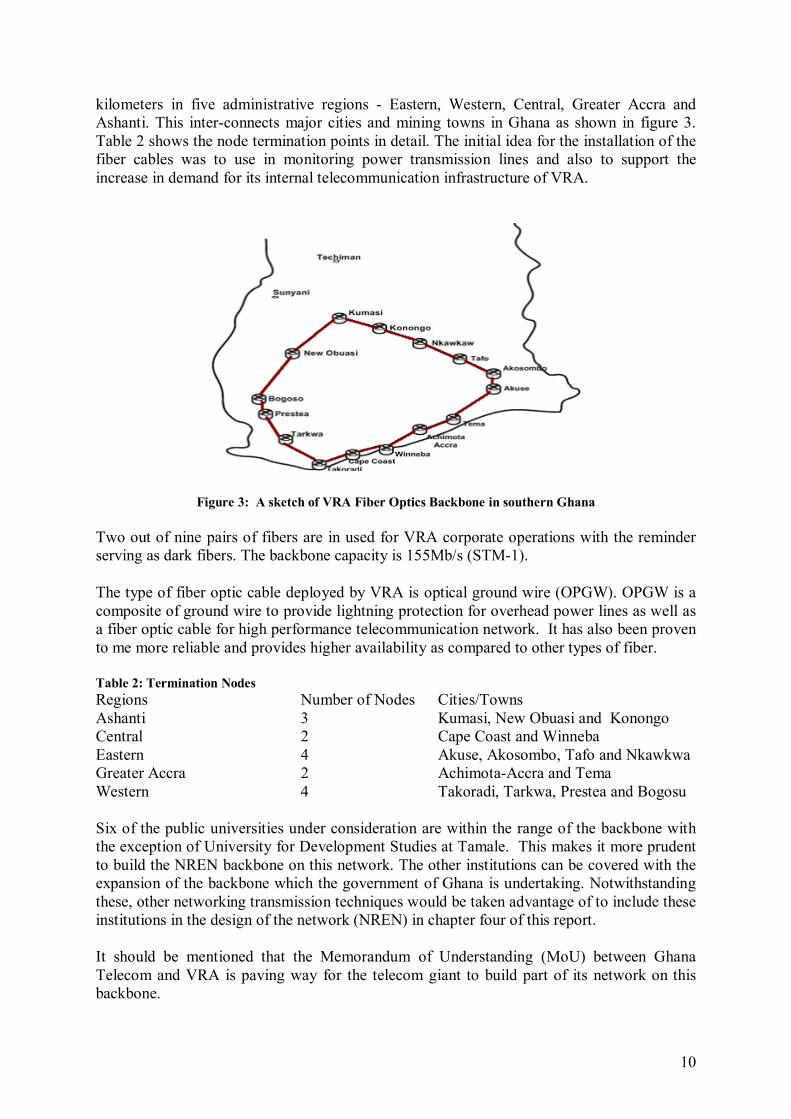
kilometers in five administrative regions - Eastern, Western, Central, Greater Accra and Ashanti. This inter-connects major cities and mining towns in Ghana as shown in figure 3. Table 2 shows the node termination points in detail. The initial idea for the installation of the fiber cables was to use in monitoring power transmission lines and also to support the increase in demand for its internal telecommunication infrastructure of VRA.
Figure 3: A sketch of VRA Fiber Optics Backbone in southern Ghana Two out of nine pairs of fibers are in used for VRA corporate operations with the reminder serving as dark fibers. The backbone capacity is 155Mb/s (STM-1).
The type of fiber optic cable deployed by VRA is optical ground wire (OPGW). OPGW is a composite of ground wire to provide lightning protection for overhead power lines as well as a fiber optic cable for high performance telecommunication network. It has also been proven to me more reliable and provides higher availability as compared to other types of fiber.
Table 2: Termination Nodes Regions Number of Nodes Cities/Towns Ashanti 3 Kumasi, New Obuasi and Konongo Central 2 Cape Coast and Winneba Eastern 4 Akuse, Akosombo, Tafo and Nkawkwa Greater Accra 2 Achimota-Accra and Tema Western 4 Takoradi, Tarkwa, Prestea and Bogosu Six of the public universities under consideration are within the range of the backbone with the exception of University for Development Studies at Tamale. This makes it more prudent to build the NREN backbone on this network. The other institutions can be covered with the expansion of the backbone which the government of Ghana is undertaking. Notwithstanding these, other networking transmission techniques would be taken advantage of to include these institutions in the design of the network (NREN) in chapter four of this report. It should be mentioned that the Memorandum of Understanding (MoU) between Ghana Telecom and VRA is paving way for the telecom giant to build part of its network on this backbone.

11
2.5.2 The New National Fiber Optic Backbone 19 Government is aware that the ICT market in Ghana is keen to see the VRA fiber network brought into play to enable further development of services and roll-out of services to areas not currently served. The fiber network is seen as the only national network resource, which will not suffer from bandwidth limitations in the near future and as the logical foundation on which to build a more extensive national optical fiber network. The new national communications backbone infrastructure is to compliment the VRA fiber network in the Southern Sector. The Government of Ghana through this project will expand ICT to other part of the country more especially the northern sector. The Government believes this will lead to reduction of cost of ICT services and also make ICT accessible to majority of the population. It has therefore secured a loan of $US70 million for the expansion project. It has already received $50 million out of the total credit facility for the commencement of the project. The list of towns and cities where the new link will terminate are Mankessim in the central, Sunyani, Techiman, and Kintampo in Brong Ahafo region; Anyinam, Koforidua and Kpong in the eastern region, Ho in the Volta region, Tamale, Buipe and Sawla in the northern region, Wa and Tumu (Upper West), Navrongo, Bolgatanga and Bawku in Upper East region. The new project will make use the existing VRA power transmission and duct and buries fiber where they are not served by these lines. Koforidua, Anyinam and Ho are off power transmission lines path. 2.6 Ghana Telecommunication Company The Ghana Telecommunication Company (Ghana Telecom) is one of the telecommunication companies in Ghana with a bigger share of both networking infrastructure and customer base. The company was privatized in 1997 through the sale of 30% shares to G-Com Ltd, a consortium led by Telecom Malaysia Berhard. This Management Contract with G-Com Ltd was however abrogated by the Government of Ghana in 2002. The government entered into a Management contract agreement with Telenor Management Partner (TMP) in February 2003 to implement TMP Business Plan it had developed for GT covering the period 2003 to 2007. Ghana Telecom operates fixed line, mobile and other enhanced telecommunication services like Internet, VSAT and broadband to businesses, corporate institutions and the general public. Ghana Telecom telecommunication infrastructure support the public and some of its users base to make use of advanced information technology applications for long distance learning, e-banking, e-business etc. Its GSM services (OneTouch) has international roaming agreements with about 150 mobile phone service providers in the world and its General Packet Radio Service (GPRS) services was launched in November 2006.20
19 Ministry of Communications, Ghana (2006) 20 http://www.ghanatelecom.com.gh/ (Cited 12th November 2006)
12
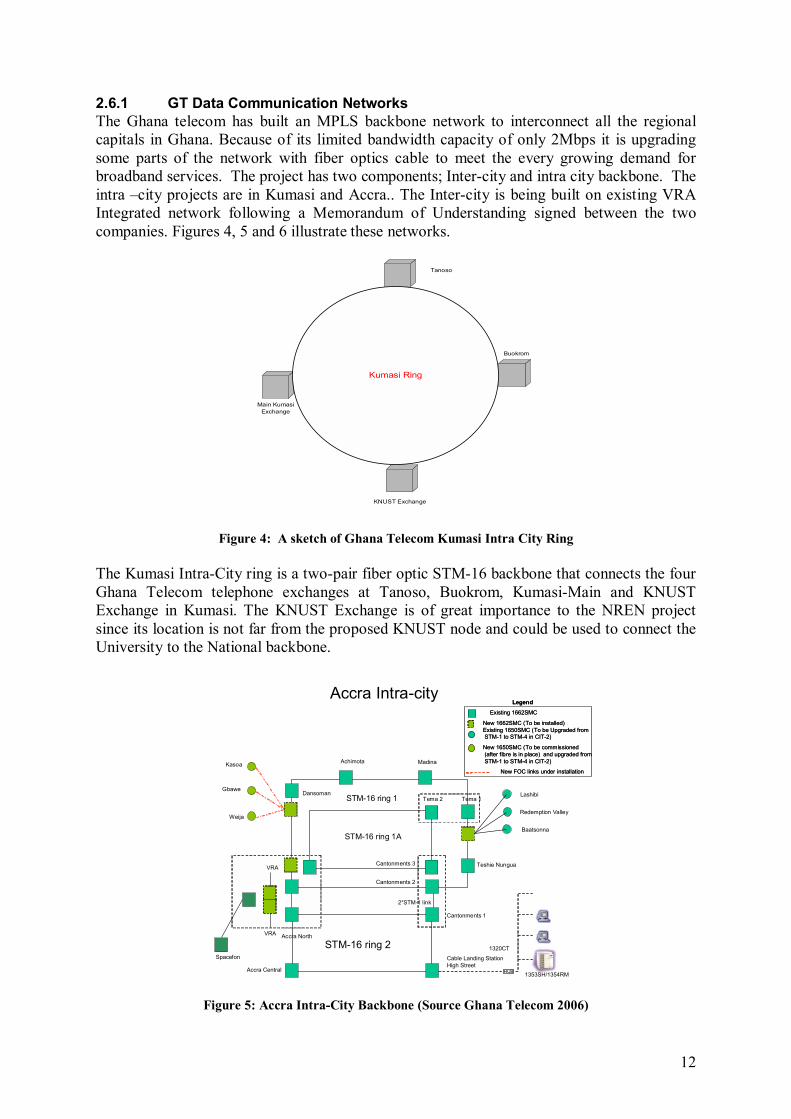
2.6.1 GT Data Communication Networks The Ghana telecom has built an MPLS backbone network to interconnect all the regional capitals in Ghana. Because of its limited bandwidth capacity of only 2Mbps it is upgrading some parts of the network with fiber optics cable to meet the every growing demand for broadband services. The project has two components; Inter-city and intra city backbone. The intra �city projects are in Kumasi and Accra.. The Inter-city is being built on existing VRA Integrated network following a Memorandum of Understanding signed between the two companies. Figures 4, 5 and 6 illustrate these networks.
TanosoBuokrom
KNUST Exchange
Main KumasiExchange
Kumasi Ring
Tanoso
Figure 4: A sketch of Ghana Telecom Kumasi Intra City Ring The Kumasi Intra-City ring is a two-pair fiber optic STM-16 backbone that connects the four Ghana Telecom telephone exchanges at Tanoso, Buokrom, Kumasi-Main and KNUST Exchange in Kumasi. The KNUST Exchange is of great importance to the NREN project since its location is not far from the proposed KNUST node and could be used to connect the University to the National backbone.
Cable Landing StationHigh Street
Cantonments 1
Accra North
Accra Central
STM-16 ring 2
Cantonments 2
MadinaAchimota
Dansoman
Teshie Nungua
Tema 2 Tema 1
Kasoa
Gbawe
Weija
STM-16 ring 1
1353SH/1354RMHUB
Redemption Valley
1320CT
STM-16 ring 1A
2*STM-1 link
Cantonments 3
Lashibi
Baatsonna
Accra Intra-city
VRA
VRA
Spacefon
Legend
Existing 1662SMC
New 1662SMC (To be installed)Existing 1650SMC (To be Upgraded fromSTM-1 to STM-4 in CIT-2)
New FOC links under installation
New 1650SMC (To be commissioned(after fibre is in place) and upgraded from STM-1 to STM-4 in CIT-2)
Legend
Existing 1662SMC
New 1662SMC (To be installed)Existing 1650SMC (To be Upgraded fromSTM-1 to STM-4 in CIT-2)
New FOC links under installation
New 1650SMC (To be commissioned(after fibre is in place) and upgraded from STM-1 to STM-4 in CIT-2)
Figure 5: Accra Intra-City Backbone (Source Ghana Telecom 2006)

13
The Accra Intra-city backbone consists of three main STM-16 rings and these cover all the main telephone exchanges in Accra with further connectivity to the SAT-3 cable landing station. The SAT 3 Submarine Cable and Satellite Systems are used to provide International Private Leased Circuit (I P L C) to customers and the available bandwidth are between 64 kbps and 155 Mbps . The proposed expansion work will extend the link to VRA facilities in Accra, thereby establishing inter-connection point between the two networks. The Madina exchange will be a major entry point for the University of Ghana (Legon) Node to join the National backbone as well as connection to SAT-3 for international traffic. Again, tertiary and research institutions within Accra and Tema can be connected to the nearest telephone exchange for their traffic to be routed to the Legon Node of the research network
Kumasi2.2 km 8
Konongo7 Nkawkaw
2.5 km 690 km 1.6 km
7,5km Bekwai Akosombo Dam
2 km 4a2 km 4 km
Obuasi 9 Tafo 5
New Obuasi10 21 km3 Akuse
( Lower Dam )360 m Koforidua
Dunkwa11
Cantonments
Bogoso 12 4.6 km 2 Tema6 km
1Prestea Achimota
13 Tema A
5 km GT Station17 Winneba
Tarkwa14 VRA Substation5 km
Sekondi Takoradi Exchange NEC optical cable PHASE 1
7.6 km Pirelli optical cable PHASE 316 Cape Coast
4.1 km Alcatel optical cable PHASE 2Takoradi 3.54 km
New optical cable section 12 FO
Aboadze New optical cable section 18 FO
GT VRA Fibre Network
15b
15a
Figure 6 : VRA- Ghana Telecom WDM/SDH Network21 Figure 6 above shows VRA- Ghana Telecom WDM/SDH Network. The Accra, Tema, Akosombo, Nkawkaw, Konongo and Kumasi portions of GT network is scheduled to be completed by October 2006. The Ghana telecom part of the network involves the laying of fiber optic cables from its telephone exchanges to the nearest VRA Station where the integrated fiber backbone terminates. Through this arrangement Ghana telecom will be able to move some of its traffic from existing microwave links to the VRA network. It will also enable it to increase its current bandwidth to higher orders and thereby offer more value added services.
21 www.gfzb.com/ict/pdf/gt.ppt (Cited on 12th November 2006)

14
This Inter-City network is one of the possible options the National Research and Education Network could exploit to built its network on to interconnect the institutions and schools that will be part of the network in the regions and districts in Ghana. 2.7 Educational System in Ghana There are three levels of educational system in Ghana. These are the basic school, second cycle and tertiary. Brief description of each is presented below: 2.7.1 Basic School System The basic school system consists of primary and junior secondary schools and offers a 9-year free compulsory education to all Ghanaians of school going age. The training at these stages is to expose pupils to a wide variety of ideas and skills to make them valuable assets to the nation. The total enrolment for the 2004/2005 academic year was 3,150,529 which were made up of 2,238,324 and 822,205 pupils in primary and junior secondary schools respectively. 2.7.2 Secondary Education System The Senior Secondary School system provides further education to eligible Junior Secondary School pupils. These students are trained to get either direct admission into the tertiary education system or are equipped with skills that enable them get into the world of work. The training takes approximately three years to complete. Enrolment for 2005/06 academic year for 485 schools was 423,672 students made up of 236,409 boys and 187,263 girls22. There are 110 Science Resources Center located in all the districts in Ghana. They provide access to some of the secondary schools which are without well-equipped science laboratories. These centers are potential points that would be connected to the Research and Education Network. They will provide points of access to online resources and training grounds for ICT and distance learning. 2.7.3 Tertiary Education System Tertiary institution in Ghana consists of Polytechnics, Teacher Training colleges and the Universities. These institutions are expected to provide advanced academic and/or professional instruction and conduct research in the sciences, social sciences, humanities and career-focused programs23. There are currently six public universities � University of Ghana, Kwame Nkrumah University of Science and Technology (KNUST), University of Cape Coast (UCC), University for Development Studies (UDS), University of Education Winneba (UEW) and University of Mines and Technology (UMaT). Ten polytechnics are located in each of the regional capitals. These are Accra Polytechnic, Kumasi Polytechnic, Takoradi Polytechnic, Cape Coast Polytechnic, Sunyani Polytechnic, Koforidua Polytechnic, Ho Polytechnic, Wa Polytechnic, Tamale Polytechnic and Bolgatanga Polytechnic. The Professional Institutions are Institute of Professional Studies and Ghana Institute of Languages located in Accra. The number of Teacher Training Colleges is 36. A number of private universities and university colleges have also received accreditations from National Accreditation Board (NAB) and their number is currently put at 13. 22 http://www.edughana.net/gessecondarydiv.htm (Cited on 10th November 2006). 23 http://www.nab.gov.gh/ (Cited on 10th November 2006).

15
2.7.4 National Council for Tertiary Education (NCTE) and NAB The National Council for Tertiary Education (NCTE) and National Accreditation Board (NAB) are two coordinating bodies which were established as part of recommendation of the Educational Reform program24. The National Council on Tertiary Education is coordinating body for the tertiary with the responsibility of examining the budgets and programs of these institutions before their submission to Government. It therefore advises the Minister of Education on the development and financial needs in the tertiary institutions. NAB is responsible for the accreditation of both public and private institutions with regard to the contents and standards of their programs by ensuring the maintenance of acceptable levels of academic or professional standard25. 2.7.5 Ghana Education Trust Fund (GETFund) The GETFund was established in 2000 by Act of parliament to create a fund to assist nationwide financing of education. Some of the objectives of the fund were to provide financial support to institutions and agencies under the Ministry of Education for the development and maintenance of academic facilities in the public institutions. It was also mandated to provide supplementary funding to the Scholarship Secretariat to provide scholarship to students.
Others were to provide funds to the tertiary institutions through NCTE to train brilliant students as members of faculties; and to undertake research and other academic programs of relevance to national development among others. The main source of funding is generated through the 2.5% Value Added Tax (VAT), investments made by the GETFund and donations it receives from other sources26.
Since its inception the fund had made very meaning contribution to the educational system. At the tertiary level, it has provided physical infrastructure, equipped science laboratories and the provided book to the libraries. One other remarkable contribution is the support it has given to the ICT facilities on various campuses. These include computers, networking equipment, funds for training of ICT personnel and computer laboratories. The fund is seen as one of the potential sources for the financing of Research and Education Network in Ghana.
2.8 Selected Tertiary Institution and their Network Infrastructure In this section some selected tertiary institutions would be described and their current network infrastructure discussed. They will also constitute the networking nodes for the NREN. 2.9 Kwame Nkrumah University of Science and Technology, Kumasi The Kwame Nkrumah University of Science and Technology (KNUST) offers courses mainly in the sciences and technology, humanities and medicine up to postgraduate level. The university has six colleges: Agriculture and Natural Resources, Architecture and Planning, Art and Social Sciences, Engineering, Health Science, and Science. There are a number of faculties and research centers under each of the colleges. The student population in 2006 was about 19,923 and a total of 3,274 academic and other category of staff.
24 Ghana Education Reform 25 http://www.ncteghana.org/ (Cited on 10th November 2006) 26 http://www.getfund.org/aboutus/(Cited on 11th November 2006).
16
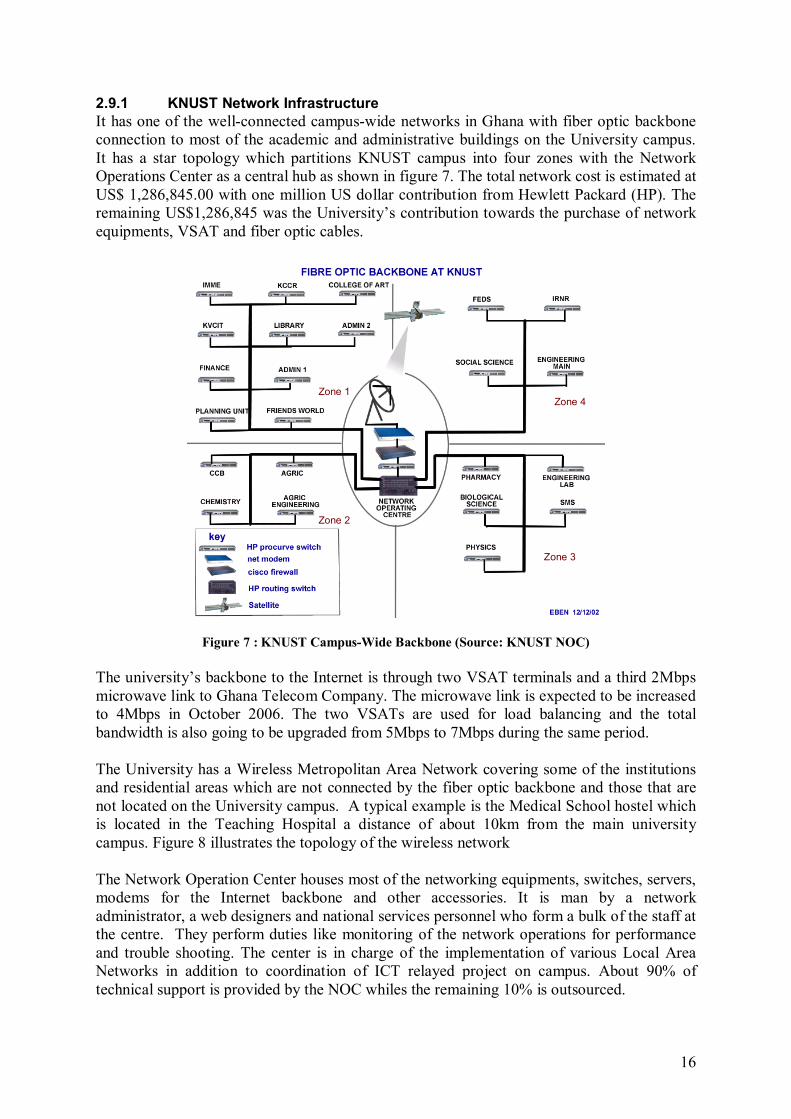
2.9.1 KNUST Network Infrastructure It has one of the well-connected campus-wide networks in Ghana with fiber optic backbone connection to most of the academic and administrative buildings on the University campus. It has a star topology which partitions KNUST campus into four zones with the Network Operations Center as a central hub as shown in figure 7. The total network cost is estimated at US$ 1,286,845.00 with one million US dollar contribution from Hewlett Packard (HP). The remaining US$1,286,845 was the University�s contribution towards the purchase of network equipments, VSAT and fiber optic cables.
Zone 1
Zone 2
Zone 3
Zone 4
Figure 7 : KNUST Campus-Wide Backbone (Source: KNUST NOC) The university�s backbone to the Internet is through two VSAT terminals and a third 2Mbps microwave link to Ghana Telecom Company. The microwave link is expected to be increased to 4Mbps in October 2006. The two VSATs are used for load balancing and the total bandwidth is also going to be upgraded from 5Mbps to 7Mbps during the same period. The University has a Wireless Metropolitan Area Network covering some of the institutions and residential areas which are not connected by the fiber optic backbone and those that are not located on the University campus. A typical example is the Medical School hostel which is located in the Teaching Hospital a distance of about 10km from the main university campus. Figure 8 illustrates the topology of the wireless network The Network Operation Center houses most of the networking equipments, switches, servers, modems for the Internet backbone and other accessories. It is man by a network administrator, a web designers and national services personnel who form a bulk of the staff at the centre. They perform duties like monitoring of the network operations for performance and trouble shooting. The center is in charge of the implementation of various Local Area Networks in addition to coordination of ICT relayed project on campus. About 90% of technical support is provided by the NOC whiles the remaining 10% is outsourced.

17
Komfo Anokye Teaching Hospital
(KATH)
Residence on campus
NOC
GUSS Hostel
SRC Hostel
(KATH) Medical School
Hostel
Transport /Maintenance
Dept. Security Dept.
Topology of Wireless Metropolitan Area Network for KNUST
Figure 8: KNUST Wireless Backbone (Source: KNUST NOC) The KNUST ICT center located in the University Library provides over 200 computers for student access. These are housed in a well furnished computer laboratory. The computers are used for Internet access as well as training programs. It has facilities for laptop connectivity and wireless Internet Access. The students� ICT user fee of approximately US$30 per year was seen has a source of income to the NOC, which was used to support its operations and purchase of networking equipments and accessories. It was however, noted that there is no separate budget for the center as in the case of other universities in Ghana and does not help in equipment purchases and general planning. There were 1716 computers on the university campus in 2005 with 1215 connected to the campus wide network27. 2.10 University of Ghana, Legon The University has five Faculties, a Business School, Institutes, College of Health Sciences and a number of Agricultural Research station across the country. The faculties are made up of a number of departments and research centers. The College of Health Sciences is made of Noguchi Memorial Institute and five schools (Medical, Dental, Public Health, Allied Health and Nursing). There are also twelve workers� colleges in all the 10 regions in Ghana. The university has three campuses; the main campus at Legon, Medical School at Korle-Bu a distance of about 15 kilometers and the Accra City Campus at the center of Accra business district. The estimated student population for 2006 stood at 28,482 with teaching and non- teaching staff of 3847. Its strategic location on the Legon Hill makes it attractive for wireless technologies (networking). Major telecommunication companies and some service providers in Ghana have either their communication towers (mast) or equipments installed on the University campus.
27 A survey of ICT equipment statistics conducted by the KNUST ICT Center in December 2005

18
2.10.1 University of Ghana ICT Infrastructure The University has been at the forefront for the development of ICT in the research and education community by hosting and participation in different project on the university campus and elsewhere in Ghana. The university entry into the ICT and Internet in started in 1995 when it was designated as a National Host for the FidoNet E-mail system. FidoNet is a store and forward electronic mail system which exchanges mail and files via Modems using a proprietary protocol. They are connected for the purposes of exchanging E-Mail to the Internet through a series of gateway systems28. Through this project the university was able to interconnect all the university libraries and some research institutions to form a nation-wide mailing system with the Balme Library at Legon as its gateway to the Internet. The USIAD provided financial support to the University in 1996 for the purchase of hardware to establish a full Internet connectivity. This was after the submission of a report by Dr. George Sadowsky on the assessment of the University of Ghana telecommunication infrastructure. The package included contract and installation charges as well as full year�s ISP fee for a 64kbps link to an Internet Service Provider in Accra. The University received a further boost to its backbone infrastructure when in1998/99 the Danish Government through DANIDA gave a grant totaling about $US450, 000 for the laying of a fiber optic backbone to some nodes and the University Library. An additional assistance was provided by DANIDA in 2001 for a VSAT to upgrade the Internet backbone from 64kbps to 128/512kbps uplink and downlink29.
Figure 9: University of Ghana Backbone The University�s current fiber-optics backbone runs through mainly the Academic and Administrative areas of the campus with four Nodes at the Geography Building, Main Telephone Exchange Room, the Graduate Center Building and the Registry (Main Academic 28 http://www.fidonet.org/genlinfo.html (Cited on 13th November 2006) 29 Dakubu, M., ICT In the University of Ghana, http://www.foundation-partnership.org/linchpin/legon.htm (Cited on 13th November 2006)

19
Offices. Links to other buildings are by either fiber optic, Ethernet, wireless or ADSL depending on the distance from the nearest node. The backbone is shown below with the four main nodes, NOC and the wireless link to Accra City Campus and Medical School Campus at Korle-Bu. The Networking operation Center (NOC) is located in the main telephone exchange building and it houses the networking equipment, servers and VSAT for the backbone Internet connectivity which operates at 2/7 Mbps uplink and downlink respectively. The monthly subscription fee for this connection is US$9000. The network management, troubleshooting and other administrative activities are carried out by the ICT Directorate in the ICT building. The ICT directorate has well-equipped computer laboratories and training facilities with approximately 440 computers that provides access to both students and staff of the University. 2.11 University of Education Winneba The University of Education Winneba is a multi-campus institution with three campuses across the country. The main campus is located at Winneba with satellite campuses in Kumasi and Mampong. There are plans to establish a fourth campus at Ajumako in the central region. The main campus is further divided into North, Central and South campuses. The full time student population is 12,464 with an additional 5,398 pursing distance education at 12 Regional Study Centres throughout the country. There are six Faculties and the total staff position is 136730. 2.11.1 Network Infrastructure at UEW, Winneba
Figure 10: University of Winneba Wireless Backbone The University�s wireless backbone infrastructure is shown in figure 10 above. There are three separate networks on each of the three campuses at Winneba. They are interconnected 30 http://www.uew.edu.gh/aboutus.html (Cited on 15th November 2006)

20
by the wireless link with the central hub at the North campus that serves as the gateway to the Internet through a VSAT. The VSAT operates at 3Mbps (downlink) and 1Mbps (uplink). The Kumasi campus on the other hand has its on VSAT installation which provides the campus with Internet connection. Most of the buildings on each campus have LANs and are linked to their respective gateways. For example, the South Campus has the Main Administration block as its gateway and the University Library, SRC Building and the Science building are linked to it by fiber optic cables. The individual buildings on the North Campus are also interconnected by fiber in most cases. The Central Campus however has a single LAN serving its offices. The ICT Center is in charge of the campus-wide network and provides support and training to both staff and students. Its main activities include routine maintenance of equipment, trouble shooting and teaching. The center has a two network technicians, 7 technical facilitators, 3 repairers, four teaching instructors and 2 office administrators. It is headed by an ICT coordinator. The center�s computer laboratories are used by students and staff training. 2.12 University of Cape Coast (UCC) University of Cape Coast has made modest gains since it started its campus-wide network development a few years ago. It has also shown how institutions can finance their ICT through internal generated funds and limited budget. The investment in networking equipment and installation of fiber optic cable was fully paid for through its own resources. Today it has one of the finest Intranets on its campus that had helped in the reduction of man hours needed during students� registration periods; a problem that persists in some of the universities in Ghana. Cape Coast is also home to some of the oldest and the best secondary schools in Ghana. These schools have trained a number of people who are in top managerial position in both the private and public sectors of the Ghanaian Economy. The UCC node is expected to provide connectivity to some of these schools when the NREN is established. UCC has four Faculties and three schools. The faculties are Arts, Science, Social Science, and Education. The School of Business, School of Biological Sciences and School of Agriculture are the remaining divisions. In addition to the above there are Centers and institution offering different programs and services to students and the University community. The total student enrolment for 2006 academic year is 17,090. The university has 353 full-time academic staff and quite a number of administrator and non-teaching staff. 2.12.1 Network Topology and Infrastructure The network topology (Star) divides the university into six sub-networks. Five are in the New Site Campus and the Nodes are inter-connected by fiber optics cable. The sub-network at the Old site is linked by wireless (Radio) which operates. Figure 11 gives a picture of the network.

21
Figure 11: University of Cape Coast Backbone The Network Operation Centre (NOC) at the computer center as has been the case in most institutions manages the university-wide network. The key network servers and gateways are installed at the center. There are four technical support staff, one network administrator and a coordinator working at NOC. The University�s Internet connectivity is through a VSAT located at the Computer Centre with a backbone capacity of 512 kbps/1.0Mbps (Uplink/Downlink). The monthly ISP fee for this connection is US$8700. There are 500 computers and hosts connected to the network. The ICT Centre laboratory provides over 200 computers for student use and it is financed and maintained through students� user fees which are paid by students at the beginning of each academic year. The current user fee is US$30. 2.13 University for Development Studies, Tamale The University for Development Studies is a multi-campus institution having campuses that are geographically located far apart at Tamale and Nyankpala in the Northern, Navrongo in Upper East and Wa in the Upper West regions. The University for Development Studies was established in 1992 by the Government of Ghana in reaction to what the foundation University Registrar referred to as �the new thinking in higher education which emphasizes the need for universities to play a more active role in addressing problems of the society, particularly in the rural areas�31. The University for Development Studies, sited in the north of the country, started admitting students into its programs in 1993. It combines academic studies with practical field training. The current (2005/2006) student population is 5,264 with a break down of 3,677 males and 1,587 females. There are 119 full-time academic staff who are support by administrator and non-teaching staff.
31 Kaburise J.B.K (2003), The UDS experience with developing an alternative approach to tertiary education (A case study prepared for a Regional Training Conference on Improving Tertiary Education in Sub-Saharan Africa: Things That Work!)

22
2.13.1 ICT Situation at UDS The university operates four different campus-wide networks at each of its four campuses. Three of these campuses � Central Administration (Tamale), Nyankpala and Navrongo are interconnected to form a wide area network. Campus-wide networks have been installed at Navrongo and Nyankpala campuses using fiber-optic cables which connect various LANs. Local Area Network cabling has been done at Wa campus, but wide area Network installation is outstanding. Three VSAT dish have been installed at Nyankpala, Central Administration and Navrongo campuses. The size of the outdoor dish in each is 2.4-metre, pointing at Gilat Intersparknet satellite with a 10-watt transceiver. The indoor equipment comprises of Idirect Satellite Modem and Cisco Router/Firewall. Two main servers (Gateway and DNS Server) in addition to Net Stream and IP Router are located at the Central Administration. There is also a Secondary Gateway server at Nyankpala. 2.14 Research Institutions in Ghana Three main research institutions in Ghana have been chosen for discussion. These are Center for Scientific and Industrial Research (CSIR), Ghana Atomic Energy Commission (GAEC) and Cocoa Research Institute of Ghana (CRIG) at Tafo. CSIR and GAEC had participated in the GARNET project which was formed as the National Research and Academic Network in 2001. GARNET would be discussed in the sections below. CRIG was included in the list because of its proximity to the VRA fiber optic backbone Node at Tafo and as one of the oldest research institution in Ghana. It research area is very important to the Ghanaian economy since cocoa is one of the main export earning of Ghana. 2.14.1 Cocoa Research Institute (CRIG) of Ghana The Cocoa Research Institute (CRIG) of Ghana was established at Tafo (Eastern Region) in June, 1938 as the Central Cocoa Research Station of the Gold Coast. This was before Ghana attained independence from the British in 1957. It was set up to investigate the outbreak of cocoa diseases and to introduce control measures to solve the pest problem. It was expanded to West African Cocoa Research Institute in 1944 with a sub-station at Ibadan, Nigeria. CRIG is under the management of Ghana Cocoa Board (COCOBOD) which is responsible for the development of the cocoa, coffee and sheanut industries in Ghana. CRIG has approximately 35 well trained professionals in various scientific disciples and 175 technical staff. It has three sub-stations at Bunso, Afosu and Bole which carry out specific research activities. It researches into problems relating to the production of cocoa, coffee, kola, sheanut and other indigenous oil tree crops which produce fats similar to cocoa butter. It also provides information and advice on all matters relating to the production of the crops32. 2.14.2 Ghana Atomic Energy Commission The Ghana Atomic Energy Commission (GAEC) was set up in 1963 as the national agency in Ghana responsible for all matters relating to the peaceful uses of nuclear and atomic energy. It was further mandated in 2000 to co-ordinate and promotes research into peaceful and safe applications of nuclear energy, science and technology, and biotechnology. The document further stipulates that it commercializes its research activities. 32 http://www.cocobod.gh/indexcoco.cfm (Cited on 16th November 2006)

23
Three main institutions of GAEC are Biotechnology and Nuclear Agriculture Research Institute (BNARI), National Nuclear Research Institute (NNRI) and Radiation protection Institute (RPI). The day-to-day management of the Commission is the responsibility of the Central Administration which is headed by a Director-General. The total work force of GAEC is approximately 422. Ghana Atomic Energy Commission was one of the members of GARNET when it was formed in 2001. It has also participated in a number of networking projects that had been carried out by the Universities and other institutions. One of such project was Ghana National Committee for Internet Connectivity which had membership from the Ministries and the Universities. It is therefore important to include it in the future NREN. Some of its international research partners are International Atomic Energy Agency (IAEA) and Abdus Salaam International Centre for Theoretical Physics (ICTP), Trieste, Italy. It has benefited from a number of ICT and networking training program from ICTP. It has a small backbone network which is connected to the Internet via VSAT operating at 64 Kbps/256kbps inbound and outbound capacity respectively33. 2.14.3 Center for Scientific and Industrial Research (CSIR) The Center for Scientific and Industrial Research (CSIR) has 13 institutions and resource center in four region of Ghana. There are 4 in Ashanti region, 2 in the Eastern, 1 in the northern and the remaining 6 in Greater Accra. The Secretariat is also located in Accra, housing four of these institutions as shown in Table 3 below. Table 3: List of CSIR Institution in Ghana
Region Institute Location Ashanti • Crops Research Institute
• Building and Road Research Institute • Soil Research Institute • Forestry Research Institute
Kumasi
Eastern • Oil Palm Research Institute • Plant Genetic Resources Centre
Kade Bunso
Northern • Savanna Agricultural Research Institute
Tamale
Greater Accra • Animal Research Institute • Food Research Institute • Institute for Scientific and
Technological Information • Science and Technology Policy
Research Institute • Institute of Industrial Research • Water Research Institute • CSIR Secretariat
Accra
33 http://www.gaecgh.org/ (Cited on 17th November 2006)
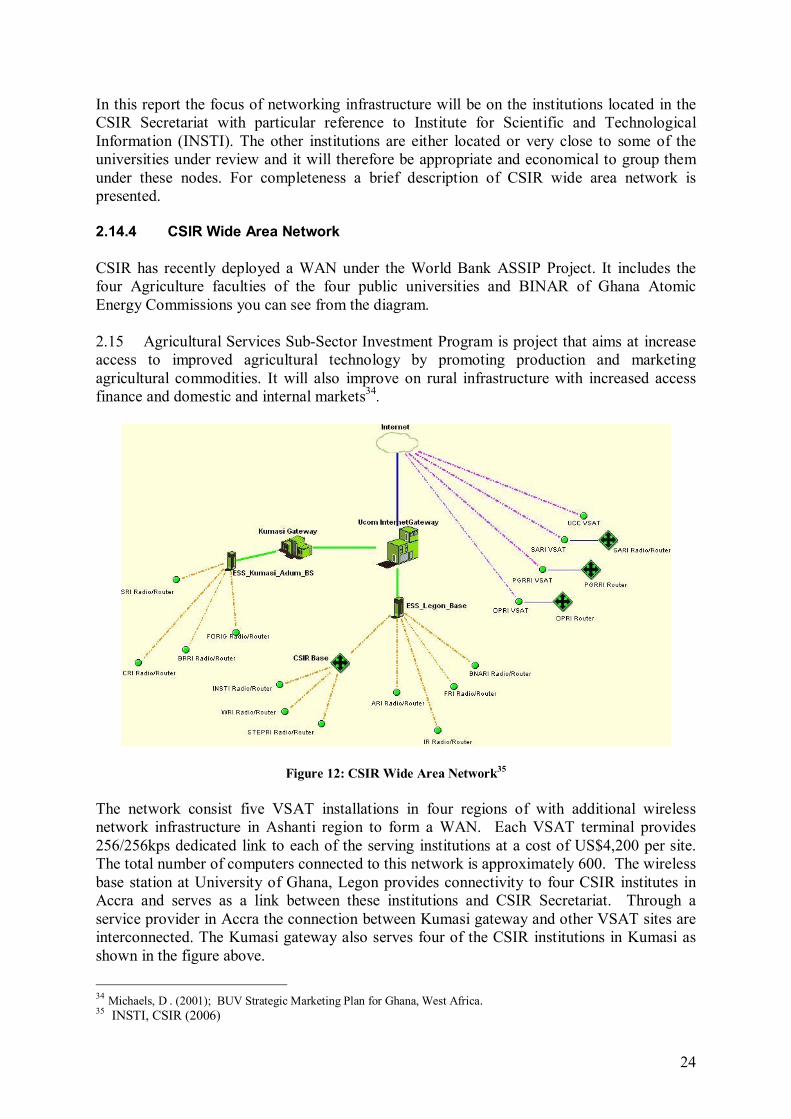
24
In this report the focus of networking infrastructure will be on the institutions located in the CSIR Secretariat with particular reference to Institute for Scientific and Technological Information (INSTI). The other institutions are either located or very close to some of the universities under review and it will therefore be appropriate and economical to group them under these nodes. For completeness a brief description of CSIR wide area network is presented. 2.14.4 CSIR Wide Area Network CSIR has recently deployed a WAN under the World Bank ASSIP Project. It includes the four Agriculture faculties of the four public universities and BINAR of Ghana Atomic Energy Commissions you can see from the diagram. 2.15 Agricultural Services Sub-Sector Investment Program is project that aims at increase access to improved agricultural technology by promoting production and marketing agricultural commodities. It will also improve on rural infrastructure with increased access finance and domestic and internal markets34.
Figure 12: CSIR Wide Area Network35 The network consist five VSAT installations in four regions of with additional wireless network infrastructure in Ashanti region to form a WAN. Each VSAT terminal provides 256/256kps dedicated link to each of the serving institutions at a cost of US$4,200 per site. The total number of computers connected to this network is approximately 600. The wireless base station at University of Ghana, Legon provides connectivity to four CSIR institutes in Accra and serves as a link between these institutions and CSIR Secretariat. Through a service provider in Accra the connection between Kumasi gateway and other VSAT sites are interconnected. The Kumasi gateway also serves four of the CSIR institutions in Kumasi as shown in the figure above.
34 Michaels, D . (2001); BUV Strategic Marketing Plan for Ghana, West Africa. 35 INSTI, CSIR (2006)

25
The network operations center at INSTI is equipped with the following networking accessories: DNS and database server, a Cisco router, a VSAT (1.2m diameter; 4 watts) and wireless router which provided connectivity to institutions located at the CSIR secretariat. The total number of LANs at the Secretariat is 19 whiles INSTI has 60 computers connected to its LAN. The CSIR example shows the need for the education and research institution in Ghana to create a network that will be affordable and also encourage resources sharing. Though limited in network capacity in terms of bandwidth, it is a perfect case study that needs to be investigated to determine the pros and cons in the establishment of NREN in future.
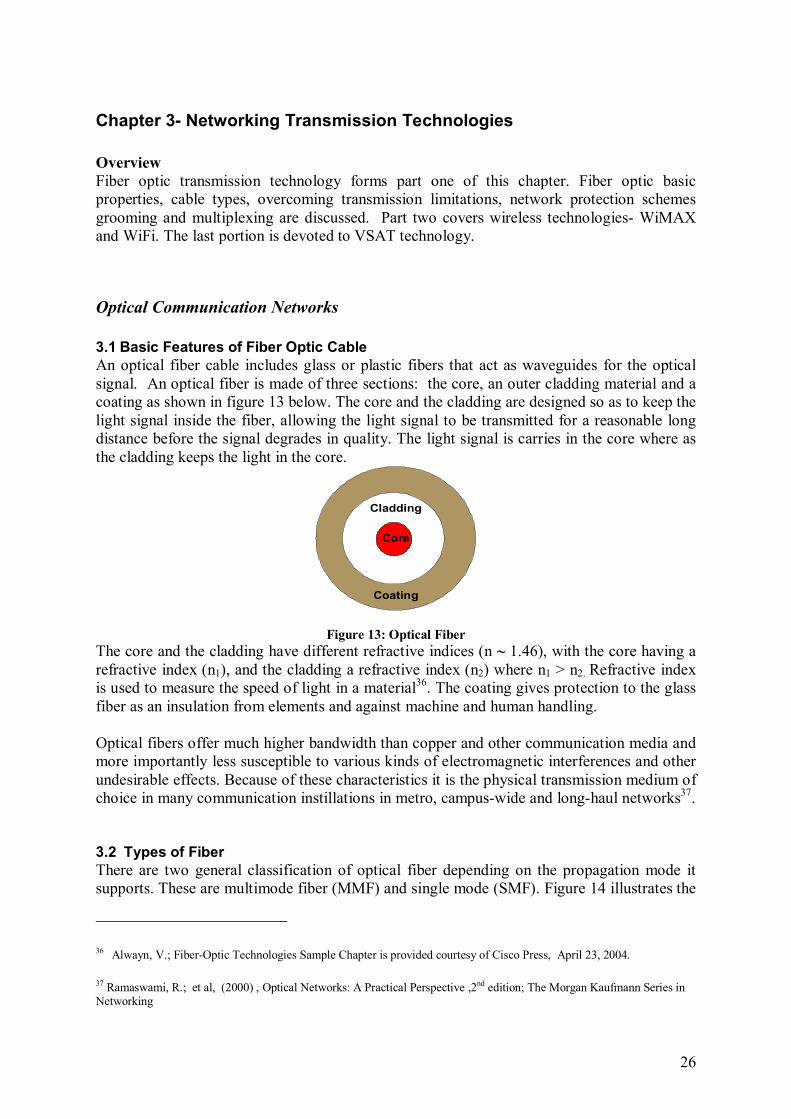
26
Chapter 3- Networking Transmission Technologies Overview Fiber optic transmission technology forms part one of this chapter. Fiber optic basic properties, cable types, overcoming transmission limitations, network protection schemes grooming and multiplexing are discussed. Part two covers wireless technologies- WiMAX and WiFi. The last portion is devoted to VSAT technology.
Optical Communication Networks 3.1 Basic Features of Fiber Optic Cable An optical fiber cable includes glass or plastic fibers that act as waveguides for the optical signal. An optical fiber is made of three sections: the core, an outer cladding material and a coating as shown in figure 13 below. The core and the cladding are designed so as to keep the light signal inside the fiber, allowing the light signal to be transmitted for a reasonable long distance before the signal degrades in quality. The light signal is carries in the core where as the cladding keeps the light in the core.
Cladding
Coating
Core
Figure 13: Optical Fiber The core and the cladding have different refractive indices (n ~ 1.46), with the core having a refractive index (n1), and the cladding a refractive index (n2) where n1 > n2. Refractive index is used to measure the speed of light in a material36. The coating gives protection to the glass fiber as an insulation from elements and against machine and human handling. Optical fibers offer much higher bandwidth than copper and other communication media and more importantly less susceptible to various kinds of electromagnetic interferences and other undesirable effects. Because of these characteristics it is the physical transmission medium of choice in many communication instillations in metro, campus-wide and long-haul networks37. 3.2 Types of Fiber There are two general classification of optical fiber depending on the propagation mode it supports. These are multimode fiber (MMF) and single mode (SMF). Figure 14 illustrates the
36 Alwayn, V.; Fiber-Optic Technologies Sample Chapter is provided courtesy of Cisco Press, April 23, 2004.
37 Ramaswami, R.; et al, (2000) , Optical Networks: A Practical Perspective ,2nd edition; The Morgan Kaufmann Series in Networking

27
propagation of light through both types which is achieved by total internal reflections at the core-cladding interface. Each allowed ray represents a mode. SMF carries a single mode and MMF could have more than one mode.
Figure 14: Single Mode and Multimode Light Propagation Figure 15 shows the dimensions of MMF and SMF optical fibers which are measured in micrometers (µ). The single mode fiber has a small core diameter of between 8-10µm and a cladding diameter of 125µm that allows only one mode of light to propagate through it. It is typically used for long haul and metro networks.
1 µm = 0.000001 meters (10-6) 1 human hair ~ 50 µm 38
Figure 15: Measurements of SMF and MMF Core and Cladding
The MMF on the other hand has a bigger core diameter (about five to seven times bigger) than the SMF. It permits multiple modes of light to propagate through it. Each of the modes travels at slightly different speed making the length of the path also different from each other. However the cladding diameter is the same as that of the SMF. There are two variations of MMF which are distinguished by their core diameters: The 50µm and 62.5 µm for step index and graded index respectively. The 50µm is a standard in Japan and Germany whiles 62.5µm is widely used in United State and elsewhere. The MMF is usually used for very short distances of approximately 2km. It is also deployed on Local Area networks, campus-wide networks and for the manufacturing of fiber patch cords. It is limited in bandwidth as compared to the SMF39, (Ramaswani, 2000), (Wood, 2006). 3.3 Fiber Optic Cable The above section had concentrated on a strand of fiber optic cable for simplicity. In the real world deployment, the fibers are bundled into a number of pairs and additional protective materials are needed to separate and support conditions under which they are installed. Fiber optic cable refers to the complete assembly of fibers, strength members and jacket. For this
38 Cisco Optical Workshop Optical Fundamentals January 31, 2004 39 Dark Fibre Lighting Technologies - http://www.seefire.org/content/modules/downloads/SEEFIRE-WP1-D12FibreAcquisitionExperiences-a-20050830a.pdf (Cited on 1st November 2006)
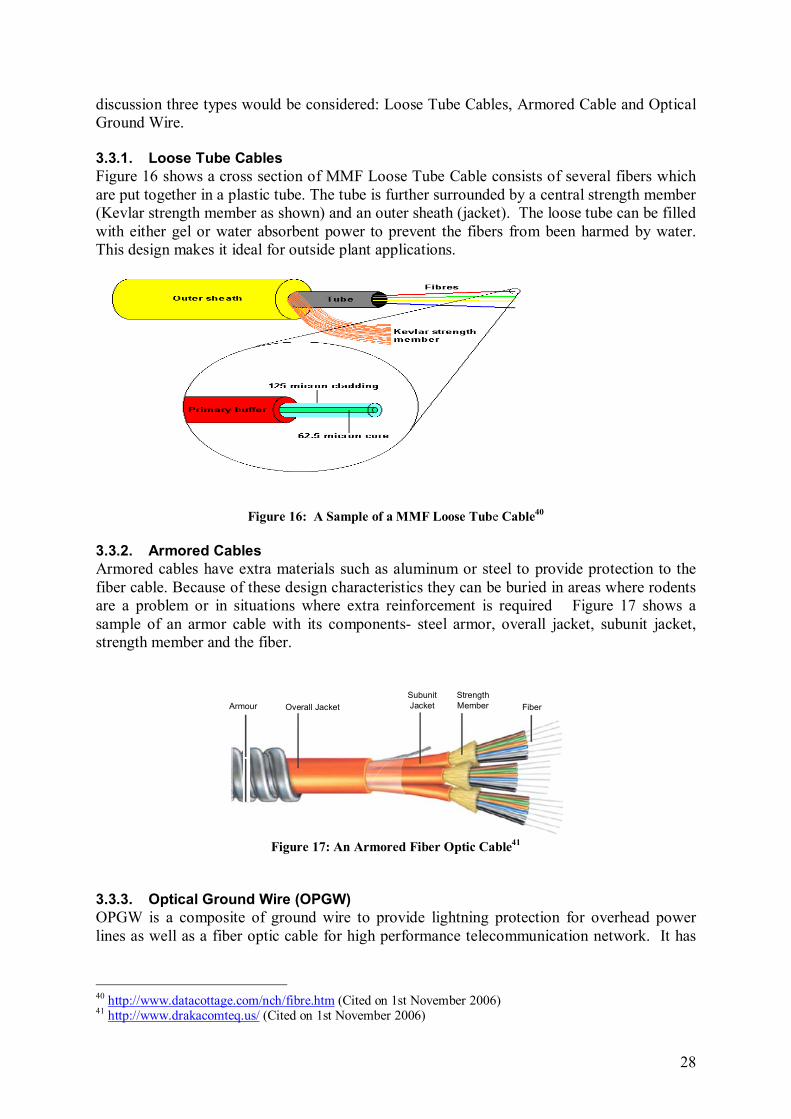
28
discussion three types would be considered: Loose Tube Cables, Armored Cable and Optical Ground Wire. 3.3.1. Loose Tube Cables Figure 16 shows a cross section of MMF Loose Tube Cable consists of several fibers which are put together in a plastic tube. The tube is further surrounded by a central strength member (Kevlar strength member as shown) and an outer sheath (jacket). The loose tube can be filled with either gel or water absorbent power to prevent the fibers from been harmed by water. This design makes it ideal for outside plant applications.
Figure 16: A Sample of a MMF Loose Tube Cable40
3.3.2. Armored Cables Armored cables have extra materials such as aluminum or steel to provide protection to the fiber cable. Because of these design characteristics they can be buried in areas where rodents are a problem or in situations where extra reinforcement is required Figure 17 shows a sample of an armor cable with its components- steel armor, overall jacket, subunit jacket, strength member and the fiber.
FiberSubunit JacketArmour Overall Jacket
Strength Member
Figure 17: An Armored Fiber Optic Cable41
3.3.3. Optical Ground Wire (OPGW) OPGW is a composite of ground wire to provide lightning protection for overhead power lines as well as a fiber optic cable for high performance telecommunication network. It has
40 http://www.datacottage.com/nch/fibre.htm (Cited on 1st November 2006) 41 http://www.drakacomteq.us/ (Cited on 1st November 2006)
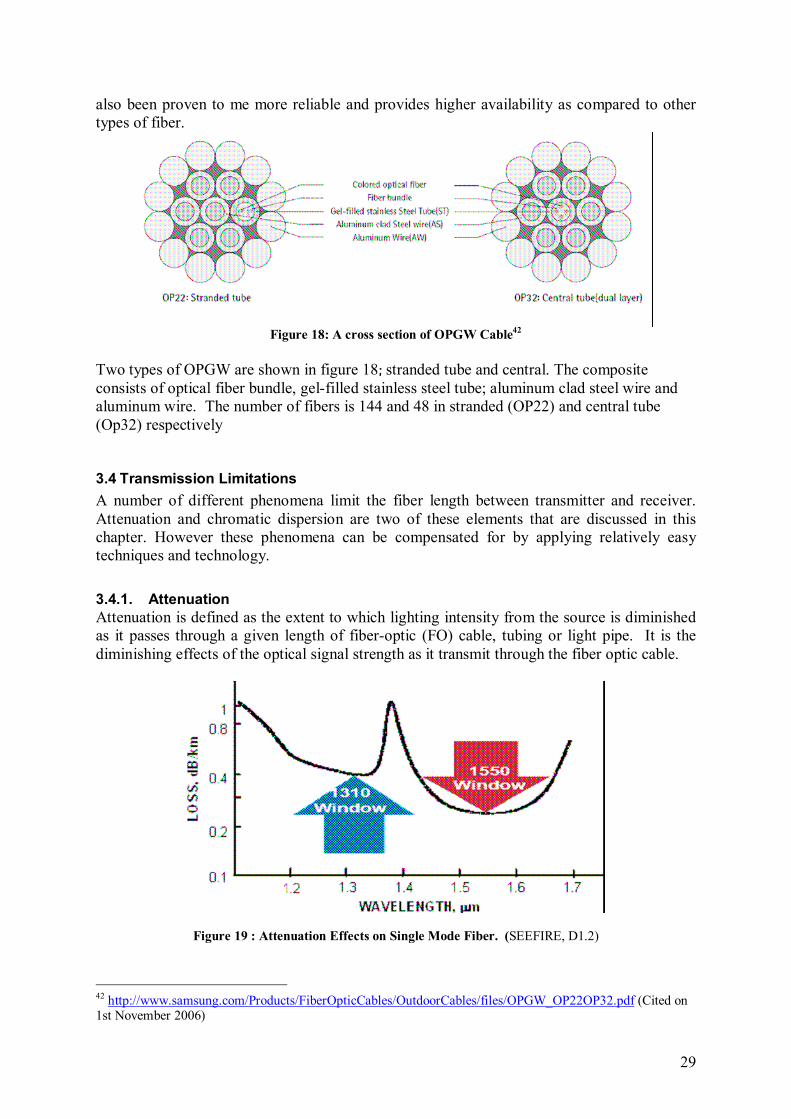
29
also been proven to me more reliable and provides higher availability as compared to other types of fiber.
Figure 18: A cross section of OPGW Cable42
Two types of OPGW are shown in figure 18; stranded tube and central. The composite consists of optical fiber bundle, gel-filled stainless steel tube; aluminum clad steel wire and aluminum wire. The number of fibers is 144 and 48 in stranded (OP22) and central tube (Op32) respectively 3.4 Transmission Limitations A number of different phenomena limit the fiber length between transmitter and receiver. Attenuation and chromatic dispersion are two of these elements that are discussed in this chapter. However these phenomena can be compensated for by applying relatively easy techniques and technology. 3.4.1. Attenuation Attenuation is defined as the extent to which lighting intensity from the source is diminished as it passes through a given length of fiber-optic (FO) cable, tubing or light pipe. It is the diminishing effects of the optical signal strength as it transmit through the fiber optic cable.
Figure 19 : Attenuation Effects on Single Mode Fiber. (SEEFIRE, D1.2)
42 http://www.samsung.com/Products/FiberOpticCables/OutdoorCables/files/OPGW_OP22OP32.pdf (Cited on 1st November 2006)

30
Attenuation is specified in loss per kilometer (dB/km) and the values at 1310 nm and 1550 nm windows are 0.40dB/km and 0.25dB/km respectively. It has a peak value at the 1400nm as shown in figure 19. Attenuation of an optical signal varies as a function of wavelength. Clearly, attenuation in fiber optics is very low, as compared to other transmission. 3.4.2. Chromatic Dispersion Dispersion is the time distortion of an optical signal that results from the time of flight differences of different components of that signal, typically resulting in pulse broadening. Chromatic dispersion is caused by the fundamental physical properties of the glass and from the light traveling in both the core and the inner cladding glasses at the same time but at slightly different speeds. This is further explained by the fact that the refractive index is wavelength dependent whereas different frequency-components of the optical pulses travel at different speeds. Due to this, all materials used in optical networks exhibit a chromatic dispersion and it is more significant at higher bit rates, which is 10Gbits per second and beyond. Chromatic dispersion in an optical fiber depends on the wavelength of the signal. Standard silica-based optical fiber has essentially no chromatic dispersion in the 1.3µm band but is significant at in the 1.55µm band. To compensate for this, a dispersion fiber is designed to have zero dispersion at 1.55 µm wavelength window.
Figure 20: CD for G.652 fiber. (SEEFIRE, D1.2) The wavelength at which dispersion equals zero is called the zero-dispersion wavelength (λ). This is the wavelength at which fiber has its maximum information-carrying capacity. For standard single-mode fibers, this is in the region of 1310 nm. In digital transmission, dispersion limits the maximum data rate, the maximum distance, or the information-carrying capacity of a single-mode fiber link.43 The ITU-T G.652 standard Non dispersion-Shifted Fiber is described in section 3.5.2. 3.5 Overcoming Limitations Attenuation and chromatic dispersion are among factors that caused the degradation of the optical signal data as it travels in the fiber. They affect the maximum distance between the transmitter and the receiver. In the case of a very long distance the signal level becomes so weak for a given receiver sensitivity due to attenuation. This requires the optical power of the 43 http://www.iec.org/online/tutorials/fiber_optic/topic06.html (Accessed 22nd November 2006)

31
signal to be reconditioned periodical with the aim of making sure that the optical signal at the receiver�s end is greater that the sensitivity of the receiver. 3.5.1. Optical Amplification Optical components such as multiplexer and couplers also add loss to the optical signal been transmitted through the fiber cable. To restore signal strength, amplification is introduced before it becomes too weak. Before the introduction of optical amplifiers this was achieved through the use of regenerators. Regenerators� extracts signals from the fiber, convert the optical signal to the electrical domain where it is re-amplified, reshaped and retransmitted. Optical amplifiers offer several advantages over regenerators such as easily upgradeable since they do not depend on a specific bit rates or signal formats as in the case of regenerators. A single amplifier can simultaneously amplify several WDM signals because of their fairly large gain bandwidth. Regenerators are required for each wavelength under the same condition. Optical amplifiers are very important component in long-haul installations and are present in every long-haul DWDM design. Optical amplifiers are general place for every 100km of distance travel. Its replacement however depends on number of factors such as total attenuation, dispersion tolerance and the fiber providers hut locations (Wood, 2006). The use of optical amplifiers also introduce few problems such degradation of optical signal to noise ratio (OSNR), add noise which accumulates as the signals goes through a number of amplifiers. The main noise source is amplified spontaneous emission (ASE). To eliminate compensate for the above mentioned problems Optical-Electrical-Optical (O-E-O) regenerators are introduced. The 3Rs function which means reshape, retimes and preamplifiers the input signals. 3.5.2. Nondispersion-Shifted Fiber (ITU-T G.652) The ITU-T G.652 fiber is also known as standard SMF and is the most commonly deployed fiber. It accounts for about 95% of worldwide fiber deployments. It has a zero-dispersion wavelength at 1310 nm and can also operate in the 1550-nm band, but it is not optimized for this region. It is also relatively cheap as compared to other fibers (SEEFIRE, D1.2) 3.6 Grooming and Multiplexing44,45 Grooming is an industry term used to describe the optimization of capacity utilization in transport systems by means of cross-connections or conversions between different transport systems or layers within the same system. Grooming typically involves the use of frequency or time-slot conversion equipment to increase the effective capacity and efficiency of a network. Grooming enables savings in network cost and improves network performance by multiplying low-speed traffic connections onto a high-capacity circuit pipes. As the bandwidth capacity on a strand of fiber for example is very high, there is the need for the network to support traffic that is low-rate than the full wavelength of the fiber. This is 44 R. S. Barr and R. A. Patterson, ‘‘Grooming Telecommunication Networks,’’ Optical Networks Magazine, vol. 2, no. 3, pp. 20-23, May/June 2001. 45 Zhu ,K. Et al,, �A review of traffic grooming in WDM optical networks: architecturs and challenges�, Optical Networks Magazine, Vol. 4, Issue 2, pp. 55-64, March/April 2003.

32
achieved through grooming. Grooming stems from the application of multiplexing and bundling techniques that are used to combine multiple traffic streams into composite higher speed units. Different multiplexing schemes are therefore employed for traffic grooming in different domains in WDM networks. Two of the multiplexing techniques are time division multiplexing (TDM) and frequency division multiplexing (FDM) that are used in SONET-SDH and WDM optical networks respectively. The detailed multiplexing in SONET-SDH and WDM are treated below. TDM partitions the bandwidth�s time domain into repeated time-slots of fixed length allowing multiple signals to allow a given wavelength in non-overlapping times. FDM on the other hand divides the available frequency spectrum into a set of independent channels. The use of FDM in optical network domain enables a given fiber to transmit traffics on many different wavelength or channels. 3.7 SDH and SONET46 Synchronous digital hierarchy (SDH) and synchronous optical network (SONET) are two telecommunication standards that have brought order to digital communication. They also represent a group of fiber-optic transmission rates that can transport digital signals with different capacities47. SONET was defined by the American National Standards Institute (ANSI) is mainly used in North America. SDH is used in Japan, Europe and the rest of the world and was standardized by European telecommunication Standards Institute and further by International telecommunication Union ITU-T recommendation G.691 specification. SONET and SDH share many similarities but there are still minor differences between these two standards. Some of these differences are the transmission rates for SONET and SDH shown in table 4. This would be discussed later in the section below. The primary aim of the standardization was to reduce the operational cost of copper based backbone voice backbone by 50 percent, and brought standardization into the digital communication over optical fiber transmission networks. To address some of the problems associated with Plesiochronous digital hierarchy (PDH) transmission and multiplexing standard in the late 1980s. SONET and SDH represent the current transmission and multiplexing standard for high-speed signals within the carrier infrastructure in the world. SDH and SONET would be used interchangeable through out this section. 3.7.1. Benefits of SDH-SONET The benefits of SDH-SONET can be classified under Multiplexing, Management, Interoperability and Network availability and these were significant improvement over PDH. It also provides traffic grooming and segregation. Multiplexing: the synchronous multiplexing structure of SDH provides significant cost reduction in multiplexing and demultiplexing. All elements use one clock as reference. It also allows direct access to lower level signals since lower-speed signal can be extracted from a multiplexed SDH stream. This reduces back-to-back multiplexing which is associated with asynchronous multiplexing. In such a scheme it is very difficult to extract a low-bit-rate stream from a higher bit-speed stream without demultiplexing the higher-speed down to its individual component. This is attributed to the fact that each terminal in the network runs its 46 (Wood, 2006) and (Ramaswami., 2000) 47 http://www.iec.org/online/tutorials/sdh/
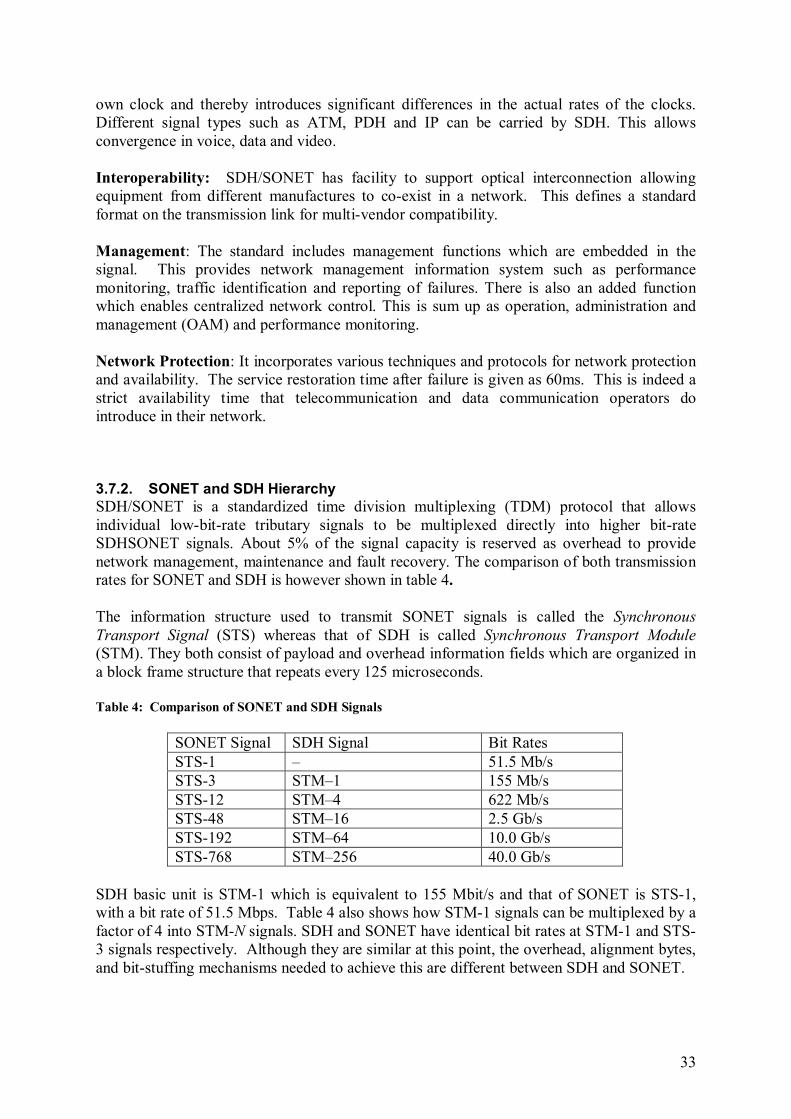
33
own clock and thereby introduces significant differences in the actual rates of the clocks. Different signal types such as ATM, PDH and IP can be carried by SDH. This allows convergence in voice, data and video. Interoperability: SDH/SONET has facility to support optical interconnection allowing equipment from different manufactures to co-exist in a network. This defines a standard format on the transmission link for multi-vendor compatibility. Management: The standard includes management functions which are embedded in the signal. This provides network management information system such as performance monitoring, traffic identification and reporting of failures. There is also an added function which enables centralized network control. This is sum up as operation, administration and management (OAM) and performance monitoring. Network Protection: It incorporates various techniques and protocols for network protection and availability. The service restoration time after failure is given as 60ms. This is indeed a strict availability time that telecommunication and data communication operators do introduce in their network.
3.7.2. SONET and SDH Hierarchy SDH/SONET is a standardized time division multiplexing (TDM) protocol that allows individual low-bit-rate tributary signals to be multiplexed directly into higher bit-rate SDHSONET signals. About 5% of the signal capacity is reserved as overhead to provide network management, maintenance and fault recovery. The comparison of both transmission rates for SONET and SDH is however shown in table 4. The information structure used to transmit SONET signals is called the Synchronous Transport Signal (STS) whereas that of SDH is called Synchronous Transport Module (STM). They both consist of payload and overhead information fields which are organized in a block frame structure that repeats every 125 microseconds. Table 4: Comparison of SONET and SDH Signals
SONET Signal SDH Signal Bit Rates STS-1 � 51.5 Mb/s STS-3 STM�1 155 Mb/s STS-12 STM�4 622 Mb/s STS-48 STM�16 2.5 Gb/s STS-192 STM�64 10.0 Gb/s STS-768 STM�256 40.0 Gb/s
SDH basic unit is STM-1 which is equivalent to 155 Mbit/s and that of SONET is STS-1, with a bit rate of 51.5 Mbps. Table 4 also shows how STM-1 signals can be multiplexed by a factor of 4 into STM-N signals. SDH and SONET have identical bit rates at STM-1 and STS-3 signals respectively. Although they are similar at this point, the overhead, alignment bytes, and bit-stuffing mechanisms needed to achieve this are different between SDH and SONET.

34
3.7.3. Elements of SONET/SDH Infrastructure The three basic elements of SONET/SDH infrastructure are Line Terminal Multiplexers (LTM), Add/Drop multiplexers (ADM) and digital cross connects (DCS). These elements are used to create different network topologies such as point-to-point, point-to-multipoint, hub and rings. The ring based-base network architecture is most popular because of their reliability and overall facilities cost management. 3.7.4. Add and Drop Multiplexer (ADM) ADMs are used to add or drop lower order signals from a higher order signals and are usual deployed in the nodes of ring topology. They incorporate protection mechanisms which are needed when network failures occur in addition to the multiplexing and demultiplexing operations. Figure 21 shows a sketch of a simple SDH/SONET ADM. In this scheme a STM-n optical signal enters the ADM, lower rate signals (STM-.m) are dropped off whiles the PDH signals are added to the stream. The remaining signals pass through the ADM unchanged
Figure 21: A sketch of an ADM
The exclusive use of ADMs in network design has a number of advantages in terms of control. The rings that are formed by ADM are controlled by low-level protocols and therefore large centralized network management-based configurations are often not needed. The network protections mechanisms are also guaranteed as all rings are built on physically disjoint media layers and intersecting rings have full capabilities to switch connections between rings at the two points of intersections48. The limitation on ADM in traditional SONET networks is that one ADM is needed for each wavelength at every node to perform traffic add/drop on that particular wavelength (Zhu, 2003). 3.8 Wavelength Division Multiplexing (WDM) Wavelength Division Multiplexing (WDM) enables the multiplexing of several optical signals on a single fiber. WDM are adopted by network operators because there is the need to satisfy the demand and growth as well as to compensate for the shortage of fibers on an existing infrastructure. It has also proven to be more economical solution to augment transmission capacity than alternative solutions. Some of the reasons are that; WDM can follow traffic growth, transmission transparency can accommodate different client signals formats and also the only practical approach that can maximize the huge fiber bandwidth potential49�50. WDM technology has also revolutionized optical data transmission by radically increasing the transmission capacity on a single fiber. It has therefore become a
48 Sexton, M., et al (1997), Broadband Networking- ATM SDH and SONET, Artech House Publishers, Boston-London. 49 Arijs, P., Planning of WDM Ring Networks, Photonic Network Communications, 2:1, 33-51, 2000 50 Evolution and prospect of China optical fiber transport networks

35
preferred transmission technology for the medium and long haul transport networks. It addresses the fiber constraints issues in both the long haul and metro networks. In the long haul case fiber capacity should be maximized whiles in the metro networks; number of unique services using distinct optical wavelengths can be proliferated Using 40 wavelengths at 40 Gb/s each for example, yield an aggregate bandwidth of 1.6 trillion bits per second per fiber (1.6 Tb/s). This works out to approximately 20 million simultaneous conversations per fiber in an SDH-SONET terms. The figure 22 depicts a single fiber using a number of wavelengths (λ1�.λN) to carry different traffic. For example λ1 for Internet traffic whereas λ2 might be voice traffic. The content of the payload are handled appropriately by the sender and the recipient51 .
Figure 22: Multiple wavelengths on a single fiber (Kartalopoulos, 2002)
3.8.1. Types of WDM A wavelength is a term for the color of light, usually expressed in nanometers (nm) or microns (m). Fiber is mostly used in the infrared region where the light is invisible to the human eye52. Wavelength is often used interchangeably with the terms lambdas, channels and colors.
Figure 23: Wavelength regions53
51 Kartalopoulos, S. V., �Elastic Bandwidth,� IEEE Circuits and Devices Magazine, vol. 18, no. 1, pp. 8-13, Jan 2002 52 http://www.lanshack.com/fiber-optic-tutorial-jargon.aspx (Cited on 1st November 2006) 53 ibid

36
WDM is generally used as an umbrella term to refer to all optical multi-lambda systems. Its spectrum spreads from 1310 nm to nearly 1700 nm in the multiple windows of usable, infrared light. WDM comes in two fundamentally different flavors, each with its own complexity, specifications and cost structure.
Table 5: CWDM and DWDM Comparison (SEEFIRE, D1.2) The classifications are coarse WDM (CWDM) and dense WDM (DWDM) based on the proximity of the separation between different wavelengths within the infrared region. DWDM is designed for long haul and operates in the C and L band window to achieve lowest attenuation. It can be applied to optical systems using inter-wavelength separation of 100 GHz (.8nm) or closer. At 100 GHz spacing a 32 wavelength is achieved and by increasing the density to 50 GHz separation allows for 64 wavelengths within the same range of wavelength spectrum. CDWM- is referred to as coarse because of the wide separation between the wavelengths. The 20nm spacing gives up to 18 wavelengths which covers the 1310nm S band through to the 1550 nm C band window. This enables low cost production optical component for the creating a multi-wavelength system for the metro and short range application. The key components used for CWDM networks are designed as passive optical devices leading to CWDM applicability in the passive optical networks (PON) (Ramaswami, 2000). 3.8.2. Optical Network Elements A WDM network uses wavelength to transmit traffic. There are three key network elements that support WDM optical networking. These are optical line terminals (OLT), optical add and drop multiplexers (OADM) and optical cross connects (OXC). 3.8.3. Optical Line Terminal (OLT) OLTs are used at either end of a point-point link to multiplex and demultiplex wavelength. They are also considered as very simple elements from architectural point of view. An OLT system may consist of wavelength multiplexer, optical amplifiers, regenerators and transpodents.

37
Figure 24 below shows an OLT. The wavelength multiplexer combines multiple wavelengths into a single fiber and also demultiplexes a composite WDM signal into individual wavelength. The multiplexer device does the multiplexing and another component the device demultiplexer device does the reverse operation of the multiplexer device.
Figure 24: Optical Line Terminal54
Optical amplifiers and regenerators are optional components which are required to boost the signal strength and reshaping when needed. When these components are present, the OLT monitors their performance along the link. Transponders are however required to convert the 1310 nm interfaces of SONET/SDH equipment to the WDM wavelengths. They generate a wavelength that conforms to the ITU standards in the 1550 nm wavelength window. The transponder monitors the bit error rates of the signal at both the ingress and egress points of the network. In addition to the above the transponder performs forward error corrections (FEC) in cases where the signal is at 10Gbits or higher rates. 3.8.4. Optical Add and Drop Multiplexers An Optical Add Drop Multiplexer device allows adding new signals and decoupling the existing ones to/from the multiplexed beam being transmitted on a fiber. Signals that need to be dropped are split from the beam whereas others pass through the device on changed. New channels can also be inserted (SEEFIRE, D1.2). A typical OADM sites are able to drop or add wavelength as needed while at the same time allowing other wavelengths to pass through the site unchanged.
Figure 25: Optical Add and Drop Architecture Figure 25 illustrates the operation of a simple parallel OADM. This architecture requires the entire wavelength to be separated and multiplexed back. An optical beam composing of
54 WDM Guru User Guide

38
wavelengths (λ1 λ2�. λN) are demultiplexed and some of the channels are drop in this case λ1 and λ2. The remaining wavelength say λ3 to λN go through unchanged and two more channels which might have been generated by other transmission device (router/switch) located behind the OADM are added. OADM are usually deployed in linear or ring networks. The OADM can also be used to transform any type of network, mesh, ring or star, into a physical single fiber ring network in a WDM network. OADM are more economical to be deployed in an optical network than SDH/SONET add and drop multiplexer since it can handle multiple wavelengths to increase scalability and manageability. SDH Add/Drop Multiplexer (ADM) on the other hand can only handle one wavelength of traffic; each wavelength requires one SONET/SDH ADM making it not cost-effective to support large scale networks55. . Reconfigurable OADM (ROADM) is an advanced form of OADM which allows the network operator to remotely configure the OADM to suit the network requirements and thereby increasing network flexibility and efficiency. The design allows wavelength to be dropped and added on the fly, eliminating and advanced network planning and placement of appropriate network equipment. It also introduces flexibility into the network planning as operators can dynamically setup and tear down ligthpath or wavelengths (Ramaswami, 2000). 3.8.5. Optical Cross Connects (OXC) Optical cross connects are introduced into the network to handle more complex network topologies like mesh and handling large numbers of wavelengths at locations where large amount of traffic exist. Their design and capabilities of (OXCs) are more complex than OADM which are used basically in rings and linear topologies to handle limited number of wavelengths. The advance functionalities of ROADM which were mentioned above are also incorporated in OXCs to enable reconfiguration of optical networks by setting up and tearing down of ligthpath without having to be statically provisioned. The term optical is used but OXC�s internal fabric could be either an electrical or a pure optical. The classification of optical cross connect in this regards would be discussed in the subsequent sections. 3.8.6. Types of OXC An OXC is composed of a switch core and a port complex. The switch core contains the switch that performs the cross connect functions. The port complex is the interface that communicates with other equipment through its port cards. OXCs are classified according to their switching matrix and whether it is built of electronic or optical fabrics as shown in figure 26:
55 El-Bawab, T.S., et al, Evolution to optical-switching-based core networks, Optical Networks magazine Vol.4 Issue.2. pp 7-19, 2003.
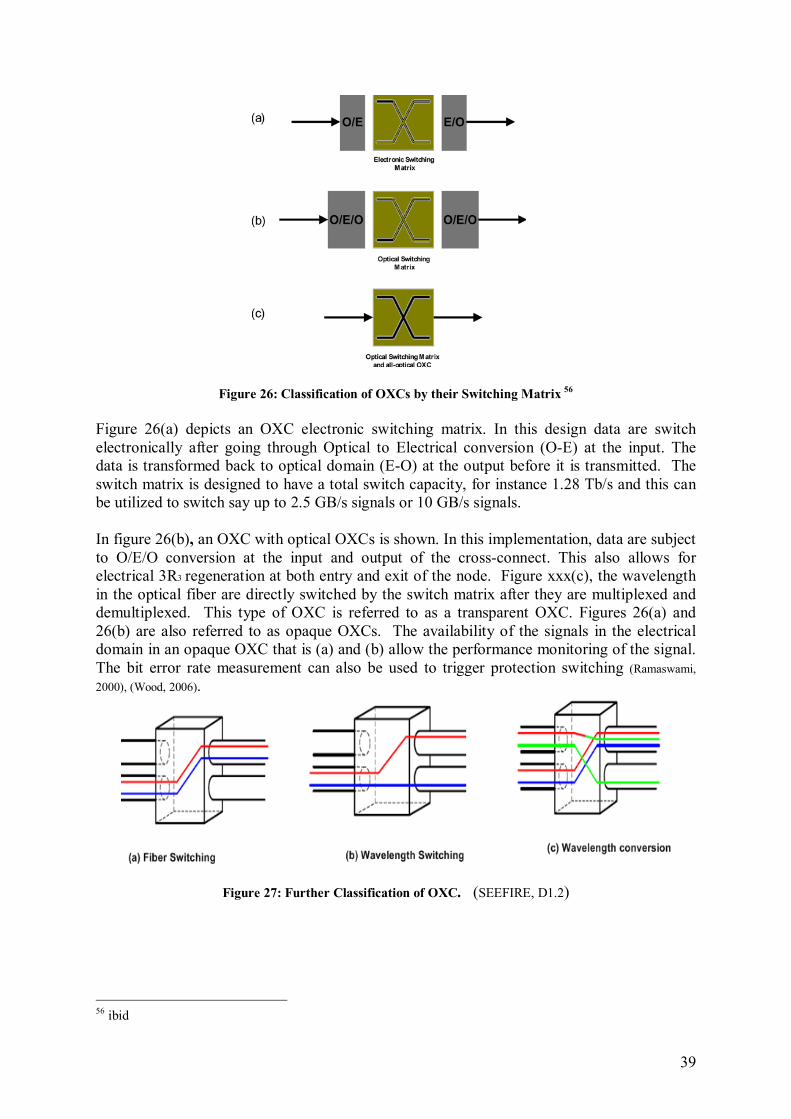
39
Figure 26: Classification of OXCs by their Switching Matrix 56 Figure 26(a) depicts an OXC electronic switching matrix. In this design data are switch electronically after going through Optical to Electrical conversion (O-E) at the input. The data is transformed back to optical domain (E-O) at the output before it is transmitted. The switch matrix is designed to have a total switch capacity, for instance 1.28 Tb/s and this can be utilized to switch say up to 2.5 GB/s signals or 10 GB/s signals. In figure 26(b), an OXC with optical OXCs is shown. In this implementation, data are subject to O/E/O conversion at the input and output of the cross-connect. This also allows for electrical 3R3 regeneration at both entry and exit of the node. Figure xxx(c), the wavelength in the optical fiber are directly switched by the switch matrix after they are multiplexed and demultiplexed. This type of OXC is referred to as a transparent OXC. Figures 26(a) and 26(b) are also referred to as opaque OXCs. The availability of the signals in the electrical domain in an opaque OXC that is (a) and (b) allow the performance monitoring of the signal. The bit error rate measurement can also be used to trigger protection switching (Ramaswami, 2000), (Wood, 2006).
Figure 27: Further Classification of OXC. (SEEFIRE, D1.2)
56 ibid

40
The following capabilities may be incorporated in an OXC; fiber switching, wavelength switching and Wavelength conversion. Figure 27 illustrates the three types using 2x2 OXC. The capability can be extended to much larger ports like (32x32) OXC. Fiber switching OXC switch the entire wavelength from an input fiber to an output fiber. This can be done either manually or remotely as desire by the network operator. This has a lower cost because of its flexibility and least in complexity. Figure 27(b) shows the wavelength switching functionality of an OXC. The two input fibers (wavelengths) at an input port for example are switched to two different output ports as it goes through the OXC. It allows the switching of different wavelength from each fiber to the other. This type of OXC is more complex than figure 27(a) but offer more flexibility to support wavelength-based services. Figure 27(c) shows the most expensive and complicated OXC of the three types. In addition to switching a signal from one port to another, the OXC has the capability to perform wavelength conversion (Ramaswami, 2000). 3.9 Regeneration Nodes Regenerators are needed in optical networks when the distances between the end nodes (terminal sites) are too long to support the fiber�s span optical power budget. Optical Power Budget: refers to the amount of light available to make a fiber optic connection. The regenerator retime, reshape and regenerate the optical signal through O-E-O procedure which has been mentioned above. The process also involves demultiplexing, regeneration and remultplexing of optical wavelengths57. 3.10 Network Survivability Fiber optics is used in most backbone and long haul networks today and by their nature carries a large among of data as has been outlined in the previous sections. The effect of failures in fiber optics is compounded when we consider WDM systems. The sources of failures to telecommunication infrastructure and networks have been identified as cable (fiber) cuts, equipment (node) failures as well as human errors. Fiber or cable cut is the most common occurrence among the above and most protection schemes which we would be considering below tend to address this. Failure in the cable or node equipment could be disastrous and there is the need for alternative or redundancy in equipment to be put in place to overcome these failures. There is a relationship between loss of service and revenue. Data loss may lead to loss revenue to both service providers and users. There is therefore the need for networks to recover from failures in a reliable and rapid manner. Network survivability is the ability of a network to provide service in an event of failures. Survivability of the transport network in the presences of equipment failures and cable cuts is now a routine requirement, while graceful recovery from major disaster is a central operational and planning preoccupation for most network operators (Sexton, 1997) . Survivability assumes that only one fault is present at a time and that the probability of two simultaneous faults is negligible. In fact, it is theorized that the simultaneous occurrence of multiple faults is so remote that addressing it adds unreasonable cost to the node and network, and thus it can be overlooked58. 57 Wood, R. (2006). Next-generation Network Services, Cisco Press, Indianapolis. 58Kartalopoulos, S.V. Surviving a Disaster, IEEE communications Magazine, 2002, 40 (7) , p. 124-126.

41
3.11 Types of Network Survivability Two types of techniques are defined �protection and restoration. In protection technique, resources or capacity are reserved in advance and are utilized for recovery when a failure occurs. Restoration means backup resources are discovered dynamically after failures and requires additional signaling to establish restoration path at the time of failure. Two additional terms are defined as primary and working paths which carry traffic under normal operation. A protection path provides an alternative path to carry traffic when there is a failure. These two would be applied through out the discussion in this section. 3.12 Protection Protection schemes requires dedicated resources to be reserved in fibers, wavelength and switches and are only used in times of failures. This shows that a lot of capacity might be wasted through resources reservation but the good thing about it is that it takes shorter time to recover from failures. The reserved resources can also be guaranteed. The reservation is done either during connection setup or as part of network planning. Automatic Protection Switching (APS) and Self-Healing Ring (SHR) are the two types of switching mechanisms under protection architecture. �A simple APS protocol works as follows: if a receiver in a node detects a fiber cut, it turns off its transmitter on the working fiber and then switches over to the protection fiber to transmit traffic. The receiver also detects the loss signal and performs the same operation� (Ramaswami, 2000). APS is however used to handle link failures and is applied to point-to-point topologies such as line transmitting systems. SHR has the capabilities to detect failures automatically and move traffic away from both failed links and nodes to protection routes. This means it performs both node and link protection. 3.12.1. Automatic Protection Switching (APS) Three variations of APS are defined; 1+1 APS, 1:1 APS and 1:N APS as shown in the figures below: The 1+1 APS requires a protection link for every working link. Traffic is transmitted on both links and the receiver selects which signal to use when there is a failure. The destination in figure 28 is responsible for the switching of signals when the network fails.
Working link
Protection linkSource Destination
Splitter Switch
Working link
Protection linkSource Destination
SwitchSwitch
Figure 28: 1+1 APS Figure 29: 1:1 APS
The 1:1 APS also has both working and protection link, the source and the destination will switch to the protection only when there is a failure. The protection link is not used during normal operation but could be made to carry pre-emptible or low-priority traffic
In the case of APS 1:N the backup resources are shared by a number of working links. This variation can handle a failure in any working fiber. The APS protocol must ensure that there is only one failed traffic is routed onto the protection link in case of multiple failures. The protection link can also be used to carry low-priority traffic under normal conditions. But this traffic must be discarded when there is a failure on the working links. The 1:N shared protection show more cost efficient than the two other schemes. For example in the 1+1 protection 100% of the network resource is rendered redundant. 1:N protection can also be
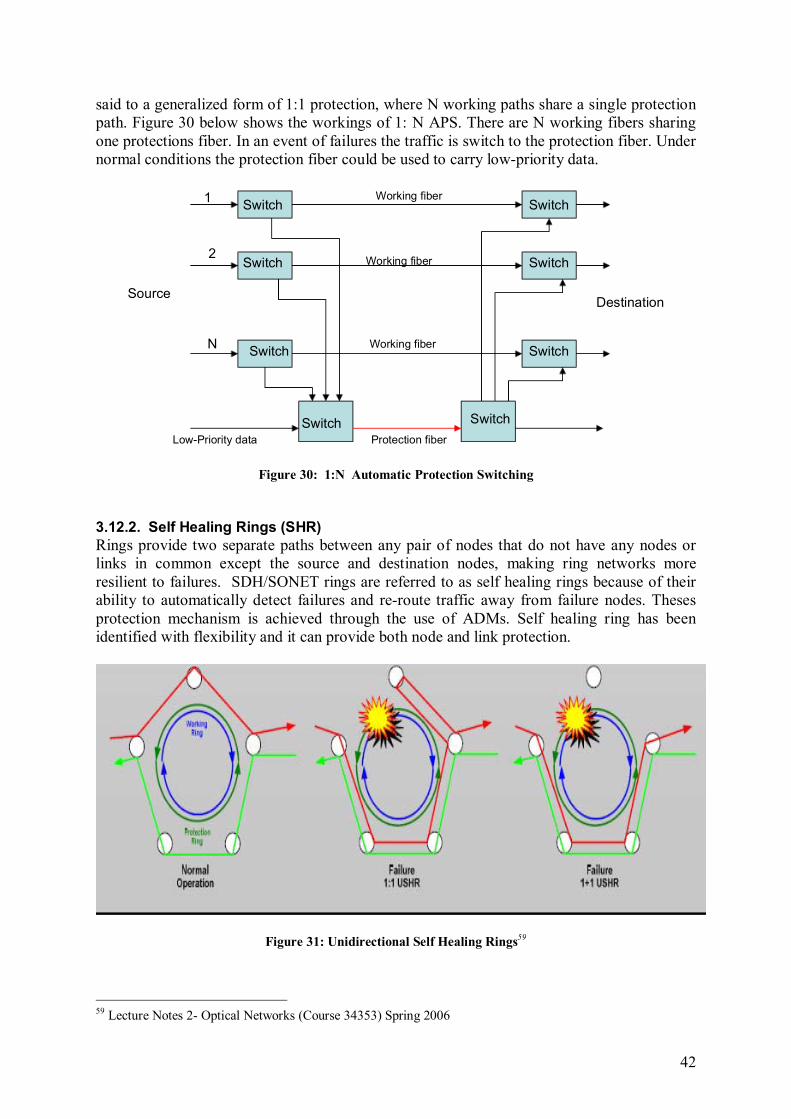
42
said to a generalized form of 1:1 protection, where N working paths share a single protection path. Figure 30 below shows the workings of 1: N APS. There are N working fibers sharing one protections fiber. In an event of failures the traffic is switch to the protection fiber. Under normal conditions the protection fiber could be used to carry low-priority data.
1 Switch
Switch
Switch
Switch
Switch
SwitchSwitch
SwitchLow-Priority data Protection fiber
Source Destination
2
N
Working fiber
Working fiber
Working fiber
Figure 30: 1:N Automatic Protection Switching
3.12.2. Self Healing Rings (SHR) Rings provide two separate paths between any pair of nodes that do not have any nodes or links in common except the source and destination nodes, making ring networks more resilient to failures. SDH/SONET rings are referred to as self healing rings because of their ability to automatically detect failures and re-route traffic away from failure nodes. Theses protection mechanism is achieved through the use of ADMs. Self healing ring has been identified with flexibility and it can provide both node and link protection.
Figure 31: Unidirectional Self Healing Rings59
59 Lecture Notes 2- Optical Networks (Course 34353) Spring 2006
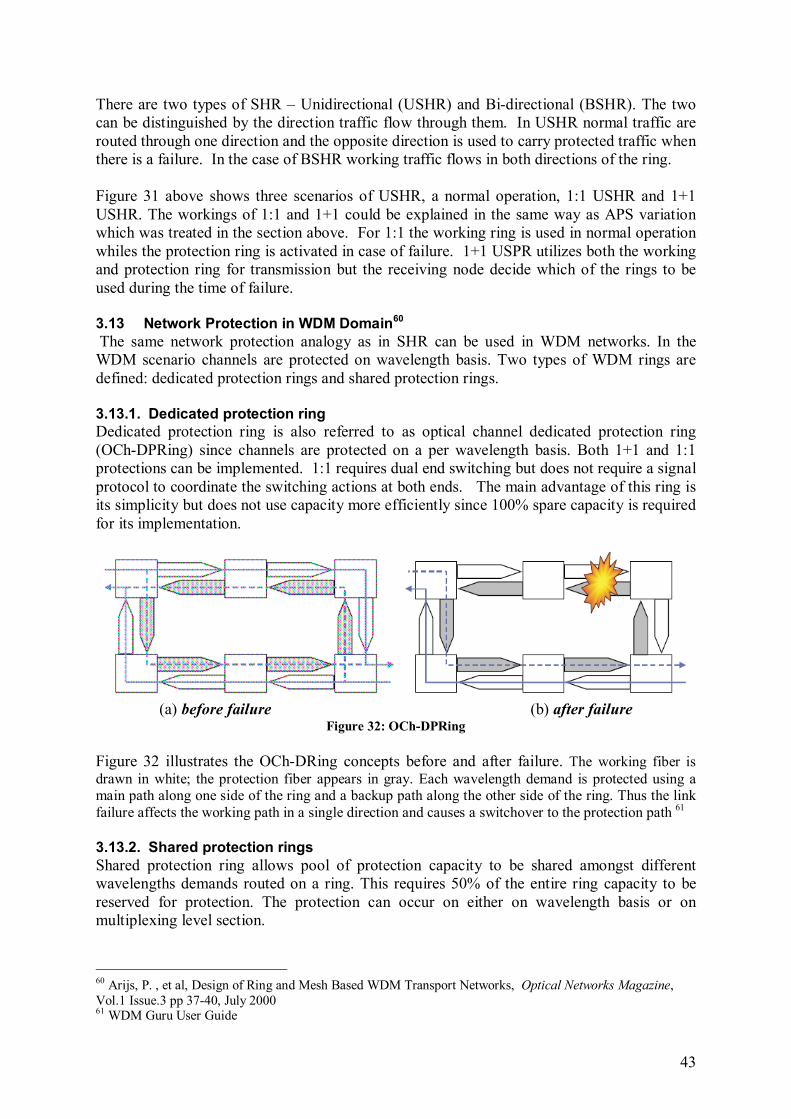
43
There are two types of SHR � Unidirectional (USHR) and Bi-directional (BSHR). The two can be distinguished by the direction traffic flow through them. In USHR normal traffic are routed through one direction and the opposite direction is used to carry protected traffic when there is a failure. In the case of BSHR working traffic flows in both directions of the ring. Figure 31 above shows three scenarios of USHR, a normal operation, 1:1 USHR and 1+1 USHR. The workings of 1:1 and 1+1 could be explained in the same way as APS variation which was treated in the section above. For 1:1 the working ring is used in normal operation whiles the protection ring is activated in case of failure. 1+1 USPR utilizes both the working and protection ring for transmission but the receiving node decide which of the rings to be used during the time of failure. 3.13 Network Protection in WDM Domain60 The same network protection analogy as in SHR can be used in WDM networks. In the WDM scenario channels are protected on wavelength basis. Two types of WDM rings are defined: dedicated protection rings and shared protection rings. 3.13.1. Dedicated protection ring Dedicated protection ring is also referred to as optical channel dedicated protection ring (OCh-DPRing) since channels are protected on a per wavelength basis. Both 1+1 and 1:1 protections can be implemented. 1:1 requires dual end switching but does not require a signal protocol to coordinate the switching actions at both ends. The main advantage of this ring is its simplicity but does not use capacity more efficiently since 100% spare capacity is required for its implementation.
(a) before failure (b) after failure
Figure 32: OCh-DPRing Figure 32 illustrates the OCh-DRing concepts before and after failure. The working fiber is drawn in white; the protection fiber appears in gray. Each wavelength demand is protected using a main path along one side of the ring and a backup path along the other side of the ring. Thus the link failure affects the working path in a single direction and causes a switchover to the protection path 61 3.13.2. Shared protection rings Shared protection ring allows pool of protection capacity to be shared amongst different wavelengths demands routed on a ring. This requires 50% of the entire ring capacity to be reserved for protection. The protection can occur on either on wavelength basis or on multiplexing level section.
60 Arijs, P. , et al, Design of Ring and Mesh Based WDM Transport Networks, Optical Networks Magazine, Vol.1 Issue.3 pp 37-40, July 2000 61 WDM Guru User Guide

44
Optical channel shared protection ring (OCh-SPRing) refers to the wavelength switching whiles optical multiplexing section shared protection is the name assigned to multiplexing level section switching. The other two variants of OMS-SPRing are 2-fiber OMS-SPRing and 4.-fiber OMS-SPRing. The name suggests the number of fibers that are required between two adjacent optical add and drop multiplexers. The 2-fiber OMS-SPRing requires half of the wavelengths on each fiber to be reserved as protection channels. The 4-fiber OMS-SPRing on the other hand requires working and protection channels to be routed over different fibers allowing the assignment of the same wavelength to both directions of the working path. This eliminates the use of wavelength conversion as in the case of 2-fiber OMS-SPRing when bi-directional traffic is applied. There is no difference between the OCh-SPRing and OMS-SPRing in terms of capacity utilization and configuration. However, OMS-SPRing requires different switching and termination procedure for affected traffic when a failure occurs in the network. OCh-SPRing uses reduced length of protection path than OMS-SPRing. 3.14 Restoration Dynamic restoration does not require an advance resources reservation during connection setup. Resources that are needed to recover from failures are however chosen from available resources at the time of failure. It also deals with both link and path restoration. Link restoration requires end nodes of a failure link to be responsible for the discovery of resources that would be needed to route the traffic around the links. In path restoration the source and the destination nodes participate in the discovery exercise to ensure that adequate resources are available to re-direct the traffic at the time of a failure. Generally, protection is faster in terms of time that is needed to recovery from failures than dynamic restoration. In addition, service restoration can be guaranteed since adequate reservations are made either during connection setup or at network planning stage. However, more resources are utilized to make for the reservation. Restoration utilizes resources more efficiently as they are only needed in times of failures.
Wireless Communication Technology62,63
WiFi Alliance is a non-profit organization with the goal of driving the adoption of a single worldwide-accepted standard for high-speed wireless local area networking. Wi-Fi Alliance develops universal specifications and follows through with rigorous testing and Wi-Fi certification of wireless devices. IEEE 802.11 line of products and networks are often referred to as WiFi.
3.15 WLAN 802.11 standards There are currently a number of IEEE 802.11 standards which address different implementation of wireless networks. Five of these standards 802.11a, 802.11b, 802.11g, 802.1x and 802.11i will be discussed in this section. The remaining standards will be introduced briefly. The 802.1x and 802.11i both have special security features that address the Wired Equivalent Privacy (WEP) key management problem in 802.11. WEP provides
62 SuEn Tan and Anders Henten, Wifi and WiMAX- Complements and/or Substitutes? , CICT Conference 2006. 63 Gast M., S, 802.11 Weireless networks : The Definitive Guide; 2nd Edition, O'Reilly Networking, 2005

45
security to wireless networks by protection data against, modification, reliability and interception by unauthorized user. Other standards worth mentioning are 802.11e for quality of service (QoS), 802.11c for wireless bridge operations, 802.11f for access point (AP) inter-roaming recommendations and high rate specification in 802.11n standard (Wood, 2006). The 802.11r and 802.11s are preparing the 802.11 community for a possible entry into the mobile market. The IEEE 802.11r specification ensures the use of wireless VoIP and other real time applications, whereas 802.11s standard is for meshed WiFi networks. The 802.11b is the most widely standard use WLAN today. It uses a 2.4 GHz Industrial, Medical and Scientific (IMS) frequency band. Transmission is based on Direct Sequence Spread Spectrum (DSSS) achieving data rates 1, 2, 5.5, and 11Mbps. The 802.11a standard uses 5GHz Unlicensed National Information Infrastructure (UNII) frequency band and offers a data rate up to 54Mbps. It uses Orthogonal Frequency Division Multiplexing (OFDM) for transmission instead of DSSS. But the higher operating frequency equates to relatively shorter range. The 802.11b and 802.11a are not compatible making it difficult for the two standards to co-exist on the same LAN infrastructure. The 802.11g operates on the 2.4GHz, the same frequency used by 802.11b. Though the two standards were approved at the same time it was not until recently that 802.11g was introduced on the market. It uses Orthogonal Frequency Division Multiplexing (OFDM) technique to achieve data transmission rate of up to 54Mbps. The 802.11g provides backward compatible with 802.11b standards enabling the two to co-exist in the network. The maximum speed of 802.11g users are however reduced since additional protocol overhead is required for the co-existents on the same access point. The added benefits of the 802.11g technique are the lower cost of the 2.4GHz radio as well as the lower power requirements of the 2.4GHz transmitters in end devices. Low power is extremely important to many wireless handheld devices (Wood, 2006). 3.15.1. IEEE 802.1x and IEEE 802.11i Standards The 802.1x was originally designed as a device oriented authentication standard for Ethernet LAN implementations to provide network access control. Its advantages has found place in WLAN security. With 802.1x the user does not authenticate to the Access Point (AP) but to the local area network resources. Several authentication schemes have been approved; such as Certificates, Kerberos and RADUIS. The choice has often been (RADUIS) - remote dial-in user services (RADIUS). The 802.1x takes advantage of the existing authentication protocol - Extensible Authentication Protocol (EAP) to provide centralized authentication of wireless clients. The authentication procedure goes through three phases: the supplicant (client), the authenticator (AP) and authentication server e.g. RADIUS server. The access to the network is prohibited until such devices pass authentication. The 802.11i defines a new architecture to cover future generations WLAN security. 802.11i adds stronger encryption, authentication, and key management strategies that go a long way toward guaranteeing data and system security. The enhancement is based on the authentication scheme of the 802.1x framework and the protocol called Temporary Key

46
Integrity Protocol (TKIP). The TKIP is used to eliminate the static key problem in WEP. The two features of TKIP are: per packet key hashing and message integrity check (MIC). 3.15.2. Comparison on WLAN standards The choice between 802.11a, 802.11b, and 802.11g has to do mainly with availability and the price of supporting products. 802.11a has relatively shorter range than the other two standards. 802.11g could offer the same through put as 802.11a but with much bigger range, and also compatible to 802.11b. From the availability aspect, 802.11g is the best choice. The price of supporting products for 802.11g and 802.11b is normally cheaper than the products for 802.11a. 802.11i uses AES and TKIP for stronger encryption and better key management compared with 802.1x. The 802.1x standard uses centralized key management based on mutual authentication. The choice between 802.11i and 802.1x deals mainly with confidentiality. 3.15.3. Components of 802.11 LANs The components of 802.11 LANs consist of stations, Access Points (AP), wireless medium and distribution systems. Stations are made of computing devices with wireless interface such as laptops, PDAs and desktop computers with wireless interface cards. The Access points perform the wireless-to wired bridging function. Wireless medium is used to transfer frames from one station to the other. The distribution system coordinates communication between access points and mobile stations when Access Points (APs) are connected to form a large coverage area. 3.15.4. Types of Networks The basic services set (BSS) are the basic building block of the IEEE 802.11 architecture. The BBS defines the group of stations that communicate with each other over a geographical area referred to as basic service area (BSA).
Ad Hoc Network Infrastructure Network
Figure 33: Types of Networks Adhoc networks - are group of stations that can communicate with each other. They are formed by a single BSA: The Ad hoc networks are temporarily in nature and are usually formed for specific purposes for example during trade shows and conferences. In the figure above stations A, B, C and D can communicate with each other within the range outlined

47
above. They do not require any intermediary devices. The minimum number of stations required to form an Ad Hoc network is two. Infrastructure Networks � an infrastructure network the Access point is used for all communication between the stations in the same service area. The AP acts a relay between these stations. Figure 33 illustrates a simple infrastructure network. In this setup, if station A for example would like to communicate with B the frame is sent to the AP which forwards it to B. That is two hops are required to complete a communication. A station must first be associated with an AP before it obtains network services. An association is a mapping between an AP and a station. A re-association service allows a station with an established association to move its association from one AP to another AP. Termination of an existing association is referred to as disassociation64, (Gast, 2006). 3.16 WiMAX 65 WiMAX stands for World-wide Inter-operability for Microwave Access, a technology for fixed, portable, and mobile communication66. WiMAX is based on IEEE 802.16 family of standards which offers a relatively low cost wireless broadband solution to residence and businesses. WiMAX technology offers much higher bandwidth and range than other wireless broadband access technologies like WiFi. The theoretical coverage is put at 50 km radius with a data rate of up to 75Mbps. The bandwidth reduces as the range is extended. It combines its wide coverage with quality of service (QoS) potentials for real-time applications like video streaming and real-time delay sensitive application such as VoIP. The greater range and increased bandwidth will be more attractive to service providers seeking solution to last mile deployment at a lower cost (Pareek, 2006). 3.16.1. Elements of WiMAX A WiMAX basic system consists of a base station and a WiMAX receiver. The base station may be connected to a public network such as fiber optic backbone, microwave link and a high speed point-to-point connection. The base station provides connectivity to a number of subscribers or stations. The base station house the indoor equipment as well as the WiMAX towers. Any wireless node within the range of 10km of the base station can be configured to get connected to the base station. The media access control allocates resources (uplink and downlink) to subscribers based on their needs and requirements on real-time basis. The receiver equipment may consist of a standalone box with antennae or simply a PCMCIA card with integrated antennae which could be inserted in a laptop or PC. How the receiver gets connected to the base station is not different from what exist in WiFi networks. The only potential difference might be the range of connectivity provided by WiMAX which is more in this case.
64 Leon-Garcia, A. et al, Communication Networks: Fundamental Concepts and Key Architectures, 2nd Ed., McGraw-Hill, 2004. 65 Pareek, D, WiMAX: Taking Wireless to the MAX; Auerbach Publishers Inc., 384 pages, 2006. 66 Esmailzadeh R; Broadband Wireless Communications Business: An introduction to the Cost and Benefits of New Technologies; 2006, John Wiley & Sons Ltd.

48
Figure 34: WiMAX Network Topology (Pareek, 2006)
Figure 34 above shows a WiMAX network topology with the base station connecting to a WiMAX receiver station in a point-to-point and point-to-multipoint configurations. The base station also has connection to a backbone providing Internet connection using fiber optic cable. There are also a variety of user equipment such as WiFi, Access Point and phone line connected to the receiver. Other configurations could be WiMAX Local Multi-Point Distribution System (LMDS) and Mesh network which are not shown in the figure. 3.16.2. Flavors and Types of WiMAX There are two flavors of services that can be provided by WiMAX based on the frequency range adopted which are defined in the ranges 10 to 66 GHz and 2 to 11 GHz for Line-of-Sight (LOS) and Non-Light-of Sight (NLOS) services respectively. These further define two IEEE standards (802.16 and 802.16a) which operate in the frequencies specified. The LOS access services as the name suggest means the receiver�s antennae show point directly to the base stations tower before a signal can be received. The use of higher frequencies for this services means high bandwidth since inferences is less. The LOS transmission provides stronger and more stable connection allowing data to be transmitted with little errors. A bigger range is also achieved when strong LOS antennae are used to covering a radius in the neighborhood of 50 km. The LOS access is associated with IEEE 802.16 standards with the characteristics and features highlighted above. Line-Of-Sight can be a major problem during installation of wireless LAN more especially where there are high rising buildings and hilly areas in between a base station and access point (receiver). A considerable among of time and money are usually spent in by-passing these elements. The IEEE 802.16a extension standard addresses this problem by providing NLOS access in the 2 to 11 GHz frequency range. This has brought a huge success to WiMAX implementation. The range of coverage of the NLOS access by this standard will be limited to a radius of 65 sq km. There are two types of WiMAX; fixed WiMAX and portable/mobile WiMAX. They are both addressed by the (IEEE 802.6-2004) and (IEEE 802.16-2004-REV E) usage models for fixed and mobile respectively. The mobility option is of interest to many players in the mobile market. New potential operators see the 802.16e as a possible technology that could be

49
deployed as an alternative to 3G networks. The IEEE 802.16e will offer mobility and portability to applications such as PDAs and notebooks and scheduled to operate in both licensed and unlicensed frequencies. The IEEE 802.6 is expected to offer services similar to that of fixed wire line service (Tan, 2006)
VSAT Technology67,68 A Very Small Aperture Terminal (VSAT) is a device, known as an earth station that is used to receive satellite transmissions. VSAT is used as the main Internet backbone in most education and research institutions in Ghana.
VSAT consist of two main parts � Indoor Unit (IDU) and an outdoor unit (ODU). The ODU connects to the IDU by a cable. The main components of the IDU are demodulators and also the access schemes under which the VSAT operates. The IDU serves as the interface between the end-user equipment such as routers, computers, local area networks and telephone system. Other value added features such as security and network management function can be embedded in the IDU.
Figure 35 : A VSAT Antenna
The ODU consists of the antennae, low noise amplifiers (LNA) and the transmitter. The size of antennae varies from 1.8 to 3.8 meters and could be mounted on a roof or wall, or is placed on the ground. VSAT operates in various frequency bands like C-Band, Extended C-Band and Ku-Band. Ku-Band is the popular frequency band in use internationally and supports smaller antennas. The advantages of VSAT range from flexibility in deployment, reliability, security and terrestrial-free network
67 http://www.gilat.com/ (Cited on 3rdNovember 2006) 68 Khan, M.A. (2003) VSAT- A brief history of space communication http://www.satcoms.org.uk/articles/

50
Chapter 4: Network Design and Simulation of NREN Backbone Overview There are three main sections in this chapter and is structured as follows: section 1 introduces three main network topologies in Ghana and will constitute the basis for the network design. Traffic models and estimation procedures will form section 2. There is further analysis of results in this section on traffic growth rates in Ghana using data obtained from different sources. Section 3 presents WDM Guru Software dimension design principles. Analysis of results under different network design alternatives and availability under different failure conditions are treated. Conclusions to the chapter will show various network scenarios that would be suitable for Research and Education Network in Ghana. 4.1 Network Topologies Two network topologies are presented in this section. They are the VRA-Integrated fiber optics and the new National backbones. A map showing major cities and towns as well as the administrative regions in Ghana is introduced to the reader. 4.1.1 Major Cities and Towns in Ghana
Figure 36: Ghana Map showing major cities and towns69 The figure above shows the major towns and cities in Ghana. The highly populated areas are the Accra-Kumasi-Takoradi triangle where over 70% of the inhabitants are living. Major 69 http://www.citypopulation.de/Ghana.html (Cited on 19th December2006)
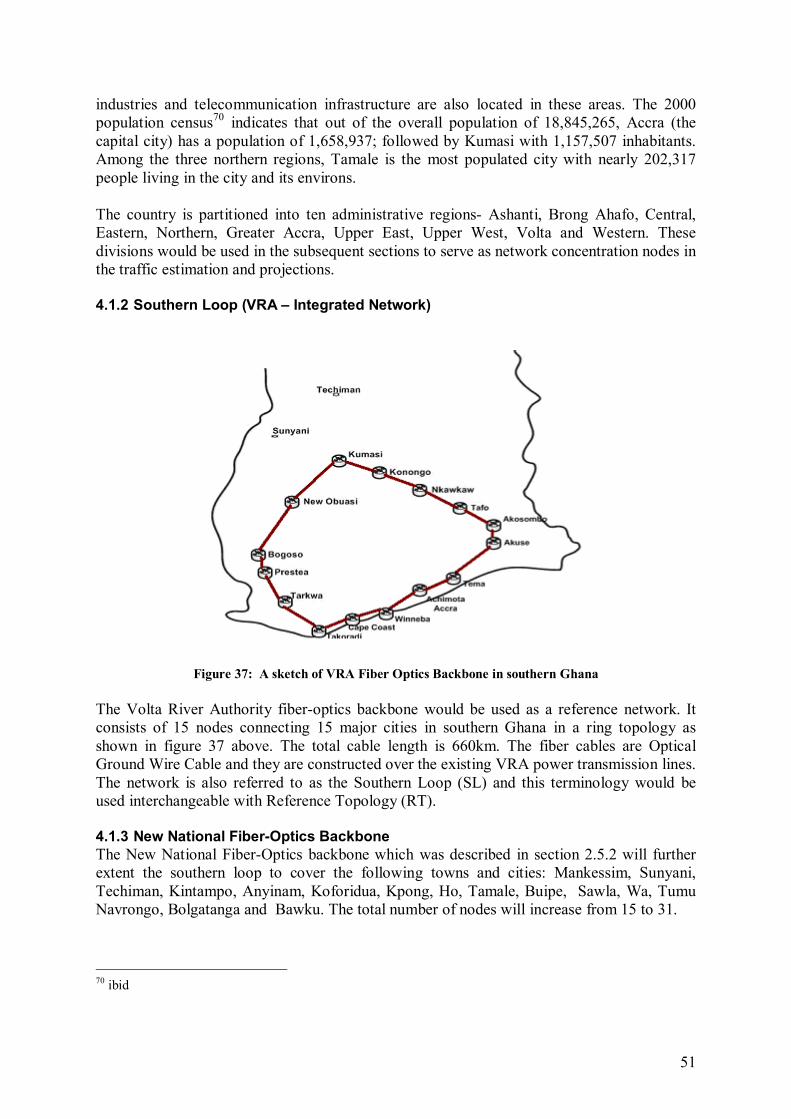
51
industries and telecommunication infrastructure are also located in these areas. The 2000 population census70 indicates that out of the overall population of 18,845,265, Accra (the capital city) has a population of 1,658,937; followed by Kumasi with 1,157,507 inhabitants. Among the three northern regions, Tamale is the most populated city with nearly 202,317 people living in the city and its environs. The country is partitioned into ten administrative regions- Ashanti, Brong Ahafo, Central, Eastern, Northern, Greater Accra, Upper East, Upper West, Volta and Western. These divisions would be used in the subsequent sections to serve as network concentration nodes in the traffic estimation and projections. 4.1.2 Southern Loop (VRA � Integrated Network)
Figure 37: A sketch of VRA Fiber Optics Backbone in southern Ghana The Volta River Authority fiber-optics backbone would be used as a reference network. It consists of 15 nodes connecting 15 major cities in southern Ghana in a ring topology as shown in figure 37 above. The total cable length is 660km. The fiber cables are Optical Ground Wire Cable and they are constructed over the existing VRA power transmission lines. The network is also referred to as the Southern Loop (SL) and this terminology would be used interchangeable with Reference Topology (RT). 4.1.3 New National Fiber-Optics Backbone The New National Fiber-Optics backbone which was described in section 2.5.2 will further extent the southern loop to cover the following towns and cities: Mankessim, Sunyani, Techiman, Kintampo, Anyinam, Koforidua, Kpong, Ho, Tamale, Buipe, Sawla, Wa, Tumu Navrongo, Bolgatanga and Bawku. The total number of nodes will increase from 15 to 31. 70 ibid

52
Figure 38 shows the new national backbone. The new nodes are in green lines; they will constitute the northern loop. The two loops will be integrated to form the National backbone and interconnected at Kumasi.
Figure 38: New National Fiber-Optics Backbone 4.1.4 Proposed NREN Nodes The NREN nodes would be located in each of the ten regions. The University in these regions will be designated as the central node serving all the educational and research institutions in a particular region. In regions where there are no university; polytechnics will act as nodes. The details are shown in table 6 with corresponding location in figure 38. Table 6: Location of NREN Nodes in each region Region City Node Location Ashanti Kumasi Kwame Nkrumah University of Science
and Technology Brong Ahafo Sunyani Sunyani Polytechnic Central Cape Coast University of Cape Coast Eastern Koforidua Koforidua Polytechnic Gt. Accra Accra University of Ghana Northern Tamale University for Development Studies Upper East Bolgatanga Bolgatanga Polytechnic Upper West Wa Wa Polytechnic Volta Ho Ho Polytechnic Western Takoradi/Tarkwa Takoradi Polytechnic/UMat

53
4.2 Traffic Models Description The traffic model chosen for this study is based on the framework used in (Dwivedi, 2000) which have been applied in other works to determine traffic patterns using population and distance as main input parameters. It has been used in the following works71,72. The model partitions the traffic into three application areas (voice, transaction data and internet data) to determine the traffic demand and growth rate of each application. According to (Dwivedi, 2000), the total traffic between city i and city j can be determined as a function of a constant K, the population P, the number of non-production business employees E, the number of Internet host H of the city region and the distance D between the cities. The component of the each of the segregated traffic can be expressed as follow: Trafficvoice = Kv * Pi * Pj/Dij ��.. ���.. (a)
Traffictransaction = KT * Ei * Ej/√Dij �����..(b) TrafficIP = KI * Hi * Hj ��������. .. (c)
The constants Kv, Kt and KI can be determined by comparing the overall traffic with measured traffic. The other parameters Pi, Pj, Dij, Ei, Ej, Hi and Hj can be obtained from published statistical data. Dij can also be estimated using the Haversine formula (Maesschalck, 2003), where Dij is the airline distance between two node pairs. The above expressions (a), (b) and (c) show that Internet traffic is independent of distance between the cities, transaction data depends on white collar jobs, whiles voice traffic is assumed to be generated by all the population in a region. It should also be mentioned that this model does not consider communication between individuals assigned to the same node and all demands are scaled such that the total amount of traffic for all nodes is equal to a given total traffic volume73. The traffic model is also based on earlier works by Sinclair74 Population-Distance (PD) and Population-Factor-Distance (PFD) models which states that the traffic (Tst) in Gbps between two nodes s and t can be expressed as either PD traffic model Tst = K * Ps * Ps/Dst or PFD traffic model Tst = K * Ps Fs * Ps Ft /Dst Where P is the population in millions, D distance between the two nodes, F penetration factor and K=5.25 (chosen such that the overall traffic level obtained matches that estimated for long term demand. PFD traffic model is an improved version of the PD model. 4.2.1 Computing constants Kv, Kt and Ki Although Dwivedi and Wagner did not mention how the constants Kv, Kt and Ki should be computed, what was developed in (Maesschalck, 2003) would be applied in this report. It
71 Maesschalck, et al, Pan-European Optical Transport Networks: An availability-based Comparison, Photonic Network Communications Volume 5, Number 3 / May, 2003, pp 203-225 72 A. Betker et al, �Reference Transport Network Scenarios.� MultiTeraNet Report, July 2003 73 Joachim Scharf, et al, Traffic Demand Modeling for Dynamic Layer 1 VPN Services, ITG-Factagung Photonic Networks, April 27-28 74 Sinclair, M., Eletronics Letters, sep. 1, 1994, Vol 30, No. 18, pp. 1468-1470

54
states that the amount of traffic for the three types (voice, transaction and internet data) could be estimated for a reference year using the formula: For example; voice data Kv = Total voice traffic volume /∑i,j, i,≠j Pi * Pj/Dij. ��� (d) The parameters are defined as above. The same procedure can be used to obtain constants Kt and Ki based on expression (b) and (c) above.
4.2.2 Traffic Growth Growth rates are very important for projection of future traffic demands in a network. In this model growth rates for each component of the segregated traffic can be determined based on published annual growth for population, transaction staff and internet users. 4.3 Traffic Estimation for Ghana To estimate traffic demand and growth for Ghana, the year 2005 was used as a reference year. Published data on Ghana were obtained from Ghana Education Service, National Council for Tertiary Education, Universities in Ghana, National Communication Authority, International Telecommunication Union (ITU) and other sources like the World Bank and International Monetary Fund (IMF) for the computation of various values needed for the traffic matrix. The steps and computational methods applied are outlined and shown in tables below: 4.3.1 Traffic Volumes Table 7 shows the design principles that were applied to obtain the traffic volume of each of the traffic classifications (voice, transaction data and internet traffic) which combined to give the total volume of traffic for the year 2005. Table 7: Traffic estimation for Ghana
Voice Traffic Transaction Data Traffic
Internet Traffic
Number of users per 2Mbps line
20 20 20
Usage (average per user per day (Dwivedi, 2000)
14 min 5 min 25min
Time frame of usage (per day )
12hours 9 hour 12 hours
Total number of users 22.11 (million)75 2,655 (million) approx. of 25% of labor force76
401,300 (17%) of population
The number of users per 2Mbps line was chosen to be 20 for each of voice, transaction and internet traffic respectively. The unit of measurement was based on Coffman & Odlyzko77 estimation for amount bandwidth used by a voice on a phone network. They estimated a directional voice call to take up to approximately 1Mb per minute. This was applied to the data obtained on Ghana, where the tele-density of 10% was recorded in 2005 to obtain the estimated value (20 users per 2mbits) as above.
75 ITU Basic Indicators 2005 76 https://www.cia.gov/cia/publications/factbook/geos/gh.html (cited on 12th December 2006) 77 http://www.firstmonday.org/issues/issue3_10/coffman/#author (cited on 12th December 2006)
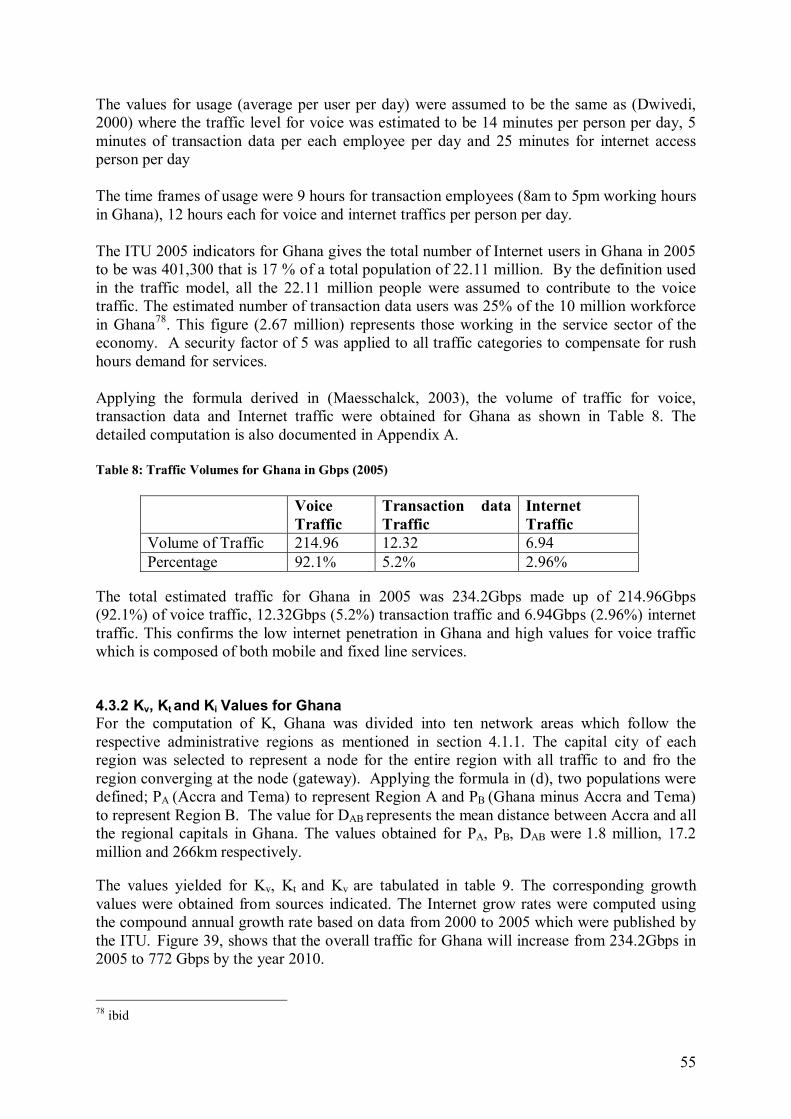
55
The values for usage (average per user per day) were assumed to be the same as (Dwivedi, 2000) where the traffic level for voice was estimated to be 14 minutes per person per day, 5 minutes of transaction data per each employee per day and 25 minutes for internet access person per day The time frames of usage were 9 hours for transaction employees (8am to 5pm working hours in Ghana), 12 hours each for voice and internet traffics per person per day. The ITU 2005 indicators for Ghana gives the total number of Internet users in Ghana in 2005 to be was 401,300 that is 17 % of a total population of 22.11 million. By the definition used in the traffic model, all the 22.11 million people were assumed to contribute to the voice traffic. The estimated number of transaction data users was 25% of the 10 million workforce in Ghana78. This figure (2.67 million) represents those working in the service sector of the economy. A security factor of 5 was applied to all traffic categories to compensate for rush hours demand for services. Applying the formula derived in (Maesschalck, 2003), the volume of traffic for voice, transaction data and Internet traffic were obtained for Ghana as shown in Table 8. The detailed computation is also documented in Appendix A. Table 8: Traffic Volumes for Ghana in Gbps (2005)
Voice Traffic
Transaction data Traffic
Internet Traffic
Volume of Traffic 214.96 12.32 6.94 Percentage 92.1% 5.2% 2.96%
The total estimated traffic for Ghana in 2005 was 234.2Gbps made up of 214.96Gbps (92.1%) of voice traffic, 12.32Gbps (5.2%) transaction traffic and 6.94Gbps (2.96%) internet traffic. This confirms the low internet penetration in Ghana and high values for voice traffic which is composed of both mobile and fixed line services. 4.3.2 Kv, Kt and Ki Values for Ghana For the computation of K, Ghana was divided into ten network areas which follow the respective administrative regions as mentioned in section 4.1.1. The capital city of each region was selected to represent a node for the entire region with all traffic to and fro the region converging at the node (gateway). Applying the formula in (d), two populations were defined; PA (Accra and Tema) to represent Region A and PB (Ghana minus Accra and Tema) to represent Region B. The value for DAB represents the mean distance between Accra and all the regional capitals in Ghana. The values obtained for PA, PB, DAB were 1.8 million, 17.2 million and 266km respectively. The values yielded for Kv, Kt and Kv are tabulated in table 9. The corresponding growth values were obtained from sources indicated. The Internet grow rates were computed using the compound annual growth rate based on data from 2000 to 2005 which were published by the ITU. Figure 39, shows that the overall traffic for Ghana will increase from 234.2Gbps in 2005 to 772 Gbps by the year 2010. 78 ibid

56
Table 9: K-Values and Traffic growth estimation
Voice Traffic KV.Pi.Pj/Dij
Transaction data Traffic KT.Ei.Ej/√Dij
Internet Traffic KI.Hi.Hj
K Values Kv=1.84792E-09
KT=2.24287E-13
KI=1.24827E-10
Growth Factors
P @ 2.2/%/yr79 KV @ 10%/yr
E @ 2.5/%/yr KT @ 2.5%/yr
H @ 67.5/%/yr KI @ 54.1%/yr
Total Growth 12.2%/yr 5%/yr 121.6%/yr
Figure 39: Total volume of different Traffic Growth
In figure 40, the percentage growth each value (voice, transaction and Internet data) represents is shown. The voice traffic will drop from 92% in 2005 to 50% in 2010. The growth in transaction data is not significant but will however drop from 5% in 2005 to 2% by 2010. The internet traffic presents interesting results in that, with a low 3% contribution in 2005 there will be a continuous growth until it reaches 45% of the total traffic volume for Ghana by 2010.
Figure 40: Percentage growth of traffic 79 Ghana at a glance -IFC 2006

57
4.4 Traffic demand and growth in Educational Institutions In order to estimate traffic demand and growth in educational institutions in Ghana, data were obtained from the Ghana Education Service, National Council for Tertiary education (polytechnics and universities) and universities. These data was classified for secondary schools, polytechnics and universities. There was further partitioning of the traffic into the voice, transaction and internet users as previously applied. In all cases the total number of people in each institution was assumed to contribute to the voice traffic. For transaction, teachers in secondary schools, polytechnic staff and non-teaching staff in the universities were considered. The internet traffic was also assumed to be generated by all students in secondary schools; student population in polytechnics, the universities contributions to this traffic was composed of full-time academic staff and student population on each campus. Table 10: K-Values and Traffic growth in educational institutions Voice Traffic
KV.Pi.Pj/Dij Transaction data Traffic KT.Ei.Ej/√Dij
Internet Traffic KI.Hi.Hj
K Values Volume of Data Percentage
Kv=4.04118E-08 4.54Gbps 36.5%
KT=1.96994E-08 0.14Gbps 1.1%
KI=2.59093E-10
7.74Gbps 62.3%
Growth Factors P @ 5%/yr KV @ 20%/yr
E @ 10%/yr KT @ 20%/yr
H @ 20/%/yr KI @ 40%/yr
Total Growth 25%/yr 30%/yr 60%/yr The values obtained for educational institutions using 2005/2006 academic year as reference are shown in table 10. The number of users for the reference year in all institutions was estimated as follows; voice (466,162), internet (447,529) and transaction traffic (30,326). Applying the same procedure as in section 4.3.2, the total volume of traffic generated was 12.42Gbps which was made up of voice 4.54Gbps (36.5%), transaction data 0.14Gbps (1.1%) and Internet data 7.74Gbps (62.3%). Using total growth rates of 25% (voice), 30% (transaction data) and 60% (Internet data); the total traffic is expected to grow from 12.24Gbps in 2005 to 69.79Gbps by 2010.
Figure 41: Forecast % each component contributes
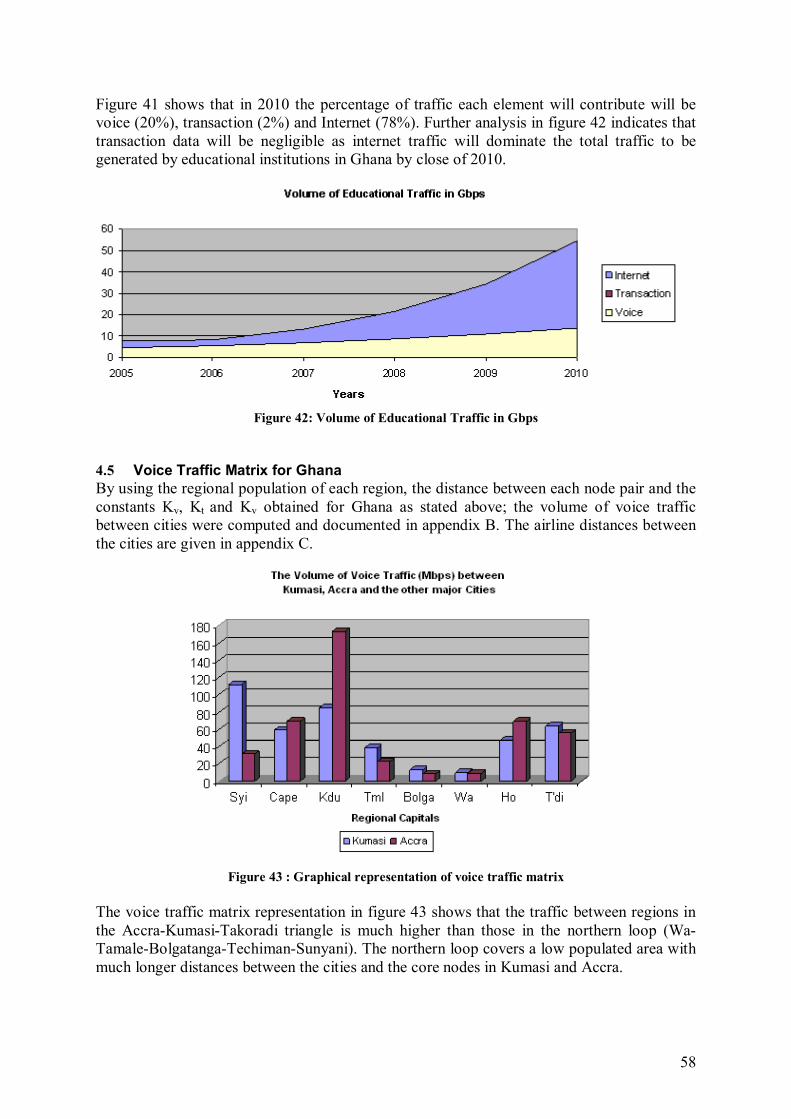
58
Figure 41 shows that in 2010 the percentage of traffic each element will contribute will be voice (20%), transaction (2%) and Internet (78%). Further analysis in figure 42 indicates that transaction data will be negligible as internet traffic will dominate the total traffic to be generated by educational institutions in Ghana by close of 2010.
Figure 42: Volume of Educational Traffic in Gbps
4.5 Voice Traffic Matrix for Ghana By using the regional population of each region, the distance between each node pair and the constants Kv, Kt and Kv obtained for Ghana as stated above; the volume of voice traffic between cities were computed and documented in appendix B. The airline distances between the cities are given in appendix C.
Figure 43 : Graphical representation of voice traffic matrix The voice traffic matrix representation in figure 43 shows that the traffic between regions in the Accra-Kumasi-Takoradi triangle is much higher than those in the northern loop (Wa-Tamale-Bolgatanga-Techiman-Sunyani). The northern loop covers a low populated area with much longer distances between the cities and the core nodes in Kumasi and Accra.

59
Sunyani and Koforidua values are exceptional high between Kumasi and Accra respectively. For example, Brong Ahafo that Sunyani represents has a population of 1.8 million whiles Ashanti region (Kumasi) population is 3.6 million. The distance between the two cities is 107 kilometers. In the same way, Accra is only 65 kilometer from Koforidua and the respective populations are Eastern region (Koforidua) - 2.1 million, Gt. Accra (Accra) - 2.9 million. The above results confirm what the traffic model states as - the traffic between two cities/regions depends on the population (voice) of the cities and there is a strong dependence on intercity/ region distance in case of voice traffic80.
4.6 Traffic Matrix for Educational Institutions in Ghana The traffic matrix for the educational institutions was derived using 2005/2006 academic year as reference year. The overall traffic matrix shown in table 11 is the sum of the different traffic demand for voice, transaction data and internet between each node pair. The computational procedure used in Appendix A applies. The traffic demand for all the three regions terminating at Wa, Bolgatanga and Tamale are represented by Tamale only. This is based on the low traffic volumes obtained for both Wa and Bolgatanga. Table 11: Combined Volume of Traffic (Voice, Transaction & Internet)
Between Educational Nodes
Nodes Kumasi Sunyani Cape Coast Koforidua Accra Tamale
Ho
Kumasi
Sunyani 2.13
Cape Coast 3.58 0.95
Koforidua 2.97 0.77 2.17
Accra 3.39 0.95 3.24 3.9
Tamale 2.61 0.86 1.61 1.4 1.74
Ho 0.51 0.14 0.34 0.45 0.5 0.28
Takoradi 2.06 0.56 3.04 1.12 1.59 0.96 0.19
The values obtained in table 11 had to be rounded up to integer numbers to conform to the static network dimensioning requirements (Maesschalck, 2003). The result is also shown in table 12 and would be used as the basis for the WDM Guru dimensioning, simulation and routing. A channel bit rate of STM-1 would be the minimum traffic pattern between each node. This will represent a basic unit of 1 in the table (matrix). A multiple values of STM-1 would apply to determine the specific demand between nodes. For example a value of 2 in the traffic matrix means a traffic demand of (2* STM-1).
80 Hülsermann, R. , A Set of Typical Transport Network Scenarios for Network Modelling. In 5th ITG Workshop on Photonic Networks, 2004.

60
Table 12: Revised Traffic matrix (integer values)
Nodes Kumasi Sunyani Cape Coast Koforidua Accra Tamale
Ho
Kumasi
Sunyani 3
Cape Coast 4 1
Koforidua 3 1 3
Accra 4 1 4 4
Tamale 3 1 4 4 ´2
Ho 1 1 4 1 2 1
Takoradi 3 1 4 2 2 1 1
4.7 WDM Guru Software WDM Guru is a program for dimensioning WDM networks and estimating network cost and needed equipment. Given a network topology, traffic demands and equipment costs, the program can perform routing, dimensioning and grooming. The Routing option uses only existing infrastructure to accommodate as much traffic as possible in the network at both the Digital Client (DCL) and Optical Channel (OCH) layers. This means some traffic is discarded when there is insufficient capacity to support them. Dimensioning on the other hand defines additional resources to accommodate all traffic at the OCH layer. It also takes into consideration certain parameters like minimum cost and shortest path to achieve ultimate solution. Grooming is the dimensioning of the DCL layer. Grooming results in the mapping of DCL traffic load into an OCH traffic load. The �Bill-of-material� in WDM Guru provides an overview of the relevant cost parameters, the amount of node equipment, the amount of line equipment and the total network cost81 82 83. 4.7.1 Layers in WDM Guru84 There are four different layers use by WDM Guru to model a network as shown in figure 44 below. These are Digital Client (DCL), Optical Channel (OCH), Optical Multiplex Section (OMS) and The Optical Transmission (OTS) layers. The DCL is referred to as the logical topology and it represents the represents the SONET/SDH layer. The OTS layer represents the physical topology, which consists of buildings interconnected by cables. OCH layer represents optical line systems and cross-connects. The OMS layer represents how fiber pairs are used on different cables of the OTS layer, and which WDM line system type is used on each fiber.
81 J. Buron, S. Ruepp A. V. Manolova,, �Teaching Cost-effective and Resilient Network Design with OPNET WDM Guru�, in Proc. of OPNETWORK 2006, Session 1020, Washington DC, USA, August 2006. 82 Liesbeth Peters, et al, Dimensioning of an European backbone network in OPNET WDM Guru, OPNETwork 2005, Washington (2005) 83 WDM Guru Tutorial 84 WDM Guru Manual

61
Figure 44: WDM Layers 4.7.2 Network properties The network properties were set as follow: Opaque mode which is the default WDM Guru setting in the OCH Layer Mode. This means that the OXC is surrounded by long-reach transponders at the trunk ports interconnected to the WDM line systems and short reach transponders at its tributary ports. Other settings were LH 40-WDM as Default for OCH and DCL Link for the link design; this allows 1 fiber pair to support 40 wavelengths. This was however either reduced or increased depending on the optimization options chosen during dimensioning and grooming sessions. The bit rate at the OCH level was set to STM-16 whereas the DCL layer bit rate was also STM-1 before grooming. 4.7.3 Availability Settings The availability analysis feature was used to determine the service availability of routed traffic in the network. This feature is dependant on the failure rates of the network elements and protection schemes adopted. This is an important scale that is used to determine Service Level Agreement (SLA) between network operators and clients. The following settings were made in all the networking scenarios: The cable cut per year value was set to 300 km and the Mean Time To Repair (MTTR) a cable cut to 24 hours. The Line System Availability was also given a value of 0.9900. The MTBF/MTTR ratio model was applied to Node Availability with the following Mean Time Between Failures (MTBF) (100.000 hours) and MTTR (6 hours). However the DXC was given a value of 1. These settings are used to generate both the Expected Loss of Traffic (ELT) and Average Expected Loss of Traffic (AELT) per year. Results are expressed in either in hour/year or Gb/Year. The availability of the traffic matrix is also given. 4.8 Network Topology on VRA Backbone Using WDM Guru Program, dimensioning and grooming analysis were done on proposed GARNET backbone for educational and research institutions. Topology A was built on the existing VRA fiber optic backbone with five nodes located in Kumasi (KNUST Node), Takoradi (T-Poly Node), Cape Coast (UCC-Node), Accra (UG-Legon Node) and Koforidua-

62
Tafo (Koforidua Poly Node). The network at the OCH layer is depicted in figure 45 with the corresponding wavelength utilization
Figure 45: Educational Backbone on Existing VRA Network 4.8.1 Network Cost and availability on VRA Backbone This section presents the results on the dimensioning and grooming of GARNET on VRA backbone. It has been subdivided into network cost, availability, link utilization and failure analysis. Some of the summarized results are tabulated in Table 13. Table 13: Summary results for GARNET on VRA backbone
Expected Loss of Traffic (ELT)
Design Network Cost
Average Availability
Effects of grooming (Overall Improvement) Hours per year Average
ELT per year
OCH-Unprotected 56,265 0.9557 12,801 387 OCH- 1+1 Protected 67,380 0,9954 1,320 40 Grooming Unprotected 101,091 0.9585 1,454 364 Grooming 1+1 protection 102,621 0.9956
42%
156 39
Figure 46: Network Cost and AELT

63
The total network cost was slightly higher in the 1+1 protection than the unprotected schemes. This is due to additional resources that are required to create a backup path to carry traffic when a failure occurs in the network. The total network cost also increases as we introduce grooming into the network; though the overall cost improvement due to grooming effects was recorded as 42% using a multiple factor of 16 (STM-16). For example, the OCH Unprotected cost increased from 56,265 to 101,091 for the grooming unprotected scheme. This was due to the electrical cost which is included in the cost to support client services at the DCL layer. The break down in the Node cost for the unprotected grooming shows that the electrical cost was 50.106 whereas the optical cost was also 50.320. The link cost for the fiber and channel was only 665. In the OCH unprotected case, the link cost was 3,666 made up of 775 and 2,880 for the fiber and channel cost respectively. The node cost was only for the optical cost (52,610) since there were no cost values for the electrical. The same reason can be assigned to the cost difference in the OCH- 1+1 protected and grooming 1+1 protection.
Figure 47: Average Availability of Entire Traffic matrix The average expected loss of traffic was much lower in the 1+1 protection schemes than the unprotected schemes at both OCH and grooming scenarios. This also resulted in higher services availability in the protected schemes (99%) than the unprotected scheme as shown in figure 47 above. 4.8.2 Link Utilization The link utilization for the groomed traffic at both the DCL and OCH layer are presented as follows: DCL Layer: Link utilization for following links KNUST-Kumasi to UCC-Cape Coast, UCC-Cape Coast to UG-Legon and UCC-Cape Coast to Koforidua Poly were between 75 and 90 %. In each case out of 16 STM-1 units available between 12 and 14 were used. The link between T-Poly-Takoradi and UCC-Cape Coast was however below 75% utilization making use of 11 STM-1 units. The same figures were obtained for the unprotected and protected cases. OCH Layer: For the unprotected grooming, link utilization between 90 and 100 % were recorded between T-Poly Takoradi to KNUST-Kumasi and UG-Legon to Koforidua Poly links. One wavelength was used in each scenario. The T-Poly Takoradi to UCC-Cape Coast, UCC-Cape Coast to UG-Legon links used two wavelengths out of a total of 8 that were assigned. The link utilizations were therefore below 75%.

64
The groomed 1+1 protection had 50% utilization on all the links since four wavelengths each was used out of the total number of 8 wavelengths available. 4.8.3 Failure analysis (unprotected and protected grooming) The effects of failures due to single node (OXC) and cable cuts were analyzed for both the groomed unprotected and protected schemes. The findings were as follows: Unprotected Grooming- It was observed that all connections which lost under the unprotected scenario could not be recovered at both the OCH and DCL layers. It was further identified that OXC failure at Cape Coast node affected all traffic, resulting in 33 lost connections at the DCL layer whiles all the 4 OCH connections were lost as well. The effect of cable cut between UCC-Cape Coast and UG-Legon resulted in 22 DCL and 2 OCH connection lost. None were recovered; and this was the highest in all cases. The cable cut between KNUST-Kumasi and Koforidua Poly affected no traffic at both layers. Protected Grooming - all cable failures were recovered and they occurred at the OCH layer only. This confirms the notion that, in 1+1 protection scheme all connections affected by a single link failure can be recovered85. Node (OXC) failures resulted in lost connections between 11 and 14 at the DCL layer at KNUST-Kumasi, Koforidua Poly, UG-Legon and T-Poly Takoradi nodes. These were not recovered. The OXC failure at Cape Coast Node caused all the 4 OCH and 33 DCL connections to be lost and none were recovered. This means the node (OXC) should be well protected as all DCL connections pass through the node. The inability of the 1+1 protection scheme to recover from lost connections is due to the fact that, all traffic terminating at a node are lost when the node fails in respective of protection scheme adopted. 4.9 Expanded GARNET Topology The expanded network topology on OCH layer is shown in figure 48. It consists of all the nodes in the above GARNET on VRA backbone and seven additional nodes located in Wa Polytechnic, Bolgatanga Polytechnic, Sunyani Polytechnic, UDS Tamale and Ho Polytechnic. The Techiman and Akosombo nodes serve as transit nodes to provide interconnection between various nodes. Each of the links is equipped with a pair of fiber and electrical-optical cross connects (OXC) for this analysis. Some of the summarized results of dimensioning and grooming on the network are also shown in Table 14 below. The interpretation and explanation of results also follows in the sections below and comparisons would be made to the VRA backbone when need arises.
85 WDM Guru Tutorials

65
.
Figure 48: Educational Backbone on New National Network 4.9.1 Interpretation of Results The interpretation of results would be based on the total network cost, availability, and expected loss of traffic and effects of grooming. The four protection schemes OCH-unprotected, OCH 1+1 protection, grooming Unprotected and grooming 1+1 protection will form the basis of the comparison. Table 14: Summary results - GARNET on New National Backbone
Expected Loss of Traffic (ELT)
Design Network Cost
Average Availability
Effects of grooming (Overall Improvement) Hours per
year Average ELT per year
OCH-Unprotected 150,185 0.9187 47,037 712 OCH- 1+1 Protected 155,160 - - - Grooming Unprotected 248,735 0.9272 24,220 637 Grooming 1+1 protection 263,451 0.9868
47%
4398 116
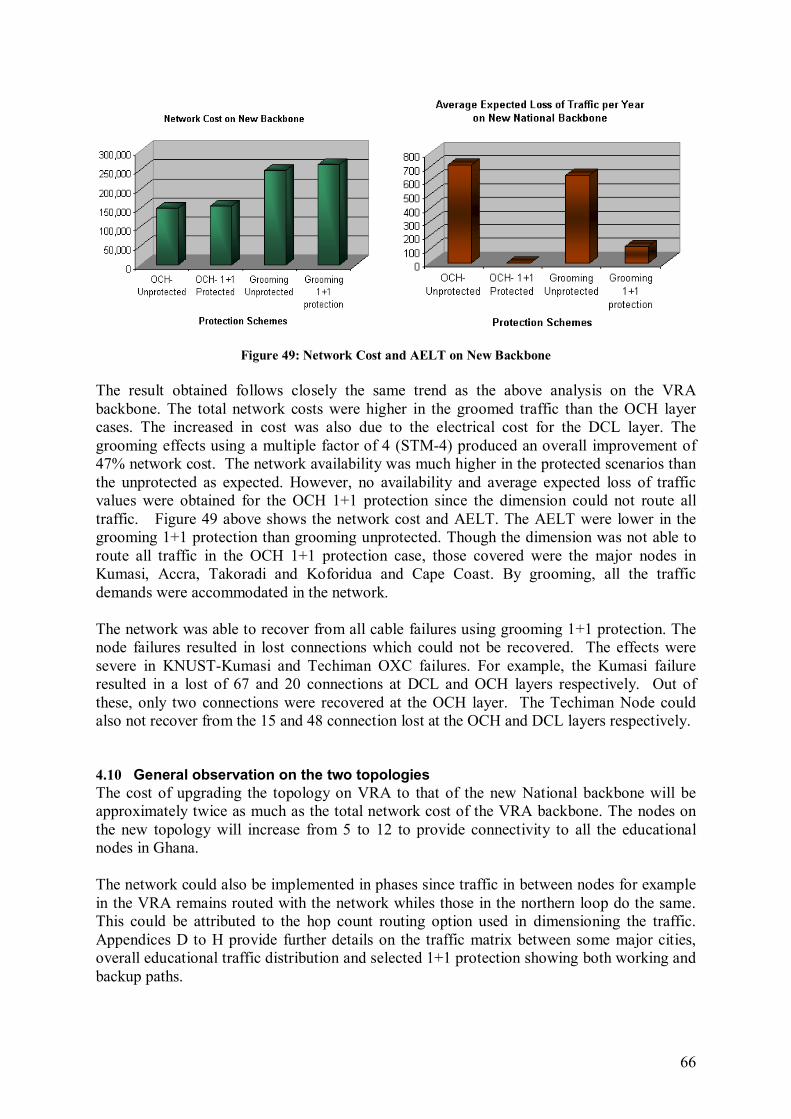
66
Figure 49: Network Cost and AELT on New Backbone The result obtained follows closely the same trend as the above analysis on the VRA backbone. The total network costs were higher in the groomed traffic than the OCH layer cases. The increased in cost was also due to the electrical cost for the DCL layer. The grooming effects using a multiple factor of 4 (STM-4) produced an overall improvement of 47% network cost. The network availability was much higher in the protected scenarios than the unprotected as expected. However, no availability and average expected loss of traffic values were obtained for the OCH 1+1 protection since the dimension could not route all traffic. Figure 49 above shows the network cost and AELT. The AELT were lower in the grooming 1+1 protection than grooming unprotected. Though the dimension was not able to route all traffic in the OCH 1+1 protection case, those covered were the major nodes in Kumasi, Accra, Takoradi and Koforidua and Cape Coast. By grooming, all the traffic demands were accommodated in the network. The network was able to recover from all cable failures using grooming 1+1 protection. The node failures resulted in lost connections which could not be recovered. The effects were severe in KNUST-Kumasi and Techiman OXC failures. For example, the Kumasi failure resulted in a lost of 67 and 20 connections at DCL and OCH layers respectively. Out of these, only two connections were recovered at the OCH layer. The Techiman Node could also not recover from the 15 and 48 connection lost at the OCH and DCL layers respectively. 4.10 General observation on the two topologies The cost of upgrading the topology on VRA to that of the new National backbone will be approximately twice as much as the total network cost of the VRA backbone. The nodes on the new topology will increase from 5 to 12 to provide connectivity to all the educational nodes in Ghana. The network could also be implemented in phases since traffic in between nodes for example in the VRA remains routed with the network whiles those in the northern loop do the same. This could be attributed to the hop count routing option used in dimensioning the traffic. Appendices D to H provide further details on the traffic matrix between some major cities, overall educational traffic distribution and selected 1+1 protection showing both working and backup paths.

67
Chapter 5 - Implementation Issues, Findings and Recommendations
Overview In order to implement NREN in Ghana based on some of the findings of this report, it would be appropriate to give a brief background to the development of research and education networks in Ghana which resulted in the formation of Ghana Research and Academic Network (GARNET). The reasons why GARNET did not materialize and the current initiative by the Universities in Ghana to reactivate GARNET together with the above form section 5.2. The evolution of network transport infrastructure in research and education networks based on SERENATE Deliverable D1486 constitutes section 5.3. The deliverable (report) presents type of ownership, organizational options and regulatory framework in the context of research networks. This framework was adopted for section 5.4. Section 5.4 looks at the organizational and management structures, ownership and cost model options that will be appropriate for GARNET based on concepts in section 5.3 and case studies from selected national research networks in Denmark and Switzerland. Network planning procedures and issues in respect to GARNET are addressed in section 5.5. The rest of the chapter is devoted to the research findings of this project and suggestions in the form of recommendations for short and long term implementation of NREN Ghana. 5.1 Brief background to the Development of NREN in Ghana The genesis of the development of research and educational network in Ghana can be traced to 1995 when the Balme Library, University of Ghana was designated as the National Node for the Fidonet email systems. Through this project which was funded by IDRC connectivity was established amongst the five public university libraries at Legon, Kumasi, Tamale, Winneba and Cape Coast and CSIR. These nodes provided access to some educational institutions in their respective regions where they store and forward mail on behalf of these institutions for an onward transmission to London through the Balme Library�s gateway at Legon on poll basis. 5.1.1 IFLA/DANIDA Project in Ghana In 1997 a pilot inter-lending and document project, referred to as IFLA/DANIDA project was established in Ghana with the aim of establishing electronic network links among five university libraries, INSTI and counterpart libraries in Denmark to facilitate the delivery of literature. It also had an objective to equip university libraries in handling interlibrary loans and document delivery. To achieve these objectives, the project provided full internet connectivity to the participating libraries using different transmission technologies like VHF, HF, dial-up and VRA fiber optic backbone87. One of the major bottlenecks for the IFLA/DANIDA library network in Ghana was the slow Internet connection provided by the local Internet Service Provider (ISP)88. Other problems were identified as implementation issues, maintenance and the use of the systems. 86 http://www.serenate.org/publications/d14-serenate.pdf -SERENATE Deliverable D.14 (cited 28th Dec.2006) 87 ILL/DD in Developing Countries Newsletter, Vol. 1, No. 1, August 1998, ISSN 1398-6147 88 Reza Tadayoni, Internet Access for University Libraries in Ghana, CTI Newsletter No. 10, October 2001.
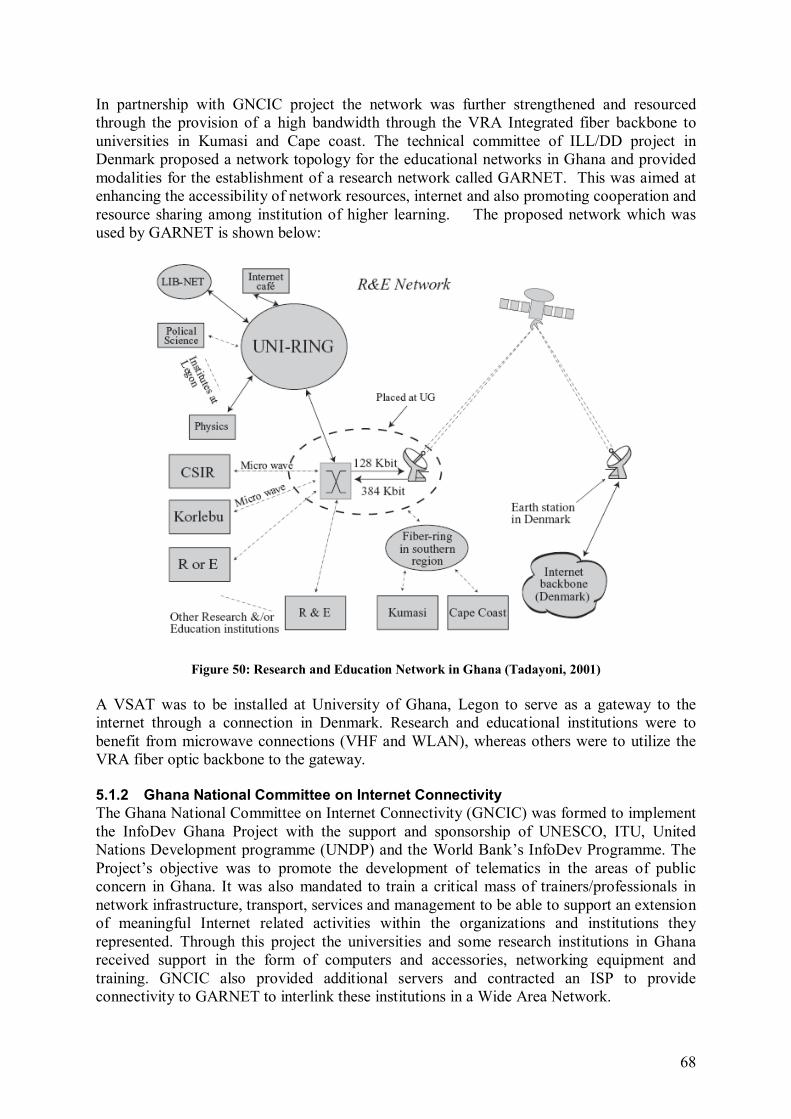
68
In partnership with GNCIC project the network was further strengthened and resourced through the provision of a high bandwidth through the VRA Integrated fiber backbone to universities in Kumasi and Cape coast. The technical committee of ILL/DD project in Denmark proposed a network topology for the educational networks in Ghana and provided modalities for the establishment of a research network called GARNET. This was aimed at enhancing the accessibility of network resources, internet and also promoting cooperation and resource sharing among institution of higher learning. The proposed network which was used by GARNET is shown below:
Figure 50: Research and Education Network in Ghana (Tadayoni, 2001) A VSAT was to be installed at University of Ghana, Legon to serve as a gateway to the internet through a connection in Denmark. Research and educational institutions were to benefit from microwave connections (VHF and WLAN), whereas others were to utilize the VRA fiber optic backbone to the gateway. 5.1.2 Ghana National Committee on Internet Connectivity The Ghana National Committee on Internet Connectivity (GNCIC) was formed to implement the InfoDev Ghana Project with the support and sponsorship of UNESCO, ITU, United Nations Development programme (UNDP) and the World Bank�s InfoDev Programme. The Project�s objective was to promote the development of telematics in the areas of public concern in Ghana. It was also mandated to train a critical mass of trainers/professionals in network infrastructure, transport, services and management to be able to support an extension of meaningful Internet related activities within the organizations and institutions they represented. Through this project the universities and some research institutions in Ghana received support in the form of computers and accessories, networking equipment and training. GNCIC also provided additional servers and contracted an ISP to provide connectivity to GARNET to interlink these institutions in a Wide Area Network.

69
5.1.3 Ghana Academic and Research Network (GARNET) GARNET stands for Ghana Academic and Research Network which was devoted to the provision of Internet access for academic and research institutions in Ghana. GARNET had membership from the public universities in Ghana and Centre for Scientific and Industrial Research (CSIR), with GNCIC and a technical team of ILL/DD project as supporting members. The formation of GARNET was short-lived because it was beset with problem of ownership and lack of cooperation at both organizational and technical levels. At the organizational level, the mode of operations and composition of management was not clearly defined. This led to the situation where other institutions felt the project had been hijacked by a particular institution and therefore felt reluctant to participate fully. The financial contributions from member institutions were not forthcoming because the modalities for payment were not well-outlined between GNCIC, the service provider and the institutions. GARNET also did not receive full backing and support from top university administrators and this might have contributed to its collapsed. Technically, there were problems with bandwidth limitation, transparency on the part of the service for not making known to the institutions the dedicated bandwidth it promised to deliver. There was also lack of technical expertise in some of the participating institutions particularly network administrators and technical support staff. The network infrastructure to make the services available to the research and communities they serve were also limited. The lack of advanced networking transmission infrastructure and technology at that time of the project implementation was also seen as a major bottleneck that contributed to the failure of the network. Notwithstanding the above problems, GARNET was a breakthrough in the development of Research and Educational Networking in Ghana and provided an opportunity for member institutions to develop their own networking infrastructure to provide services to the user. 5.1.4 Reconstituted GARNET GARNET was reconstituted in November 2006 at the end of a three-day workshop held by the Association of African Universities (AAU) in Accra on National Research and Education Networking (NREN) that would ensure the integration of ICT into the African educational system. The membership of the new GARNET was limited to the five public universities in Ghana. These are the University of Ghana, Legon; Kwame Nkrumah University of Science and Technology, Kumasi; University of Cape Coast, University of Education, Winneba; University of Development Studies, Tamale and University of Mines and Technology, Tarkwa. The idea for the reformation of the network was conceived at an earlier workshop when the chairman of the Vice-Chancellors Ghana (VCG) tasked a work team to outline the modalities for GARNET to be reconstituted. The eight-member team was drawn from the public universities and a representative of TENET (South African Research and Education Network). The work team presented a Memorandum of Understanding (MoU) to the VCG for approval. The MoU addresses issues like governance, membership, funding and technical cooperation among the participation institutions89. 89 http://www.aau.org/renu/ws/accra06/presentations/ghana.pdf (Cited 26th December 2006)

70
The reconstituted GARNET at this point is addressing the organizational aspects in terms of membership, financial contributions and funding. Further analysis of the implementation of the project would be covered in this report based on the results obtained and would be used to provide recommendations in the network techniques (topology, requirements and availability), ownership and cost models. 5.2 National Research and Education Network Transport Infrastructure (D14, 2003) The four parameters that affect NREN transport infrastructure evolution are defined in (D14, 2003) as organizational, regulatory, technical and economic. This is depicted in figure 51.
Figure 51: Parameters affecting NREN Transport Network evolution The framework that the network is managed is set by the organizational parameter and it affects the overall design. The regulatory set the pace for the type of ownership options; whiles the technical options, availability and prices of equipment are defined by the technology. The market for connectivity determines the availability and the prices for various types of connections. The framework was applied to the European Research and Educational network and four levels of network hierarchy were given as � the Pan European, the national networks, the local level and international networks. The regulatory regime in Europe was also discussed. The other important aspect of the framework was the four ownership options presented as Full ownership, Dark fiber, Direct access and Leasing of capacity. The description of each of the ownership will be treated and applied in the next section where it has been used to define a structure and model for GARNET.

71
5.3 Implementation Structures and Options for GARNET Using the above evolution network infrastructure framework the following have been applied to define those options that will be applicable to the implementation of research and educational network in Ghana as follows: 5.3.1 Organization Options Two types of organizational structures are envisaged � network hierarchy and administrative. The network hierarchy should be defined in line with (D14, 2003) but in this case three levels to comprise of institutional (campus) level, national level and international level. Figure 52 illustrates the three network levels. At the campus level, each institution would be expected to provide, maintain and take full ownership of the resources at their disposal. This will be the provision of networking equipment like switches, router, local area networks, network access to users and technical support.
National Node A
International Level
National Node CNational Node B
Campus Networks
Campus Networks
Campus Networks
Campus Networks
Campus Networks
Figure 52: Network Hierarchy
Selected institutions would be designated as national nodes at the national level (GARNET). These nodes will serve as an entry point to the national network and would be expected to provide connectivity to their campus networks and other institutions such as secondary schools, research centers and private universities and colleges. The network connections between these national nodes can be provided using the VRA Integrated fiber optic backbone, Ghana Telecom fiber-optic backbone, the new national backbone or any other transmission technology that would be suitable for the GARNET backbone. The viable link at the international level has been identified as SAT-3 terminal at Accra which is currently being operated by Ghana Telecom. This international undersea cable will open up GARNET to a number resources and connections to other NREN worldwide such as the European Research Network. VSAT will offer another option for international connectivity where the national backbones are not available. The network configurations for the VSAT connectivity could be done in such a way that the links are fed into the national backbone where possible, instead of providing direct international gateway. This will provide a suitable integration into the national network.

72
5.3.2 Management and Administrative Structure The administrative and management structures that would be needed to run GARNET are very important and care should be taken in its formation to avoid mistakes that led to the collapse of the previous GARNET. The Danish Research and Education Networks structure has been adopted90. It defines five levels of management � Top level (Ministry of Science and Technology), Management committee, Network Secretariat, Network Operation Center and Local Operation Centers; each level performs a specific task. The proposed structure for GARNET management is therefore shown in figure 53, using the above divisions. It consists of the following: a. The Ministry of Education Science and Sports - should act as an oversight body to facilitate the funding and other government related ICT policy on education. This will enable the development of GARNET to me known to the Government through the ministry. The ministry should be responsible for the acquisition of capital equipments and dark fiber for the setting up of GARNET.
Ministry of Education, Science & Sports
Top Management Team
GARNET Secretariat
Network Operation Manager
NOCPrivate Institutions
NOCResearch
Institutions
NOCPolytechnics
Ghana Education ServiceNOC
Universities
Figure 53 : Management and Administrative Structure for GARNET
b. Management Team- an independent top management team will be ideal for GARNET with membership drawn from the universities, polytechnics, research institutions, National Council for Tertiary Education (NCTE), representatives from Ministries of Education and Communication; Ghana Education Services and private universities. They will be responsible for the development of policies for the smooth running of the network. It should also act as a decision making body, receiving, and meeting to consider all reports and proposals submitted by the GARNET Secretariat. c. Network Secretariat- the day to day management of the network should be the responsibility of the network secretariat. The duties should include the preparation of meetings, processing of bills and invoicing, payments of subscription fees to service providers and contractors. Others are the preparation of operational budget and management 90 http://www.fsknet.dk/secretariat (Cited 28th December 2006).

73
of funds allocated to GARNET through contributions from members and other sources. It is proposed that the GARNET Secretariat should be located in either one of the participating institutions or at the NCTE Secretariat. d. Networking Operation Center (NoC) - the GARNET NoC should be headed by a network operations manager and supported by a team of IT support staff. The Networking Operation Center could be sited in one of the institutions with adequate networking infrastructure, networking resources and access to the national fiber-optic backbone. Its proximity to the SAT-3 terminal will also be an advantage. It should be responsible for connecting research and education institution to the GARNET backbone. Other responsibility would be network monitoring and handling of network acquisitions and contracts with service providers. The manager should report directly to the Network secretariat. It should organize training and workshop for member institutions and liaise with the respective network administrators at the local level. e. Local NoC � each institution is expected to be responsible for its local area network as well as campus-wide networks. These centers will provide support to locally connected institutions. These could either be the already established ICT Directories and computer centers in some of the research institutions or as may be defined by the respective institutions. The Ghana Education Service should have a national operation center for secondary schools and make use of the 110 science resource centers in the districts as an entry point to other schools and colleges under its jurisdiction. 5.3.3 Ownership Options Decision on ownership is very important since it depends on budget line, network infrastructure, telecommunication regulatory, availability of expertise to run the network and other external factors that the participating institutions have to deal with. The different ownership models defined in (D14, 2003) implies the following: Full ownership means research and education institutions are to invest in the construction of fiber cable plant and foot operating cost and maintenance as well as taking full ownership of transmission equipment. Dark fiber ownership means leasing or buying a dark fiber. The additional cost that comes with this option may include amplification and regeneration, some level of operating cost and maintenance; and transmission equipment at the end of each node. Direct access option involves expenses for leasing or buying of wavelengths (lambda) plus transmission cost at each node. The last but not the least options is Leasing of capacity which involves the expenses for leasing the capacity plus all other transmission costs. The Managed fibers option means buying dark fibers from network operators or carriers. The operators take additional responsibility for amplification and regeneration. In the case GARNET, the flexible telecommunication regulatory regime in Ghana following the passage of National Communication Authority and Telecommunication Acts, National ICT policy, the intended privatization of Ghana Telecom and VRA Integrated fiber optic backbone as well as the construction of the new national backbone offer a number of ownership options to the education and research networks in Ghana. Three options seems attractive for GARNET- dark fiber, managed fiber and direct access to fiber. The full ownership options will not be cost effective due to the availability of dark fiber networks owned by Ghana Telecom and VRA which can be utilized by the institutions. Again, full-ownership is the most expensive solution as it costs about 20 times for one to constructs its own link as compare to the lease of dark fiber without amplification (D14,

74
2003). The institutions will be able to acquire dark fibers on the new national backbone and the VRA through the Ministry of Communication and Ministry of Education as part of Government of Ghana policy to interconnect educational institutions to the National backbone as documented in the National Telecommunication Policy of 200591 . The last mile solution to the nearest backbone can however be fully owned by the institutions by laying their own fiber cables. The core nodes can opt for the dark fibers options whiles other nodes like secondary schools use the direct access options to allow operators or carriers to provide and maintain the transmission links and transmission equipment to the schools. A hybrid options consisting of the three options is also applicable. In Europe for example, most NREN either lease capacity or buy transmission services from telecommunication operators (D14, 2003). The Danish NREN leases fiber optic for its backbone network from a local service provider-Global Connect. The SWITCHlan backbone entirely relies on dark fiber that SWITCH owns or rents from various dark fiber providers. SWITCH is the research and educational network in Switzerland. It also provides connectivity to other international organization and research institutions located in Switzerland. Examples are European Laboratory for Particle Physics and IBM Zurich Research Laboratory92. Through the application of WDM (wavelength division multiplexing) technology SWITCH is able to provide a very high speed and stable network service to its clientele throughout Switzerland. The above cases could be used in the GARNET backbone by utilizing the existing network infrastructure owned by VRA and Ghana Telecom to provide high speed and very reliable services to its institutions. The application of WDM technology will be a great advantage for the institutions to make use of the limited number of fiber cables available on these networks to increase their bandwidth demand tremendously. 5.3.4 Cost Model The cost model for a network defines a framework for calculating the cost of equipment and infrastructure and is based on cost factors of the physical, individual transmission components and switching layer of an IP-over-optical network. The total cost of network investment is obtained by computing the cost of each network element93. The cost model also depends on the ownership option as it influences the total cost of the network. In estimating the cost for realistic network scenario in (Verbrugge, 2005 & 2006)94,95 the total expenditure of a company was split into two parts: the capital expenditure (CapEx) and operational expenditure (OpEx). The CapEx contributes to the fixed infrastructure of the company and is assumed to depreciate over time. The components of CapEx are the acquisition of buildings and land, network infrastructure and network management software. The OpEx on the other hand comprises of the cost to keep the company operational and this 91 National Ghana Telecommunication Policy, 2005 92 http://www.switch.ch/network/national.html (Cited on 28th December 2006) 93 J. Derkacz et al., �IP/OTN Cost Model and Photonic Equipment Forecast � IST Lion Project�, in Proceedings of4th Workshop onf Telecommunications Techno-Economic, Rennes (France), May 2002, pp. 126-138. 94 S. Verbrugge et al., "Methodology and input availability parameters for calculating OpEx and CapEx costs for realistic network scenarios," Journal. Optical Network. 5, 509-520 (2006). 95 S. Verbrugge et al., �Modeling operational expenditures for telecom operators,� Conference on Optical Network Design and Modeling, 2005, p. 455-466.

75
might include technical, commercial, and administrative operations. The CapEx cost can be estimated by computing the cost of each individual component and summing. The OpEx cost can also be obtained (theoretical) as a fraction of the CapEx costs (e.g. 30%) as stated in (Verbrugge, 2005). The cost model in (D14, 2003) was based on cost calculations for three major building blocks of a network; that is transmission link, the transmission equipment, and the routing and switching equipment. The Economic model developed in deliverable D1496 was used to estimates the cost of connection between two destinations (point-to-point) given a number of cost parameters. In relation to this project, the overall network cost (installation cost and routing cost) was obtained through WDM software which was used to simulate the network in chapter 4 based on input parameters on traffic demand, equipment and transmission costs. The simulation results also gave the cost of each network element needed to build the network under different network protection schemes. These give an indication of the CapEx and OpEx that would be needed to finance and operate the different network topologies used. Two implementation cost options for GARNET are envisaged based on the ownership options for the backbone and connections from the backbone to the respective nodes. The core backbone will be built on either the Ghana Telecom or the VRA-Integrated fiber optic backbone by either leasing capacity or buying data transmission services from the operators. The cost of fiber cables can therefore be deducted from the total network cost (results obtained in chapter 4) to give the CapEx for the core network. The overall cost of the backbone project can therefore be expressed as the OpEx (30% of CapEx) plus the CapEx. However, the cost of the point-to-point links between the network nodes at the various universities and the national backbone were estimated using the economic model program developed in (D14, 2003). The result is shown in Table 15. Two options are shown in the table- points from the nodes to Ghana Telecom backbone and VRA-Integrated Fiber backbone respectively. The computation is based on Nothing-In-Line point-to-point connections, which consists of optical fiber. Eight wavelengths are supported on the transmission system and each wavelength can carry a single 10GE channel or a multiple of 2.5 GE channel. Four wavelengths are activated in this calculation. The distances are measured in kilometers whereas the cost is in Euros (�). A full ownership option applies. Table 15: Point-to-Point Cost from National Backbone Node Ghana Telecom Backbone
Option I VRA-Integrated Fiber Backbone Option II
Distance (Km)
Total Investment Cost (�k)
Distance (Km)
Total Investment Cost (�k)
University of Ghana, Legon 5 282 8 432 KNUST 5 282 10 532 Univ. of Cape Coast 5 282 12 632 University of Education, Winneba 4 232 7 382
96 http://www.serenate.org/economic_model.html (Cited 27th December2006)

76
The total investment cost for each of the point-to-point connection consists of both the transmission and link cost for a fiber lifetime of 20 years. It was noticed that the transmission cost was the same for all the links and found to be �32k in each case. It means the cost of constructing the network for the given distances depend on the cost of fiber cables and accessories. The cost of investment to the Ghana Telecom seems to be attractive because of the distances from the institutions to the telephone exchanges in the regions. In terms of flexibility the VRA options may be economically viable as the institutions will have more control over the resource because of the public interest in the backbone. 5.4 Network Planning Procedures Three major blocks of network planning process were used in determining the network that would be appropriate for research and educational networks in Ghana. The three were defined in (Verbrugge, 2005) as strategic decisions, network design and post-planning evaluation phases as shown in figure 54.
Figure 54: Network design phases 97 The strategic decision phase determines the network and node architecture as well as recovery and protection strategies that would be suitable for the network. The number of network equipment such as OXCs and OADM are determined. The protection schemes may include unprotected, 1+1 protection and 1:N protection that were discussed in chapter 3. Given a set of network nodes on GARNET backbone, the simulation results in chapter 4 were able to determine the number of fiber pairs, OXCs, OADMs and other network elements needed to built the network The overall object of the design phase is to dimension the network at minimal cost and at the same time making sure that the network is able to route all traffic whiles recovery from failure situations are made possible. Using the traffic model in chapter 4, estimated traffic and corresponding traffic forecast between the nodes (on GARNET) were determined. Traffic matrix was therefore deduced from the figures obtained and fed into WDM Guru Software to dimension the network. The detailed results under different network scenarios which include network cost, network topology and protection schemes have been documented in chapter four. Different failure situations (node and link failures) were also analyzed to perform post-planning evaluations.
97 Arijs, P. et al, Design of ring and mesh based WDM transport networks, Optical Networks Magazine, July 2000 Vol.1 Issue.3, pp. 25-40.

77
5.5 Research Findings The following are some of the findings of this project (thesis):
1. It was established that there exist quite a number of networking infrastructure in most of the research and educational institutions in Ghana and can be used to create the national research network. The VRA Integrated fiber optic backbone, Ghana Telecom nationwide infrastructure and SAT-3 terminal at Accra represent a huge potential source for the backbone for GARNET. The SAT-3 terminal will serve as the GARNET�s international gateway to Internet and NREN for resource sharing and collaborations.
2. The institutions visited have also established ICT centers and directorate to provide
technical support to users. They are responsible for managing their campus-wide network and only outsource a small percentage to companies whom they have service agreement with. However, most of the institutions do not have enough core IT personnel to carry out other specific task that are needed to keep the network running. National service personnel form bulk of staff in some of the institutions. Students� assistants were also engaged to perform some of the routine jobs. It was noted that no separate budget line is devoted for ICT in almost all the universities and this I was told affects planning, maintenance and replacement of equipment.
3. The level of Internet and ICT access on university campuses were found to be very
low and it was more pronounced in the secondary schools. Facilities were located mainly in the ICT centers and the university libraries though most of the departments had their LAN installed. It is attributed to the limited number of computers for both staff and student use. The other factor was the limited internet backbones which were operating between 1Mbps and 7Mbps on individual campuses that result in slow internet connections most of the time.
4. The Internet backbones in the institutions apart from KNUST operate using only one
gateway and there were no backup path to support network failures. Network failures at times run into days before they are restored and these affect smooth network operations. There were also no direct network interconnections between the education and research institutions since each one of them use different Internet Service providers through VSAT connections. They are also not connected to the Ghana Internet Exchange (GIX) and this does not encourage resource sharing among the institutions. However, the CSIR wide area network though small in capacity creates a network between the research institutions under CSIR across the country with faculties of agriculture in four universities and Ghana Atomic Energy Commission. This is one example that can be used to share network resources within the research and educational communities.
5. ICT user fees paid by students at the universities were found to be a major source of
funding for ICT in the institutions. The fees were used to provide internet services and networking facilities to mainly students. Parts of the funds are used to purchase network equipments and other accessories.
6. Technological development in WDM that multiples the bandwidth capacity on a
single strand of fiber has brought about an increased in bandwidth on the VRA fiber

78
optic backbone as originally thought when the network was built. It will therefore serve as a potential for the development of ICT in research and educational institutions in Ghana. WiMAX was identified as one of the networking transmission technologies that can extend the range of GARNET backbone to institutions that are not very close to the national backbone. WiFi could be deployed in the access network to provide connection to buildings and areas on various campuses that are not wired. WiFi could also be extended to halls of residence and staff residential areas to increase the level of network access to both students and staff.
7. The traffic growth pattern and projection were estimated for Ghana and educational
institutions using data obtained from various sources. This was applied to the traffic model used in chapter four. The traffic model partitioned the total traffic into voice, transaction data and internet data as defined in chapter 4. The results obtained show that the overall traffic for Ghana is estimated to increase from 234.2Gbps in 2005 to 772 Gbps by the year 2010. The percentage growth each value (voice, transaction and Internet data) is expected to follow the following trend - the voice traffic will drop from 92% in 2005 to 50% in 2010: transaction data will however drop from 5% to 2% during the same period under review. The internet traffic has a low 3% contribution in 2005 but the expectation is that it will represent 45% of the total traffic volume for Ghana by 2010. With respect to the research and education networks, by the year 2010 the percentage of estimated traffic each element will contribute is forecasted to be voice (20%), transaction (2%) and Internet (78%). This shows that internet would be the dominate traffic in these institutions in the coming years as transaction data becomes negligible.
8. On the National front it was observed that, the national fiber optic backbone has been
given much attention in recent times. It has therefore received support from the Government of Ghana and the international community for its development and expansion. However, the metro access networks and the last mile solution that would be fed into the backbone are not well-developed. Even where they exist they are owned by private institutions and Internet service providers running they own networks without interconnection. The technology of choice for these access networks has most been wireless LAN resulting in interference with each others network, limited bandwidth and security is of much concern. The Ghana Telecom�s intra-city backbones which are in Kumasi and Accra were found to be addressing this problem to some extend but, theses networks are only built to interconnect its telephone exchanges in these cities.
9. One of the major problems that project faced was the collection and availability of
published statistical data on Ghana which were needed to serve as an input to the simulation and subsequent traffic estimation and forecasting. Data from the telecommunication operators where either not available in the format required or simple difficult to obtain. In the case of public institutions, it took a longer period to obtain data as one has to go through a number of bureaucratic procedures to achieve this. Data on Ghana were easier to obtain from external source like the World Bank, International Monetary Fund, United Nation and International Telecommunication Union (ITU). The National Communication Authority, Ghana Education Services and National Council for Tertiary Education however, served as important sources for telecommunication data in Ghana and statistics on students and academic staff in both the secondary schools and the tertiary institutions.

79
5.6 Recommendations The following are the recommendations based on the findings of this thesis work:
1. Member institutions of GARNET should make budgetary allocation towards the development and sustainability of the research and education networks. The NCTE could be mandated to deduct contributions from each of the institutions at source from government subventions and GETFund allocations that they receive through the NCTE.
2. Funding and contributions from participating institutions should be based on the
formula use by the Danish Research and Education Networks in addition to any other procedure that that would be appropriate under the Ghanaian situation. Under the NREN-Denmark formula, 100% of the network operations cost are paid by users and clients of the network. Contributions are based on 70% of economical number accounts98 of total budget plus 30% of traffic from international connections to instructions. Other source of income is from student contribution of 10kr per room connection to dormitories and Collegiums. The ministry however, provides funds for upgrades and leased of dark fiber thus given support for capital intensive investments99.
The Universities in Ghana are currently charging approximately US$30 per student per academic year for ICT related services. This cost sharing formula should be maintained whiles a percentage of their budgetary allocation as specified in recommendation (1) and (6) should be used to foot the remaining cost. It is further recommended that, the Government of Ghana through the Ministry of Education should provide funding for the GARNET�s core backbone network infrastructure. Other sources of funding should also be sourced mainly for the backbone network. The participating institutions in GARNET ability to pay for the operational cost through their own sources are very important for the sustainability of the project. It therefore calls for a well-defined cost-sharing mechanism to be put in place to address this issue during the planning and implementation phases of the project.
3. The university libraries should be involved in the management and implementation of
GRANET because of the significant role they played during the early development of research and education networks in Ghana. Their expertise and experiences in management and implementation of similar projects like ILL/DD and GILLDNET could also be tapped. They should also be provided with funding and equipment to enable them continue to offer various ICT services to the universities and research institutions through the provision of online databases and journals subscription as well as the training of students and staff in the use of these services. The development of online catalog and thesis projects at various stages of development in these libraries should be seen as a major component in the development of GARNET and therefore be given the maximum support.
4. Training of core network administrators and other technical support staff to man the
GARNET and campus-wide network should be given support and financial backing. 98 Formula derived to determine how much each institution has to contribute to the cost of network operation. 99 http://www.fsknet.dk/secretariat (Cited 28th December 2006)

80
5. Based on the management structures for GARNET as defined in section 5.3.2. It is recommended that the GARNET Secretariat should be hosted by the NCTE secretariat. The Network Operation Center should be sited at University of Ghana, Legon because of its proximity to the national backbone as well as its strategic location for wireless communication. It should be stressed that, it should be independent of the university�s administration. Since the office of Vice Chancellor�s of Ghana is also on the University of Ghana campus, the NOC could be administratively be part of this office.
6. There should be collaboration between GARNET, Ministry of Education, Science and
Sports, and Ministry of Communications. This partnership will boost government support for the project and facilitate the funding of the initials cost of the project for the leasing of fiber cables and other core backbone infrastructure.
7. The present memberships of GARNET should be extended to the ten Polytechnics,
research institutions, secondary schools through Ghana Education Services and private universities and colleges to make GARNET a true representation of research and educational network in Ghana. This will also boost the support and the financial backing GARNET need from the Government of Ghana.
8. There should be further collaboration with universities in the West African sub-region
and some Africa countries in general as envisaged by the Association of African Universities. The candidate countries could be Togo, Benin, Nigeria, Cameroon, Côte d�Ivoire and Senegal in West Africa. These countries are already connected to SAT-3 under sea fiber-optic cable that links the sub-region to the rest of the world for both ICT and telecommunication services. This will pave the way for these countries to join other National research networks in Europe and elsewhere. The countries stand to benefit collectively from the EU funded project similar to ALICE in Latin, EUMEDCONNECT in Mediterranean and TEIN2 in Asia Pacific regions that provide research network infrastructure within the regions towards Europe under the management of DANTE. DANTE stands for Delivery of Advanced Network Technology to Europe. It plans, build and operate pan-European research networks100.
9. The level of access to Internet and ICT was observed to be low in most of the
educational institutions. The situation was more pronounced at the secondary school level. It is recommended that steps should be taken to well-equip these institutions and more especially the 110 science resources centers in each district with the state-of-the �art ICT facilities and the provision of Internet access. This will allow most of the disadvantaged schools to patronize these centers to improve on their ICT skills. The tertiary institutions can also improve on their access base through the provision of computer laboratories and installation of wireless LAN to extend their network coverage to areas on campus and beyond which are yet to be connected to the camps-backbones.
10. The Universities and Polytechnics should develop their intranets (CampusNet) to
improve on the use of ICT on their campuses. A one-stop portal that will provide information and access to course materials, electronic mail, online database, electronic forms, calendar, online registration and admission, automated library
100 http://www.dante.net/ (Cited 28th December 2006).

81
systems is recommended. Such a network should allow students to request for transcripts, view grades, sign for or drop courses and manage their accounts. Lecturers and instructors should be able to schedule programs, post their course materials, process grades and have access to information on students.
11. The development of Metro networks should be given seriously attention by
Government of Ghana and other private institutions since their coverage in Ghana is low as mention in section 5.5. These will allow networking technologies like Fiber to the (Home, Building, Premise) and the like to be available to the private and public institutions. The research and education networks can also take advantage to connect some of their institutions via these networks. The availability of such networks will enable students who are pursuing courses at various universities through distance learning programs to benefit from some of the resources that are available to their counterparts on the campuses.
12. The report recommends that, a mesh topology should be deployed on GARNET
backbone to interconnect all the 10 nodes with additional transit nodes in Akosombo and Techiman. The project can also be implemented in phases. For example, Phase I will be the setting up of nodes on the VRA backbone to create the southern loop, that is Kumasi, Takoradi, Cape Coast, Accra and Koforidua. Phase II would be the extension of the node on the VRA backbone to the rest of the identified nodes with Kumasi serving as the interconnection node when the New National backbone is fully operational.
13. Though this project was limited in scope to the networking infrastructure, user
requirements and service provision should not be overlooked in the future implementation of NREN in Ghana. Computing facilities, software and training of both users and technical staff should be an integral part of the GARNET.
82
Conclusions National Research and Education Networks (NREN) play a key role in the development of teaching and learning in institutions of higher learning. However, its development requires a well resourced networking infrastructure and the financial backing from both the Government and the institutions it serves. In Europe, United States of America, and Japan a lot of investments had been made in this direction. The European Union (EU) provides project funding and support to member countries to research into the development of NREN. The GÉANT network is an example of such initiatives that has created a multi-gigabit pan-European data communications network, reserved specifically for research and education use as collaboration between the EU and 30 countries in Europe. There have been a number of initiatives in Ghana in recent times to develop research and education networks to interconnect the universities and other research institutions. The Association of African Universities is also working in the same direction to help its members to develop their networks with the aim of creating a regional education network in Africa. What is lacking in these initiatives is the critical analysis of the networking infrastructure that would be required to support these networks. The aim of the project (thesis) was therefore to identify and critically examine the networking infrastructure that is needed to support research and education networks in Ghana. The project provides a complete overview of the network infrastructure at both national and institution levels in Ghana. The assessment of the institutions network infrastructure indicates, there exist adequate resources that could be tapped to create national backbone as well as NREN. The Volta River Authority (VRA) Integrated fiber optic backbone, Ghana Telecom networks, the new National Fiber-optics backbone, the SAT-3 undersea cable terminal in Accra and campus-wide networks at various educational institutions are good candidates for these projects. The institutions also have core IT personnel their campuses for the management of the educational networks. The educational and research institutions over-dependence on VSAT for their Internet backbone does not push for the development of NREN. Though, it presents the best option looking at the current situation, it also tends to be very expensive with regards to the limited bandwidth each of these institutions is operating on. Resources sharing are very limited as services are provided by different Internet Service Providers (ISPs). The above networking scenarios show that there is an urgent need for these institutions to review the existing networking technologies and adopt measures that would enable them to be part of the national backbone to help in the design and implementation of NREN in the near future. Optical networking, wireless technology (WiMAX and WiFi) and VSAT form the networking transmission technologies in this report. The optical networks and more especially the use of Wavelength Division Multiplexing (WDM) are suitable solution for the core backbone networks in Ghana. The technological development in WDM that multiples the bandwidth capacity on a single strand of fiber has brought about an increased in bandwidth on the VRA fiber optic backbone than originally thought when the network was built. It will therefore serve as a potential source for the development of ICT in research and educational institutions in Ghana. WiMAX is one of the networking transmission technologies that could be used to extend the range of Ghana Academic and Research Network (GARNET) backbone to institutions that are not very close to the national backbone. WiFi installation in the access networks will provide connection to buildings and
83
areas on the university campuses that are not wired. WiFi could also be an extension of the network access to the halls of residence and staff apartments. VSAT deployment can gradually be phased out as more of the research and educational institutions are connected to the national backbone. The Dwivedi and Wagner traffic model application in this study derived estimation of traffic demand and growth rates for Ghana. Using population and distance as the main input parameters, the model partitions the traffic into three application areas (voice, transaction data and internet data) to determine the traffic patterns and total traffic volumes. Based on published data on Ghana and that of research and educational institutions obtained from different sources, a traffic matrix was derived using 2005 as a reference year to serve as an input to the network dimensioning and simulation. The traffic projections show that there will be a significant growth in traffic demand in Ghana by 2010. With respect to the research and education networks, the partitioned traffic projections are voice (20%), transaction (2%) and Internet (78%). This shows that internet would be the dominate traffic in these institutions in the coming years as transaction data becomes negligible. The network design cost and availability on VRA backbone and the New National backbone could be obtained using WDM Guru Software. The total network cost in the 1+1 protection are higher than the unprotected schemes due to additional resources require to create backup path to carry traffic when a failure occurs in the network. Though protection schemes result in high network cost; it also improves network availability. The Average Expected Loss of Traffic (AELT) is much lower in the 1+1 protection schemes than the unprotected traffic. The total network cost also increases as we introduce grooming into the network. The reason that can be assigned to this is the high electrical costs (Digital Cross Connects) that are required to support clients� demands at the Digital Client Layer (DCL) layer. However, grooming allows all traffic to be accommodated on the New National backbone using 1+1 protection. Not all traffic could be routed when dimensioning was done without grooming. The implementation issues, findings and recommendations of the project are well documented in chapter 5. For completeness, a recap of some of the key points is presented as follow: The management structure, ownership options and cost model for GARNET are given prominence. The Danish NREN system which defines five levels of semi-autonomous management structure could be used by GARNET. The ownership option that would be ideal for GARNET is either the leasing of fiber cable or lobbying the Government of Ghana to allocate a pair of fiber on both the VRA backbone and the New National backbone for research and educational purposes. The last mile solutions to the network could be fully owned by the core institutions by building portions of their backbone that connect them to the national backbone. In the case of secondary schools and some of the smaller research institutions leasing capacities or allowing network operators to carry their traffic to the research and educational network backbone will be a better option. The research and educational institutions have to identify sources of funding for the implementation of the project. The initial cost of setting up the backbone could be financed by the Government of Ghana as the institutions contribute to the operational cost of the network. It is believed that, the key findings and recommendations of the report will serve as a key reference point for the future implementation of NREN in Ghana. The traffic model and simulation results in the form of traffic demand and projection for Ghana is a major break through in this thesis work.
84
References
1. (Arijs, 2000), Planning of WDM Ring Networks, Photonic Network Communications, 2:1, 33-51, 2000
2. (Dwivedi, 2000), Traffic model for USA long-distance optical network. OFC 2000, Baltimore, March 2000, pp. 156-158
3. (El-Bawab, 2003), Evolution to optical-switching-based core networks, Optical Networks magazine Vol.4 Issue.2. pp 7-19, 2003.
4. (Esmailzadeh, 2006), Broadband Wireless Communications Business: An introduction to the Cost and Benefits of New Technologies; 2006, John Wiley & Sons Ltd.
5. (Gast., 2005), 802.11 Weireless networks : The Definitive Guide; 2nd Edition, O'Reilly Networking, 2005
6. (Hülsermann, 2004), A Set of Typical Transport Network Scenarios for Network Modelling. In 5th ITG Workshop on Photonic Networks, 2004.
7. (Kartalopoulos, 2002), Surviving a Disaster, IEEE communications Magazine, 2002, 40 (7) , p. 124-126.
8. (Kartalopoulos, 2002), Elastic Bandwidth, IEEE Circuits and Devices Magazine, vol. 18, no. 1, pp. 8-13, Jan 2002
9. (Liesbeth, 2005), Dimensioning of an European backbone network in OPNET WDM Guru, OPNETwork 2005, Washington (2005)
10. (Maesschalck, 2003), Pan-European Optical Transport Networks: An availability-based Comparison, Photonic Network Communications Volume 5, Number 3 / May, 2003, pp 203-225
11. (Pareek, 2006), WiMAX: Taking Wireless to the MAX; Auerbach Publishers Inc., 384 pages, 2006.
12. (Ramaswami, 2000) , Optical Networks: A Practical Perspective ,2nd edition; The Morgan Kaufmann Series in Networking
13. (Sexton, 1997), Broadband Networking- ATM SDH and SONET, Artech House Publishers, Boston-London.
14. (Sinclair, 1994)., Eletronics Letters, Sep. 1, 1994, Vol 30, No. 18, pp. 1468-1470 15. (Tan, 2006), Wifi and WiMAX- Complements and/or Substitutes? , CICT Conference
2006. 16. (Verbrugge, 2006), Methodology and input availability parameters for calculating
OpEx and CapEx costs for realistic network scenarios, Journal. Optical Network. 5, 509-520 (2006).
17. (Verbrugge, 2005), Modeling operational expenditures for telecom operators, Conference on Optical Network Design and Modeling, 2005, p. 455-466.
18. (Wood, 2006), Next-generation Network Services, Cisco Press, Indianapolis. 19. (Zhu , 2003), A review of traffic grooming in WDM optical networks: architecturs
and challenges, Optical Networks Magazine, Vol. 4, Issue 2, pp. 55-64, March/April 2003.

85
Acronyms and Abbreviations AAU Association of African Universities ATM Asynchronous Transfer Mode CapEx Capital Expenditure CSIR Center for Scientific and Industrial Research DCL Digital Client Layer FidoNet Store and Forward Electronic Mail System GAEC Ghana Atomic Energy Commission GARNET Ghana Academic and Research Network GNCIC Ghana National Committee on Internet Connectivity HF High Frequency ICT Information and Communication Technology IDRC International Development Research Centre IDU Indoor Unit ILL/DD Inter-Lending and Document Delivery ITU International Telecommunication Union KNUST Kwame Nkrumah University of Science and Technology, Kumasi MIS Management Information System MMF Multimode Fiber MTBF Mean Time between Failures MTTR Mean Time to Repair NCTE National Council for Tertiary Education NOC Network Operation Center NREN National Research and Education Network OCH Optical Channel Layer ODU Outdoor Unit OpEx Operational Expenditure SAT-3 Under Sea Fiber Optic Cable SDH Synchronous Digital Hierarchy SMF Single Mode Fiber SONET Synchronous Optical Network UCC University of Cape Coast UDS University for Development Studies, Tamale UEW University of Education, Winneba UG University of Ghana, Legon UMaT University of Mines and technology UNDP United Nations Development Programme VCG Vice-Chancellors� Ghana VHF Very High Frequency VRA Volta river Authority VSAT A Very Small Aperture Terminal WDM Wavelength Division Multiplexing WLAN Wireless Local Area Network

86
List of Figures Figure 1 : Map of Ghana.................................................................................................................... 7 Figure 2: Telecommunication Subscribers in Ghana........................................................................... 9 Figure 3: A sketch of VRA Fiber Optics Backbone in southern Ghana ............................................ 10 Figure 4: A sketch of Ghana Telecom Kumasi Intra City Ring ........................................................ 12 Figure 5: Accra Intra-City Backbone (Source Ghana Telecom 2006) ............................................... 12 Figure 6 : VRA- Ghana Telecom WDM/SDH Network ................................................................... 13 Figure 7 : KNUST Campus-Wide Backbone (Source: KNUST NOC).............................................. 16 Figure 8: KNUST Wireless Backbone (Source: KNUST NOC) ....................................................... 17 Figure 9: University of Ghana Backbone ........................................................................................ 18 Figure 10: University of Winneba Wireless Backbone ..................................................................... 19 Figure 11: University of Cape Coast Backbone................................................................................ 21 Figure 12: CSIR Wide Area Network .............................................................................................. 24 Figure 13: Optical Fiber................................................................................................................... 26 Figure 14: Single Mode and Multimode Light Propagation .............................................................. 27 Figure 15: Measurements of SMF and MMF Core and Cladding...................................................... 27 Figure 16: A Sample of a MMF Loose Tube Cable ......................................................................... 28 Figure 17: An Armored Fiber Optic Cable ....................................................................................... 28 Figure 18: A cross section of OPGW Cable ..................................................................................... 29 Figure 19 : Attenuation Effects on Single Mode Fiber. (SEEFIRE, D1.2)........................................ 29 Figure 20: CD for G.652 fiber. (SEEFIRE, D1.2)........................................................................... 30 Figure 21: A sketch of an ADM....................................................................................................... 34 Figure 22: Multiple wavelengths on a single fiber (Kartalopoulos, 2002) ......................................... 35 Figure 23: Wavelength regions ........................................................................................................ 35 Figure 24: Optical Line Terminal..................................................................................................... 37 Figure 25: Optical Add and Drop Architecture................................................................................. 37 Figure 26: Classification of OXCs by their Switching Matrix .......................................................... 39 Figure 28: 1+1 APS Figure 29: 1:1 APS ................................ 41 Figure 30: 1:N Automatic Protection Switching ............................................................................. 42 Figure 31: Unidirectional Self Healing Rings................................................................................... 42 Figure 32: OCh-DPRing.................................................................................................................. 43 Figure 33: Types of Networks.......................................................................................................... 46 Figure 35 : A VSAT Antenna .......................................................................................................... 49 Figure 36: Ghana Map showing major cities and towns.................................................................... 50 Figure 37: A sketch of VRA Fiber Optics Backbone in southern Ghana .......................................... 51 Figure 38: New National Fiber-Optics Backbone ............................................................................. 52 Figure 39: Total volume of different Traffic Growth........................................................................ 56 Figure 40: Percentage growth of traffic............................................................................................ 56 Figure 41: Forecast % each component contributes ......................................................................... 57 Figure 42: Volume of Educational Traffic in Gbps........................................................................... 58 Figure 43 : Graphical representation of voice traffic matrix.............................................................. 58 Figure 44: WDM Layers.................................................................................................................. 61 Figure 45: Educational Backbone on Existing VRA Network........................................................... 62 Figure 46: Network Cost and AELT ................................................................................................ 62 Figure 47: Average Availability of Entire Traffic matrix................................................................. 63 Figure 48: Educational Backbone on New National Network ........................................................... 65 Figure 49: Network Cost and AELT on New Backbone ................................................................... 66 Figure 50: Research and Education Network in Ghana (Tadayoni, 2001) ......................................... 68 Figure 51: Parameters affecting NREN Transport Network evolution .............................................. 70 Figure 52: Network Hierarchy ......................................................................................................... 71 Figure 53 : Management and Administrative Structure for GARNET............................................... 72 Figure 54: Network design phases .................................................................................................. 76

87
List of Tables Table 1: Summary of Operators and Service Providers as at January 2006 ......................................... 8 Table 2: Termination Nodes ............................................................................................................ 10 Table 3: List of CSIR Institution in Ghana ....................................................................................... 23 Table 4: Comparison of SONET and SDH Signals.......................................................................... 33 Table 5: CWDM and DWDM Comparison (SEEFIRE, D1.2) .......................................................... 36 Table 6: Location of NREN Nodes in each region............................................................................ 52 Table 7: Traffic estimation for Ghana .............................................................................................. 54 Table 8: Traffic Volumes for Ghana in Gbps (2005) ........................................................................ 55 Table 9: K-Values and Traffic growth estimation............................................................................. 56 Table 10: K-Values and Traffic growth in educational institutions ................................................... 57 Table 12: Revised Traffic matrix (integer values) ............................................................................ 60 Table 13: Summary results for GARNET on VRA backbone ........................................................... 62 Table 14: Summary results - GARNET on New National Backbone ................................................ 65 Table 15: Point-to-Point Cost from National Backbone.................................................................... 75

88
Appendix
Appendix A: Computation of Volume of Traffic based on Table 7 a) Voice traffic: 22.11 E+06 users * (2 Mbps / 20 users) * 14 min/12h = 22.11 / 10 * 14/(12*60) Tbps = 22.11 * 14 / (10*12*60) Tbps = 309.54 / 7200 Tbps = 42.99 Gbps By multiplying by a security factor of 5 gives 214.96Gbps b) Trans traffic: 2.655 E+06 users * (2 Mbps / 20 users) * 5 min/9h = 2.655 / 10 * 5/(9*60) Tbps = 2.655 * 5 / (10*9*60) Tbps = 13.28 / 5400 Tbps = 0.0246 Tpbs = 2.46 Gpbs By multiplying by a security factor of 5 yields 12.32Gbps c) Internet traffic: 4.013+E05 users * (2 Mbps / 20 users) * 25 min/12h = 4.013 / 10*25(12*60) Tbps = 0.001389Tbps =1.39 Gbps By multiplying by a security factor of 5 gives 6.94Gbps
Appendix B: Volume of Traffic in Mbps between regional nodes
Volume of Traffic in Mbps
between Cities
City Region
Population Kumasi SunyaniCape Coast Koforidua Accra Tamale Bolga Wa Ho
Kumasi 3.6 Sunyani 1.79 111.8 Cape Coast
1.59 58.9 19.2
Koforidua 2.10 84.7 26.1 39.7 Accra 2.90 87.4 31.5 69.0 173.5 Tamale 1.80 38.3 21.2 11.1 18.7 22.4 Bolgatanga 0.92 13.2 7.3 4.3 6.8 8.4 19.9 Wa 0.58 9.9 6.3 3.0 4.4 8.9 5.6 5.0 Ho 1.63 47.2 17.0 19.0 64.6 68.9 15.9 5.7 3.5 Takoradi 1.92 63.8 22.7 92.5 34.9 55.6 12.5 4.9 3.5 18.6
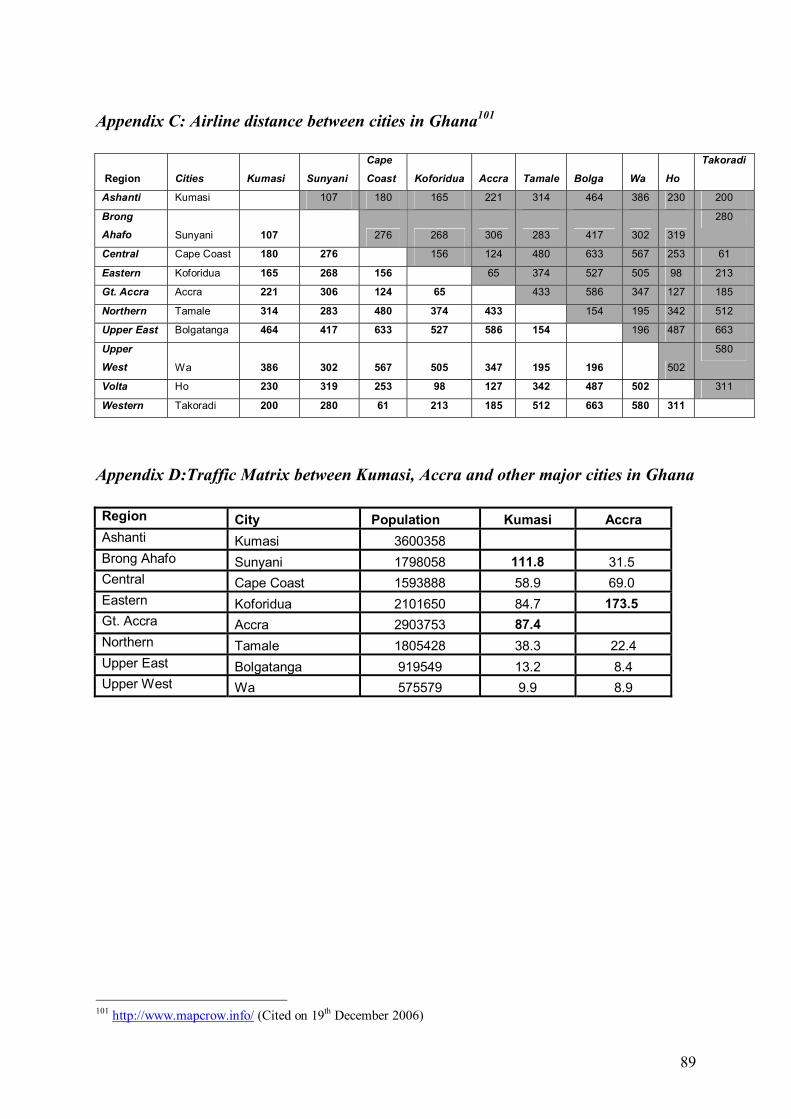
89
Appendix C: Airline distance between cities in Ghana101
Region Cities Kumasi Sunyani
Cape
Coast Koforidua Accra Tamale Bolga Wa Ho
Takoradi
Ashanti Kumasi 107 180 165 221 314 464 386 230 200
Brong
Ahafo Sunyani 107 276 268 306 283 417 302 319
280
Central Cape Coast 180 276 156 124 480 633 567 253 61
Eastern Koforidua 165 268 156 65 374 527 505 98 213
Gt. Accra Accra 221 306 124 65 433 586 347 127 185
Northern Tamale 314 283 480 374 433 154 195 342 512
Upper East Bolgatanga 464 417 633 527 586 154 196 487 663
Upper
West Wa 386 302 567 505 347 195 196 502
580
Volta Ho 230 319 253 98 127 342 487 502 311
Western Takoradi 200 280 61 213 185 512 663 580 311
Appendix D:Traffic Matrix between Kumasi, Accra and other major cities in Ghana Region City Population Kumasi Accra Ashanti Kumasi 3600358 Brong Ahafo Sunyani 1798058 111.8 31.5 Central Cape Coast 1593888 58.9 69.0 Eastern Koforidua 2101650 84.7 173.5 Gt. Accra Accra 2903753 87.4 Northern Tamale 1805428 38.3 22.4 Upper East Bolgatanga 919549 13.2 8.4 Upper West Wa 575579 9.9 8.9
101 http://www.mapcrow.info/ (Cited on 19th December 2006)

90
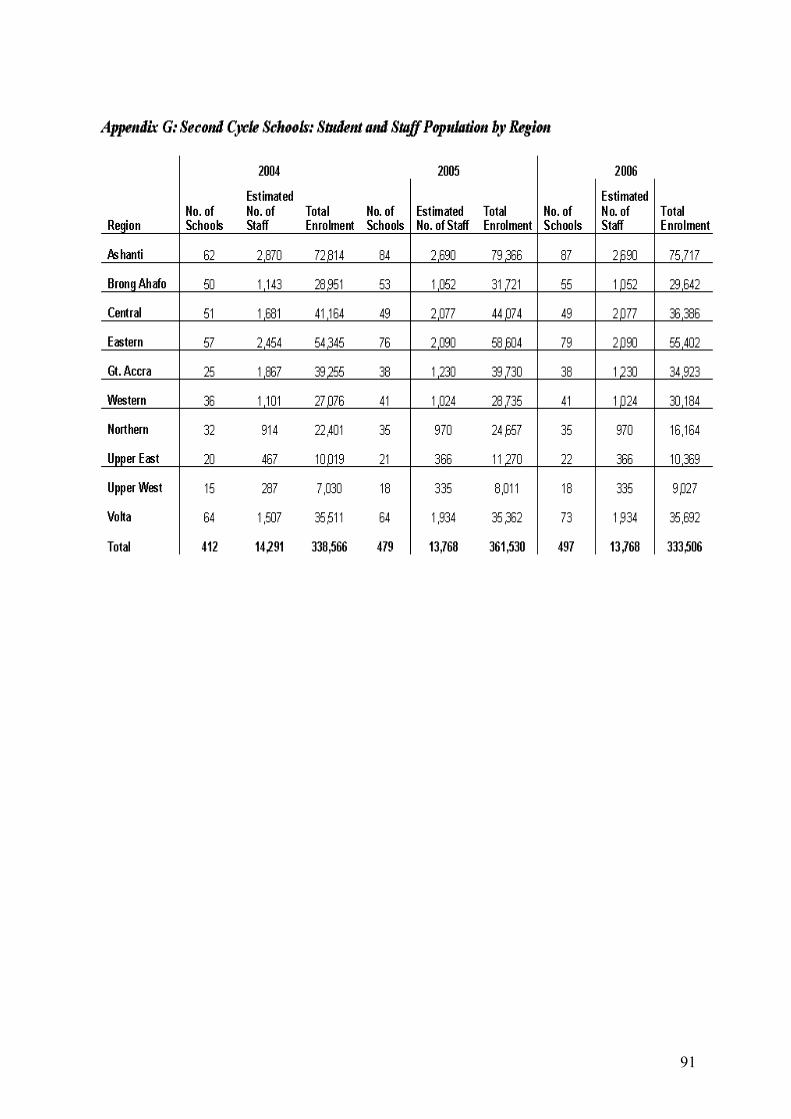
91

92
Appendix H: 1+1 protection path on New Backbone
Kumasi- Tamale Cape Coast- Tamale
Kumasi-Legon Akosombo-Ho