Technical Marketing Engineer
35
WHAT'S NEW IN ZABBIX 6.0 LTS Artūrs Lontons Technical Marketing Engineer
Transcript of Technical Marketing Engineer

WHAT'S NEW IN ZABBIX 6.0 LTS
Artūrs Lontons
Technical Marketing Engineer
2
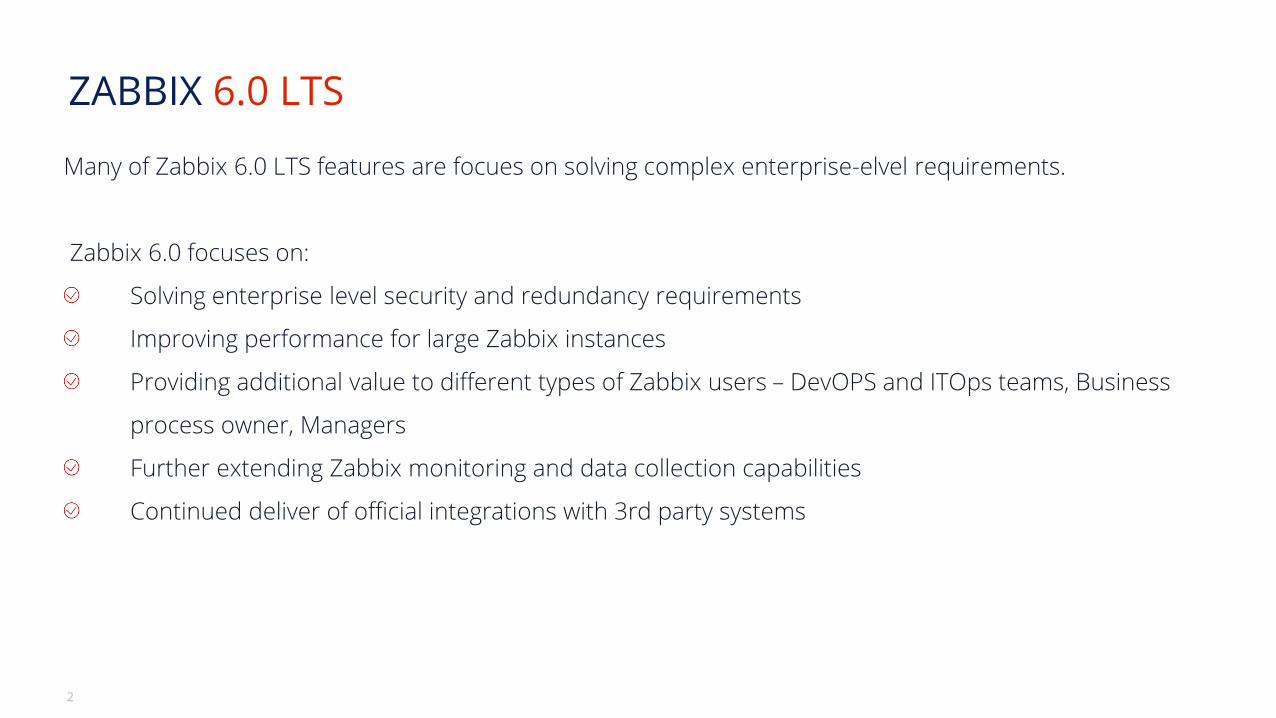
ZABBIX 6.0 LTS
Many of Zabbix 6.0 LTS features are focues on solving complex enterprise-elvel requirements.
Zabbix 6.0 focuses on:
Solving enterprise level security and redundancy requirements
Improving performance for large Zabbix instances
Providing additional value to different types of Zabbix users – DevOPS and ITOps teams, Business
process owner, Managers
Further extending Zabbix monitoring and data collection capabilities
Continued deliver of official integrations with 3rd party systems

ZABBIX SERVER HIGH AVAILABILITY CLUSTER
01
4
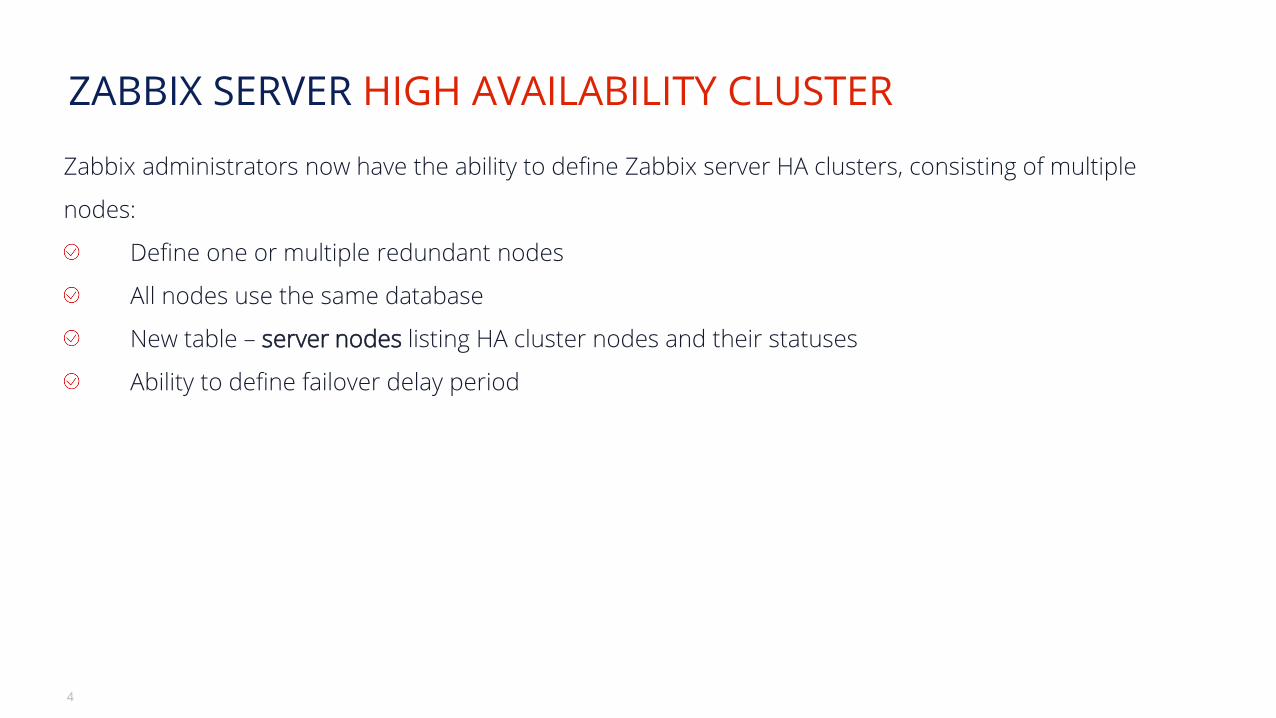
ZABBIX SERVER HIGH AVAILABILITY CLUSTER
Zabbix administrators now have the ability to define Zabbix server HA clusters, consisting of multiple
nodes:
Define one or multiple redundant nodes
All nodes use the same database
New table – server nodes listing HA cluster nodes and their statuses
Ability to define failover delay period
5
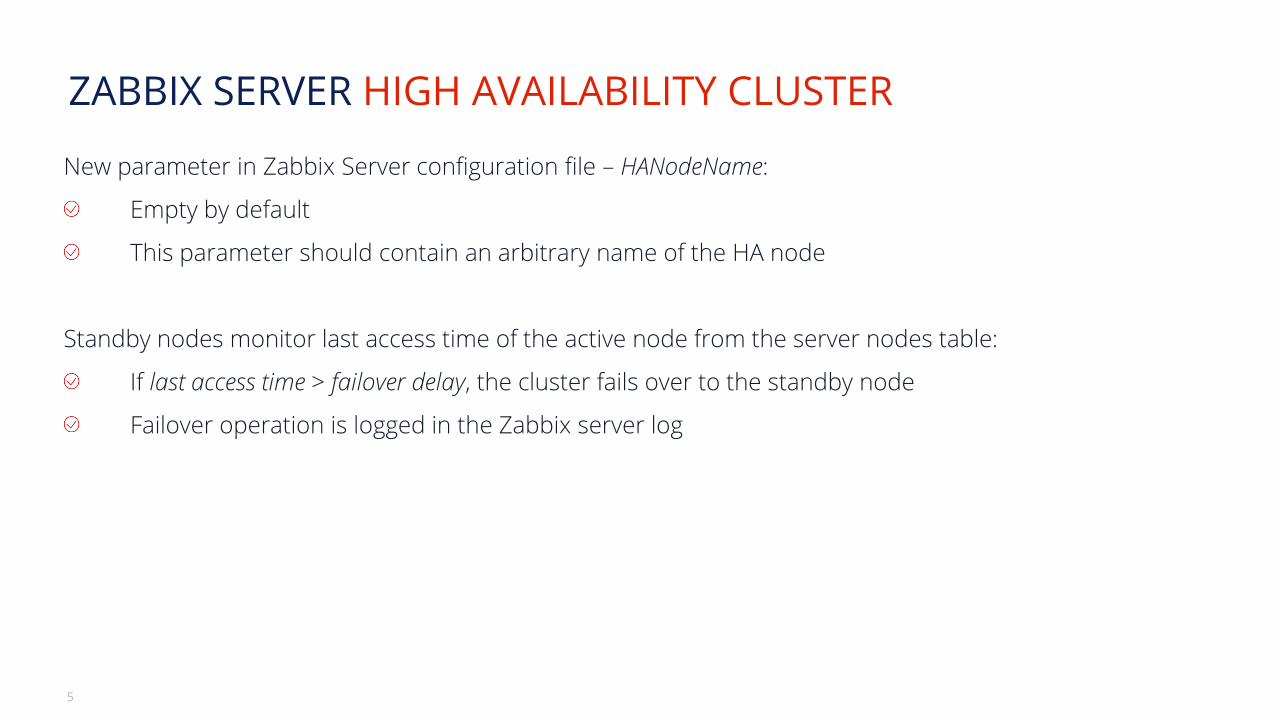
ZABBIX SERVER HIGH AVAILABILITY CLUSTER
New parameter in Zabbix Server configuration file – HANodeName:
Empty by default
This parameter should contain an arbitrary name of the HA node
Standby nodes monitor last access time of the active node from the server nodes table:
If last access time > failover delay, the cluster fails over to the standby node
Failover operation is logged in the Zabbix server log
6
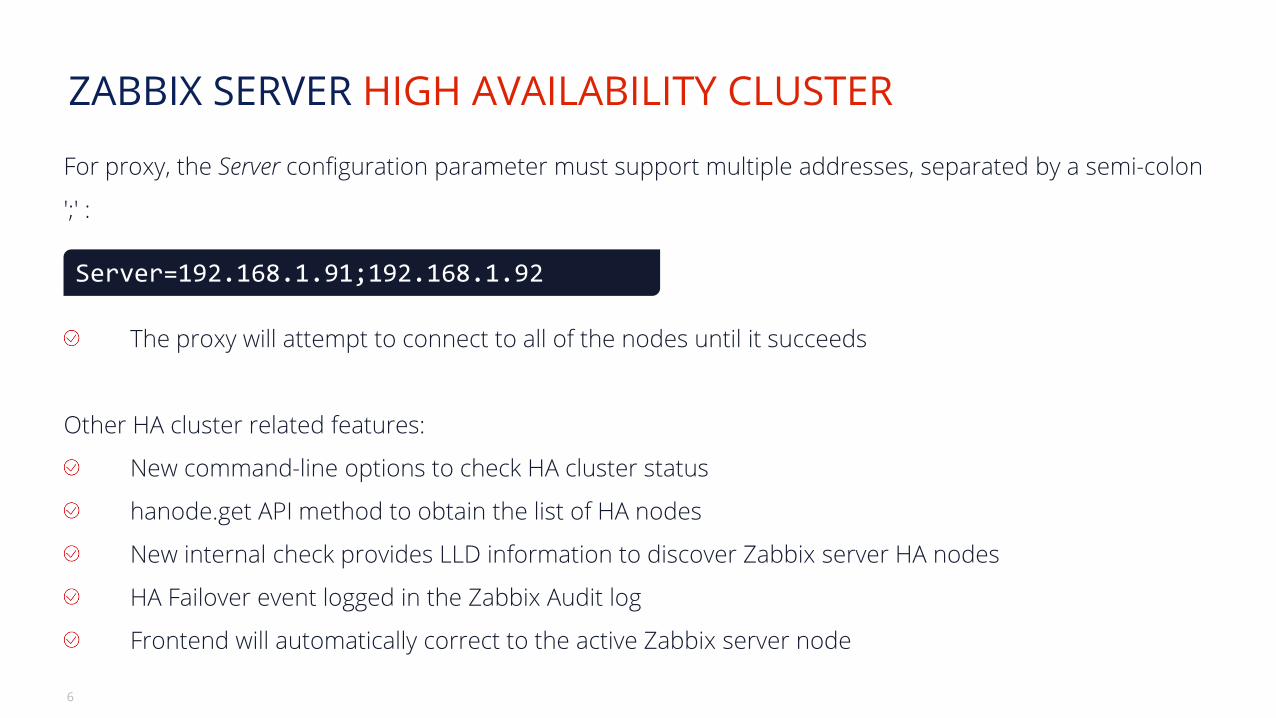
ZABBIX SERVER HIGH AVAILABILITY CLUSTER
For proxy, the Server configuration parameter must support multiple addresses, separated by a semi-colon
';' :
The proxy will attempt to connect to all of the nodes until it succeeds
Other HA cluster related features:
New command-line options to check HA cluster status
hanode.get API method to obtain the list of HA nodes
New internal check provides LLD information to discover Zabbix server HA nodes
HA Failover event logged in the Zabbix Audit log
Frontend will automatically correct to the active Zabbix server node
Server=192.168.1.91;192.168.1.92
7
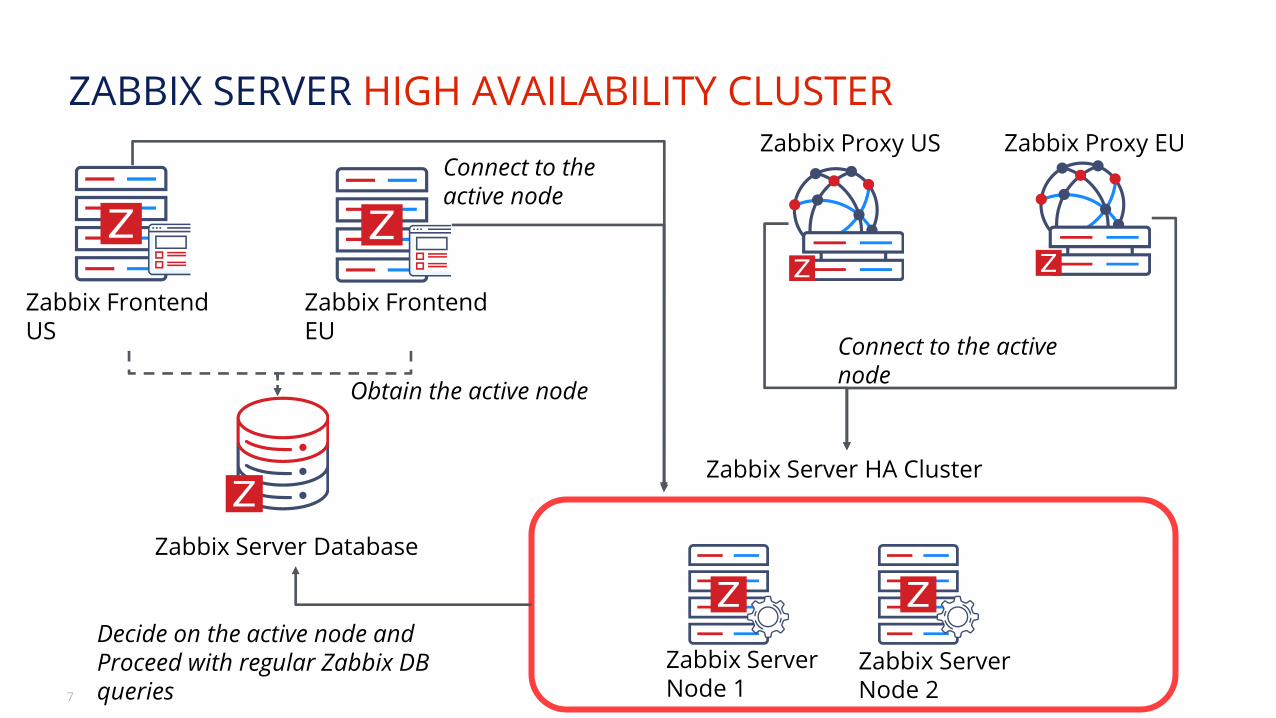
ZABBIX SERVER HIGH AVAILABILITY CLUSTER
Zabbix Server Node 1
Zabbix Server Node 2
Zabbix Server Database
Zabbix Frontend US
Zabbix Frontend EU
Zabbix Proxy US Zabbix Proxy EU
Zabbix Server HA Cluster
Connect to the active node
Obtain the active node
Decide on the active node andProceed with regular Zabbix DB queries
Connect to the active node
8
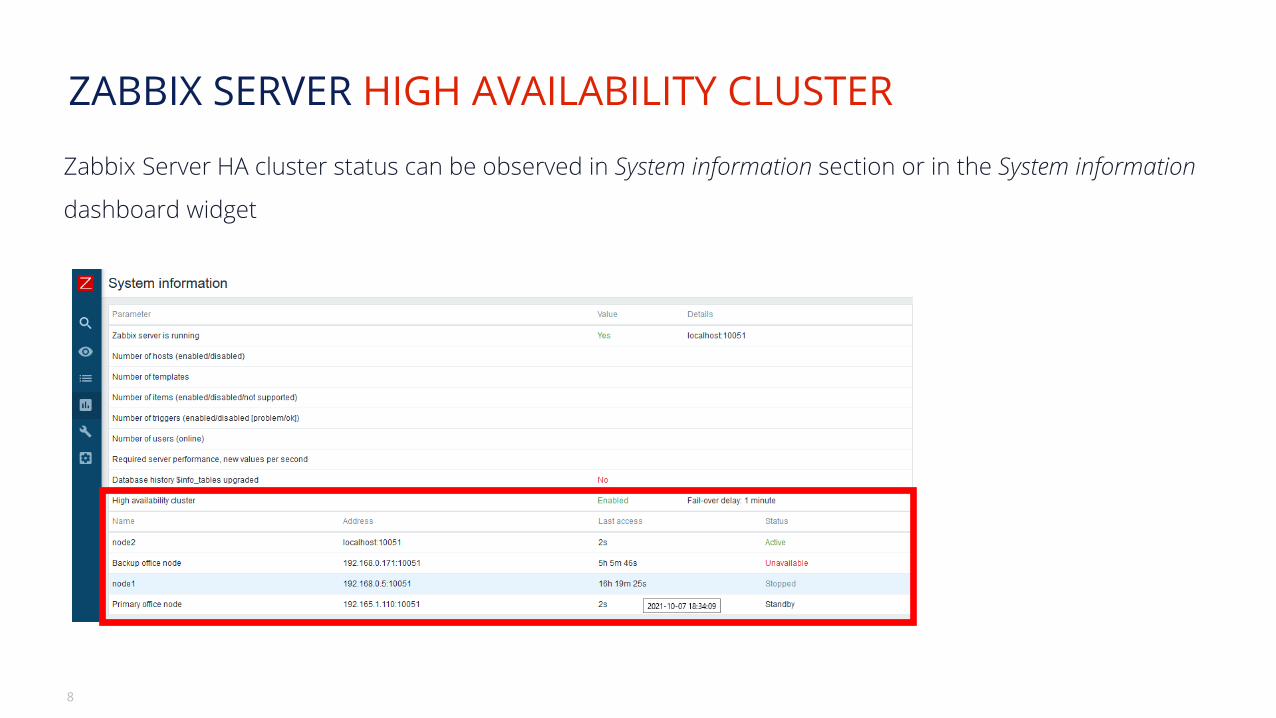
ZABBIX SERVER HIGH AVAILABILITY CLUSTER
Zabbix Server HA cluster status can be observed in System information section or in the System information
dashboard widget

BUSINESS SERVICE MONITORING
02
10
BUSINESS SERVICE MONITORING
Business Service monitoring (BSM) enables Zabbix administrators to define services of varying complexity
and monitor their status
Most common use cases:
Server clusters
Services that utilize load balancing
Services which consist of a complex IT stack
Systems with redundant components in place
Business service monitoring is extremely scalable with support for over 100k services.
11
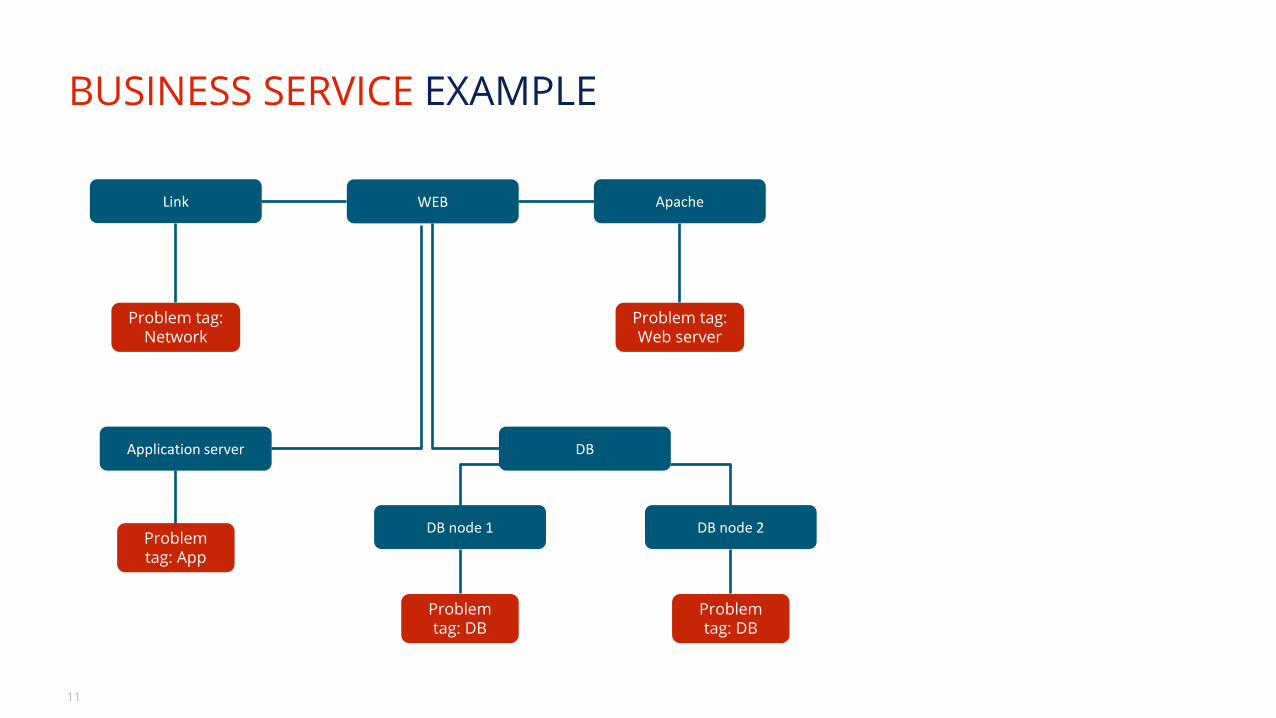
BUSINESS SERVICE EXAMPLE
ApacheLink
DB
DB node 1
Problem tag: Web server
Problem tag: Network
Problem tag: DB
Problem tag: DB
WEB
DB node 2
Application server
Problem tag: App
12
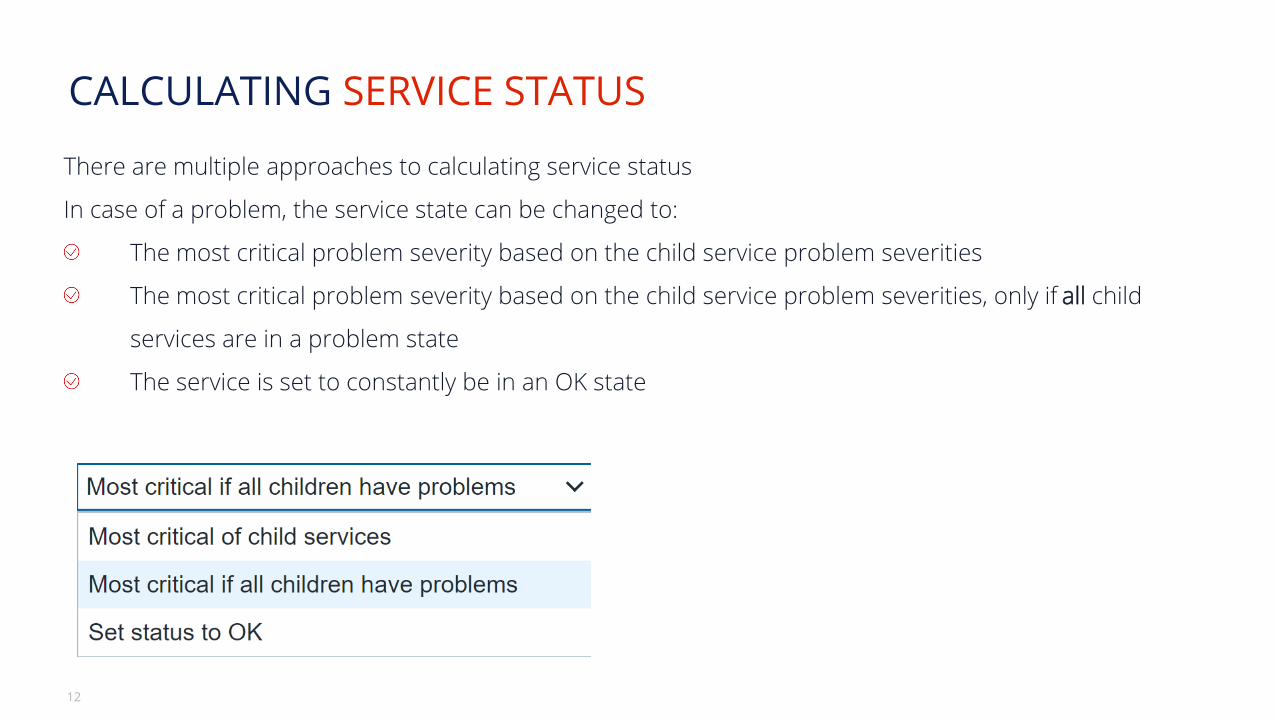
CALCULATING SERVICE STATUS
There are multiple approaches to calculating service status
In case of a problem, the service state can be changed to:
The most critical problem severity based on the child service problem severities
The most critical problem severity based on the child service problem severities, only if all child
services are in a problem state
The service is set to constantly be in an OK state
13
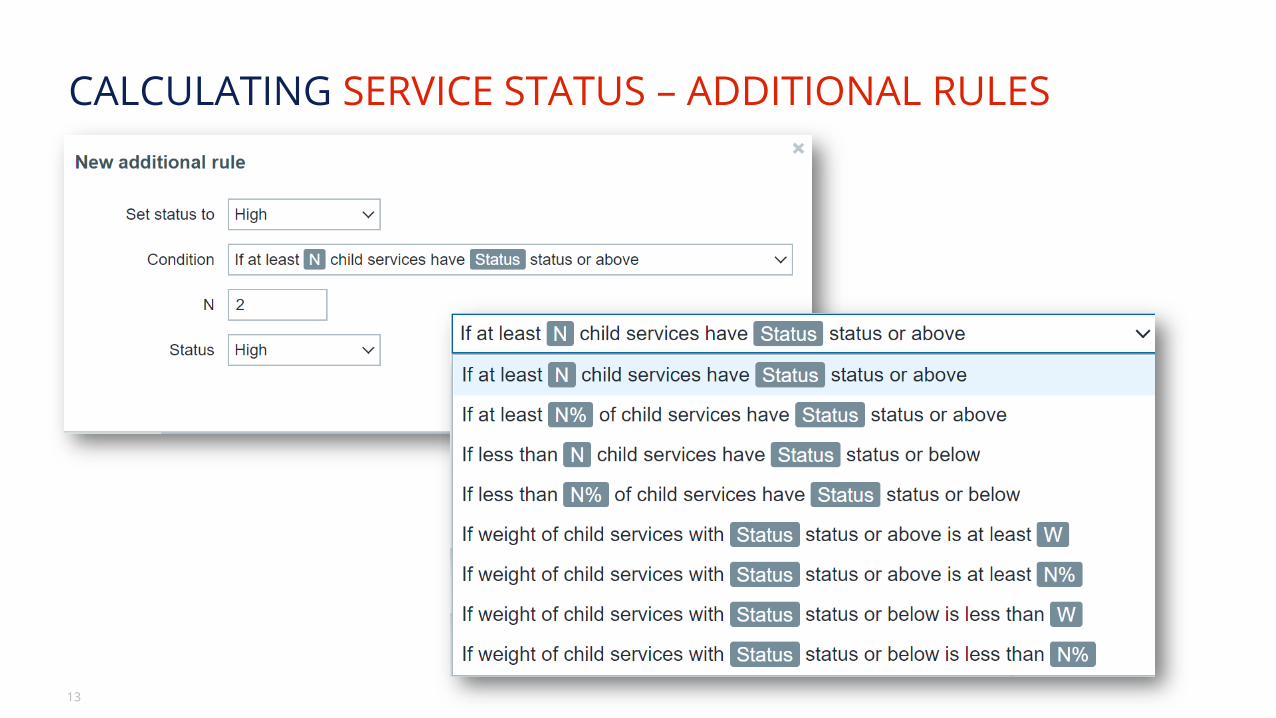
CALCULATING SERVICE STATUS – ADDITIONAL RULES
14
BUSINESS SERVICE MONITORING - NOTES
Many other additional features and improvements:
Ability to define permissions on specific services
SLA monitoring
Business Service root cause analysis
Receive alerts and react on Business Service status change
Define Business Service permissions for multi-tenant environments

NEW AUDIT LOG SCHEMA
03
16
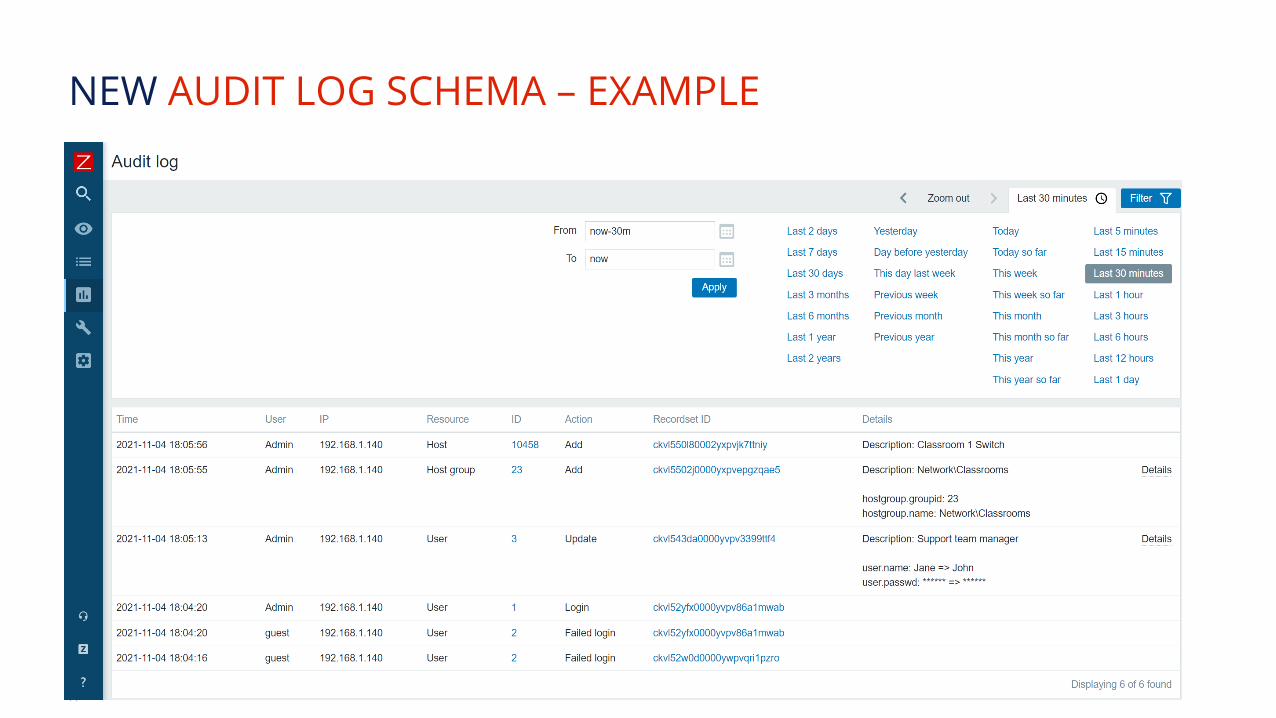
NEW AUDIT LOG SCHEMA – TECHNICAL DETAILS
Many new changes had to be made under the hood when designing the new audit log
Zabbix 6.0 LTS introduces a new database structure for the Audit log
Collision resistant IDs (CUID) will be used for ID generation to prevent audit log row locks
Audit log records will be added in bulk SQL requests
Introducing Recordset ID column. This will help users recognize which changes have been made in a
particular operation
17
NEW AUDIT LOG SCHEMA – EXAMPLE
18
NEW AUDIT LOG SCHEMA
The goal of the Zabbix 6.0 LTS audit log rework is to make a reliable and detailed audit log which would
provide logging for both Frontend and Zabbix server
Detailed logging of both Zabbix frontend and Zabbix server records
Designed with minimal performance impact in mind
Accessible via Zabbix API
Implementing the new audit log schema is an ongoing effort – further improvements will be done
throughout Zabbix update life-cycle

MACHINE LEARNING
04
20
MACHINE LEARNING TRIGGER FUNCTIONS
The new baseline monitoring and anomaly detection trigger functions allow you to avoid static threshold
creation and detect problems in a dynamic manner:
New trigger function - trendbaseline, allows you to detect values outside of the baseline threshold
New trigger function - trendanomalystl, allows you to detect anomalous metric behaviour
Ability to specify anomaly detection seasonality, detection period and more

NEW WAYS TO VISUALIZE YOUR DATA
05
22
NEW DASHBOARD WIDGETS
The new widgets introduced in Zabbix 6.0 grant you many new ways to display information about your
environment:
The data table widget allows you to create a summary view for the related metric status on your
hosts
The top N and bottom N functions of the data table widget allow you to have an overview of your
highest or lowest item values
The single item widget allows you to display values for a single metric
Improvements to the existing vector graphs such as the ability to reference individual items and
more
The SLA report widget displays the current SLA for services filtered by service tags
23
INTRODUCING - GEOMAPS
Now Zabbix users have the ability to see their host location on a geographical map in their dashboard
The host coordinates are provided in the host inventory fields
Filter by host groups and tags
24
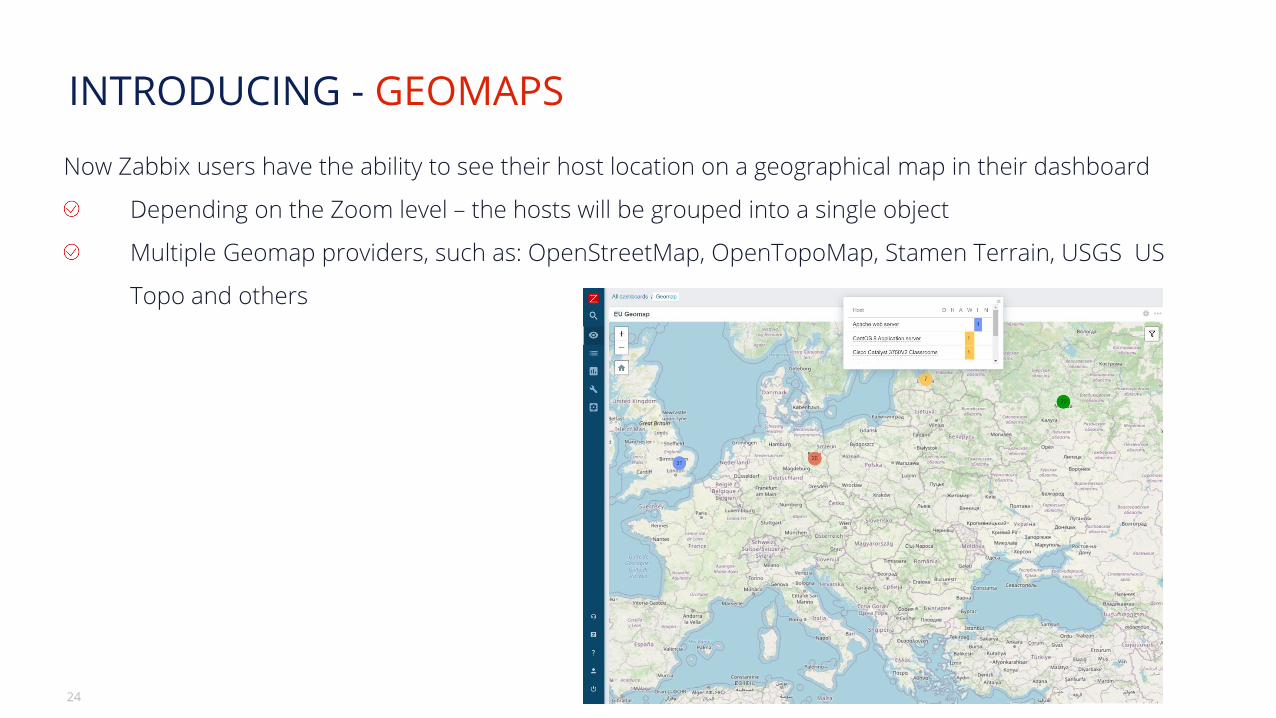
INTRODUCING - GEOMAPS
Now Zabbix users have the ability to see their host location on a geographical map in their dashboard
Depending on the Zoom level – the hosts will be grouped into a single object
Multiple Geomap providers, such as: OpenStreetMap, OpenTopoMap, Stamen Terrain, USGS US
Topo and others

ZABBIX AGENT – IMPROVEMENTS AND NEW ITEMS
06
26
ZABBIX AGENT IMPROVEMENTS AND NEW ITEMS
Multiple new items have been added for both Zabbix Agent And Zabbix Agent2. These items give you the
ability to:
Obtain additional file information such as file owner and file permissions
Collect agent host metadata as a metric
Count matching TCP/UDP sockets
You can now natively monitor your SSL/TLS certificates with a new Zabbix Agent2 item. The item can
be used to validate a TLS/SSL certificate and provide you additional certificate details.
Zabbix Agent2 now supports loading stand-alone plugins without having to recompile the Agent2.

CUSTOM ZABBIX PASSWORD COMPLEXITY REQUIREMENTS
07
28
ZABBIX PASSWORD COMPLEXITY REQUIREMENTS
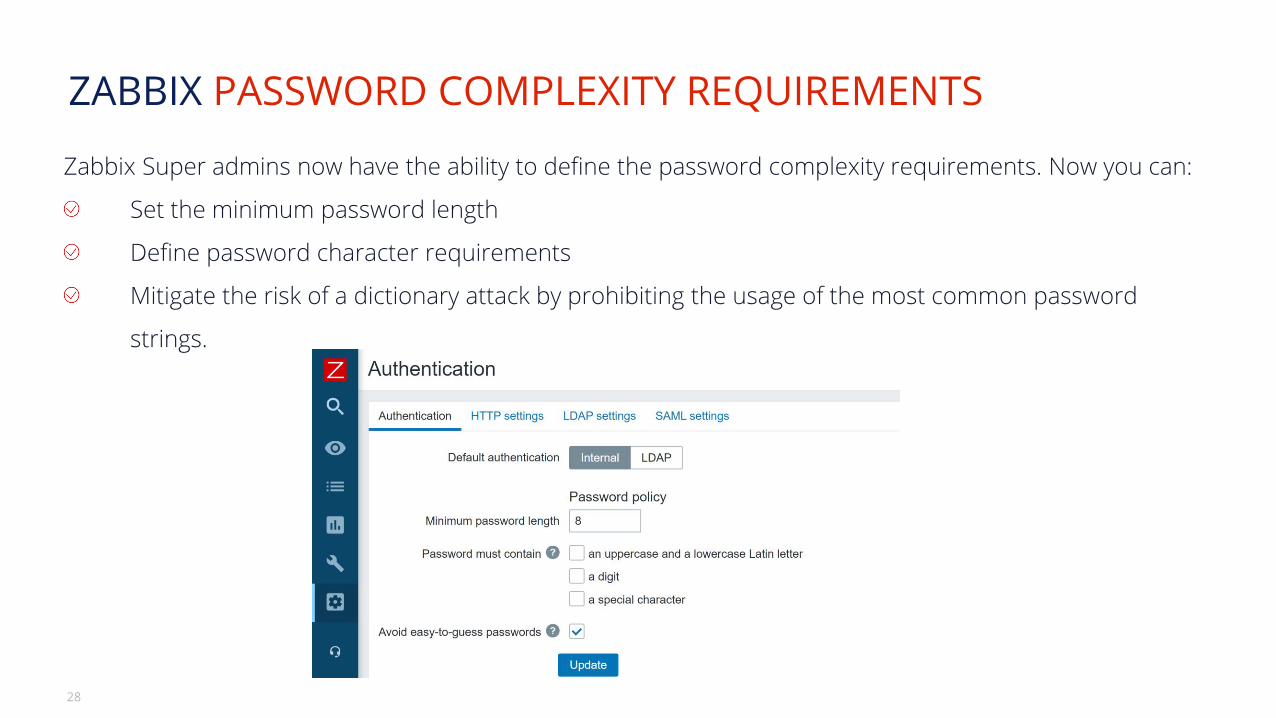
Zabbix Super admins now have the ability to define the password complexity requirements. Now you can:
Set the minimum password length
Define password character requirements
Mitigate the risk of a dictionary attack by prohibiting the usage of the most common password
strings.

UI/UX IMPROVEMENTS
08
30
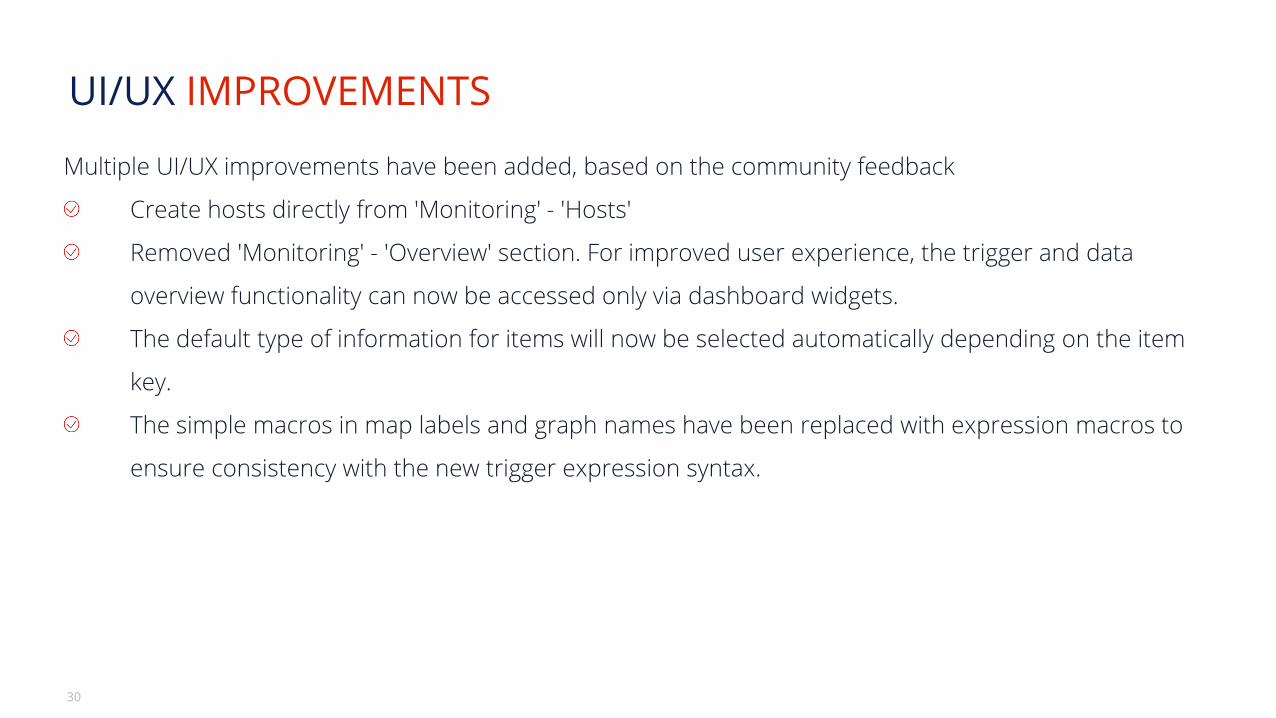
UI/UX IMPROVEMENTS
Multiple UI/UX improvements have been added, based on the community feedback
Create hosts directly from 'Monitoring' - 'Hosts'
Removed 'Monitoring' - 'Overview' section. For improved user experience, the trigger and data
overview functionality can now be accessed only via dashboard widgets.
The default type of information for items will now be selected automatically depending on the item
key.
The simple macros in map labels and graph names have been replaced with expression macros to
ensure consistency with the new trigger expression syntax.

NEW TEMPLATES AND INTEGRATIONS
09
32
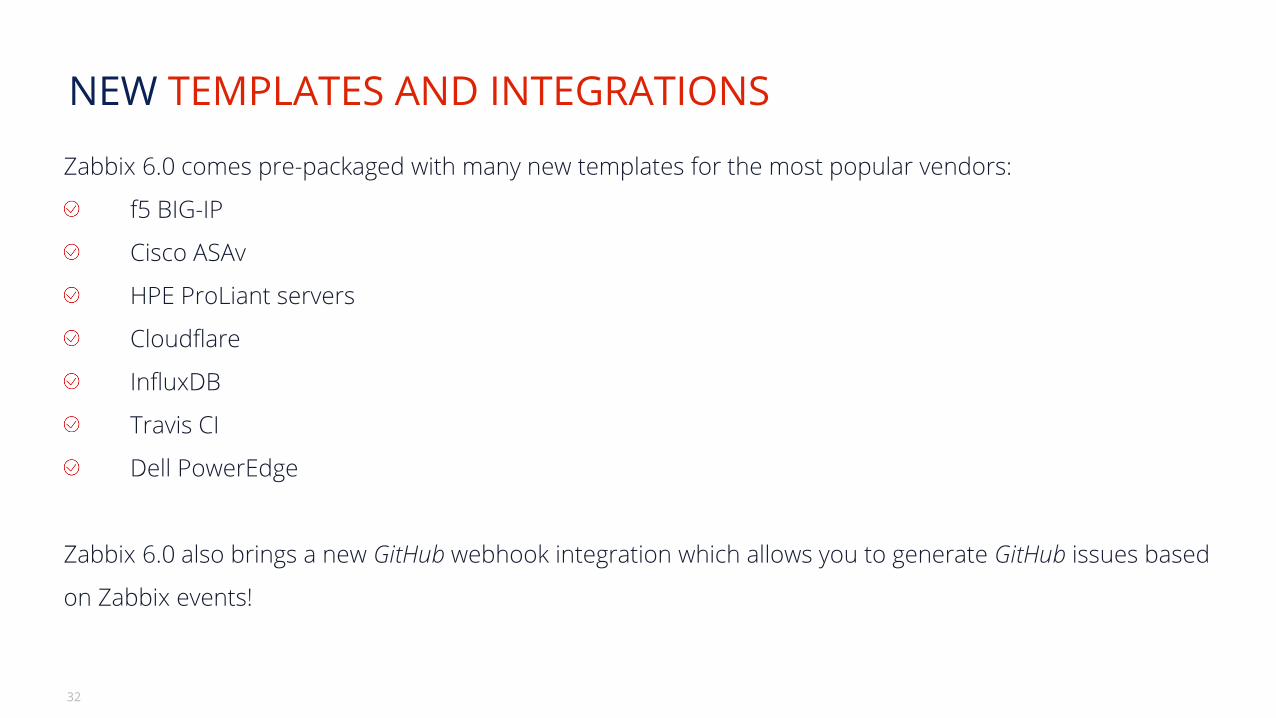
NEW TEMPLATES AND INTEGRATIONS
Zabbix 6.0 comes pre-packaged with many new templates for the most popular vendors:
f5 BIG-IP
Cisco ASAv
HPE ProLiant servers
Cloudflare
InfluxDB
Travis CI
Dell PowerEdge
Zabbix 6.0 also brings a new GitHub webhook integration which allows you to generate GitHub issues based
on Zabbix events!

OTHER CHANGES AND IMPROVEMENTS
10
34
OTHER CHANGES AND IMPROVEMENTS
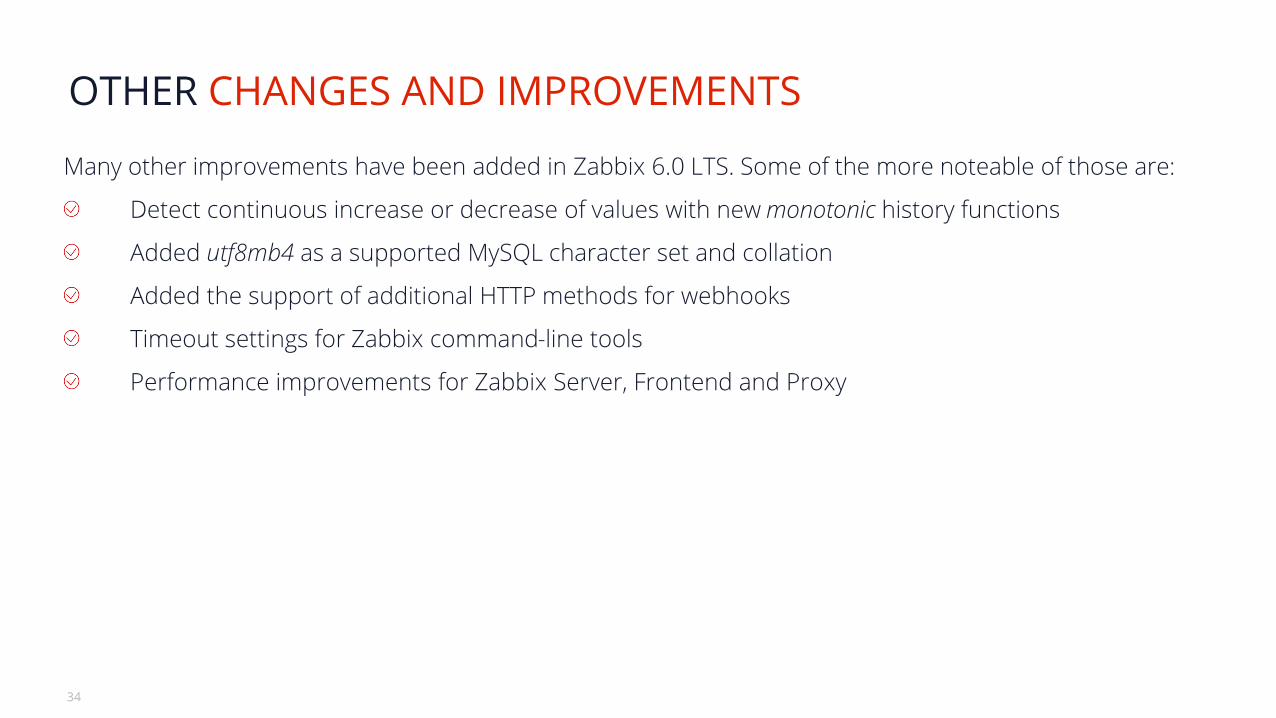
Many other improvements have been added in Zabbix 6.0 LTS. Some of the more noteable of those are:
Detect continuous increase or decrease of values with new monotonic history functions
Added utf8mb4 as a supported MySQL character set and collation
Added the support of additional HTTP methods for webhooks
Timeout settings for Zabbix command-line tools
Performance improvements for Zabbix Server, Frontend and Proxy

Thank you!
www.zabbix.com